1. Introduction
Steel–UHPC composite bridge decks have been widely applied in bridge engineering in recent years [
1,
2,
3,
4,
5]. The UHPC structural layer can significantly improve the overall stiffness of steel bridge decks while ensuring their lightweight and high-strength advantages, thereby effectively improving the fatigue performance of the steel bridge deck [
6,
7]. The total structural performance of the composite components is significantly influenced by the shear connectors that connect the UHPC and steel bridge deck. Tightly joining the two, the head of the shear connector is implanted in the UHPC structural layer and is welded to the top plate of the steel deck, as shown in
Figure 1. There are several types of shear connectors; among them, shear stud connectors are the most commonly used due to their isotropic mechanical properties, high shear and tensile capacities, and convenient welding processes [
8,
9,
10,
11].
To meet anchorage requirements and prevent shear studs from being pulled out, EC4 stipulates that the length-to-diameter ratio of studs (the ratio of stud length to stud diameter) in steel–normal concrete composite structures should be greater than 4.0 [
12]. However, numerous studies have shown that the shear studs embedded in UHPC may not be subject to this restriction due to the ultra-high compressive and tensile strength, as well as the elastic modulus of UHPC, effectively restricting the deformation of shear studs [
13,
14,
15,
16,
17]. Therefore, the aspect ratio of shear studs in UHPC is usually between 2.5 and 4.0 and can be classified as short studs. Previous studies by Shi et al. [
18], Chen et al. [
19], and Huang et al. [
20] conducted fatigue tests of steel–UHPC composite bridge decks using full-scale models, and fatigue failure of short stud connectors was observed in all tests. Therefore, it is necessary to systematically study the fatigue behavior of short stud connectors in UHPC.
There are limited studies [
21,
22,
23,
24] on the fatigue behavior of short stud connectors in UHPC, and all the aspect ratios were larger than 2.0. The fatigue failure mode in the existing studies [
21,
22,
23,
24] was shear stud failure, in which fracture surfaces were between stud shank and base steel, and the UHPC remained generally intact. Cao et al. [
21] conducted four fatigue push-out tests of short studs with an aspect ratio of 2.7 in UHPC. The results showed that the fatigue strength of short studs in UHPC was higher than that of the regular studs in normal concrete. Wei et al. [
22] carried out seven fatigue push-out tests of short studs in UHPC under different load ranges, with an aspect ratio of 3.12. Based on experimental and literature results, a fatigue strength design S–N curve for short studs in UHPC was provided. Huang et al. [
23] established a refined finite element model for fatigue push-out tests of short studs in UHPC, with an aspect ratio of 2.69, and a formula for evaluating the fatigue life of short studs under multiple factors was developed using the fracture mechanics method. Liu et al. [
24] studied the fatigue performance of short studs in engineered cementitious composites (ECCs) through fatigue push-out tests with an aspect ratio of 3.75. The research revealed that the fatigue strength of short studs in ECC was lower than that of regular studs in normal concrete, possibly due to the significantly lower elastic modulus of ECC compared to normal concrete.
Most existing studies on the fatigue performance of short studs in UHPC focus on newly built bridges, while there are several challenges for the reinforcement of aged steel bridge decks using UHPC: (1) to reduce the self-weight of the aged steel bridge decks, thin-layer UHPC is commonly used, with thickness ranging from 40 mm to 60 mm, resulting in shorter stud height; (2) to minimize the impact of welding residual stresses on aged bridge decks, shear studs should be sparsely welded. Therefore, large-diameter studs must be provided to meet the shear connection degree. These necessitate a smaller aspect ratio for short studs used in UHPC reinforcement for aged steel bridges, even below 2.0, and can be classified as ultra-short studs. Research on the fatigue performance of ultra-short studs in UHPC is still lacking.
This study aims to investigate the fatigue behavior of ultra-short studs in UHPC with an aspect ratio of 1.84 and establish prediction formulas for these behaviors. Four fatigue push-out tests under different load ranges were conducted to systematically reveal the fatigue failure modes, fatigue life, and degradation of mechanical behaviors of ultra-short studs in UHPC. Based on experimental and literature results, a fatigue strength design S–N curve for ultra-short studs in UHPC and predictive formulas for plastic slip accumulation and elastic stiffness degradation were established.
2. Fatigue Push-Out Test
2.1. Test Specimens and Fabrication
There were four identical specimens in the fatigue push-out test, as shown in
Figure 2. Each specimen comprised a 400 mm long, 200 mm wide, and 270 mm high H-shaped steel column with a welded steel cover plate, and two 500 mm wide, 400 mm heigh, and 55 mm thick reinforcement UHPC slabs. The UHPC slabs were connected to the steel column by four 35 mm height and 19 mm diameter ultra-short shear stud connectors welded on each side of the 12 mm flange plate of the H-shaped steel column. The aspect ratio of the stud was 1.84. The reinforcement rebars in UHPC were 10 mm in diameter and spaced 100 mm in height and transverse direction, respectively.
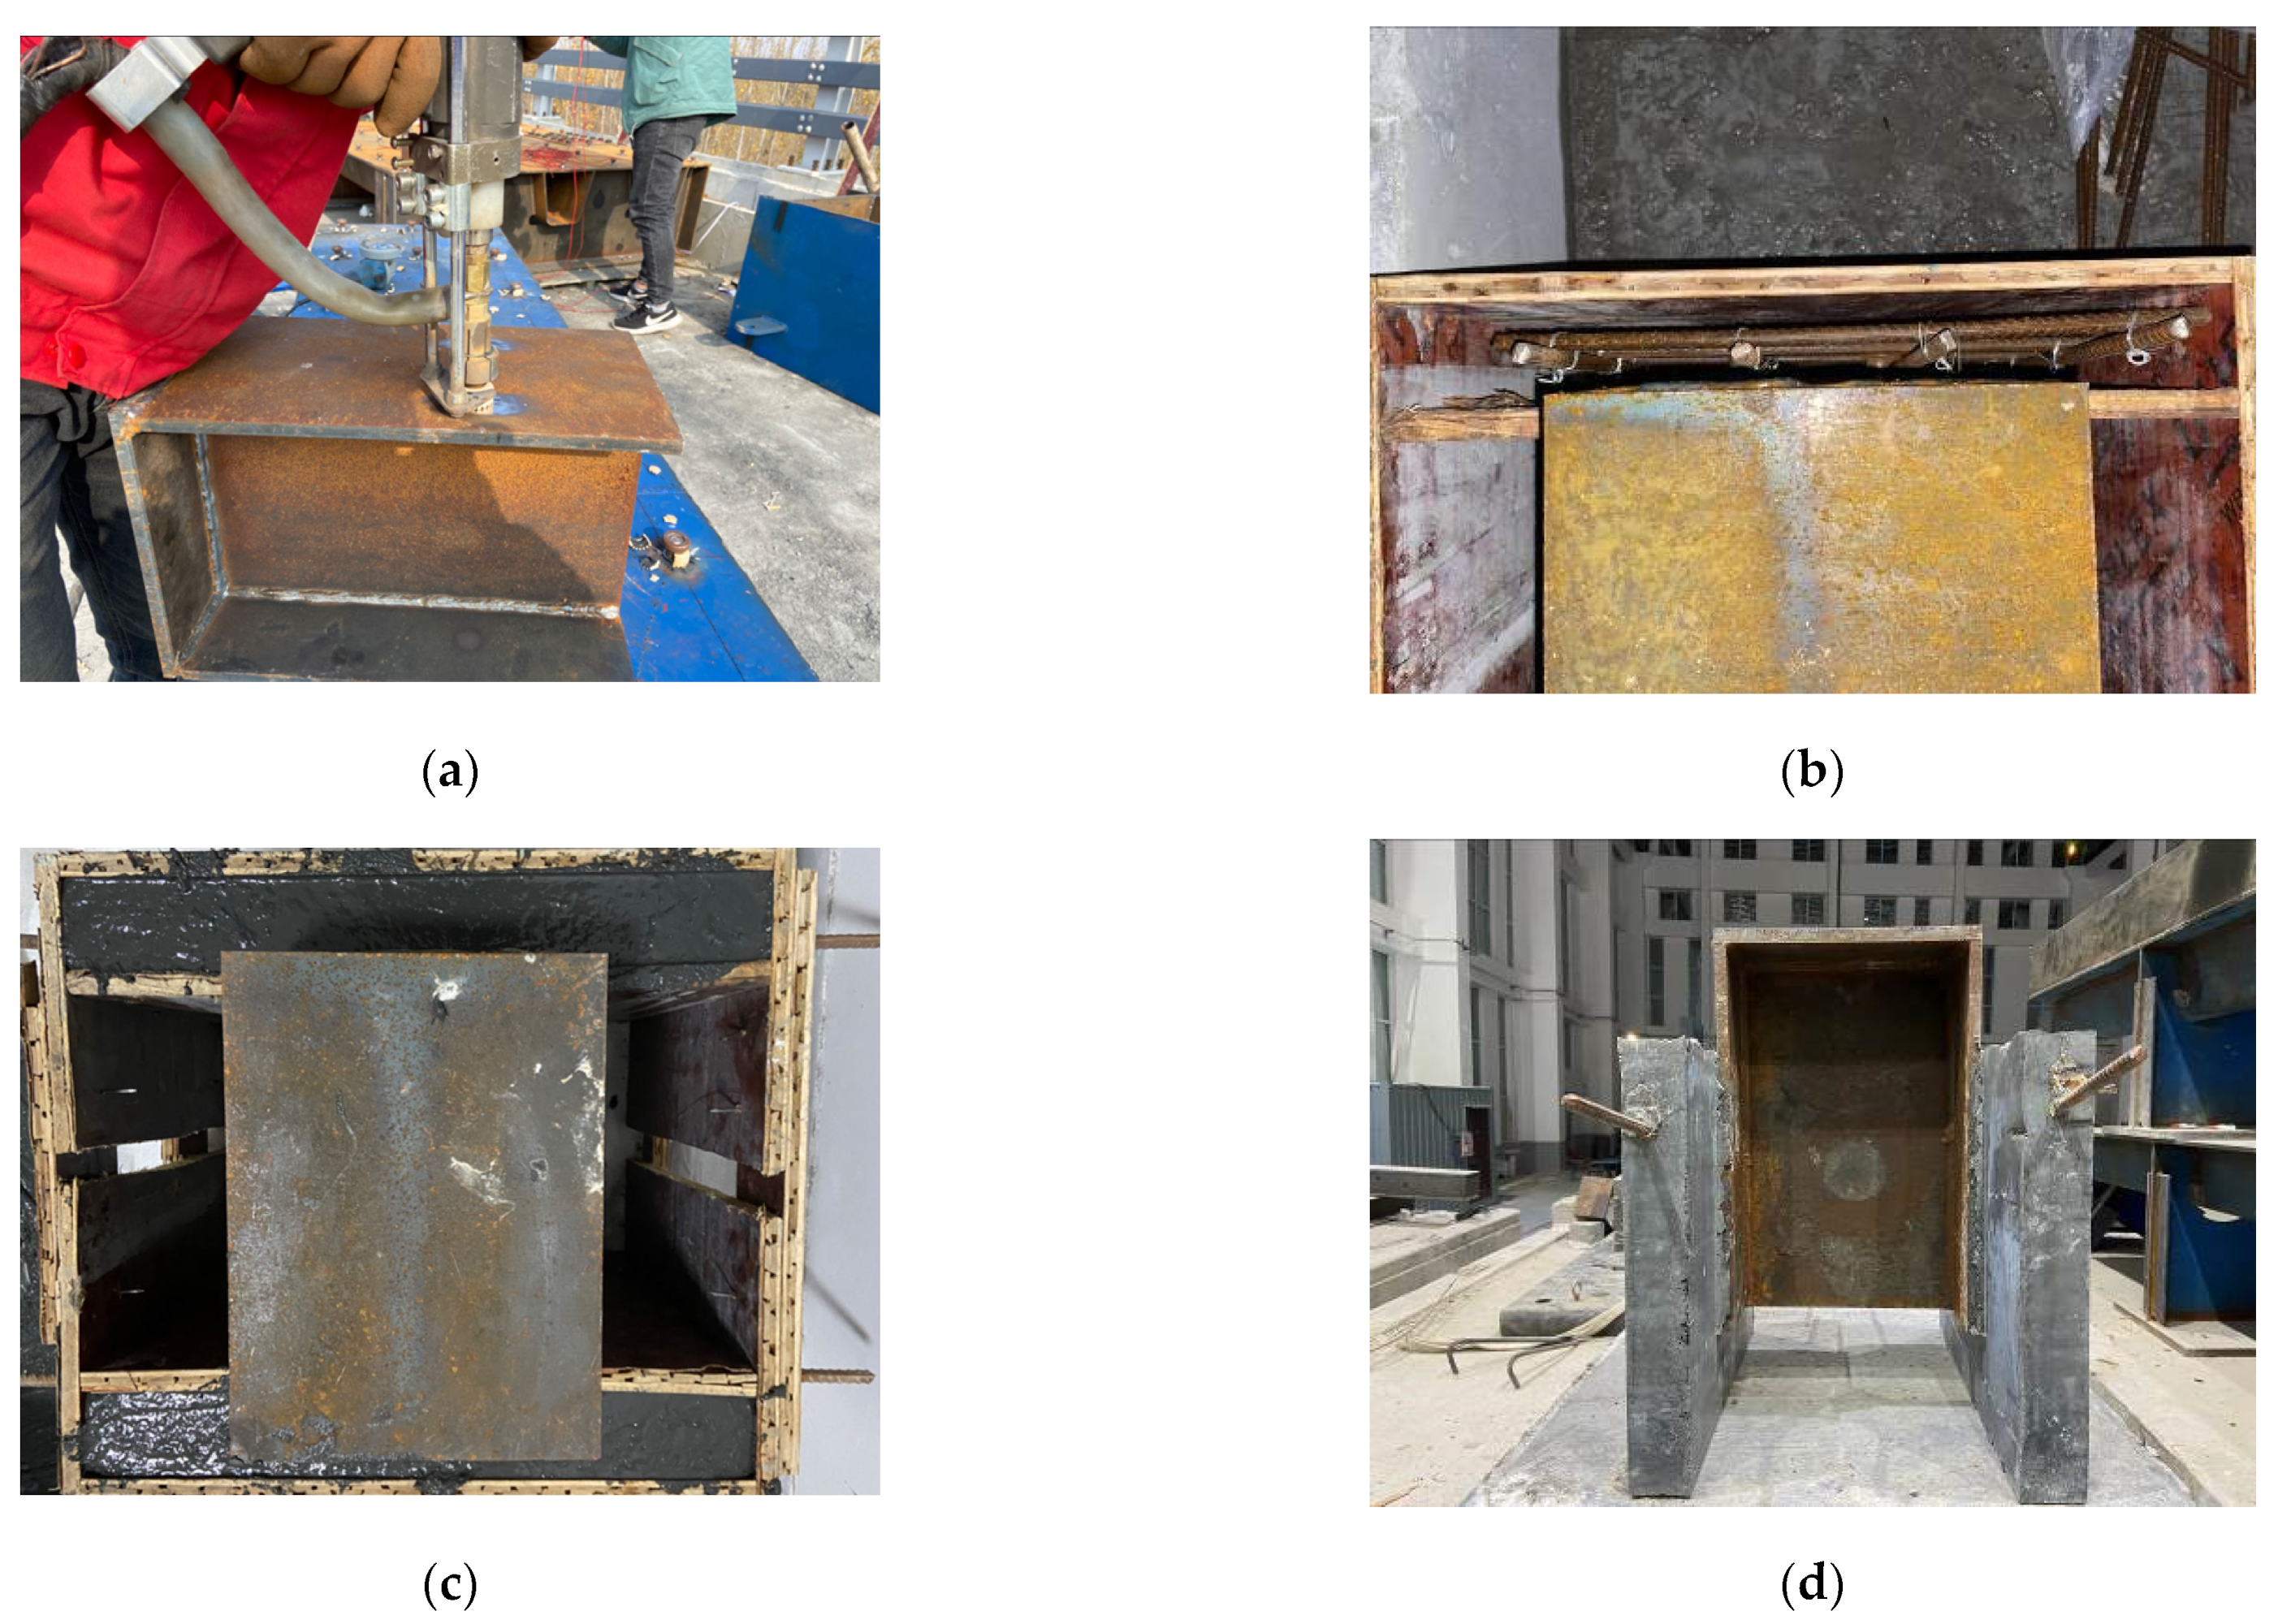
Before pouring UHPC, the steel flange plate was greased to eliminate bonding and reduce friction between the steel and UHPC. The fabrication process of the specimens is shown in
Figure 3 and is as follows: ultra-short stud welding, formwork assembly, reinforcement rebar binding, UHPC pouring, steam curing, and formwork removal after 28 days.
2.2. Material Properties
The mechanical properties of UHPC are listed in
Table 1. Three 100 mm × 100 mm × 100 mm cubic specimens and three 100 mm × 100 mm × 400 mm cuboid specimens were fabricated along with test specimens to evaluate the compressive and flexural strengths of UHPC, respectively. The mix ratio of the UHPC is listed in
Table 2. The H-shaped steel column was made of Q355-grade structural steel. The reinforcement bar was made of HRB400 steel with a yield strength of 400 MPa. The shear stud connectors consisted of ML15 steel. The tensile properties of steel beams, reinforcement bars, and shear studs were provided by the manufacturer, as shown in
Table 3.
2.3. Test Setup and Loading Protocol
The fatigue push-out test setup is shown in
Figure 4. Each specimen was supported on a concrete cushion, and the bottom was poured with high-strength gypsum for leveling and bonding with the concrete cushion block to ensure the stability of the specimen during fatigue loading. Cyclic loading was applied on the specimen using a PMW800-250 electro-hydraulic pulsating fatigue testing machine produced by Jinan Lizhi Testing System Co., Ltd. (Jinan, China) with a load capacity of 500 kN. The cyclic loading was uniformly transmitted to the top surface of the specimen through the steel beam. The constant amplitude fatigue load range (Δ
P =
Pmax −
Pmin) was adopted during tests, and the load ratio
R =
Pmin/
Pmax = 0.20 in accordance with a former study, where Δ
P was the load range, and
Pmax and
Pmin were the upper and lower limits of fatigue load, respectively. The
Pmax did not exceed the elastic capacity of the stud, as the fatigue test was in the elastic stage. The loading frequency was set to be 3 Hz, considering testing machine properties. The UHPC plates on both sides of the H-shaped column were labeled as A and B, and the corresponding embedded studs were labeled as A1, A2, and B1, B2, respectively. Four electronic displacement sensors were arranged evenly on each side of the specimen with an accuracy of 0.001 mm to measure the relative slip between UHPC and the H-shaped column.
Fatigue tests were stopped at certain intervals of fatigue loading cycles to measure the static relative slips between UHPC and the H-shaped column, and the maximum static load was taken as Pmax. The relative slip value was the average value of the four displacement sensors on side A and side B. Sinusoidal wave cyclic loading was adopted in the fatigue tests until specimen fatigue failed to record the load–slip curve and the plastic slip accumulation.
The four specimens were labeled as FT1–FT4 due to different Δ
P. Among them, FT1 was used to test the fatigue life under normal usage status based on IIW [
25]. The IIW defined 90 MPa as the fatigue strength in normal usage status with corresponding 200 × 10
4 fatigue loading cycles. The experimental loading parameters are shown in
Table 3.
The test loading parameters are shown in
Table 4. The
τmax,
τmin, and Δ
τ are calculated as
Pmax/
As,
Pmin/
As, and Δ
P/
As, respectively, and
As denotes the sectional area of the stud shank.
3. Test Results
Before fatigue tests, static push-out tests were conducted using specimens of the same specifications to obtain the static shear strength of the studs, and the average elastic capacity and ultimate shear capacity of a single stud were 87.5 kN and 147.9 kN, respectively. The failure mode of all specimens was ultra-short stud fatigue failure, leading to a unilateral UHPC plate separated from the steel column. It indicated that UHPC can ensure stud fatigue fracture for ultra-short studs even with aspect ratios less than 2.0 and fully utilize the fatigue properties of ultra-short studs.
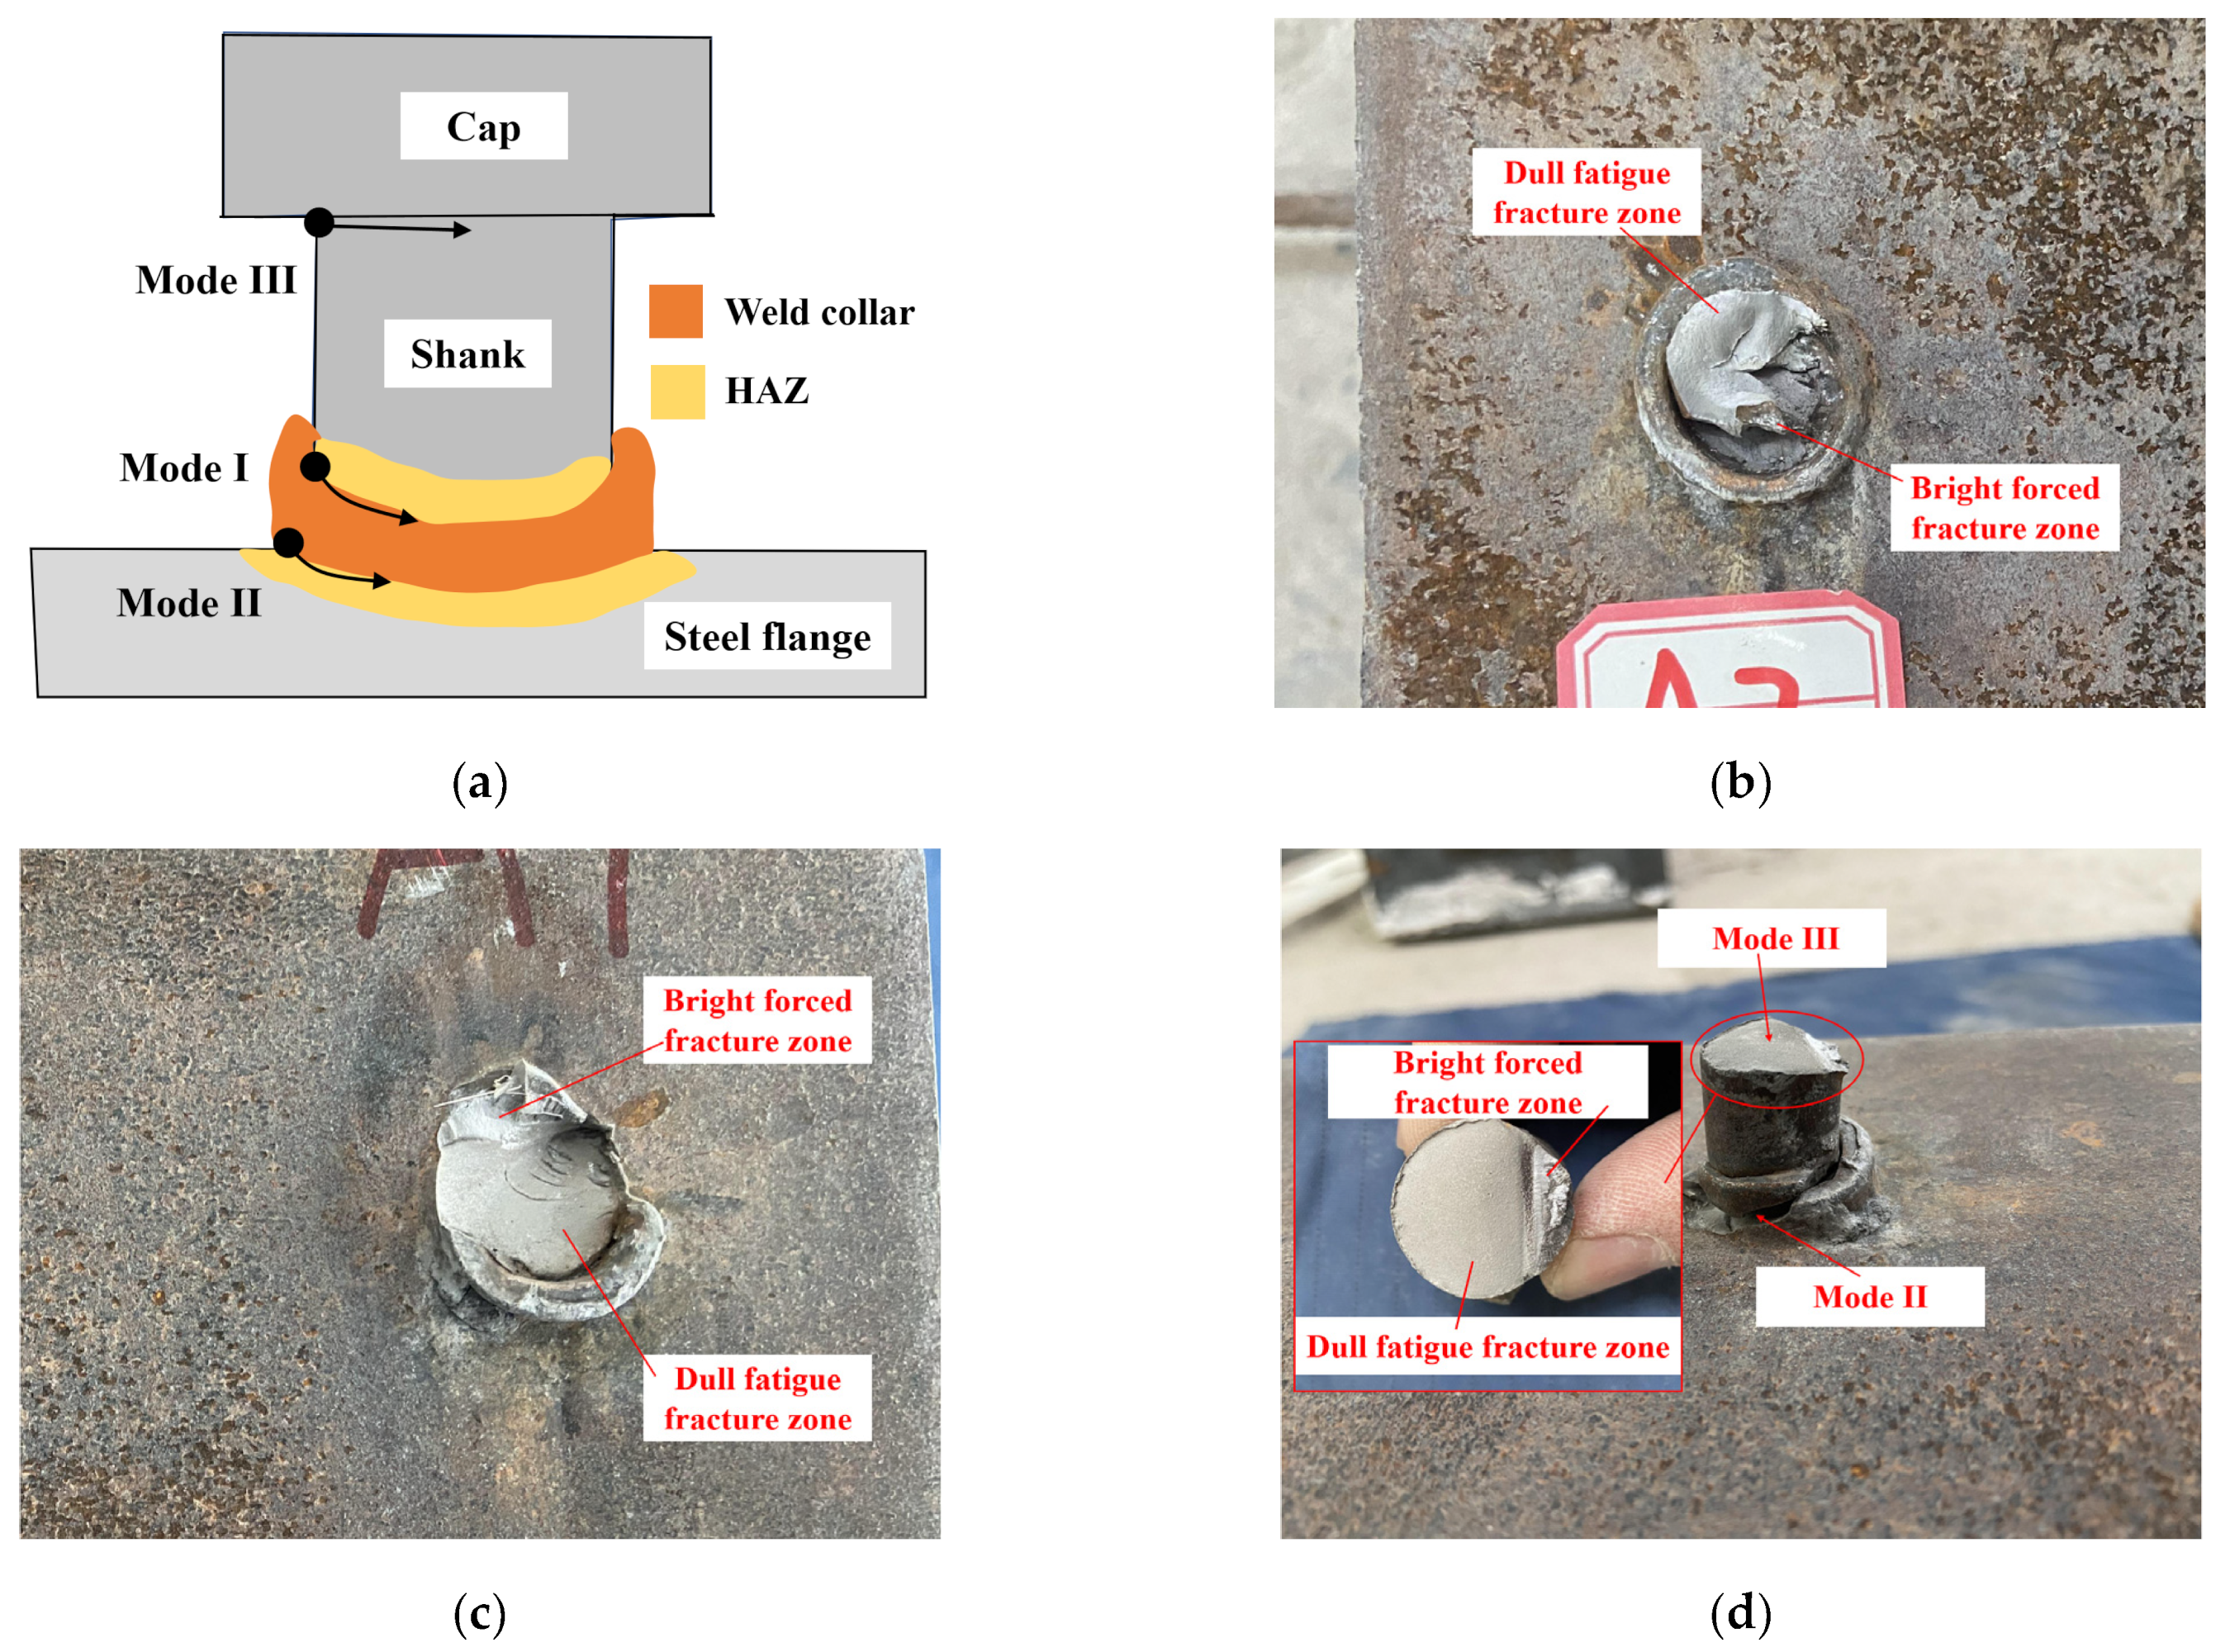
Figure 5 shows the failure modes of the ultra-short studs, with the following three modes:
(1) Mode I: Fracture surface at stud shank. Fatigue cracks initiated at the weld toe of the stud shank-to-weld collar and propagated along the melting line between the weld collar and heat-affected zone (HAZ) in the stud shank.
(2) Mode II: Fracture surface at the steel flange. Fatigue cracks initiated at the weld toe of the weld collar-to-steel flange and propagated along the melting line between the weld collar and HAZ in the steel flange, forming a small concave surface in the steel flange after fatigue failure.
(3) Mode III: Fracture surface at stud cap. Fatigue cracks initiated at the connection between the stud shank and the stud cap and propagated along the interface between the two. Mode III has not been reported in previous studies yet and will only occur together with Mode II and not appear separately.
The fracture surface of the shear stud comprised a dull fatigue fracture zone and a bright forced fracture zone. The dull fatigue fracture zone was caused by the propagation of fatigue cracks, and the bright forced fracture zone was caused by the forced shear fracture. The fatigue cracks first propagated along the cross-section to form a dull fatigue fracture zone. When the dull fatigue fracture zone was large enough, the remaining cross-section was insufficient to bear the fatigue load, and the stud failed instantaneously, forming a bright forced fracture zone.
Figure 5.
Failure modes of ultra-short studs. (a) Stud fracture surfaces. (b) Mode I. (c) Mode II. (d) Mode III.
Figure 5.
Failure modes of ultra-short studs. (a) Stud fracture surfaces. (b) Mode I. (c) Mode II. (d) Mode III.
There were two failure modes of UHPC, as shown in
Figure 6. Mode A: UHPC was intact and locally crushed below the stud. This mode is a common failure mode in the existing literature [
21,
22,
23,
24]. Mode B: UHPC split failure, and the cracks were in a central diffusion shape. In the existing literature, the UHPC failure modes were basically Mode A, while in this study, most of the UHPC cracked. Among all the observable failure sections in UHPC, Mode A only accounted for 25%. The reasons are as follows: The anchoring length of the short studs in UHPC in existing literature is relative longer than those in this study, so only local UHPC beneath the stud root was subjected to fatigue load. However, due to the ultra-low aspect ratio of the studs in this study, the entire UHPC beneath the ultra-short stud was subjected to fatigue loading. As fatigue loading cycles increased, micro-cracks in UHPC continued to propagate, weakening its constraint on the ultra-short stud. So, the deformation of the stud kept increasing, further intensifying the cracking of UHPC. When the remaining cross-section of the stud was insufficient to bear the fatigue load, the stud fractured instantly, and cracks in UHPC quickly connected, ultimately leading to the UHPC splitting.
The failure modes and fatigue life of each specimen are summarized in
Table 5. As is shown, as the shear stress range of the stud increased from 88.2 MPa to 158.8 MPa, the fatigue life,
N (loading cycles), decreased from 1287.3 × 10
4 to 24.4 × 10
4.
4. Nominal Shear Fatigue Strength (S–N Curve)
Currently, the shear fatigue strength evaluation of studs in concrete mainly adopts the S–N curve of nominal shear stress range (Δ
τ) versus fatigue life (
N), with log(Δ
τ) as the independent variable and log(
N) as the dependent variable, as shown in Equation (1):
where
m and log
C represent the slope and linear regression constant of the S–N curve, respectively.
Table 6 lists the fatigue test results from existing literature [
21,
22,
26,
27] and from this study, totaling 17 samples, which are plotted as coordinate points on the S–N curve, as shown in
Figure 7. The shear stud connectors in this literature also consisted of ML15 steel and were consistent with this study.
Linear regression analysis was conducted based on the test results using the method specified in IIW [
25]. The slope of the average regression curve, denoted as
m, was calculated as 7.3, taking log(Δ
τ) as the independent variable and log(
N) as the dependent variable. That was close to the specified value of 8.0 in EC3 [
28]. To align with EC3 and relevant literature calculation methods, the slope of the S–N curve was set to 8.0 during curve regression analysis. The mean regression curve was obtained as follows, as shown in Equation (2):
By adopting the 95% survival probability curve specified in EC3 and setting the slope of the S–N curve to 8.0, the mean
μlogC and standard deviation
σlogC of log
C can be calculated using Equations (3) and (4), respectively:
where
n represents the number of specimens, and log
Ci represents the linear regression constant corresponding to each data point.
Substituting the experimental data from this study and the literature into Equations (3) and (4), respectively, we obtained μlogC = 22.835 and σlogC = 0.17.
By using Equations (5) and (6), the characteristic value log
Ck corresponding to a 95% survival probability can be calculated as follows:
where
k represents the characteristic coefficient [
29].
In this section,
k was calculated as 2.04 by substituting
n (
n = 17) into Equation (6). Then, the fatigue constant for a 95% survival probability, log
Ck, was calculated as 22.483 by substituting
k into Equation (5). Finally, the S–N fitting curve with a 95% survival probability was obtained, as shown in Equation (7):
Figure 7 also presents the 95% and 50% (
k = 0) survival rate S–N curve obtained based on Equation (7), and the S–N curve specified by EC3 for shear studs in normal concrete, as shown in Equation (8).
Table 6.
Fatigue test results in the existing literature and this study.
Table 6.
Fatigue test results in the existing literature and this study.
| Literatures | Specimen | Short Stud (mm) | UHPC Strength (MPa) | Experimental Results |
|---|
| h × d | h/d | Δτ (MPa) | N (104) |
|---|
| Cao et al. [21]—① | FAT-1 | 35 × 13 | 2.69 | 135.9 | 94 | 1178.7 |
| FAT-2 | 117 | 113.0 |
| FAT-3 | 125 | 168.8 |
| FAT-4 | 135 | 44.1 |
| Wei et al. [22]—② | FT-1 | 50 × 16 | 3.13 | 120.3 | 170 | 8.7 |
| FT-2 | 160 | 24.7 |
| FT-3 | 150 | 16.3 |
| FT-4 | 140 | 96.0 |
| FT-5 | 130 | 64.0 |
| FT-6 | 120 | 230.0 |
| FT-7 | 110 | 236.0 |
| Li et al. [26]—③ | B-3 | 35 × 13 | 2.69 | 85.3 | 145 | 60.0 |
| Zhang et al. [27]—④ | F-1 | 35 × 13 | 2.69 | 150.2 | 112 | 240.5 |
| This study—⑤ | FT-1 | 35 × 19 | 1.84 | 134.0 | 88.2 | 1287.3 |
| FT-2 | 105.9 | 389.7 |
| FT-3 | 132.3 | 58.2 |
| FT-4 | 158.8 | 24.4 |
From
Figure 7, it can be observed that the fatigue strength of the shear stud under 200 million cycles is 116 MPa, 105 MPa, and 90 MPa for 50%, 95% survival probabilities, and the EC3 specified curve, respectively. The fitting curve for a 95% survival probability is also significantly higher than the curve specified by EC3. The S–N curve specified by EC3 is applicable for shear studs in normal concrete. This indicates that the fatigue strength of shear studs in UHPC is significantly better than that in normal concrete. As there are no specific regulations governing the fatigue strength of short studs in UHPC, it is recommended to utilize Equation (7) for the fatigue design of short studs in the UHPC composite bridge deck. It is demonstrated that Equation (7) can ensure safety and fully leverage the superior fatigue properties of short studs in UHPC.
Figure 7.
S–N curves of shear studs.
Figure 7.
S–N curves of shear studs.
5. Calculation Model for Stiffness Degradation of Short Studs in UHPC
5.1. Fatigue Load–Slip Curves
Figure 8 illustrates the typical evolution of the load–slip curves of short studs after loading cycles
n. It can be seen that with the increase in fatigue loading cycles, the degradation of its mechanical performance can be described by the cumulative plastic slip,
δpl,n and the degradation of elastic stiffness,
Kel,n.
Figure 9 shows the static load–slip curves of each specimen throughout the entire fatigue life cycle. The load–slip curve comprised loading and unloading segments. The slip values were the average of four displacement sensors on side A and side B. It can be observed in
Figure 9 that the relative slips increased approximately linearly with the increase in load during the initial loading stage. Although the unloading curve exhibits some nonlinear characteristics, there was no residual slip after unloading. With the fatigue loading cycles increasing, the relative slips showed more pronounced nonlinear features. The slope of the loading curve continuously decreased with loading cycles increasing, and plastic slip accumulated continuously, indicating a gradual decrease in the elastic stiffness of the studs. In the later loading stages, the slip values after unloading cannot return to the initial point, and plastic slip continued to increase with loading cycles increasing until the specimens’ fatigue failure. At this stage, the area enclosed by the loading and unloading curves significantly increased, indicating a significant increase in the deformation energy produced during one loading cycle. It can also be observed that, with a higher shear stress range, the nonlinear behavior was exhibited earlier and the plastic slip accumulated more rapidly, leading to a faster decrease in elastic stiffness.
Figure 10 illustrates the evolution of plastic slip with the number of loading cycles for each specimen. During the initial loading stage, plastic slip increased rapidly due to debonding between the steel flange and UHPC, as well as the elimination of non-elastic deformations. Subsequently, plastic slip steadily increased at a constant rate, indicating that fatigue loading continuously damaged the studs. In the later stage, plastic slip increases rapidly with fatigue loading cycles increasing, ultimately leading to fatigue failure.
5.2. Stiffness Degradation Model
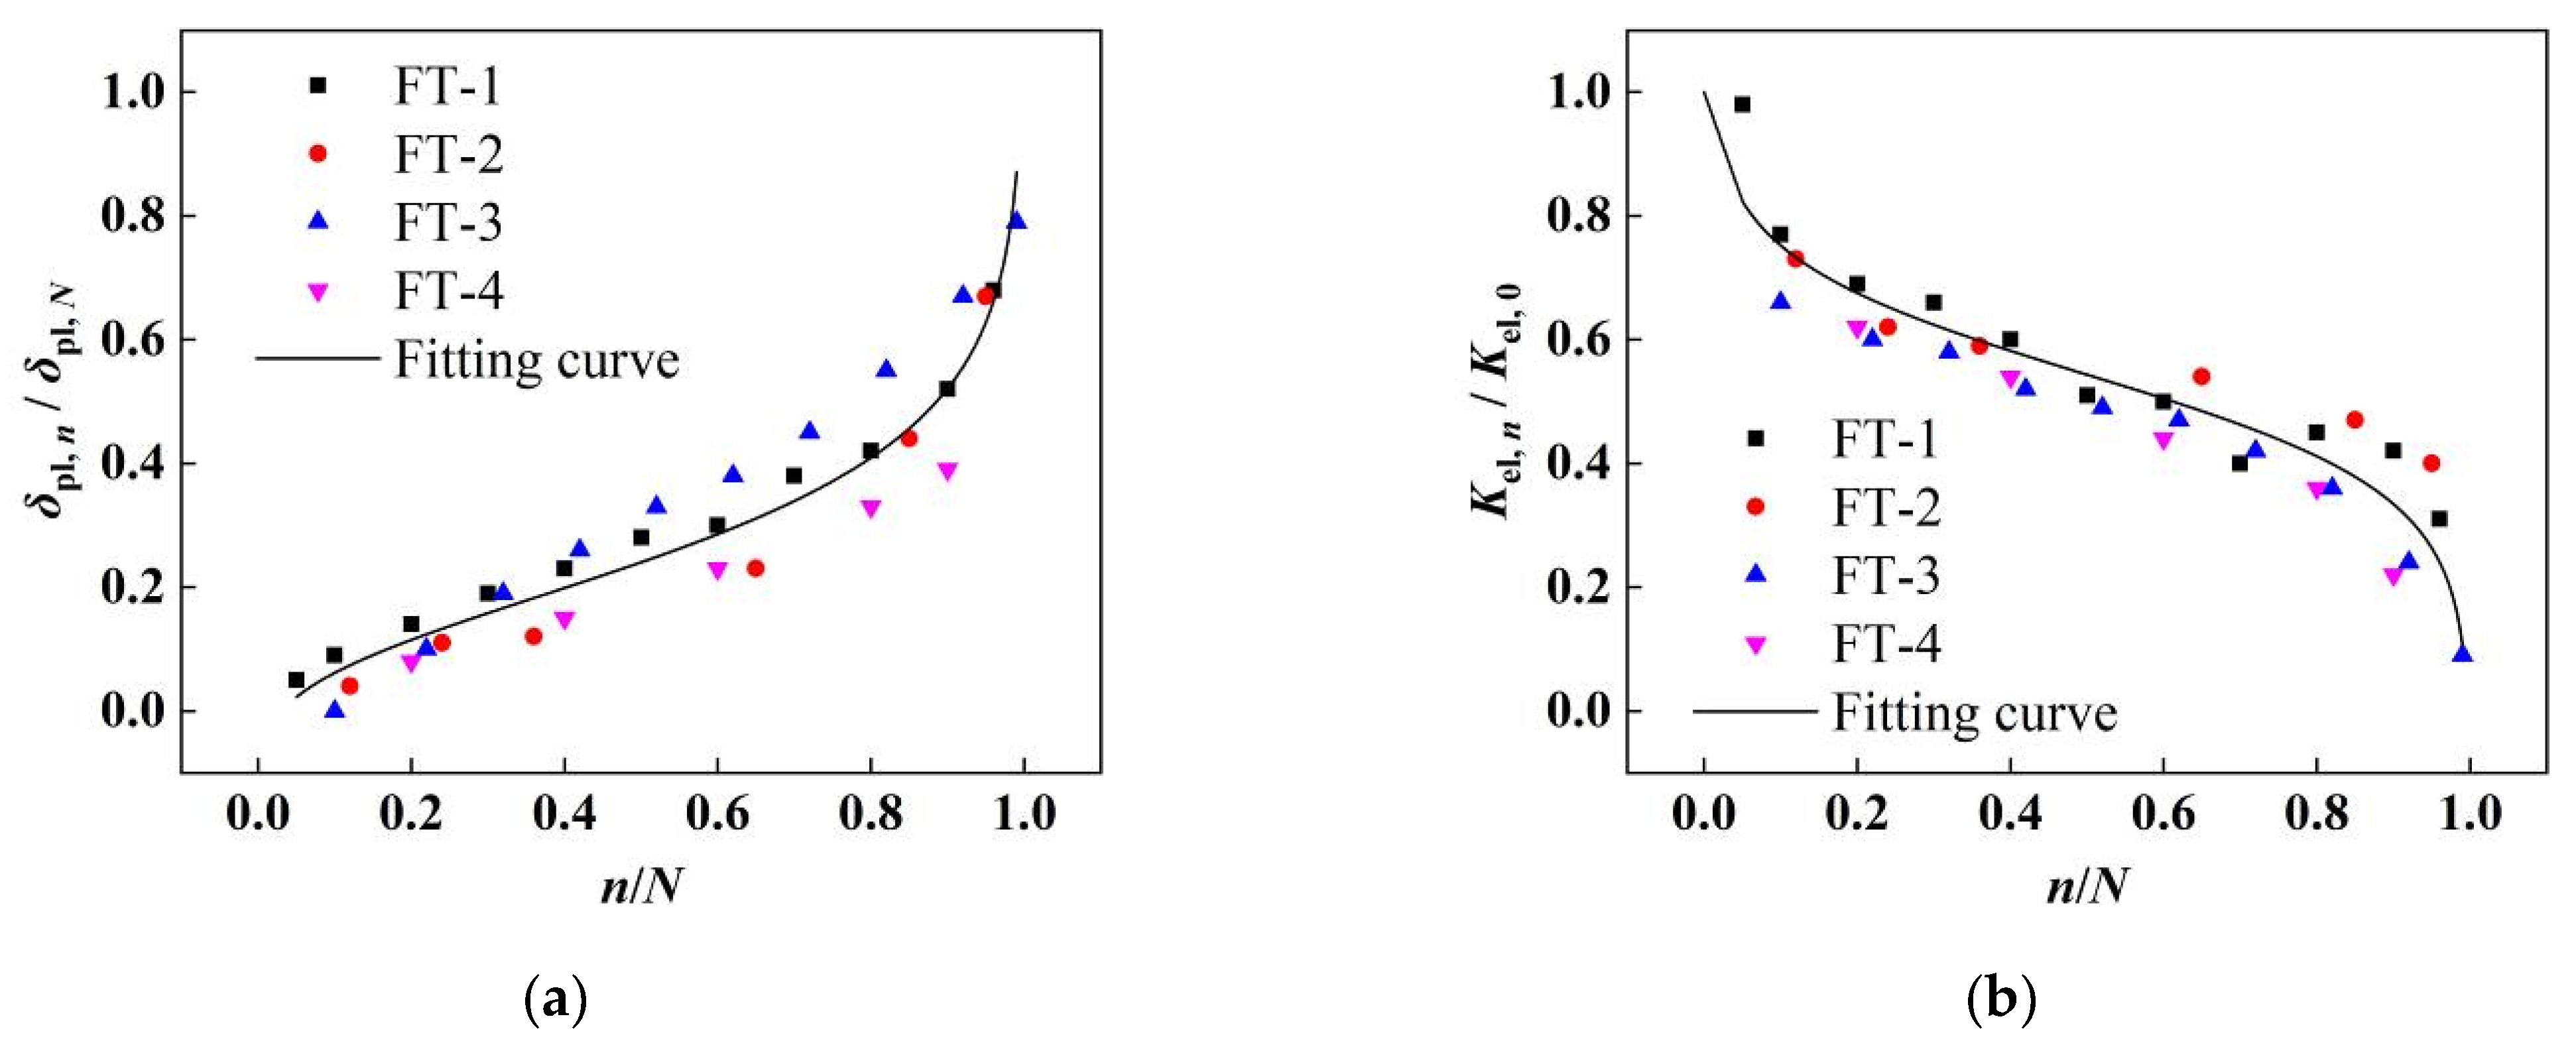
Based on the results shown in
Figure 8 and
Figure 9, the relationship between the relative plastic slip (
δpl,n/
δpl,N), relative elastic stiffness (
Kel,n/
Kel,0), and the relative fatigue loading cycles (
n/
N) after cycles
n was calculated and is plotted in
Figure 11. In the figure,
δpl,N represents the maximum plastic slip recorded before fatigue failure, and
Kel,0 represents the initial elastic stiffness recorded at the beginning of the test. From
Figure 11, it can be observed that the relative cumulative plastic slip followed an anti-S growth curve, while the relative elastic stiffness degradation followed an anti-
S descending curve. The evolution of relative plastic slip and relative elastic stiffness comprised three stages: firstly, due to the elimination of bonding and non-elastic deformation between steel flange and UHPC, it entered a brief period of rapid development. Subsequently, with fatigue damage continuously accumulated in the shear studs, the plastic slip and elastic stiffness entered a linear and stable development stage, which occupied the majority of the fatigue life. Finally, before fatigue failure, plastic slip accumulated rapidly, and elastic stiffness dropped sharply, leading to the eventual fatigue failure of the specimen.
In order to quantify the evolution of relative plastic slip and relative elastic stiffness, the double reciprocal logarithmic function [
22] was used to fit the experimental data, as shown in Equations (9) and (10):
where
B1,
B2,
C1, and
C2 are regression coefficients, and
B1 = −0.1490,
B2 = 0.2876,
C1 = 0.5434, and
C2 = 0.0952.
The fitting results are also presented in
Figure 11, with determination coefficients R
2 of 0.916 and 0.935, respectively, indicating a high degree of fitting accuracy.
6. Conclusions
This study experimentally investigated the fatigue behavior of ultra-short studs with an aspect ratio of 1.84 in UHPC. The following conclusions were drawn:
(1) The failure mode of all specimens was ultra-short stud fatigue failure, indicating that UHPC can ensure stud fatigue fracture for ultra-short stud and fully utilize the fatigue properties of ultra-short stud, which was also verified in shear studs with aspect ratios larger than 2.0 in similar studies.
(2) There were three failure modes of ultra-short studs in UHPC: Mode I, fracture surface at stud shank; Mode II, fracture surface at steel flange; and Mode III, fracture surface at stud cap. Among them, Mode III has not been reported in previous studies yet, and will only occur together with Mode II.
(3) There were two failure modes for UHPC: Mode A, UHPC was intact and locally crushed below the stud. This failure mode was in accordance with existing studies. Mode B, UHPC split failure, and the cracks were in a central diffusion shape. This failure mode of UHPC has also not been reported in previous studies yet.
(4) A fatigue strength design S–N curve for short studs in UHPC was proposed based on the fatigue test results. The fatigue strength of short studs in UHPC at 200 × 104 cycles with a 95% survival probability in the proposed curve was 105 MPa, which was significantly higher than the codified curves in EC3. The S–N curve can be used for fatigue strength design and fatigue life calculation of ultra-short studs in UHPC.
(5) Calculation models for stiffness degradation and plastic slip accumulation of short studs in UHPC were established based on the fatigue test results.
(6) Future research should focus on the fatigue failure mechanism and finite element parameter analysis of ultra-short studs in UHPC.
Author Contributions
Data curation, C.-J.T., K.Q., M.-Y.C. and Z.-Y.L.; investigation, Z.Y.; project administration, Y.-Z.W.; resources, Y.-Z.W., Z.Y., M.-Y.C. and Z.-Y.L.; writing—original draft, R.A., C.-J.T. and K.Q.; writing—review and editing, M.-L.Z. and R.A. All authors have read and agreed to the published version of the manuscript.
Funding
This research received no external funding.
Data Availability Statement
The data presented in this study are available in article here.
Conflicts of Interest
Author Chang-Jin Tian is employed by the China Construction Infrastructure Co., Ltd. Author Meng-Ying Cheng is employed by the Design & Consulting Company (Shandong) of China Construction 8th Engineering Division. Author Zhao-Yuan Lv is employed by the Shimao Group Holdings Limited. The remaining authors declare that the research was conducted in the absence of any commercial or financial relationships that could be construed as a potential conflict of interest.
References
- Pei, B.; Li, L.; Shao, X.; Wang, L.; Zeng, Y. Field measurement and practical design of a lightweight composite bridge deck. J. Constr. Steel Res. 2018, 147, 564–574. [Google Scholar] [CrossRef]
- Luo, J.; Shao, X.; Fan, W.; Cao, J.; Deng, S. Flexural cracking behavior and crack width predictions of composite (steel + UHPC) lightweight deck system. Eng. Struct. 2019, 194, 120–137. [Google Scholar] [CrossRef]
- Liu, Y.; Zhang, Q.; Meng, W.; Bao, Y.; Bu, Y. Transverse fatigue behaviour of steel-UHPC composite deck with large-size U-ribs. Eng. Struct. 2019, 180, 388–399. [Google Scholar] [CrossRef]
- Lu, K.; Du, L.; Xu, Q.; Yao, Y.; Wang, J. Fatigue performance of stud shear connectors in steel-concrete composite beam with initial damage. Eng. Struct. 2023, 276, 115381. [Google Scholar] [CrossRef]
- Wang, Y.; Cao, J.; Shao, X.; Mao, Q.; Qu, Z. Effect of UHPC strengthening layer on static and fatigue performance of upper cutouts in orthotropic steel decks. J. Constr. Steel Res. 2022, 198, 107557. [Google Scholar] [CrossRef]
- Luo, J.; Shao, X.; Cao, J.; Xiong, M.; Fan, W. Transverse bending behavior of the steel-UHPC lightweight composite deck: Orthogonal test and analysis. J. Constr. Steel Res. 2019, 162, 105708. [Google Scholar] [CrossRef]
- Wang, Y.; Shao, X.; Zhang, X.; Cao, J.; Zhao, X.; Deng, S. Structural behaviors of low-profile steel plate reinforced UHPC deck panel with longitudinal ribs. ASCE J. Bridge Eng. 2021, 26, 04021043. [Google Scholar] [CrossRef]
- Ding, F.X.; Yin, G.A.; Wang, H.B.; Wang, L.; Guo, Q. Static behavior of stud connectors in bi-direction push-off tests. Thin-Walled Struct. 2017, 120, 307–318. [Google Scholar] [CrossRef]
- Xue, W.; Ding, M.; Wang, H.; Luo, Z. Static behavior and theoretical model of stud shear connectors. J. Bridge Eng. 2008, 13, 623–634. [Google Scholar] [CrossRef]
- Luis, P.; Jerome, F. Headed steel stud anchors in composite structures, part I: Shear. J. Constr. Steel Res. 2010, 66, 198–212. [Google Scholar]
- Yan, J.B.; Zhang, W.; Liew, J.R.; Li, Z.X. Numerical studies on shear resistance of headed stud connectors in different concretes under Arctic low temperature. Mater. Des. 2016, 112, 184–196. [Google Scholar] [CrossRef]
- EN 1994-1-1-2004; Design of Composite Structures, Part 1-1: General Rules and Rules for Buildings. CEN—European Committee for Standardization: Brussels, Belgium, 2004.
- Yang, H.; Zheng, Y.; Mo, S.; Lin, P. Push-out tests on studs with UHPC cover embedded in UHPC-NSC composite slab. Constr. Build. Mater. 2022, 331, 127210. [Google Scholar] [CrossRef]
- Kim, J.S.; Kwark, J.; Joh, C.; Yoo, S.W.; Lee, K.C. Headed stud shear connector for thin ultrahigh-performance concrete bridge deck. J. Constr. Steel Res. 2015, 108, 23–30. [Google Scholar] [CrossRef]
- Kruszewski, D.; Wille, K.; Zaghi, A.E. Push-out behavior of headed shear studs welded on thin plates and embedded in UHPC. Eng. Struct. 2018, 173, 429–441. [Google Scholar] [CrossRef]
- Kruszewski, D.; Wille, K.; Zaghi, A.E. Design considerations for headed shear studs embedded in ultra-high performance concrete as part of a novel bridge repair method. J. Constr. Steel Res. 2018, 149, 180–194. [Google Scholar] [CrossRef]
- Luo, Y.; Hoki, K.; Hayashi, K.; Nakashima, M. Behavior and strength of headed stud-SFRCC shear connection, II: Strength Evaluation. J. Struct. Eng. 2015, 142, 04015113. [Google Scholar] [CrossRef]
- Shi, Z.; Su, Q.; Kavoura, F.; Veljkovic, M. Behavior of short-headed stud connectors in orthotropic steel-UHPC composite bridge deck under fatigue loading. Int. J. Fatigue 2022, 160, 106845. [Google Scholar] [CrossRef]
- Chen, S.; Huang, Y.; Gu, P.; Wang, J.Y. Experimental study on fatigue performance of UHPC-orthotropic steel composite deck. Thin-Walled Struct. 2019, 14, 1–18. [Google Scholar] [CrossRef]
- Huang, Y.; Chen, S.M.; Gu, P. Numerical analysis on fatigue behavior of ultrahigh-performance concrete-Orthotropic steel composite bridge deck. Adv. Struct. Eng. 2022, 25, 1151–1166. [Google Scholar] [CrossRef]
- Cao, J.; Shao, X.; Deng, L.; Gan, Y. Static and fatigue behavior of short-headed studs embedded in a thin ultrahigh-performance concrete layer. J. Bridge Eng. 2017, 22, 04017005. [Google Scholar] [CrossRef]
- Wei, C.; Zhang, Q.; Zhou, Y.; Cheng, Z.; Li, M.; Cui, C. Static and fatigue behaviors of short stud connectors embedded in ultra-high performance concrete. Eng. Struct. 2022, 273, 114888. [Google Scholar] [CrossRef]
- Huang, Y.; Chen, S.M.; Gu, P. Static and fatigue behavior of shear stud connection embedded in UHPC. Structures 2021, 34, 2777–2788. [Google Scholar] [CrossRef]
- Liu, Y.; Zhang, Q.; Bao, Y.; Bu, Y. Static and fatigue push-out tests of short headed shear studs embedded in Engineered Cementitious Composites (ECC). Eng. Struct. 2019, 182, 29–38. [Google Scholar] [CrossRef]
- Hobbacher, A.F. The new IIW recommendations for fatigue assessment of welded joints and components-a comprehensive code recently updated. Int. J. Fatigue 2009, 1, 50–58. [Google Scholar] [CrossRef]
- Li, J.; Yang, B.; Shao, X.D.; Li, J. Research on shear fatigue of studs for composite deck system of steel slab and thin CRRPC layer. J. Civ. Eng. 2016, 49, 67–75. (In Chinese) [Google Scholar]
- Zhang, S.; Shao, X.D.; Huang, X.J.; Yang, B. Static and fatigue behaviors of small stud shear connector for lightweight composite bridge deck. J. Highw. Transp. Res. Dev. 2016, 33, 111–119. (In Chinese) [Google Scholar]
- Eurocode-3; Design of Steel Structures. European Committee for Standardization: Brussels, Belgium, 2004.
- Hobbacher, A.F. Recommendations for Fatigue Design of Welded Joints and Components (XIII-2460-13/XV-1440-13); International Institute of Welding: Paris, France, 2016; pp. 1–143. [Google Scholar]
| Disclaimer/Publisher’s Note: The statements, opinions and data contained in all publications are solely those of the individual author(s) and contributor(s) and not of MDPI and/or the editor(s). MDPI and/or the editor(s) disclaim responsibility for any injury to people or property resulting from any ideas, methods, instructions or products referred to in the content. |
© 2024 by the authors. Licensee MDPI, Basel, Switzerland. This article is an open access article distributed under the terms and conditions of the Creative Commons Attribution (CC BY) license (https://creativecommons.org/licenses/by/4.0/).


