1. Introduction
Recently, there has been an increase in traffic volumes on road networks and insufficient maintenance work, leading to the appearance of defects on roads such as rutting in hot areas and the appearance of cracks on roads in cold areas [
1,
2,
3,
4]. The maintenance and repaving of roads result in large quantities of materials known as reclaimed asphalt pavements (RAPs). The demand for sustainable, eco-friendly materials and the preservation of natural raw materials has increased significantly, and hence, the focus on pavement construction technology has shifted towards green technologies [
5]. Thus, this study seeks to improve the performance of asphalt mixes through using sustainable additives like mass-produced waste polymers and RAP from landfill sites containing plastic and old asphalt pavements, respectively. Most importantly, the current study aims to apply LCA tools to evaluate the environmental impact of new mixes.
It is reported that, in the United States, about 110 million metric tons of asphalt pavements were removed to landfills by the end of 2018 [
6]. The use of recycled aggregate in road construction has increased because it preserves raw resources and reduces the cost of construction. Furthermore, the reuse of RAP materials in road construction will have a positive impact on the environment because these materials are considered solid waste pollutants [
7]. Numerous scientists consider the usage of RAP in asphalt mixes positive.
Arshad et al. [
8] investigated the effect of adding scraped pavement in manufacturing asphalt layers. RAP materials can also be used to save non-renewable resources, especially those with a high cost of materials and low supply [
7]. Another study carried out by the FHWA [
9] reported that recycled aggregates have excellent properties that make them a suitable substitute for virgin resources and thus have the ability to reduce the use of virgin aggregates in mixtures. As a result, their properties make them an environmentally friendly and cost-effective alternative to virgin aggregates. Another advantage of using RAP is that it helps to reduce the amount of expensive new asphalt binders used in asphalt paving mixes. Xiao et al. [
10] revealed that more than 100 million tons of RAP was collected for reuse in the United States, thereby saving about 61.4 million cubic yards of landfill space. The use of reclaimed asphalt pavement becomes attractive because of its effectiveness in terms of reducing costs and preserving the environment. Colbert and You [
11] investigated that recycled asphalt mixtures have good resistance to moisture damage at low RAP ratios. The use of recycled aggregate in large proportions reduces its load-bearing capacity and also deteriorates its CBR values. Therefore, Bennert and Maher [
12] recommend using recycled aggregate with virgin aggregate in a ratio not exceeding 50%. Naser et al. [
13] stated that the use of RAP in bituminous mixes improves the stability of the mixture; the highest stability result was recorded for asphalt mixes modified with 75% RAP. Filho et al. [
14] studied cold-recycled bitumen with 100% RAP added into the bituminous mix. The results demonstrated that the use of cold-recycled asphalt mixtures in the novel mix with RAP had a significant effect on the overall performance of the asphalt mixes. Al-Ghurabi et al. [
15] observed that adding fine aggregate in a proportion of 20% of the total aggregate instead of 20% RAP, as well as replacing 40% of coarse aggregate, which represents the amount of coarse aggregate in the mixture, can be adopted to improve the properties of the mixture, also highlighting the possibility of using RAP in hot asphalt mixtures. Fournier et al. [
16] studied the use of combinations of recycled coarse aggregates (RCAs) and recycled asphalt pavement (RAP) in asphalt mixtures. The results showed the possibility of combining both wastes to obtain a new material with which to pave roads with a high environmental benefit by reducing the use of natural resources. Pradhan and Sahoo [
17] studied the effect of rejuvenator mahua and pongamia oil on an HMA mixture containing high RAP and found improved performance properties. Pradhan and Sahoo [
18] also showed the possibility of using up to 60% RAP in hot asphalt mixtures, in addition to adding a softer binder or rejuvenator, without significantly compromising performance. Finally, Pradhan and Sahoo [
19] conducted another research project on adding 60% recycled aggregate with the addition of Madhuca longifolia oil to achieve the desired properties in the mixture without significantly affecting the performance of the pavement.
The significant increase in the number of industry types as well as population growth produce large quantities of solid waste such as plastic. A basic component of plastic materials is low-density polyethylene (LDPE). Sreedevi and Salini [
20] observed that the use of plastic waste in bitumen mixtures used on roads reduces environmental impacts, increases the life of the road, and reduces the consumption of petroleum materials. Gao et al. [
21] noted in their study that recycled plastic materials containing low-density polyethylene and polypropylene in asphalt mixtures improve durability and fatigue life.
The life cycle assessment (LCA) methodology is one of the internationally recognized and agreed-upon methods for assessing the environmental impacts of service operations and determining their sustainability throughout the life cycle [
22]. When assessing the life cycle, the use of resources and emissions resulting from the life cycle of the system or process to be evaluated are taken into account, such as the treatment and extraction of raw materials and chemicals, fiber production, and recycling [
23,
24].
Vidal et al. [
25] conducted a comprehensive evaluation of the paving industry on hot mix asphalt (HMA), warm mix asphalt (WMA) by adding synthetic zeolite, and asphalt mixes with reclaimed asphalt pavement (RAP). By comparing asphalt mixes with different RAP contents, they showed that the impacts of asphalt mixtures were significantly reduced when RAP was added. Khater et al. [
26] used mixtures modified with lignin and glass fiber, based on the life cycle assessment methodology, to evaluate the construction of asphalt paving in accordance with ISO 14040. It was clear that all the asphalt mixtures studied had a slight environmental impact. Sackey et al. [
27] determined the environmental impacts of material emissions used in asphalt mixtures modified with nanosilica through a LCA. The production of asphalt mixtures modified with nanosilica had a significant environmental impact compared with the control mixture. In another study performed by Yue et al. [
28], the effects of asphalt mixtures modified with lignin fiber and diatomite powder were evaluated according to the life cycle assessment system in China. The authors concluded that the use of these mixtures did not cause major risks to the environment.
The current study seeks to evaluate the mechanical performance of asphalt mixtures modified with RAP and polyethylene, along with assessing the environmental impacts associated with energy consumption and road construction based on a life cycle assessment (LCA). The present study aims to evaluate the qualification of this modified mixture in comparison with a control mixture from a mechanical and environmental perspective. In the past, there has been a shortage of research that aims to evaluate the mechanical and environmental performance of the modified mixture. However, the outcomes of this study are essential. The results could be used by environmental experts and decision makers who have been working in the field of environmental assessment by highway agencies.
2. Materials and Experimental Methods
In the current study, selected raw materials were obtained from known sources in Egypt. Laboratory tests were performed to evaluate the quality of the used materials. The Marshall Methodology was used to determine the optimum bitumen content, considering high traffic specifications. Loss of stability, wheel loading tracking, and indirect tensile strength tests were used to evaluate the behavior of the asphalt mixtures. Finally, an LCA was conducted from an environmental perspective to assess the environmental burdens of the new modified asphalt mixture.
2.1. Materials
2.1.1. Asphalt Cement
Asphalt with 60/70 penetration from Suez, Egypt, was chosen to be used in the entire experimental program of this research. The qualification tests of asphalt are illustrated in
Table 1, according to Egyptian specifications.
2.1.2. Aggregates
Two sources of Dolomite coarse aggregates (Pin 2, Pin 1), used in the present study, were obtained from the “Ataka” quarry in Suez, Egypt. Various qualification tests were conducted to determine the engineering properties of the selected aggregates. The measured values of these tests are displayed in
Table 2, according to Egyptian specifications. Siliceous sand that was obtained from “Elrehab” quarry, Cairo, was used as the fine aggregate and has a density of 2.68 g/cm
3. Furthermore, limestone powder with a density of 2.75 g/cm
3 was selected as the mineral filler. The gradation of the coarse and fine aggregates used in this research is investigated in
Table 3, according to AASHTO T27 [
29].
2.1.3. Recycling Aggregate
Recycled aggregate was collected from the development of the Cairo–Ismailia Desert Road.
Table 4 illustrates the gradation of reclaimed aggregate.
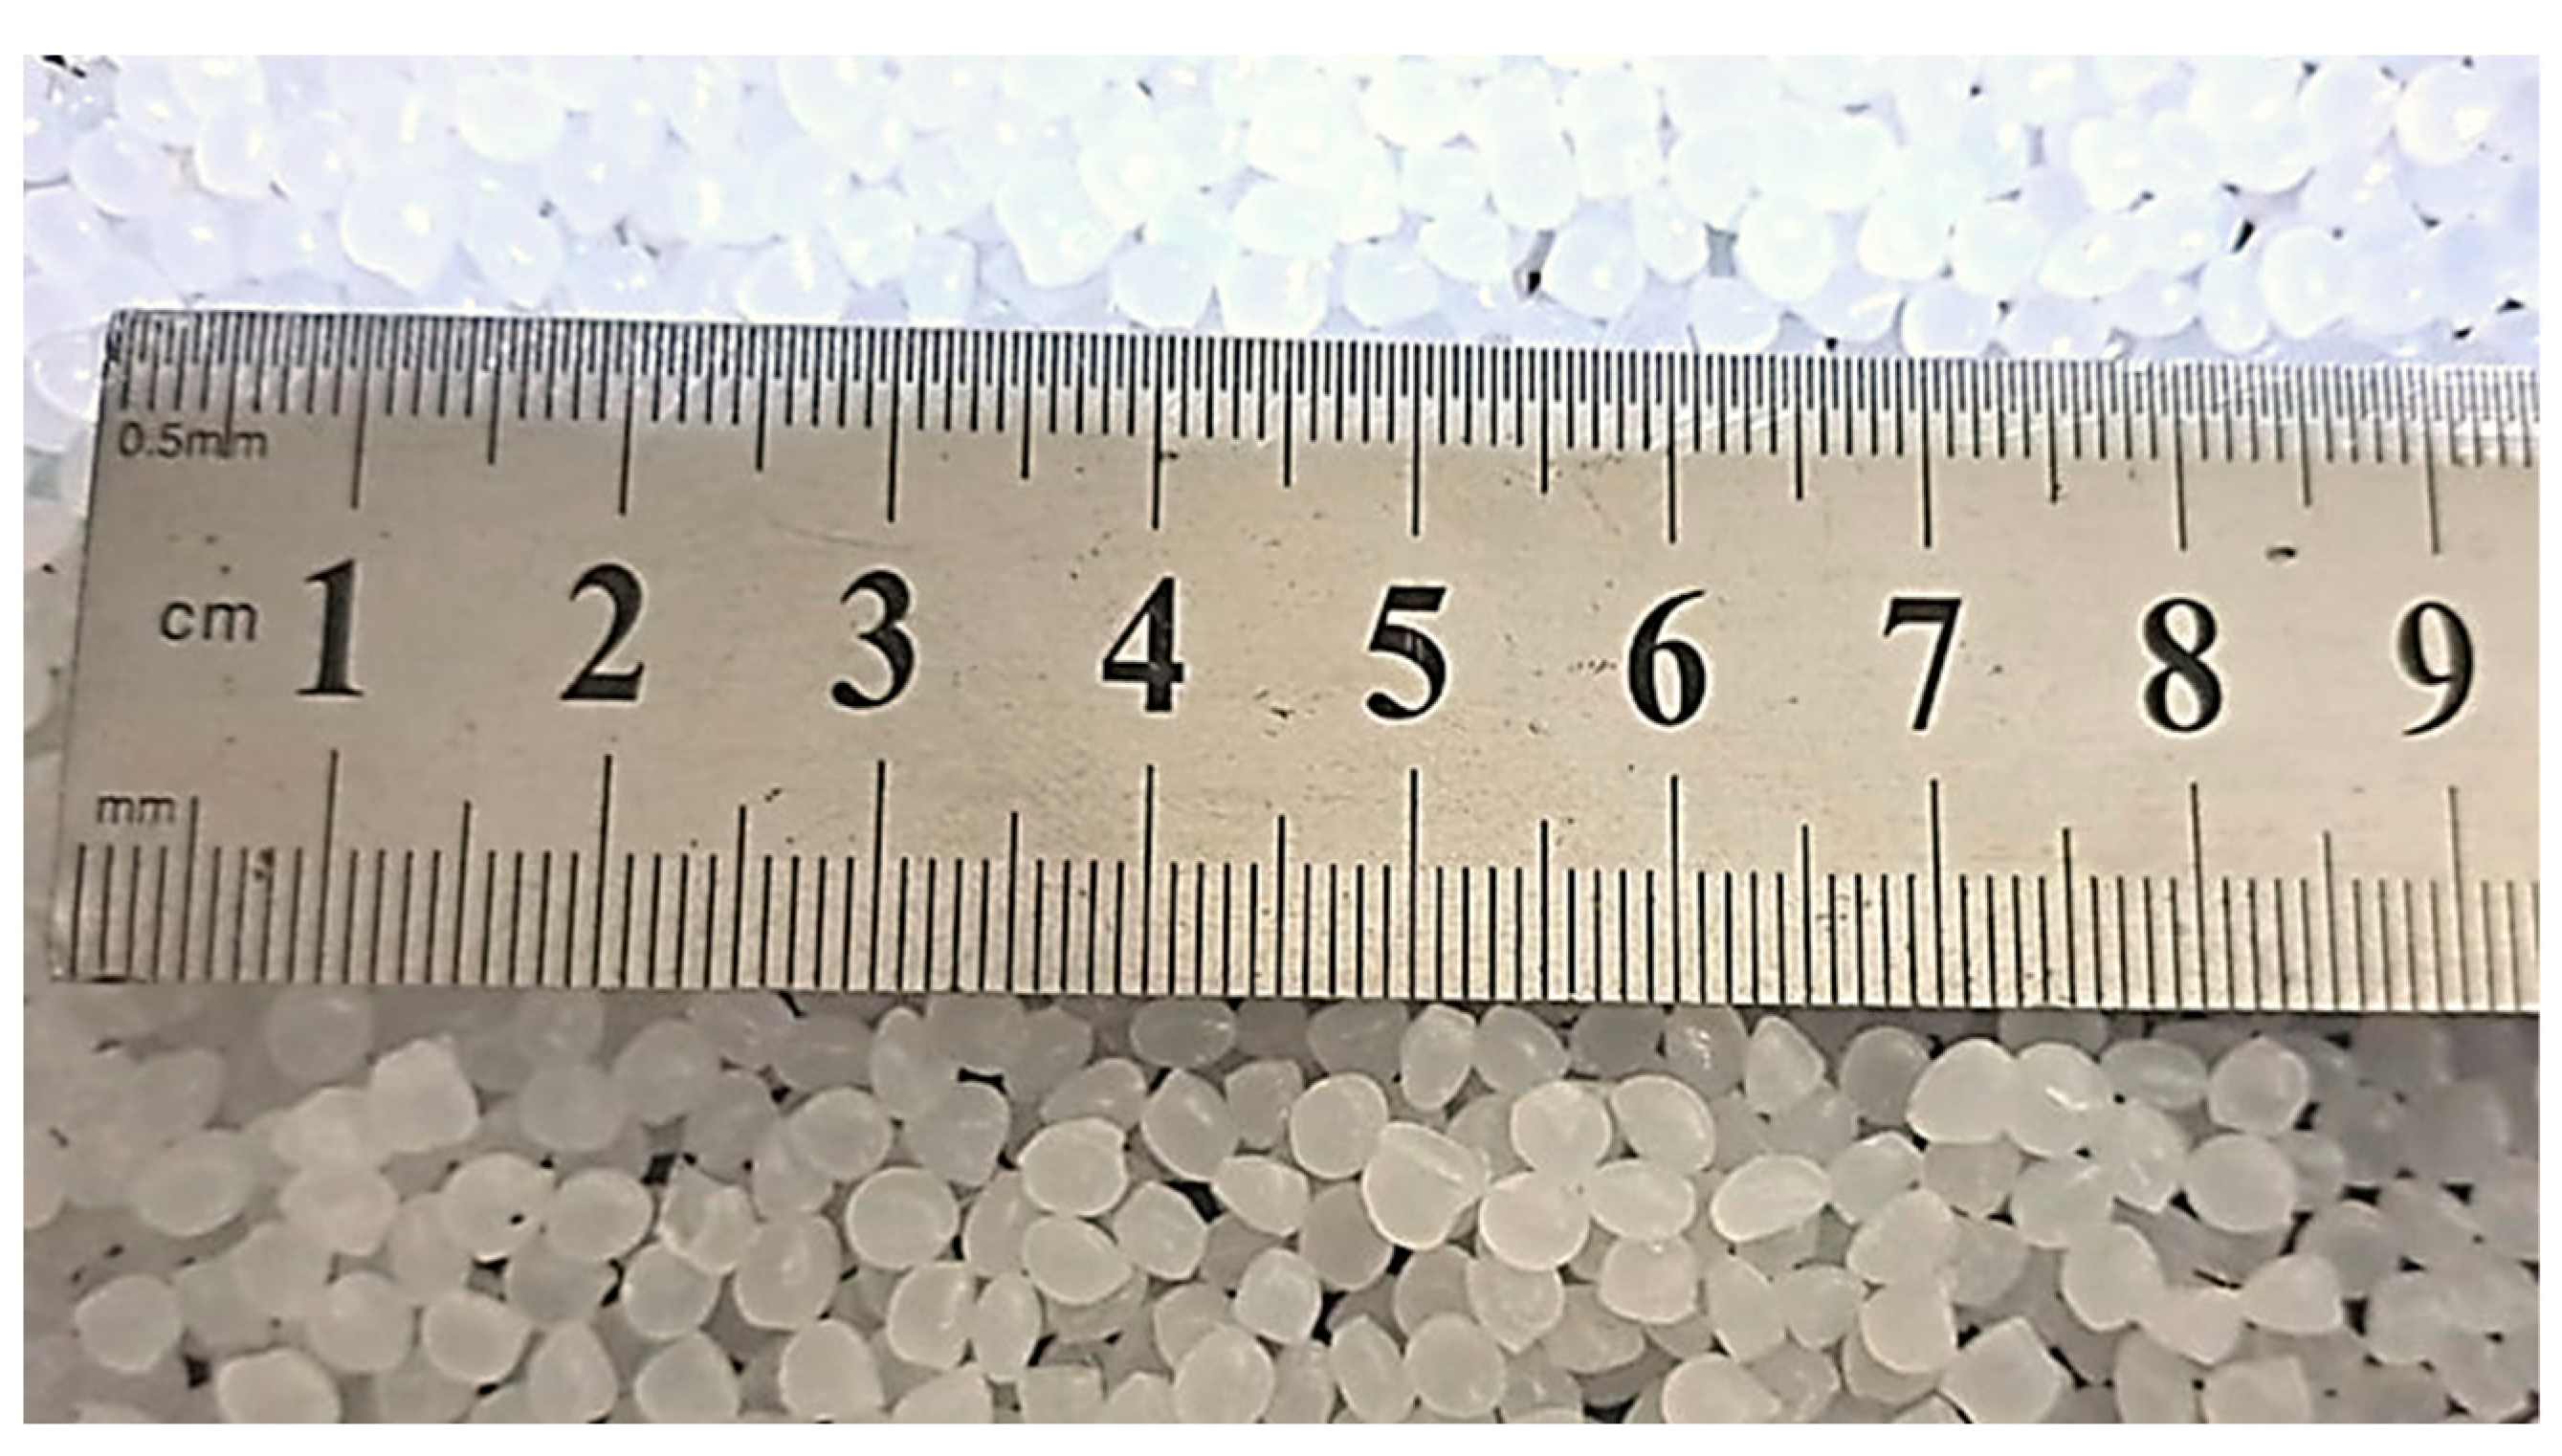
2.1.4. Waste Plastic Resin
Waste plastic resin is a synthetic plastic material with linear low-density polyethylene (LLDPE), which has been used in this study as an additive in the asphalt mixtures. LLDPE passed through sieve No. 4 (4.75 mm) and was retained on sieve No. 16 (1.18 mm). The chemical properties of the waste plastic resin are represented in
Table 5, and the morphology of the waste plastic resin is illustrated in
Figure 1.
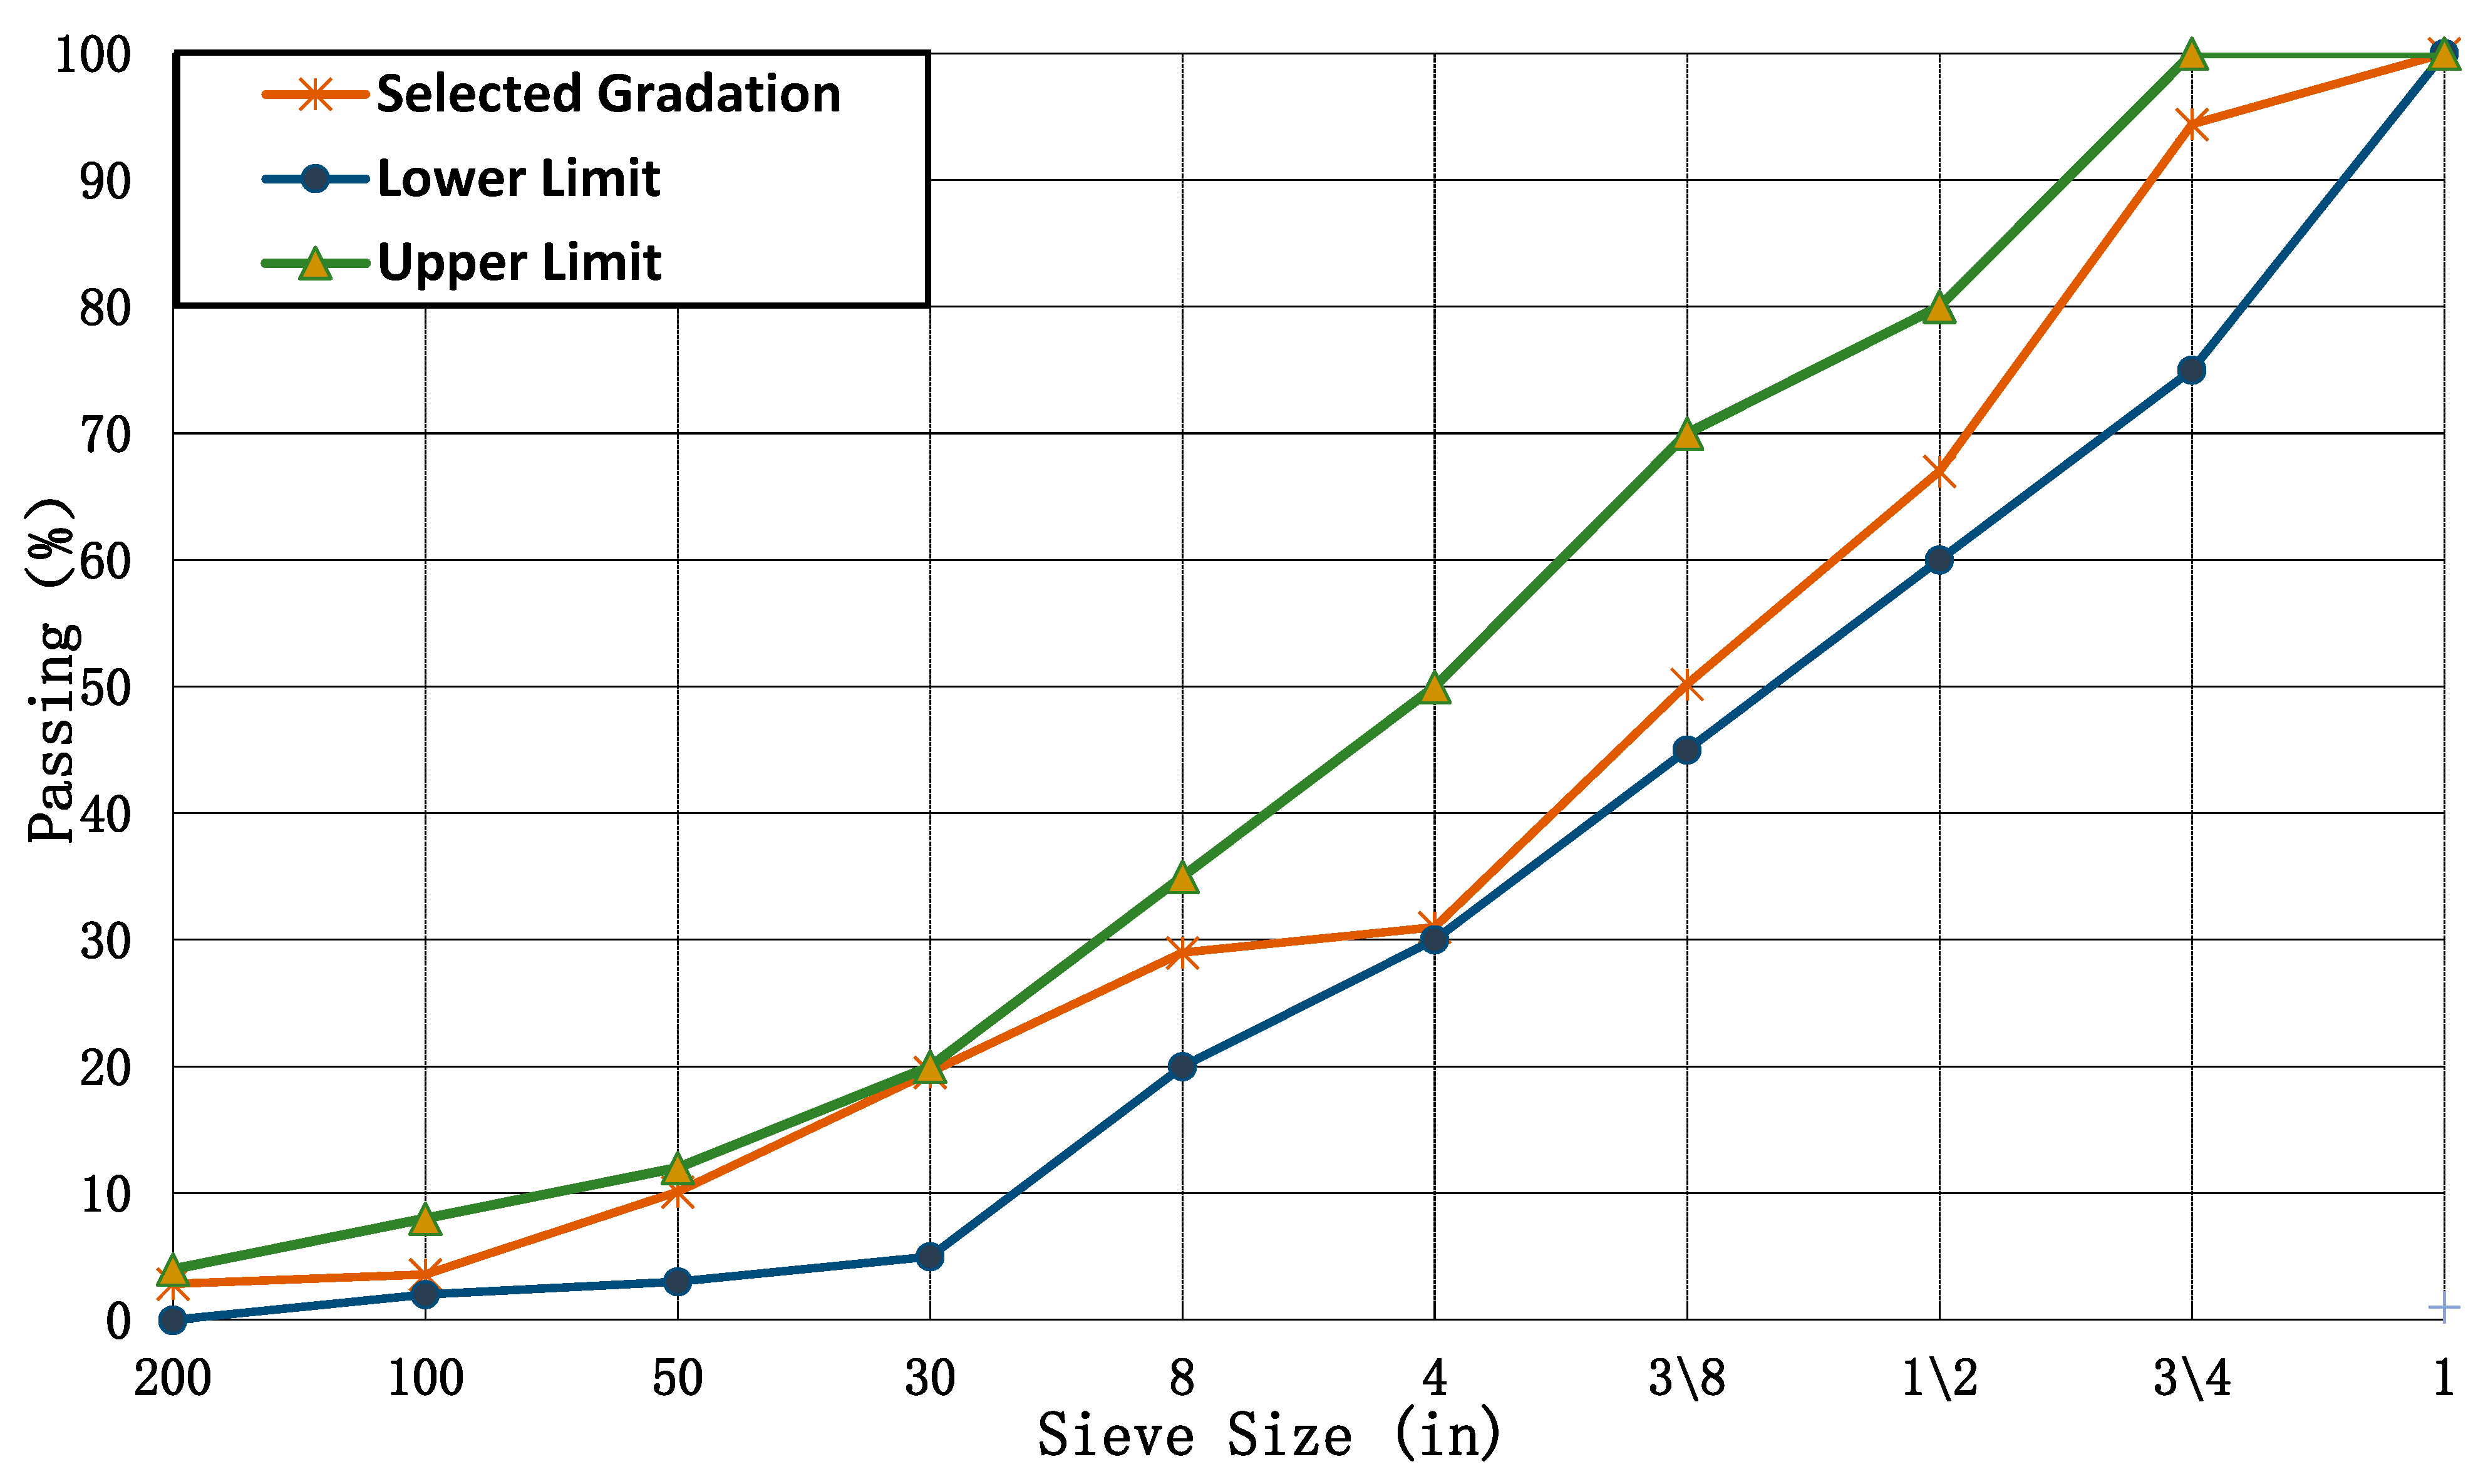
2.1.5. Mix Gradation
The gradation values of the mix design (3D) were selected in all experimental plans. The mix design selected is shown within the limits in
Table 6 and
Figure 2.
2.2. Experimental Method
2.2.1. Specimen Preparation
Nine types of asphalt concrete mixtures (one conventional mix, four RAP mixtures, and four RAP + polyethylene mixtures) were fabricated in the laboratory. These types were used to assess the performance regarding loss of stability, high temperature stability, and moisture damage resistance. The additive amount, type, and optimum bitumen content (OBC) are mentioned in
Table 7.
2.2.2. Asphalt Mixture Performance Tests
Loss of Stability Test
The loss of stability test has been used as a guide for the water resistance of Marshall samples and is considered a simplified version of AASHTO T-165. In this test, two groups of cylindrical asphalt mix samples with dimensions of 101.6 D × 63.5 mm H were manufactured in the laboratory based on the OBC. After that, one group of samples was immersed in a water bath at 60 °C for 30 min, while the other group was submerged in water at 60 °C for periods of 1 day, 2 days, and 3 days, as shown in
Figure 3. Finally, the samples were tested on a Marshall device to determine the loss of stability over one to three days, as shown in
Figure 4.
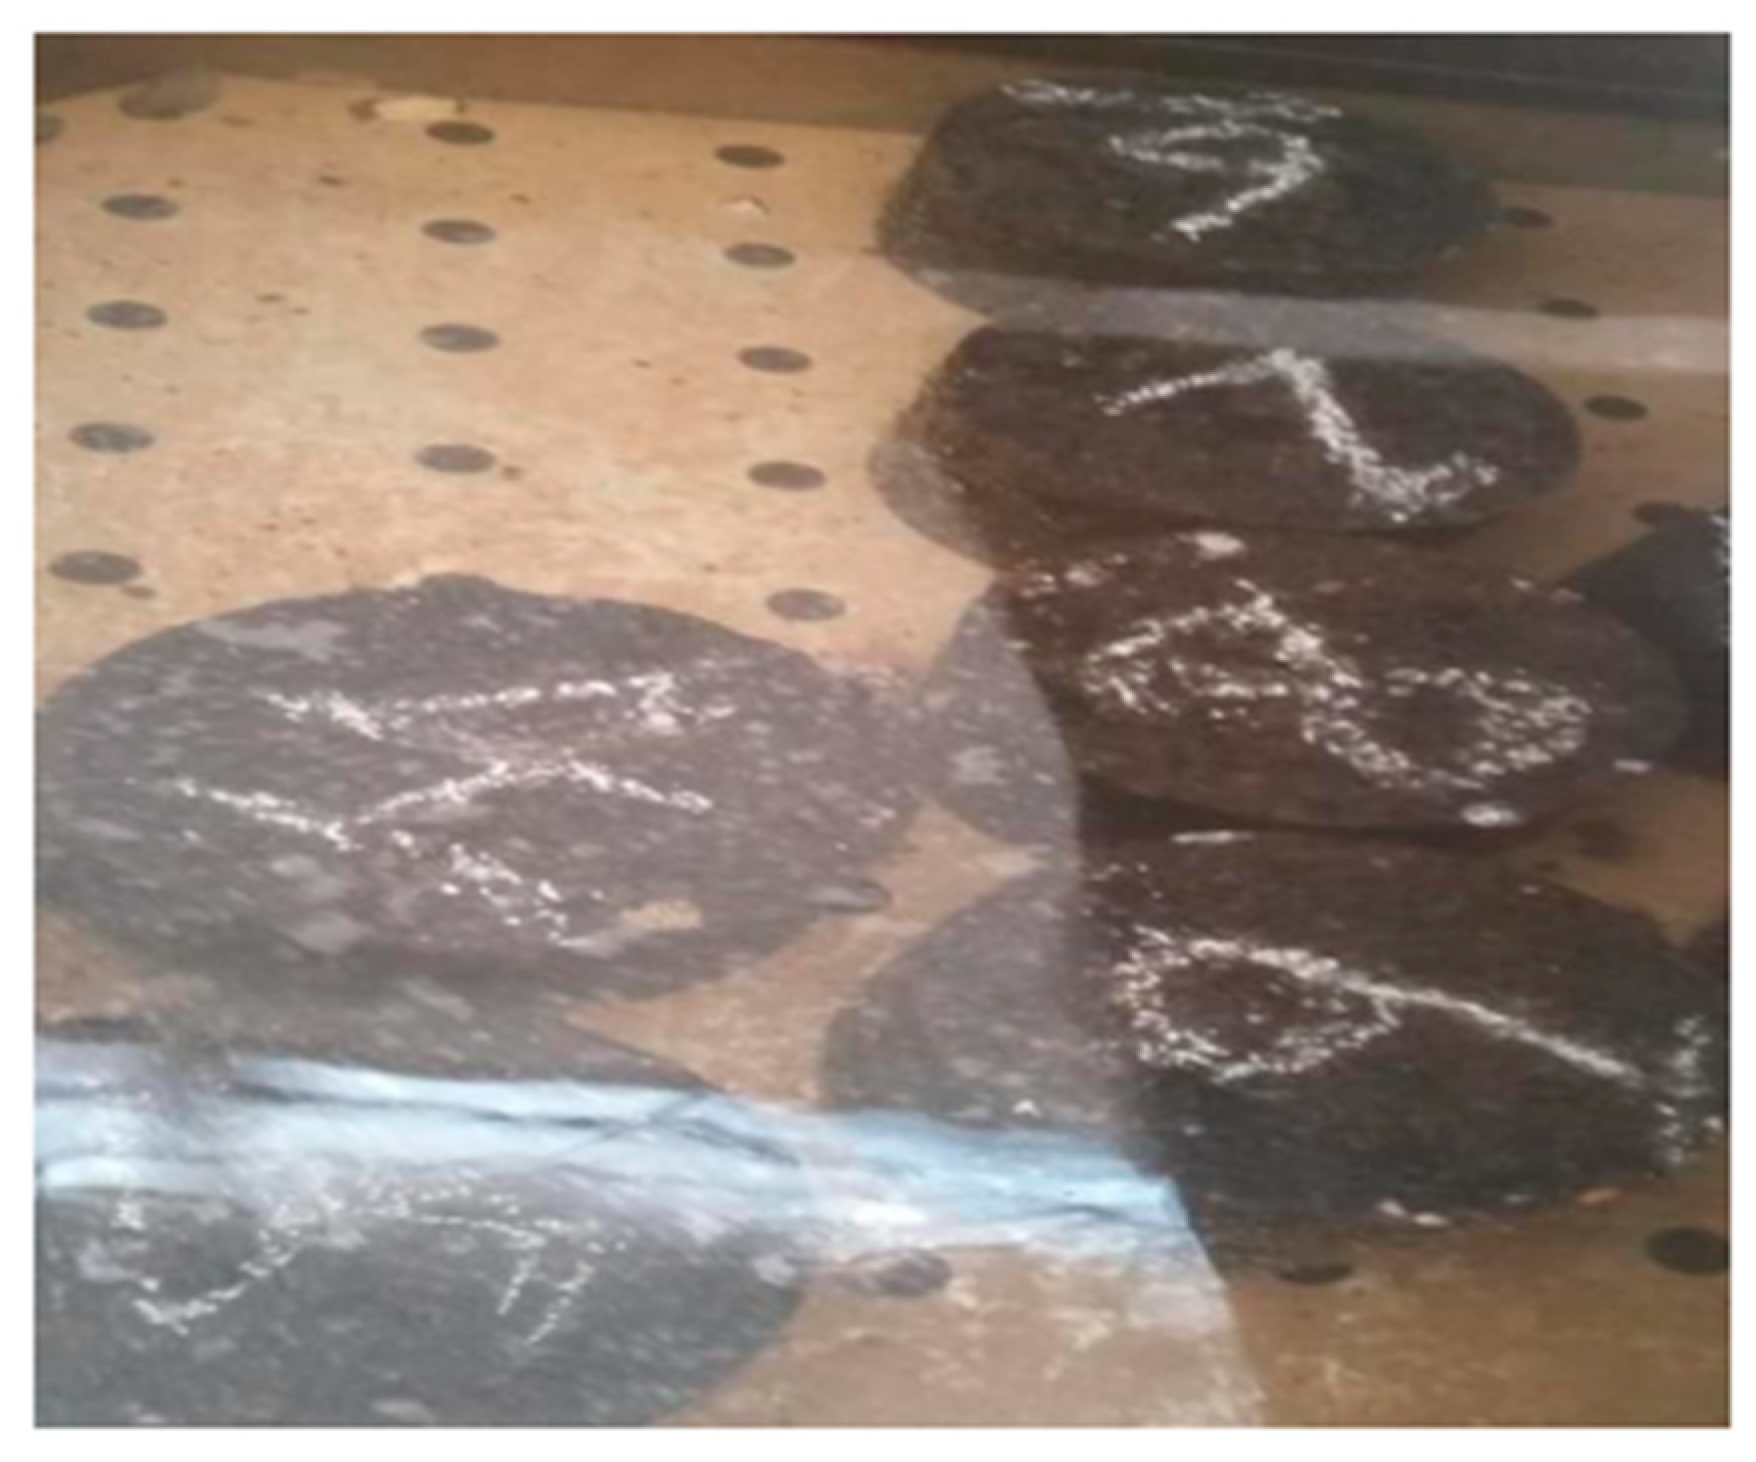
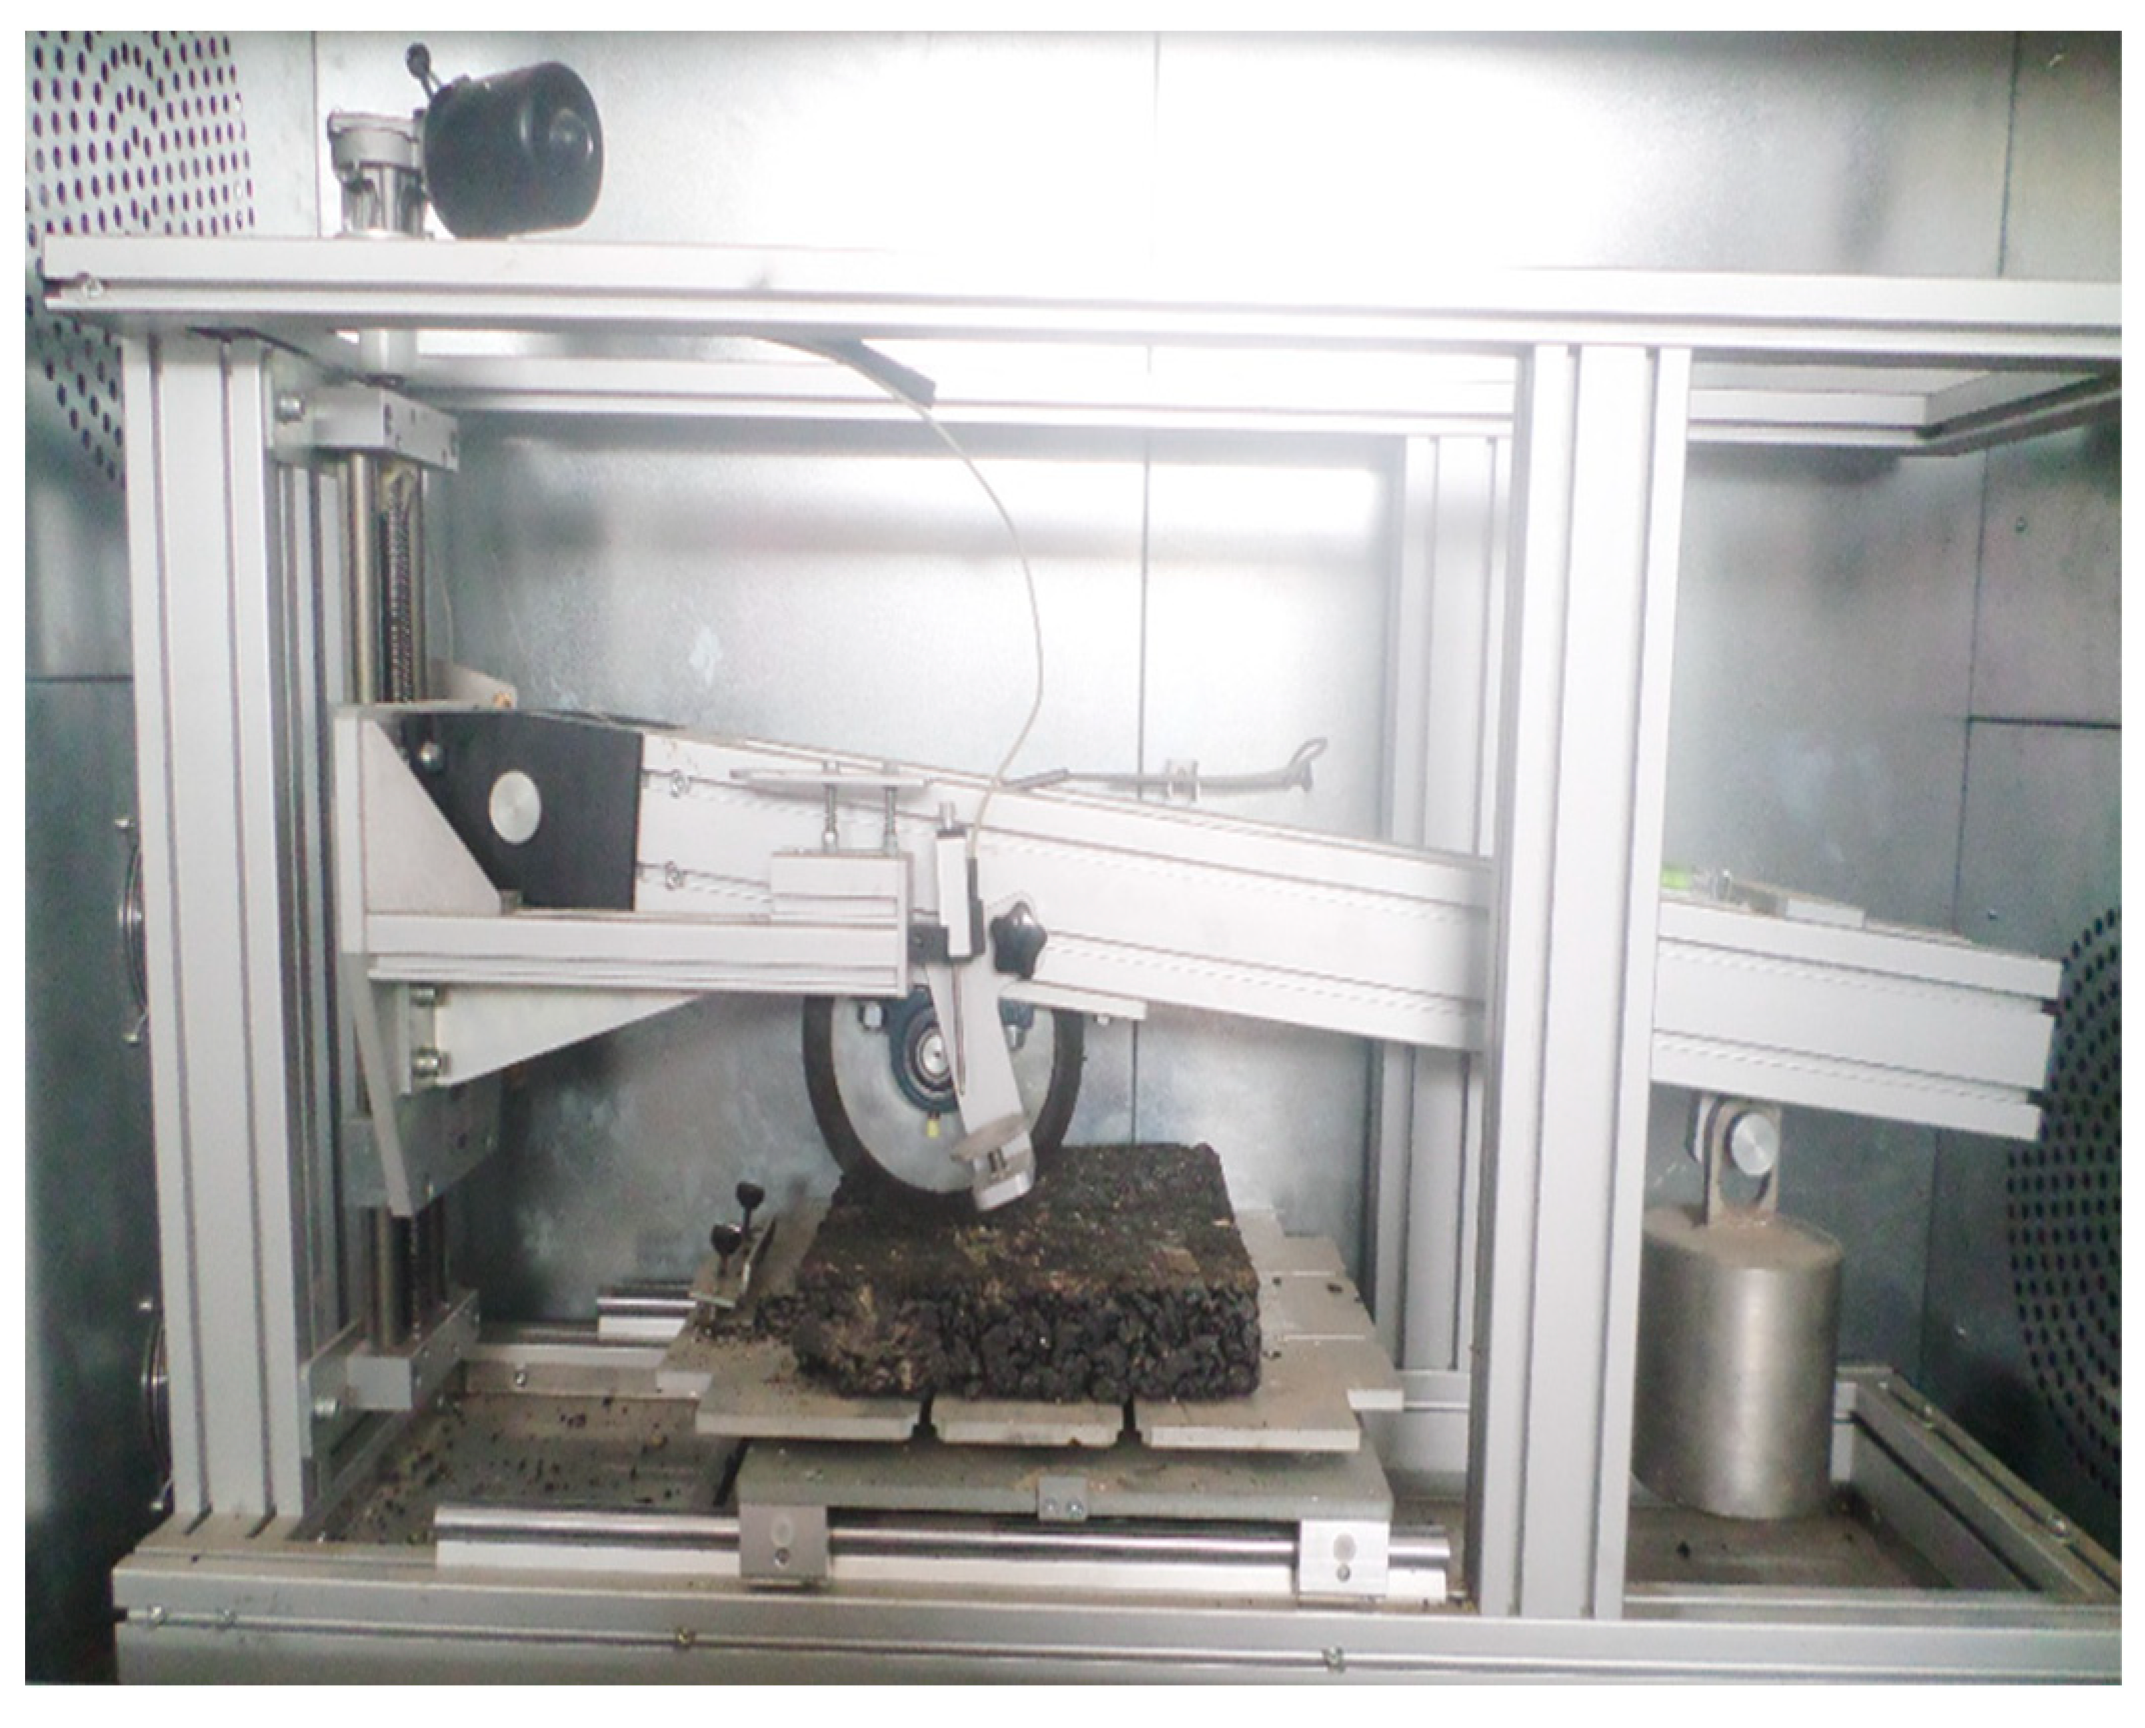
Wheel Loading Tracking Test (WLTT)
The WLTT was conducted to measure the rutting in the mixes. Notably, this test was developed by British Road Research [
30]. The WLTT consists of a rubber wheel with a weight of 53.5 kg. The track depth at the mid-point of its length was recorded at regular intervals up to 45 min with a spring dial gauge. HMA slap dimensions (length × width × thickness) of 440 mm × 350 mm × 50 mm were used. The samples used were prepared based on the OBC, and after that, they were compacted and finally placed at 60 °C in an oven before conducting the test according to AASHTO T-340 [
31].
Figure 5 and
Figure 6 show the slabs under the wheel load and after the test.
Indirect Tensile Strength
The indirect tensile strength test was performed in the current study to evaluate the strength of the samples under water effects, based on ASTM D 6931 [
32]. In this test, the cylindrical samples were subjected to pressure loads operating parallel to the diagonal vertical plane using the Marshall loading device. This method is illustrated in
Figure 7. As a result of this loading, a uniform tensile stress was produced, which worked perpendicular to the applied load plane, and therefore the sample failed by splitting with the loaded plane. From the following equation, the indirect tensile force was determined:
where ITS is the value of the indirect tensile strength (kPa); P is the maximum failure load (N); h is the thickness of the sample (mm); and D is the diameter of the sample (mm). The level of damage caused by the moisture depended on the design of the pavement, environmental factors, and the quality of the materials used in the asphalt mixture. Therefore, the wettability of the compressed samples was evaluated with the tensile strength ratio (TSR) using the following equation:
where ITS condition is considered the average value of the indirect tensile strength of the specimen in the wet state, while ITS unconditioned is the average value of the indirect tensile strength of the specimen in the dry state.
2.3. Life Cycle Assessment (LCA)
The life cycle assessment methodology was used to determine the environmental impacts and benefits of the product using the ISO 14040 and ISO 14044 standards.
The life cycle assessment process underwent the following basic stages: setting goals, compiling a life cycle inventory, showing environmental impacts, and then evaluating and analyzing them [
33].
2.3.1. Goal and Scope Definitions
Study Purpose
This study sought to compute and assess the environmental burdens generated from various kinds of adjusted asphalt mixtures used in the construction of the binder course layer of flexible pavements through conducting an LCA. The LCA outcomes for asphalt mixtures modified with RAP and/or polyethylene were compared to those for a basic asphalt mixture to appraise the best scenario for adjusted asphalt mixtures from an environmental perspective.
Functional Unit (FU)
The functional unit of a life cycle assessment study represents the central core of any study. It is considered a basic reference for all inputs, outputs, and the environmental impact by using the same functional unit for different asphalt mixtures to provide an accurate comparison.
The samples in this study were gathered from the Cairo–Ismailia Desert Road in Egypt. In this study, the functional unit was defined by the section of the binder course layer of a typical pavement with a length of 1 km, a 1 m width, and a 6 cm thickness.
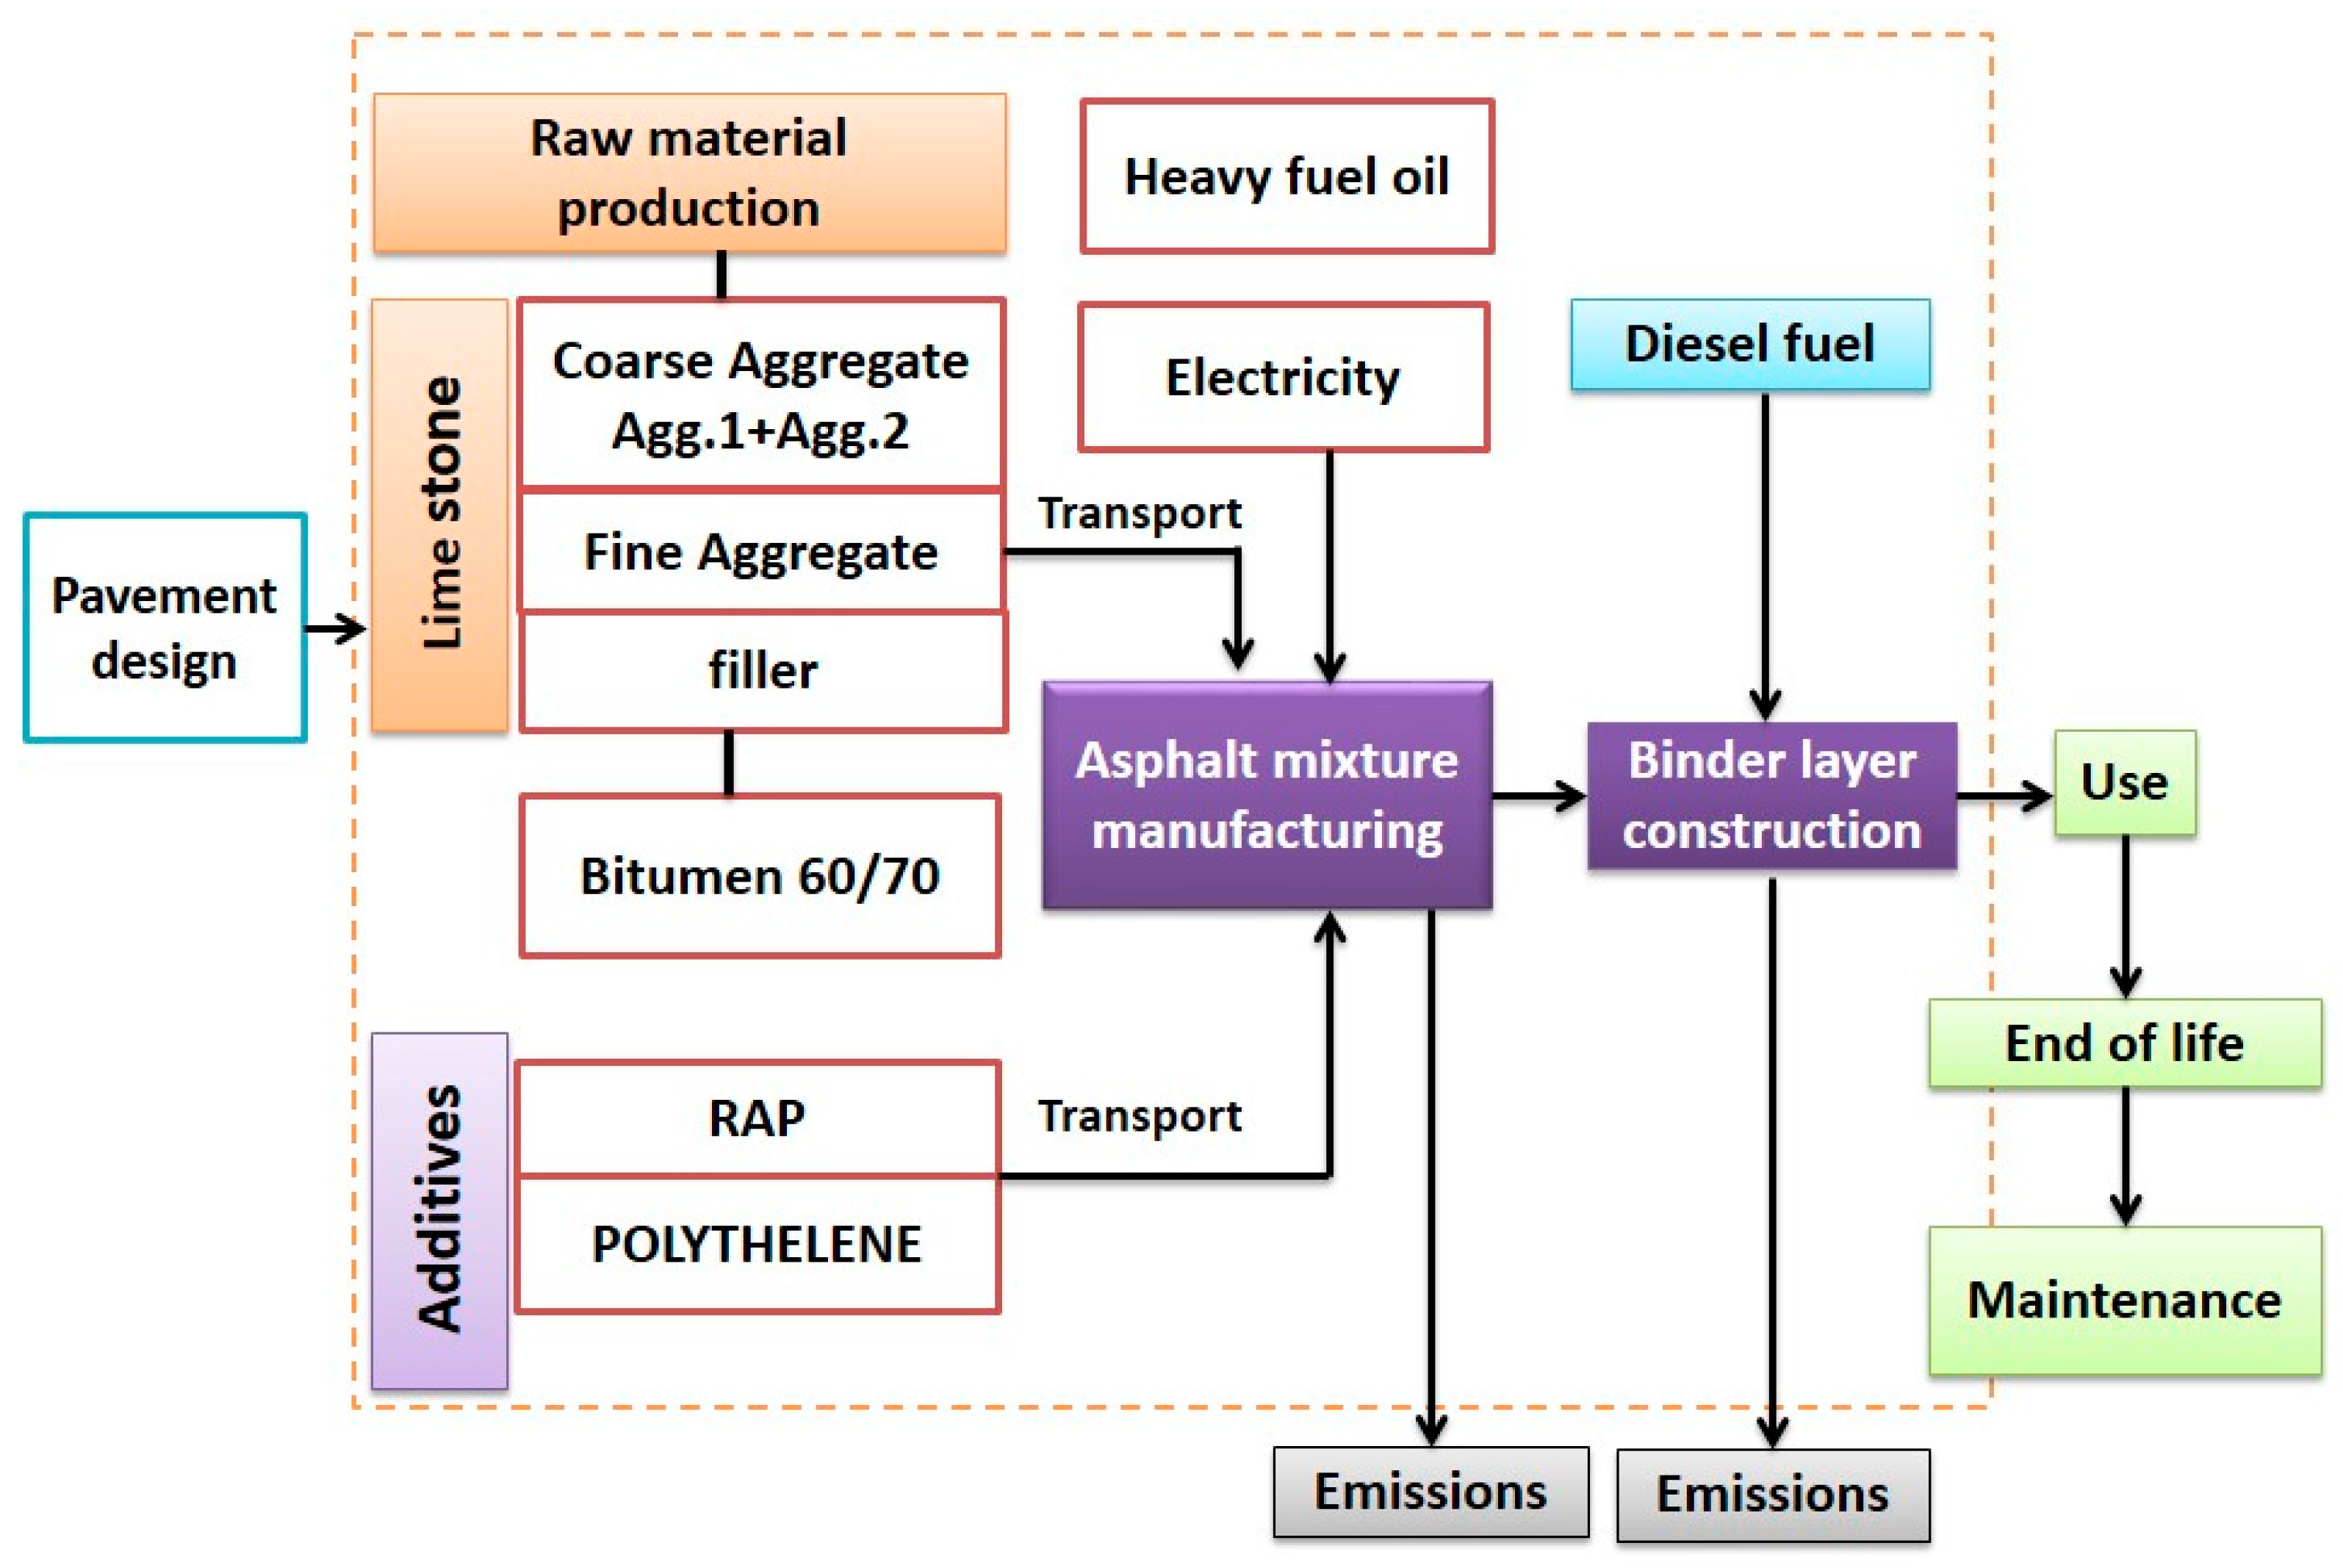
System Description and Boundaries
Choosing the boundaries of the system and the information that contains the life cycle inventory is necessary because, through them, the goal of the study was determined [
34]. System boundaries affected the results of the study. The pavement construction process goes through several stages: making a pavement design, producing raw materials, producing the asphalt mixture, constructing the pavement, using the pavement, maintaining the pavement, and then the end of the pavement’s life span. The system boundaries for this study contain four processes: the production of raw materials, the manufacturing of asphalt mixtures, the transportation of materials, and the creation of the binding mixture. The boundaries of the selected pavement life cycle phase are shown in
Figure 8.
2.4. Life Cycle Inventory (LCI)
The data collection process is generally carried out from different sources that may not be compatible with the functional unit of the current study. Therefore, it is modified to suit the goal of the study. This part includes a complete description of the input data for the life cycle assessment and illustrates the general specifications for the asphalt mixture production processes.
In addition, the Ecoinvent V3.6 database was used to collect LCI data on material supplies, resources, and the mixture transportation process. To analyze the results and evaluate the environmental impacts, SimaPro Software V9.1 was used.
2.4.1. Raw Material Production Stage
In general, asphalt mixtures consist of natural aggregates and binders. During the mixing process, stones and sand were used as coarse and fine aggregates, and limestone powder and bitumen were used as a binder. The design specifications and standards are determined in accordance with the AASHTO Interim Guide.
2.4.2. Asphalt Mixture Manufacturing Stage
This stage aims to determine the environmental impacts of producing asphalt mixtures. The inventory data for the asphalt plant were estimated according to the Nile General Company factory. This factory has an average lifespan of about 50 years, and its annual production is estimated at about 204,400 tons of asphalt. This factory contains 4 cold feed boxes, 4 screens, 1 rotary dryer, 1 mixer, 1 burner, 1 boiler, 1 filter unit, 1 large silo for filling, 3 large bitumen tanks, 2 solar tanks, 1 air compressor, and a conveyor belt. The service life of all machines is estimated at 20 years, except for the conveyor belt, which is estimated at 15 years.
Figure 9 presents the general layout of the General Nile Company Mix Plant [
35].
2.4.3. Transportation Stage
Material transportation operations cause an environmental impact as a result of emissions resulting from the fuel combustion process during its transportation from sources, then to the mixing station, and then to the construction site. LCI data for material transport operations depend on the type of vehicle and the distance traveled.
Table 8 displays the applied distances for all the transport distances for the raw materials and asphalt mixtures used in this study.
2.4.4. Binder Course Construction Stage
Environmental impacts appear at this stage as a result of emissions generated by the combustion of equipment during spreading and compacting the asphalt layer. LCI data for the construction equipment (finishing and heavy vibrating roller) were collected according to the Arab Contractors Company. The characteristics of energy consumption by equipment are shown in
Table 9.
2.4.5. Mass Balances for Different Asphalt Mixtures
The LCI for all the processes and the mass balance and energy of the three asphalt mixes (control, 50% RAP, and 2% polyethylene instead of 50% RAP) were calculated as shown in
Table 10.
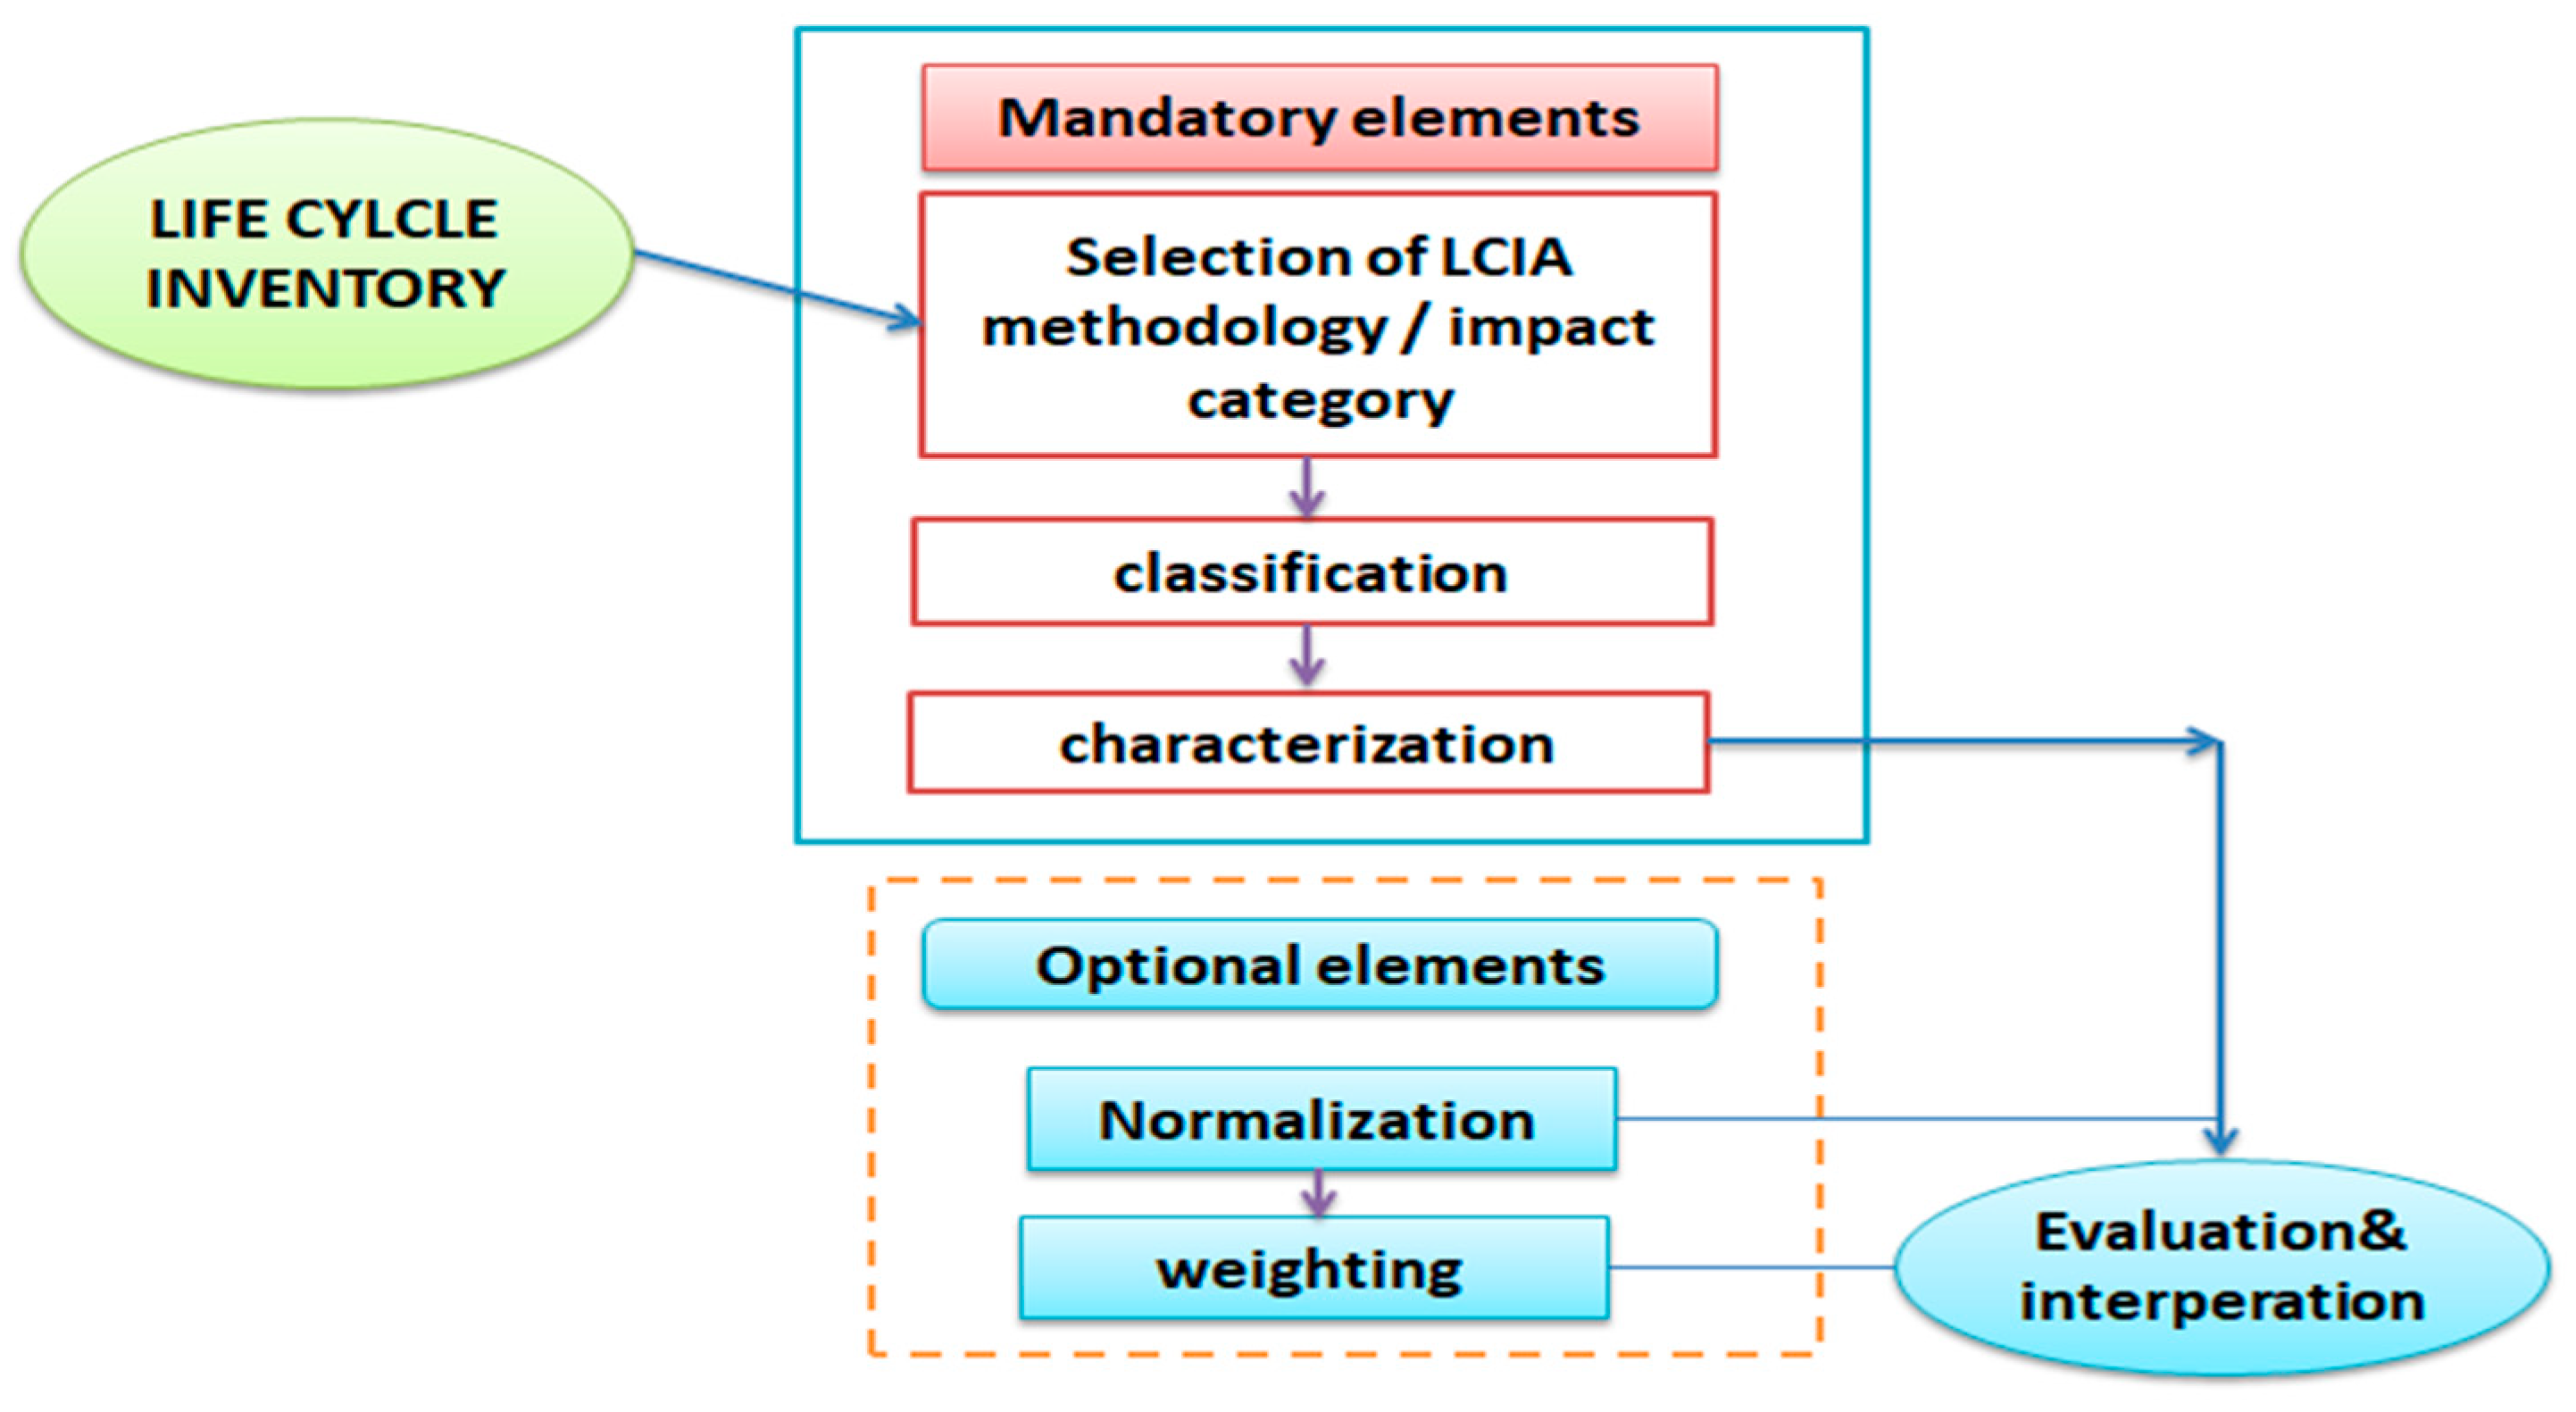
2.5. Life Cycle Impact Assessment (LCIA)
Through the LCIA process, the extent and importance of any potential or practical environmental impacts during its life cycle were calculated. The impact assessment used in this study was the ReCipe 2016 Endpoint. According to ISO 14042, 2000 [
36], the LCIA consists of mandatory and optional elements, as illustrated in
Figure 10, and it can proceed through the following steps:
Mandatory Steps
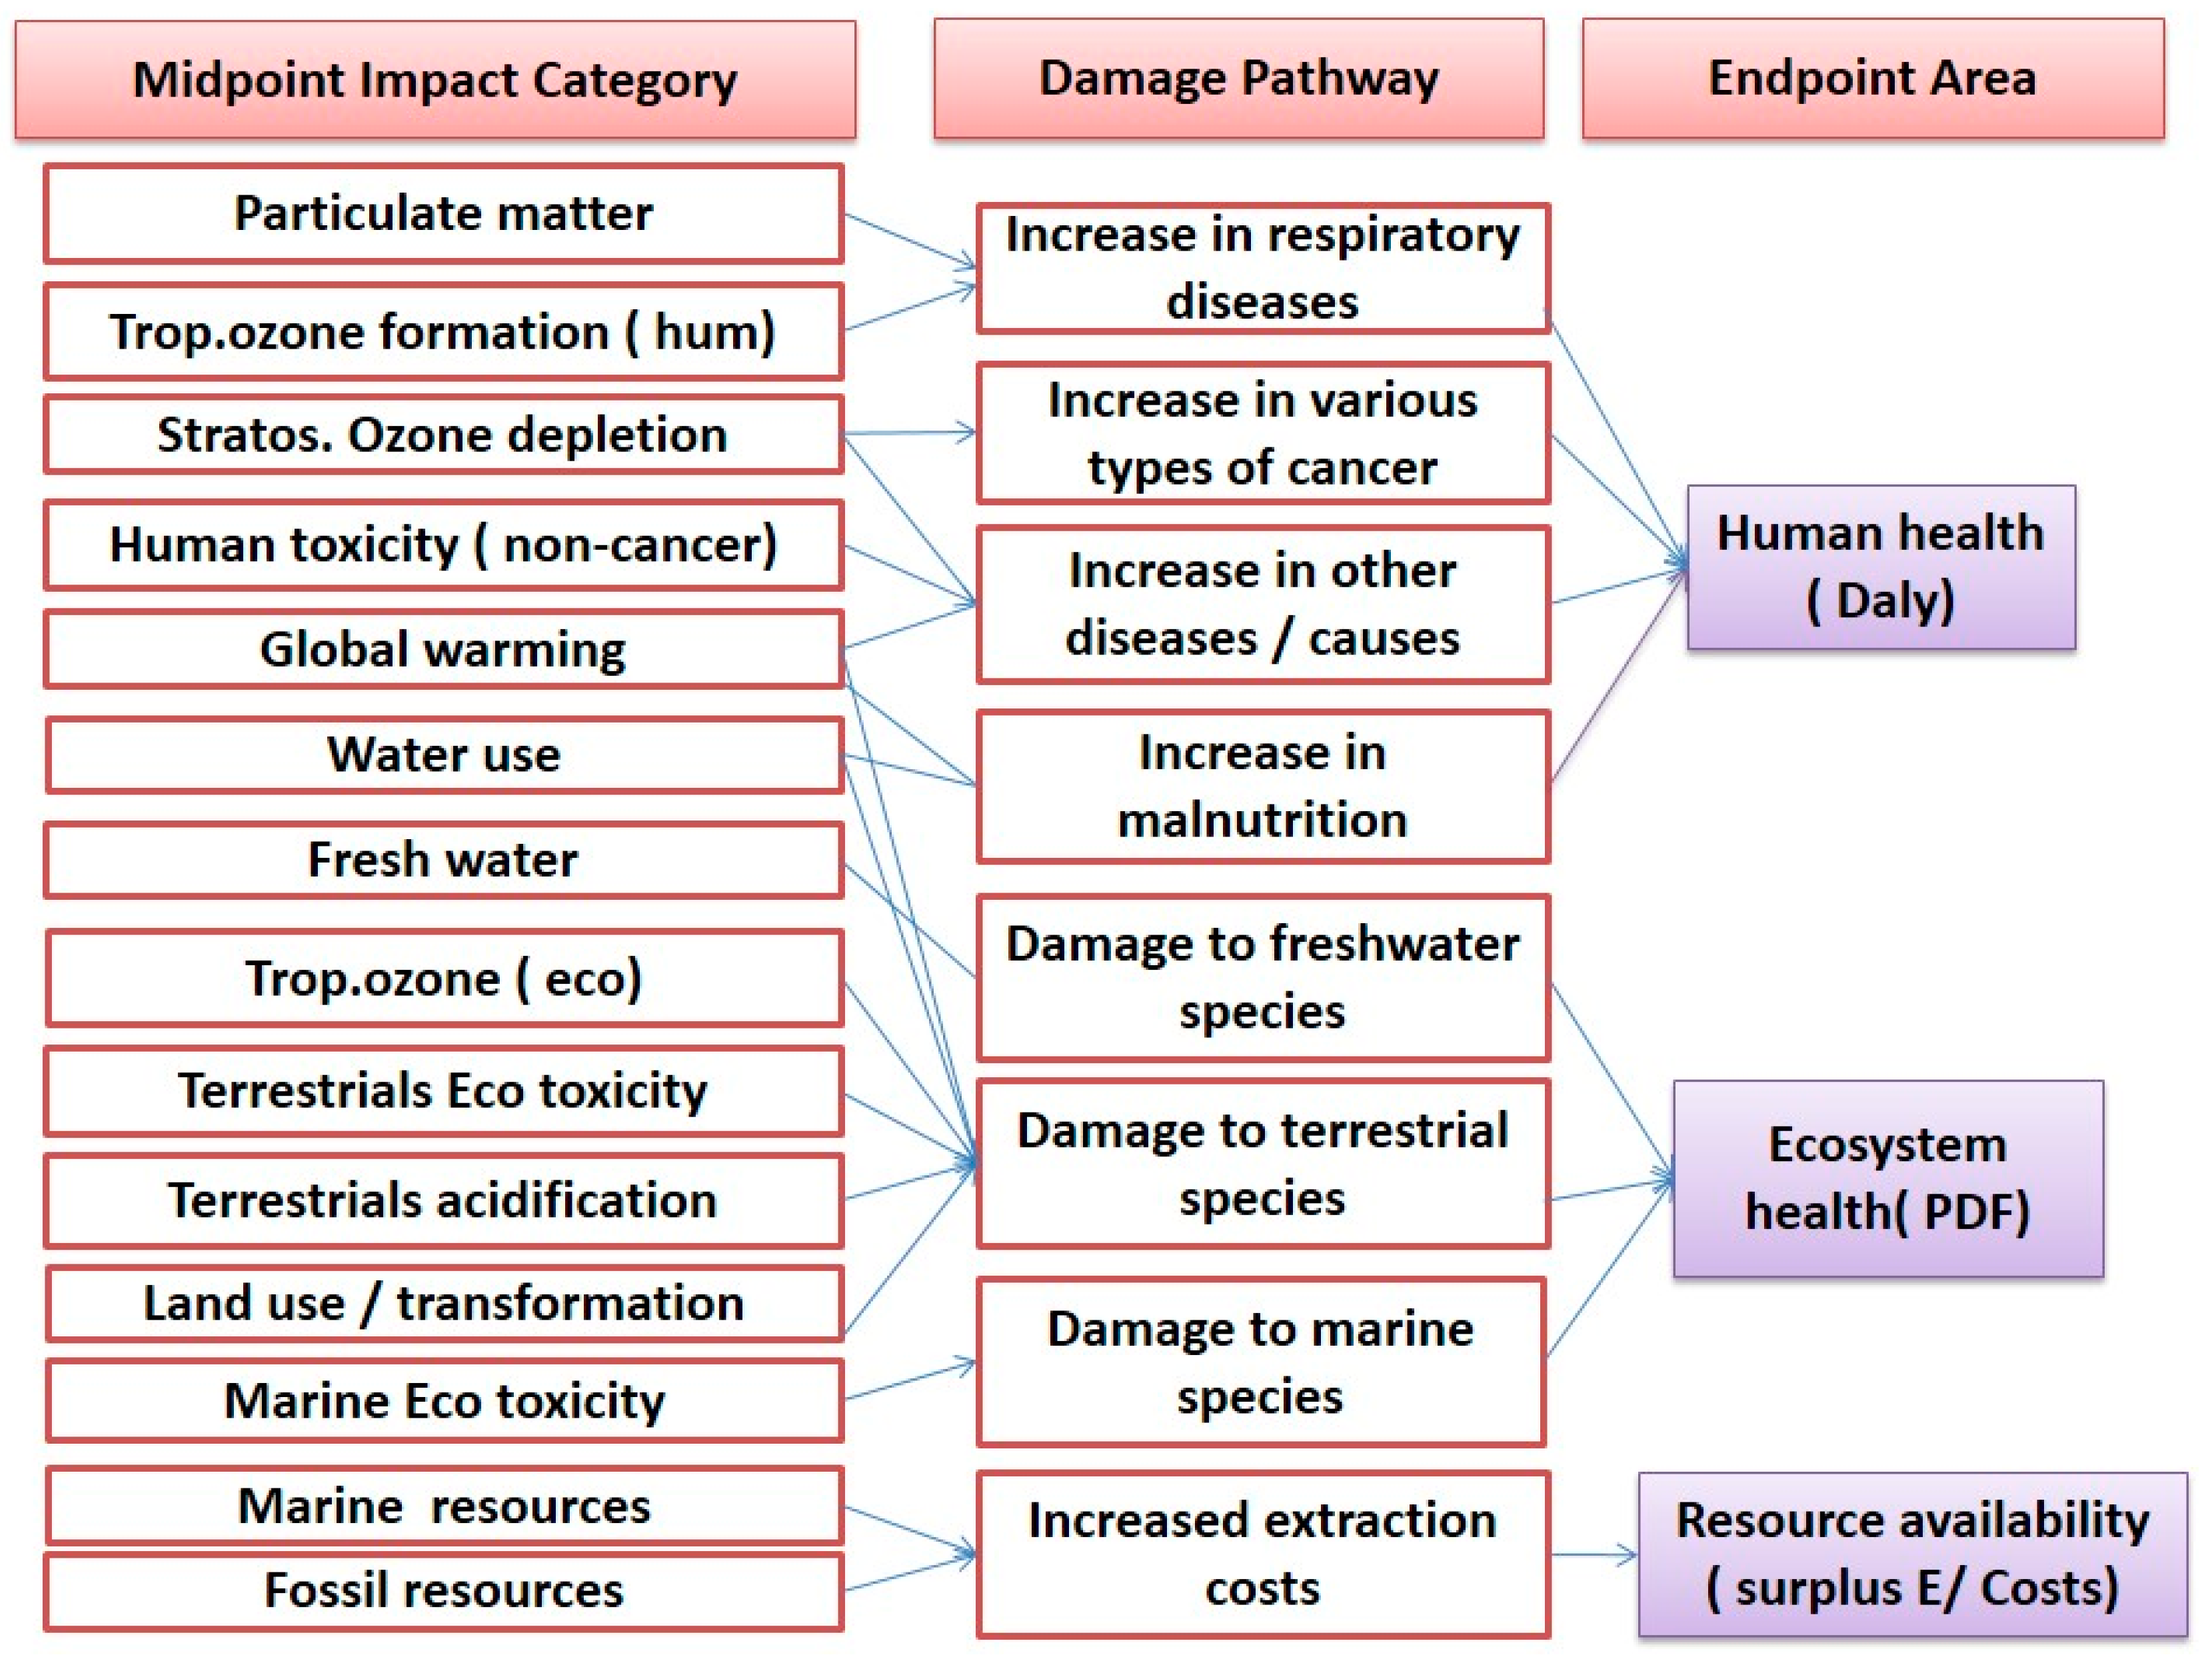
In this study, the ReCipe 2016 method was selected to be applied to and evaluate the environmental burdens on the various asphalt mixtures. Characterization factors were divided into two mainstream techniques (midpoint level and endpoint level), as illustrated in
Figure 11. ReCipe computes eighteen midpoint indicators and three endpoint indicators.
The midpoint indicators emphasize a single environmental impact, for instance, the ozone layer or ecotoxicity. The endpoint indicators display the environmental burdens on three greater aggregation levels:
- ✓
Human health: respiratory organics, climate change, carcinogens, inorganic respiration, the ozone layer, and radiation.
- ✓
Ecosystem quality: eutrophication, acidification, ecotoxicity, and land use.
- ✓
Resources: fossil fuels and minerals.
3. Results and Discussion
3.1. Marshall Mix Results for Control Mix
The mechanical properties of the control mix, which contained ratios of natural aggregates with asphalt ratios from 3.5 to 5.5% with an increment of 0.50 to determine the optimum asphalt binder content, are shown in
Table 11. According to the results, the study showed that the best content of bitumen is found to be equal to 4.4% of the weight of the total mix, which fulfills the specifications of the Egyptian code.
A summary of the results for all the mixtures—the conventional mixture, mixtures containing different percentages of RAP, and mixtures containing different percentages of polyethylene—is presented in
Table 12.
3.2. Results for Asphalt Mixes Modified by Different Percentages of RAP
A summary of the results for the control mixture, mixes containing different percentages of RAP, and mixes containing different percentages of polyethylene is presented in
Table 12.
Figure 12 and
Table 12 show the OBC values for various amounts of RAP. The lowest value for bitumen content was at 50% RAP. As the RAP contents increased from 0% to 50%, the OBC decreased by about 19.1%. The increase in the amount of RAP led to an increase in the OBC due to the increase in the amount of bitumen, which was contained inside the RAP because of the increase in the RAP percent from 25% to 100%.
Figure 13 and
Table 12 show the density of the control mix and mixtures modified with different percentages of RAP contents. Increasing the RAP content from 0% to 100% slightly decreases the bulk density. The decrease in the bulk density value could be attributed to an increase in bitumen percent, which was contained inside the RAP. Also, we replaced the same weight of raw aggregate with RAP, which consisted of aggregate and bitumen with a low specific gravity, and this was the reason behind the decreasing density. However, the decrease in the bulk density and the increase in the OBC from M1 to M4 were insignificant.
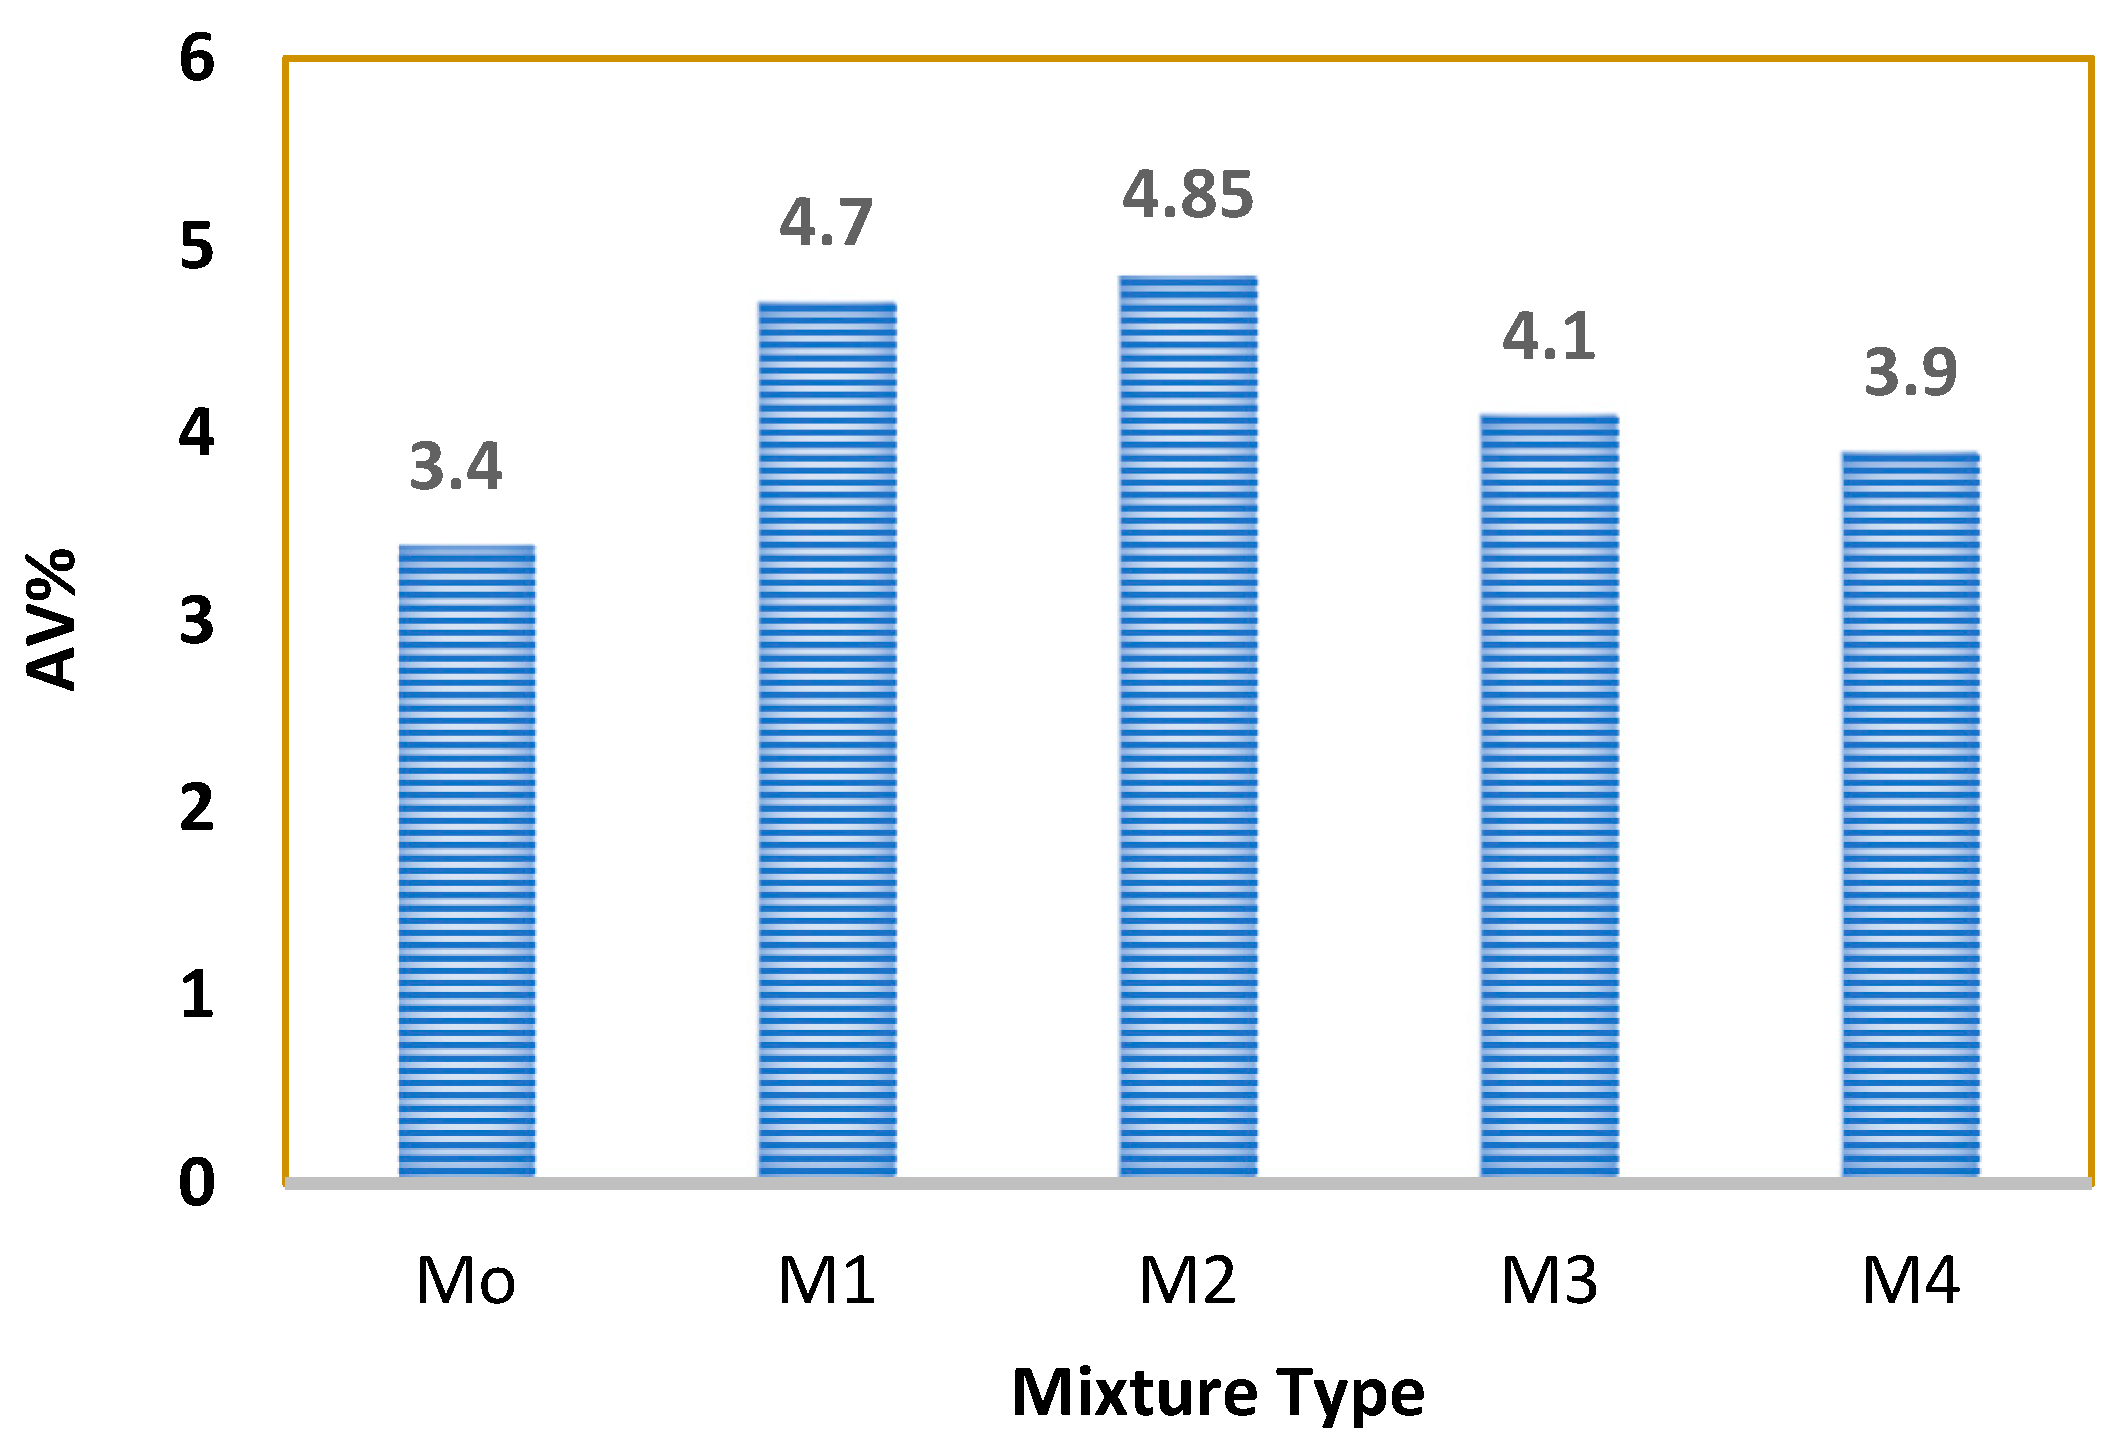
Figure 14 and
Table 12 exhibit the Marshall air voids of the control mix and the mixes modified with different percentages for RAP contents. The addition of RAP in an amount of 25% up to 100% increased the number of air voids compared with the number in the control mix. This was due to the constant particle size of the RAP, which was 79% less than three-quarters of an inch and had no percentage passing through a sieve with half-inch holes, as shown in
Table 4. This replaced the 3D gradation for the normal mix, as shown in
Table 3.
Figure 14 also illustrates that the number of air voids increases with an increasing RAP percent from 0% to 50% and then decreases from 50% to 100%; this is due to the compound effect of increasing the RAP percent when it has a constant particle size, as discussed before, and increasing the bitumen percent contained inside the RAP. Increasing the RAP content from 0% to 50% increases the number of air voids by 42.65%. A decrease in the air void percent from 50% to 100% results from increasing the OBC in mix M3 (75% RAP instead of the weight of coarse aggregate) and M4 (100% RAP instead of the weight of coarse aggregate), as shown in
Figure 12 and
Table 12. All numbers of air voids for the mixtures with different percentages of RAP meet the limits of Egyptian standards.
Figure 15 and
Table 12 illustrate that all the stability results satisfy the minimum specification limits of Egyptian specifications. Also, increasing the RAP proportions and, therefore, bitumen percent, which was contained inside the RAP, decreased the stability of asphalt mixtures. The addition of RAP in percentages of 25%, 50%, 75%, and 100% decreased the results of stability by 14.38%, 18.75%, 21.56%, and 22.88%, respectively.
The stability values decrease with an increase in the RAP amount, and this is due to the presence of reused aggregate in the RAP instead of virgin aggregate, which makes the mixture less stiff. But, with an increase in both the RAP content and polyethylene, the stiffness increased. Also, adding RAP only decreases the stiffness. This confirms the idea that using RAP alone is not enough as a recycled material.
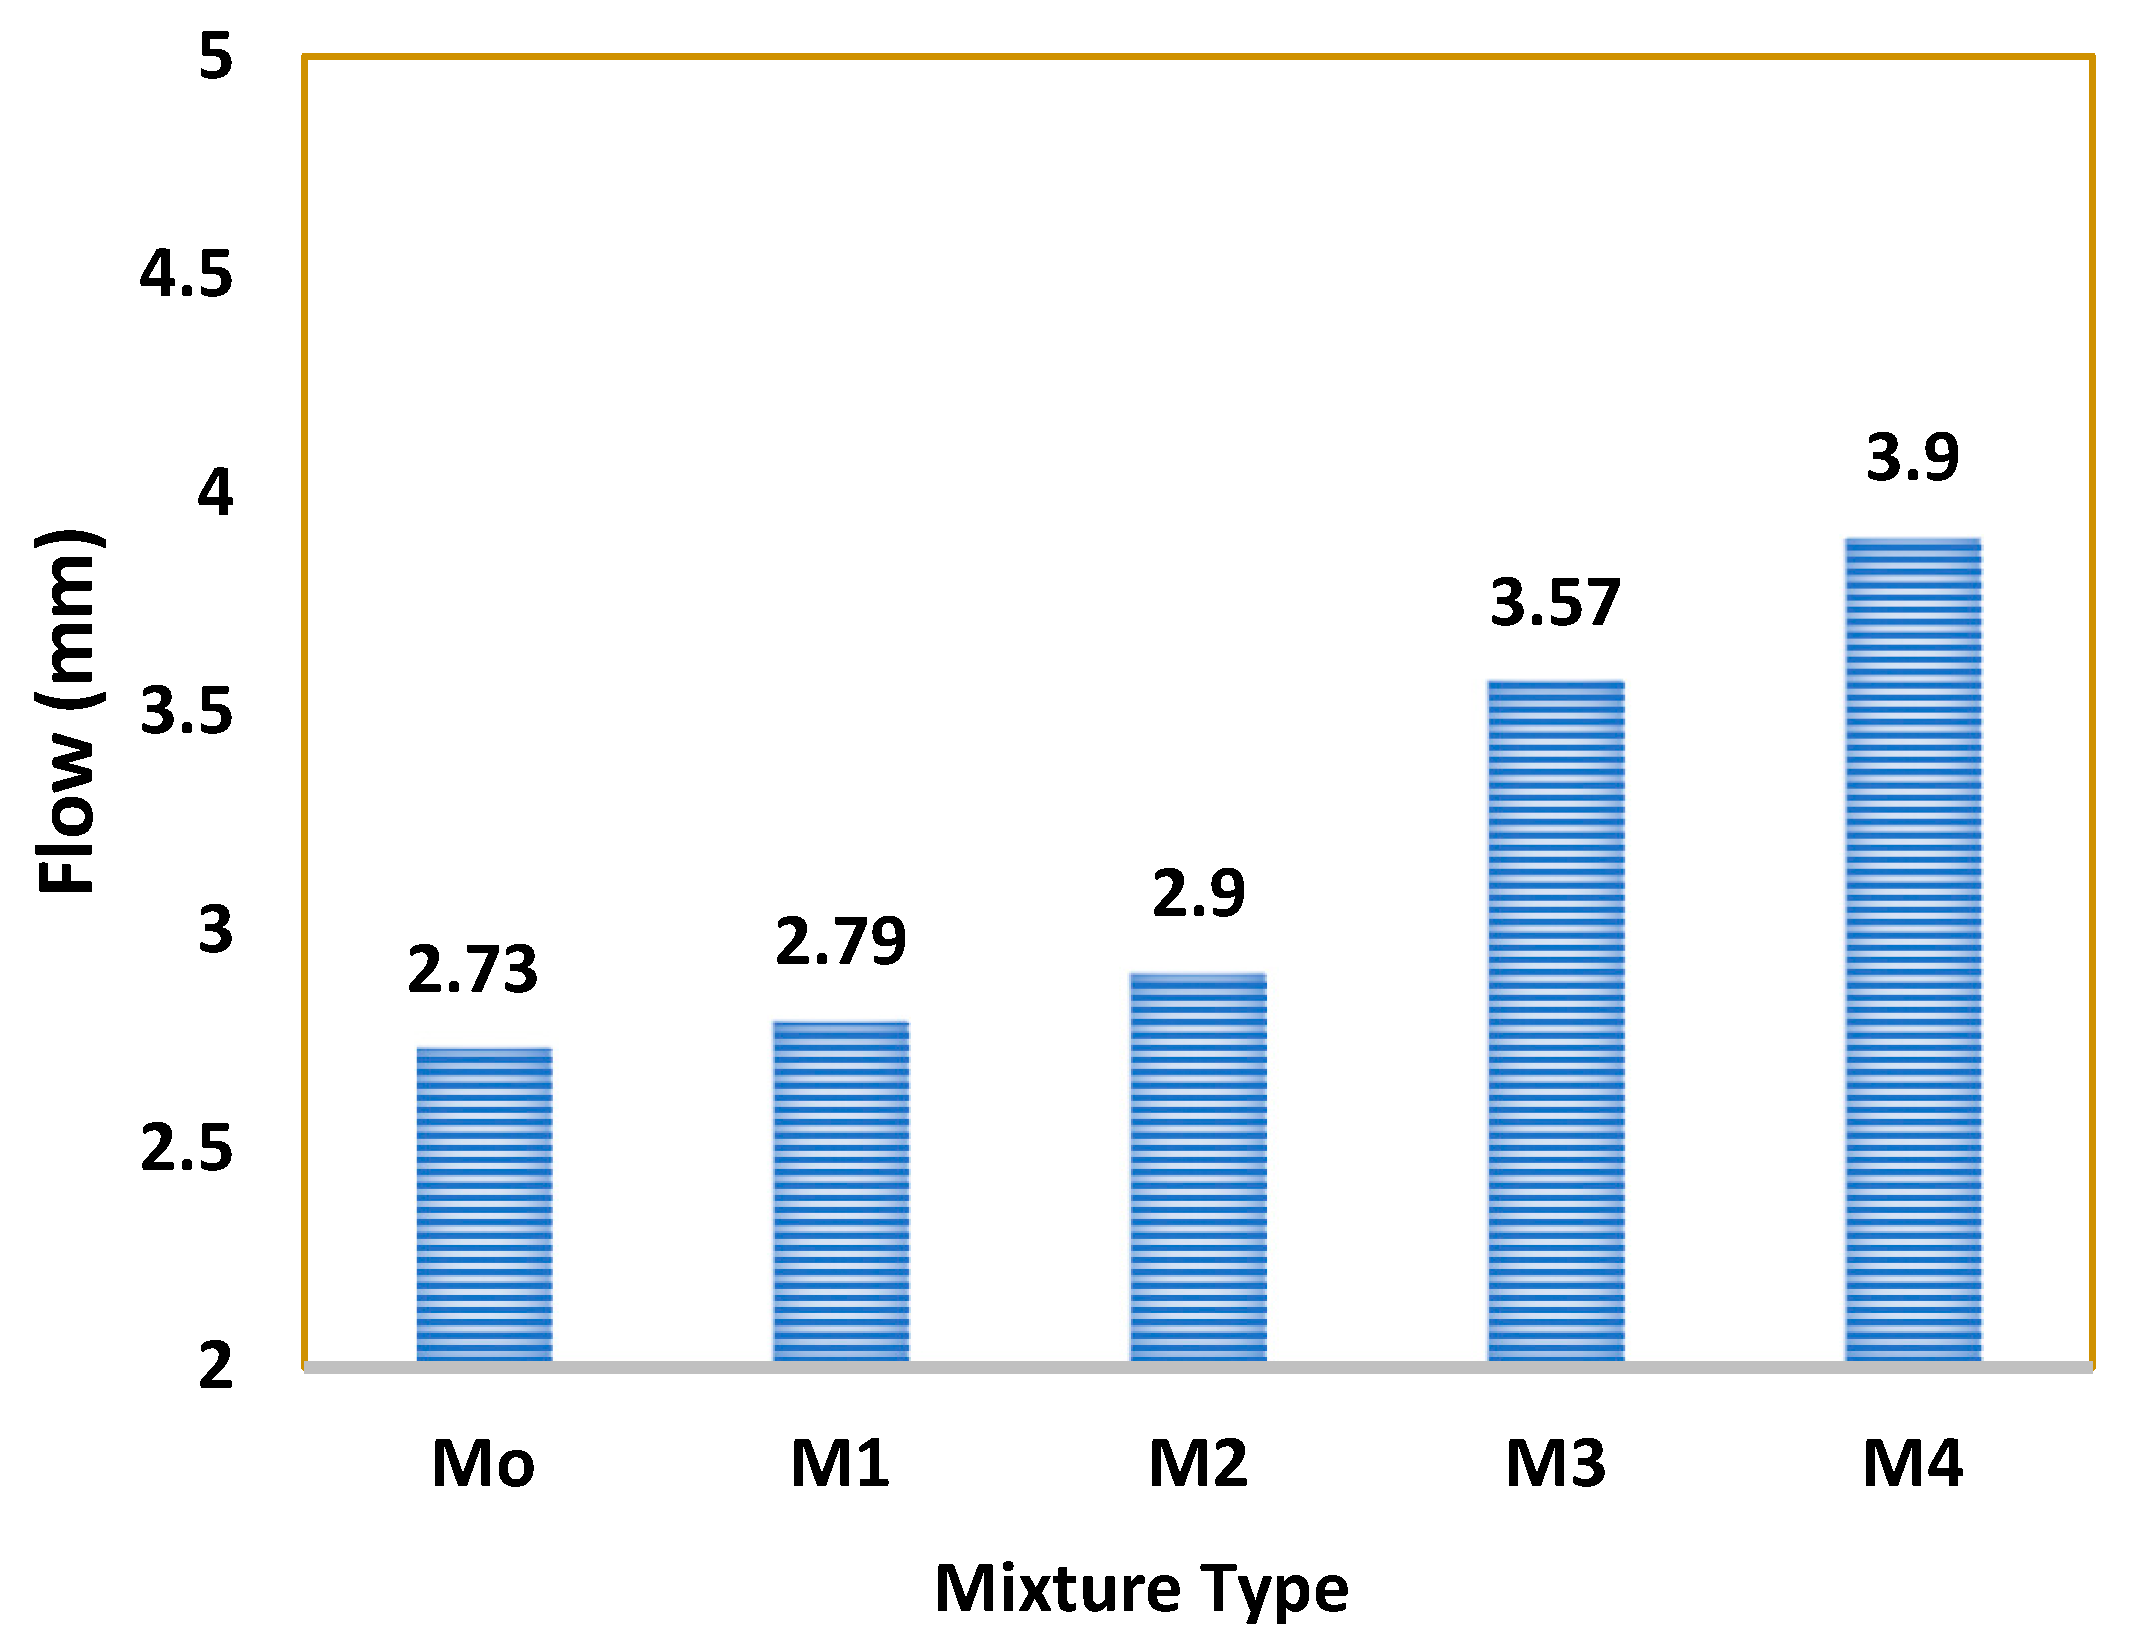
Figure 16 and
Table 12 show the Marshall flow for the control and modified mixtures with different percentages of RAP contents. Increasing the percentage of RAP from 0% to 50% increased the value of flow from 2.73 mm to 2.9 mm, which is approximately near the middle of the limits of the specifications. Increasing the percentage of RAP from 0% to 100% increased the value of flow from 2.73 mm to 3.9 mm, which is approximately near the upper limit of the specifications. The increase in the flow value is attributed to the increase in the bitumen percent, which is contained inside the RAP.
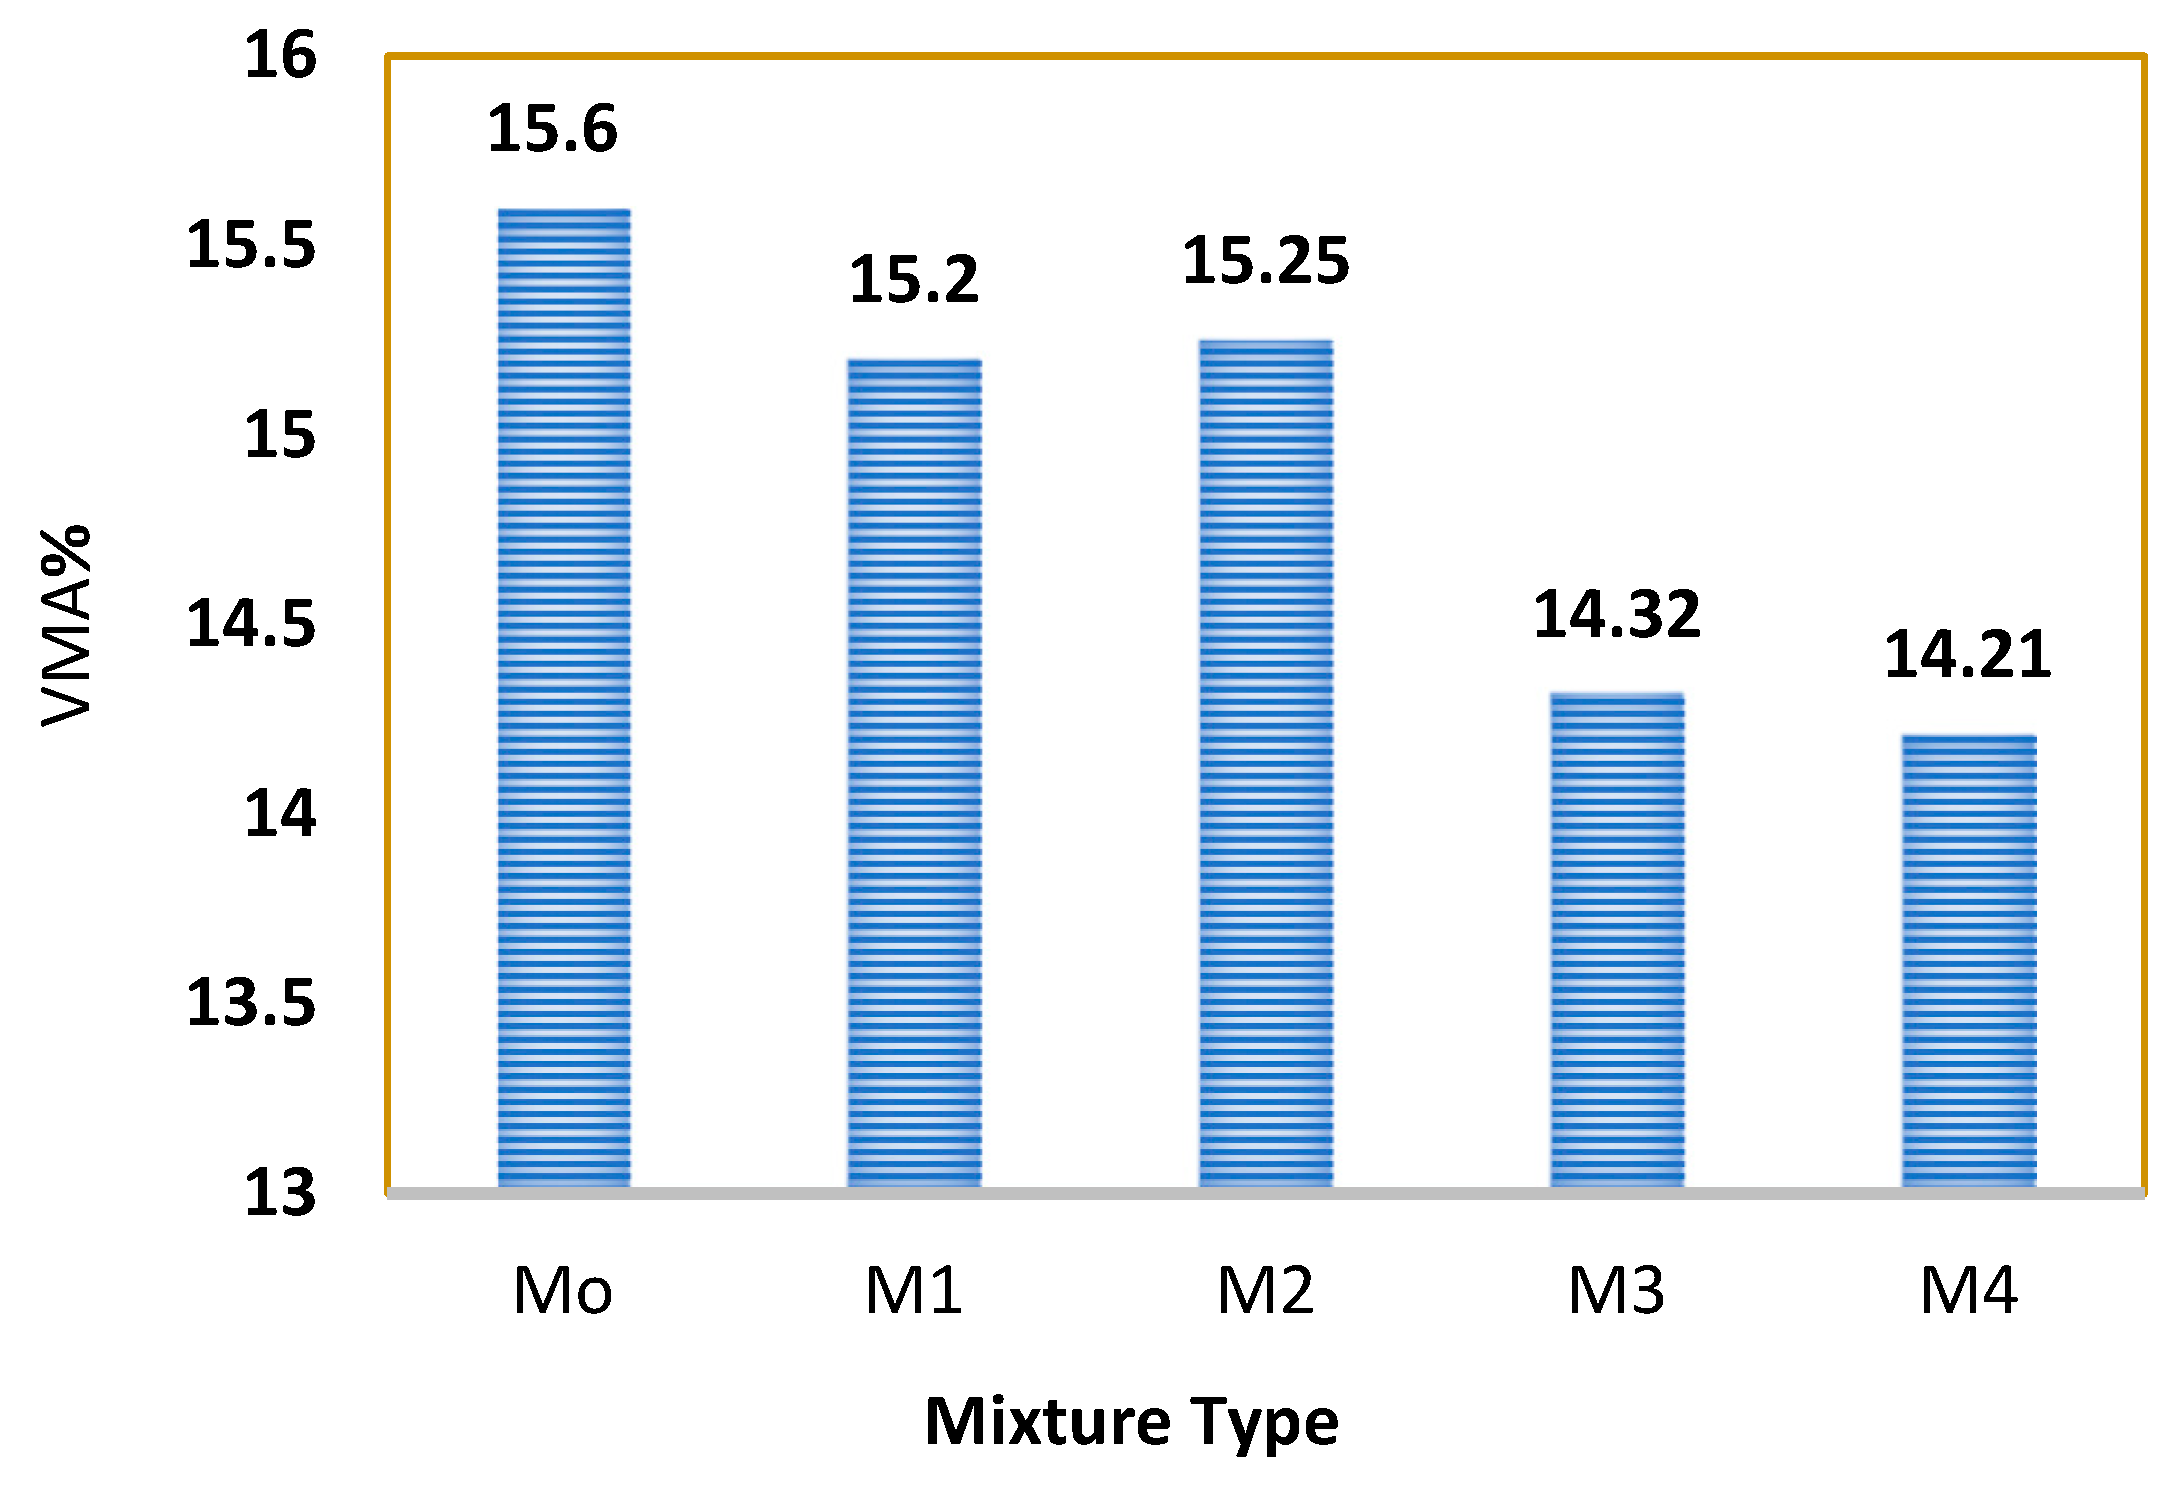
Figure 17 and
Table 12 show the Marshall voids in the mineral aggregates (VMA) of the control mix and mixes modified with different percentages of RAP contents. The number of VMA decreased with an increasing RAP ratio. A lower number of VMA was recorded for mixture No. 4. All the mixtures lay within the specification range according to the Egyptian code.
Analyzing the results for the asphalt mixtures modified with recycled aggregates, all the RAP percentages meet the limits of the Egyptian standards. Adding RAP to the mix in a 50% proportion can help save more natural aggregate, consume more RAP, and reduce the percentage of used bitumen required to manufacture asphalt concrete mixtures. This is one thing that will reduce the cost and environmental impact. A comparison between the properties of the asphalt mixes modified with 50% RAP (M2) and the conventional mix (M0) is illustrated in
Table 13.
3.3. Results for Asphalt Mixes Modified with RAP and Polyethylene
Figure 18 and
Table 12 show that increasing the polyethylene percentages by 1%, 2%, 3%, and 4% instead of adding 50% RAP decreased the bulk density values compared with the control mix by 4.26%, 5.11%, 6.81%, and 7.23%, respectively. The decrease in bulk density shows the effect of adding polyethylene.
Figure 19 and
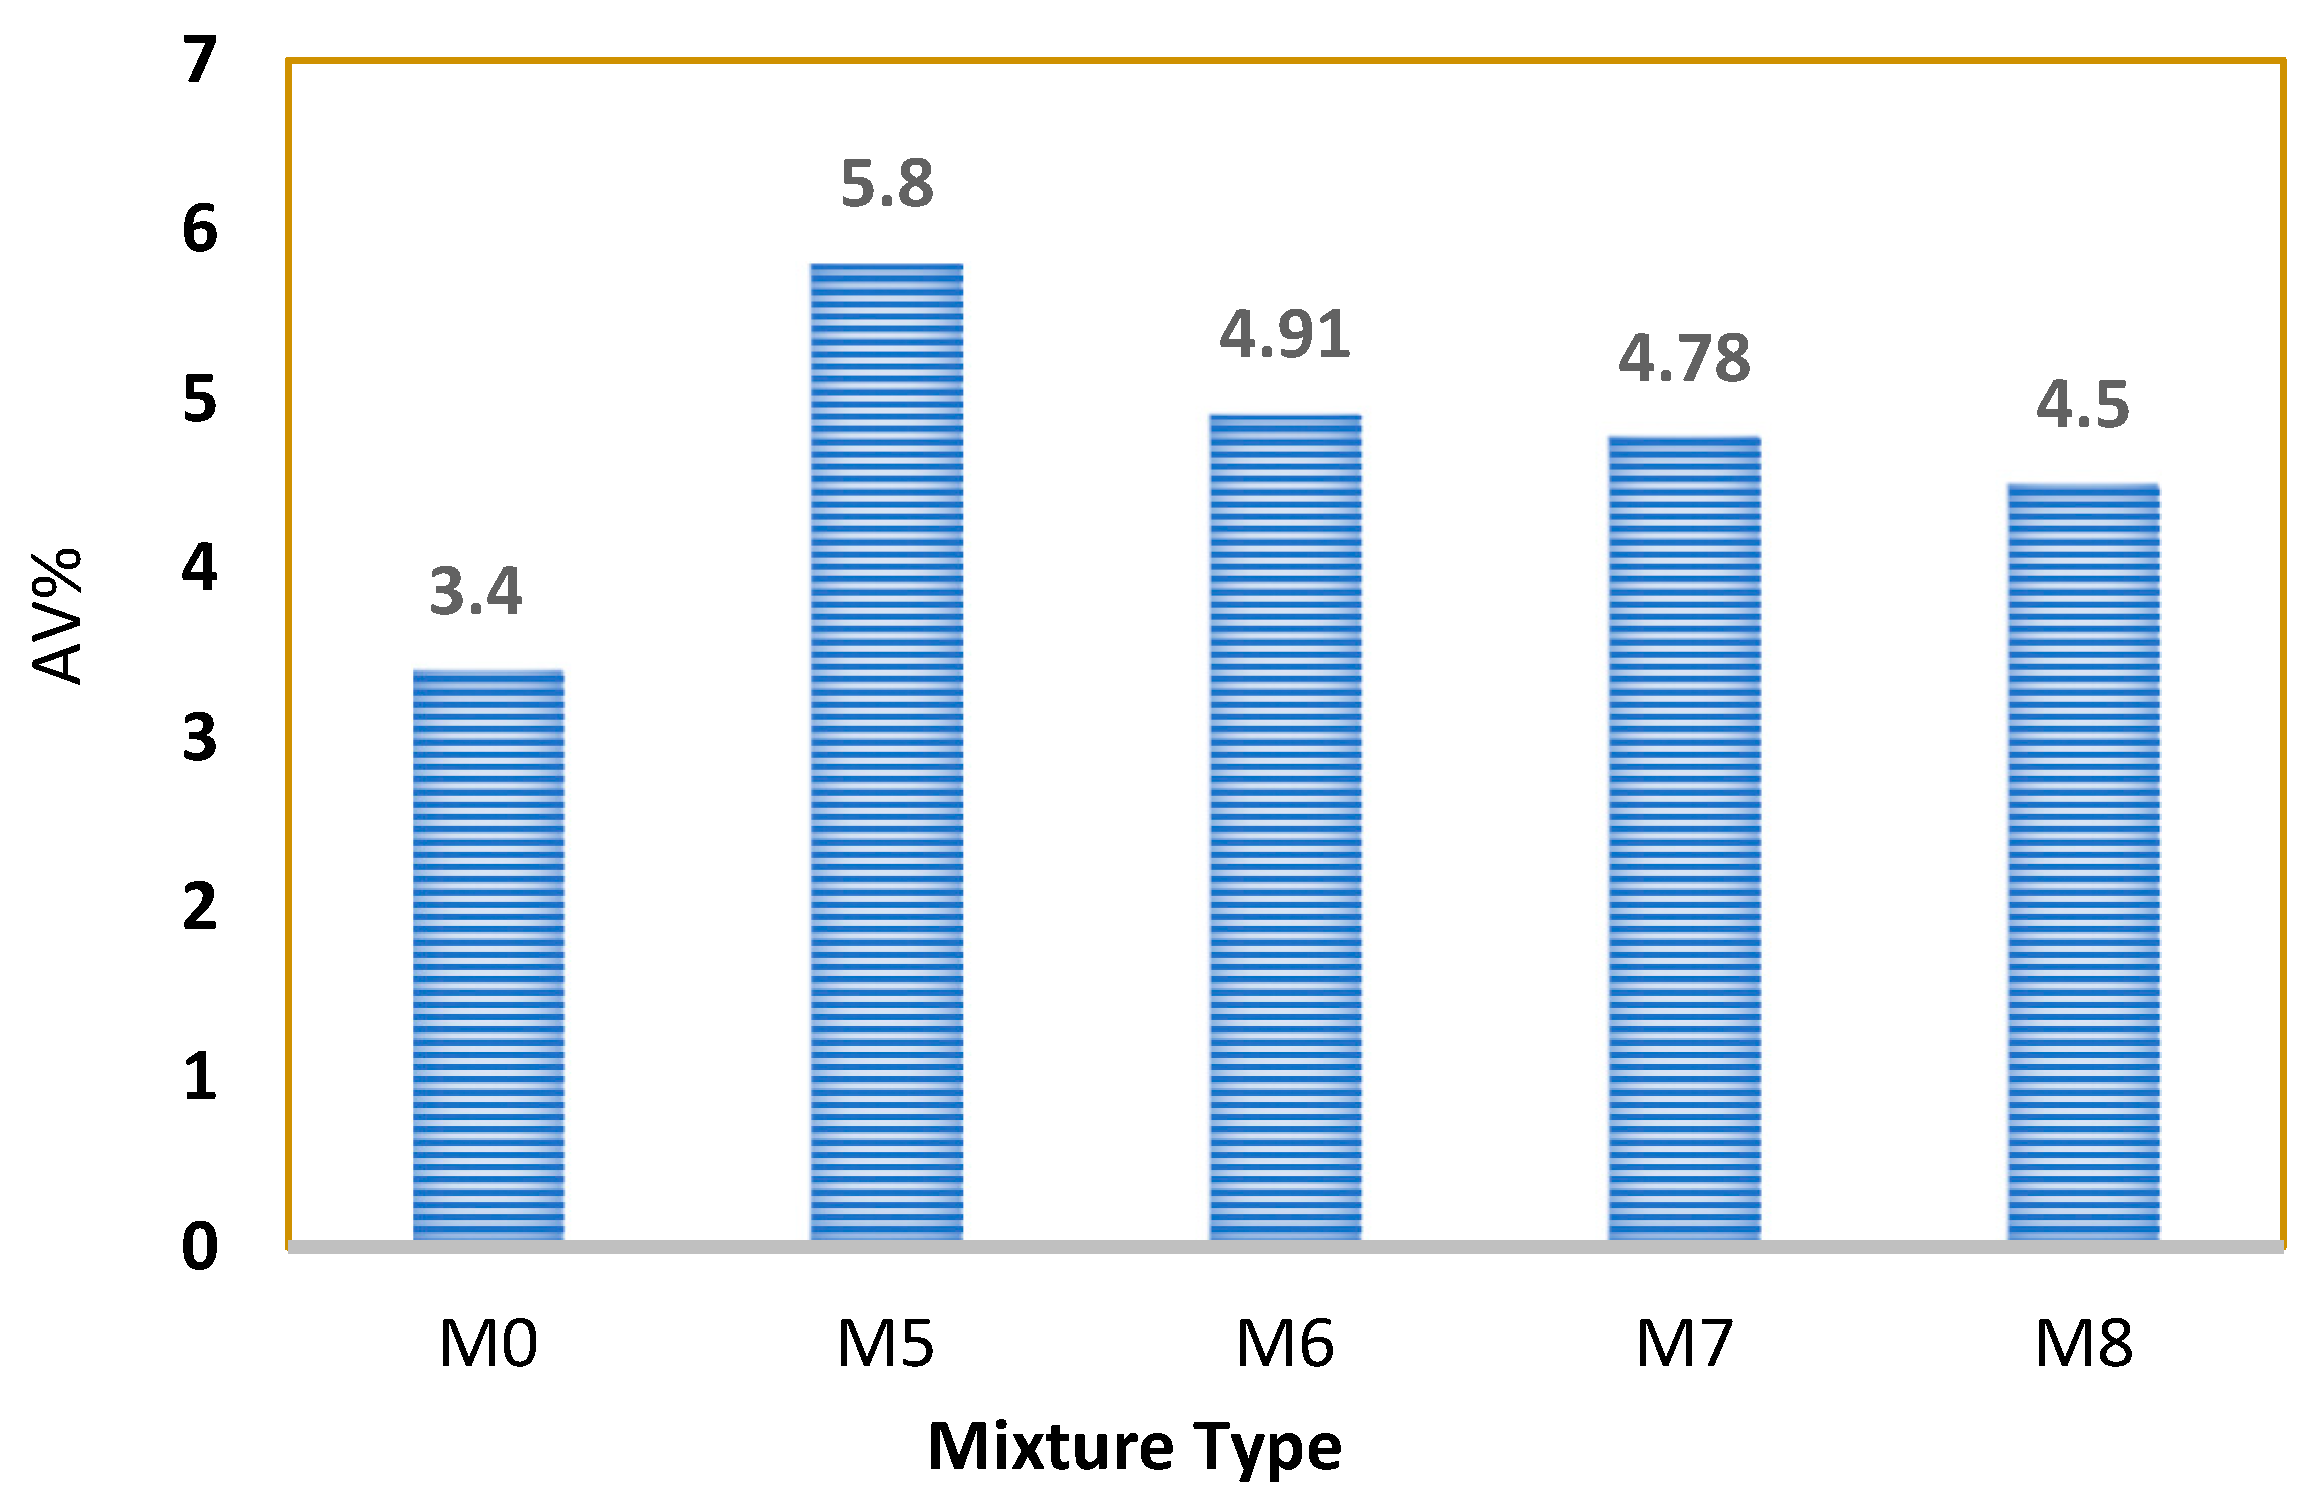
Table 12 show that increasing the polyethylene percentages by 1%, 2%, 3%, and 4% instead of adding 50% RAP increased the air void values compared with the control mix by 70.59%, 44.41%, 40.59%, and 32.35%, respectively. The air void values for all the mixes modified by polyethylene satisfy Egyptian standards. The increase in air voids in the RAP polyethylene mixes compared with the control mix could be attributed to replacing the RAP amount with virgin coarse aggregate. Adding polyethylene percentages from 1% to 4% instead of 50% RAP decreased the air void values by 22.41%. This is because of the remaining polyethylene which did not melt in the bitumen. The remaining polyethylene plays an important role in closing the mixture voids.
Figure 20 and
Table 12 show that increasing the polyethylene percentages by 1%, 2%, 3%, and 4% instead of adding 50% RAP increased the stability values compared with the control mix by 4.63%, 16.63%, 37.5%, and 47.5%, respectively. The stability values for all the mixes modified by polyethylene satisfy Egyptian standards. The increase in stability shows the effect of adding polyethylene (as a part of the RAP), which is a kind of thermoplastic material. Part of the melted polyethylene reacted with bitumen due to the polyethylene having the highest mixing temperature combined with lowest the melting temperature. This reaction improves the mixture’s stiffness.
The stability of control mix M0 is 1600 kg, while the stability of the mixes which contain RAP only ranges from 1370 kg to 1234 kg. Adding RAP percents ranging from 25% to 100% instead of the weight of coarse aggregate (Pin 2) and then adding 4% polyethylene instead of 50% RAP to the mix increased the stability to 2360 kg. This increase in stability is because of adding polyethylene (as a part of the RAP). A part of the polyethylene was melted in bitumen, and the remaining part of polyethylene, which was not dissolved, was used as an aggregate; both types of polyethylene (melted and not dissolved) help in increasing the Marshall stability.
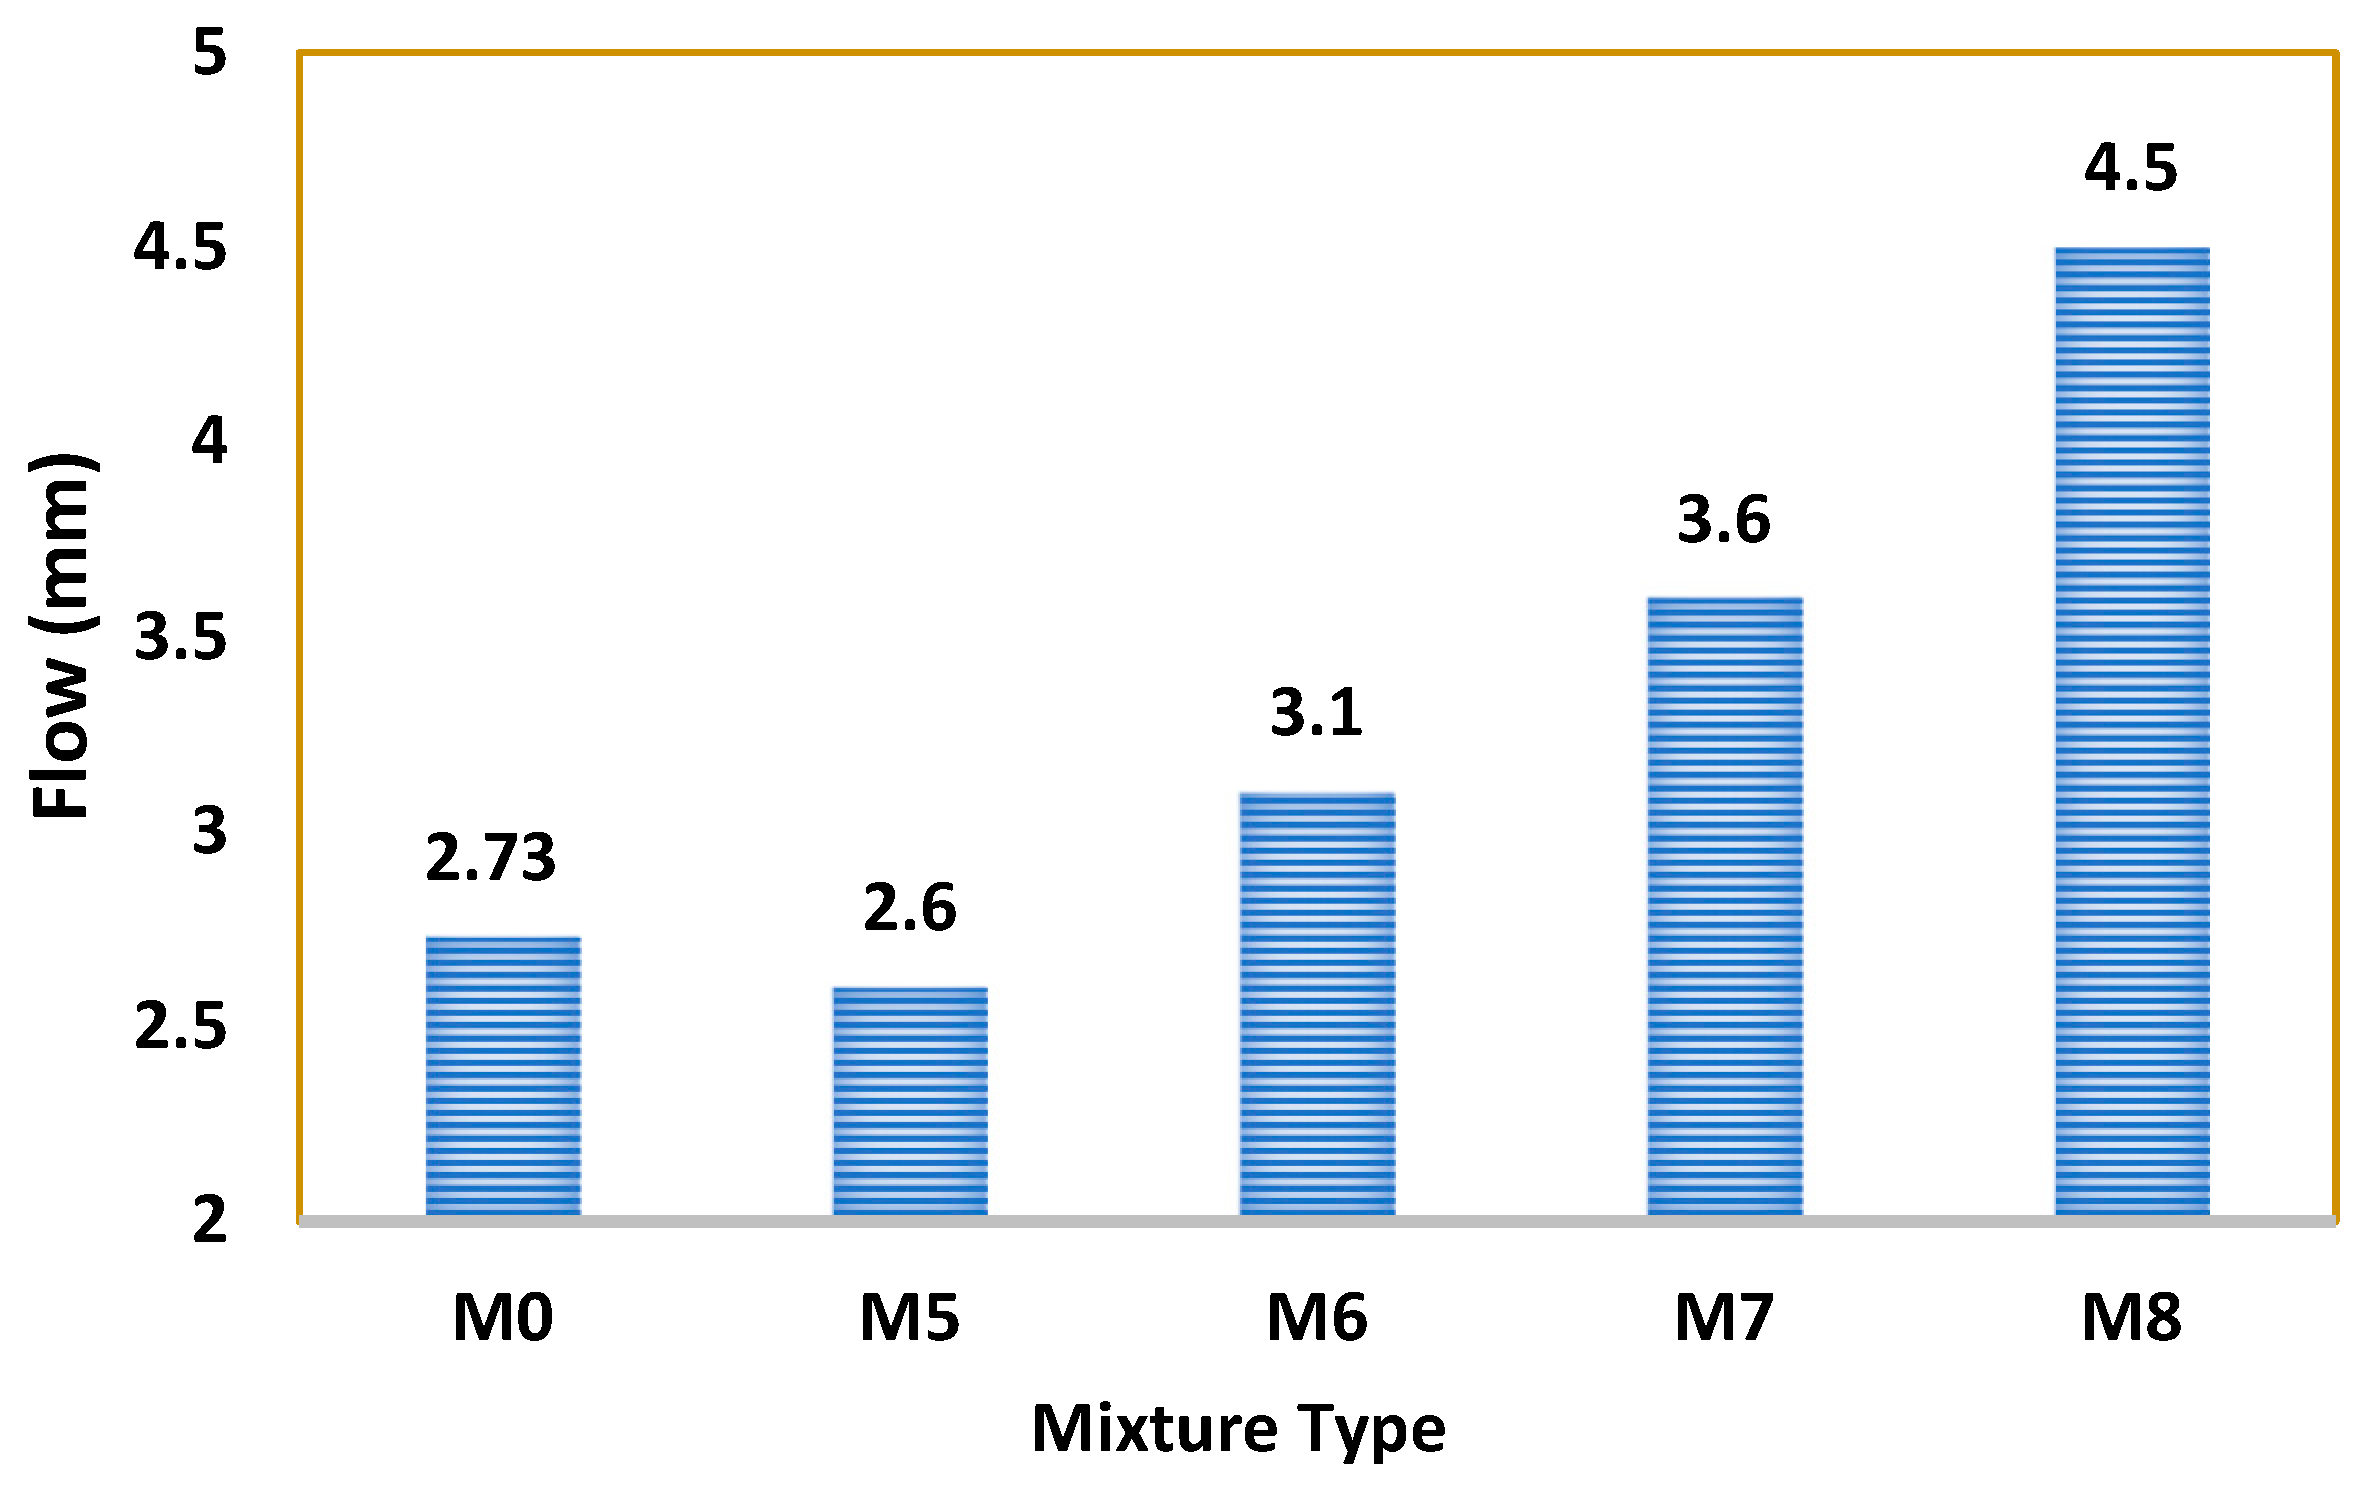
Figure 21 and
Table 12 show that increasing the polyethylene percentages by 1% instead of adding 50% RAP decreased the flow values compared with the control mix by 4.76%. Also, increasing the polyethylene percentage by 2%, 3%, and 4% instead of adding 50% RAP increased the flow value compared with the control mix by 13.55%, 31.87%, and 64.84%, respectively. The flow values for all the mixes modified by polyethylene satisfy Egyptian standards, except for the value of 4% polyethylene. The increase in flow causes an increase in the bitumen percent, which is contained inside the RAP, as well as the melting of some parts of the polyethylene.
Figure 22 and
Table 12 show that increasing the polyethylene percentages by 1%, 2%, 3%, and 4% instead of adding 50% RAP decreased the number of voids in the mineral aggregate compared with the control mix by 3.14%, 2.82%, 2.76%, and 0.2%, respectively. The number of voids in the mineral aggregate for all the mixes modified by polyethylene satisfied the Egyptian standards.
Figure 18,
Figure 19,
Figure 20,
Figure 21 and
Figure 22 display the ratios of 1%, 2%, and 3% of polyethylene instead of the weight of 50% RAP, which meet the limits of the Egyptian standard. A content of 2% polyethylene instead of 50% RAP was chosen, and the declared percent gives medium values for all the Marshall criteria between 1% and 3%, approximately. In addition, the greater amount of polyethylene may lead to many risks for the environmental profile.
Table 14 shows a comparison between the properties of the asphalt mixtures modified with 2% polyethylene instead of 50% RAP (M6) and the control mix’s properties (M0). The performance of the polyethylene-modified asphalt mixtures was proven to be better than that of the conventional mixtures.
3.4. Loss of Stability Results
The durability of the asphalt mixture over time at 60 °C for the mixtures M0, M2, and M6 is evaluated by the loss in stability test.
Figure 23 illustrates that the stability loss for all the mixes increased with the increase in immersion days. The percentages presented in
Figure 23 were calculated based on the results of stability for the same mixes shown in
Table 12. All the results for all the mixtures satisfy the specifications limit (Max 25%) according to LTG 2015 [
10].
After the third day of immersion, the best result was 6.5%, which was obtained for M6. Lower results, 12% and 13%, were obtained for M0 and M2, respectively. The use of RAP alone increased the loss of stability, therefore weakening the durability of the asphalt mixture. On the other hand, adding polyethylene decreased the loss of stability due to the increase in the durability of the asphalt mixture.
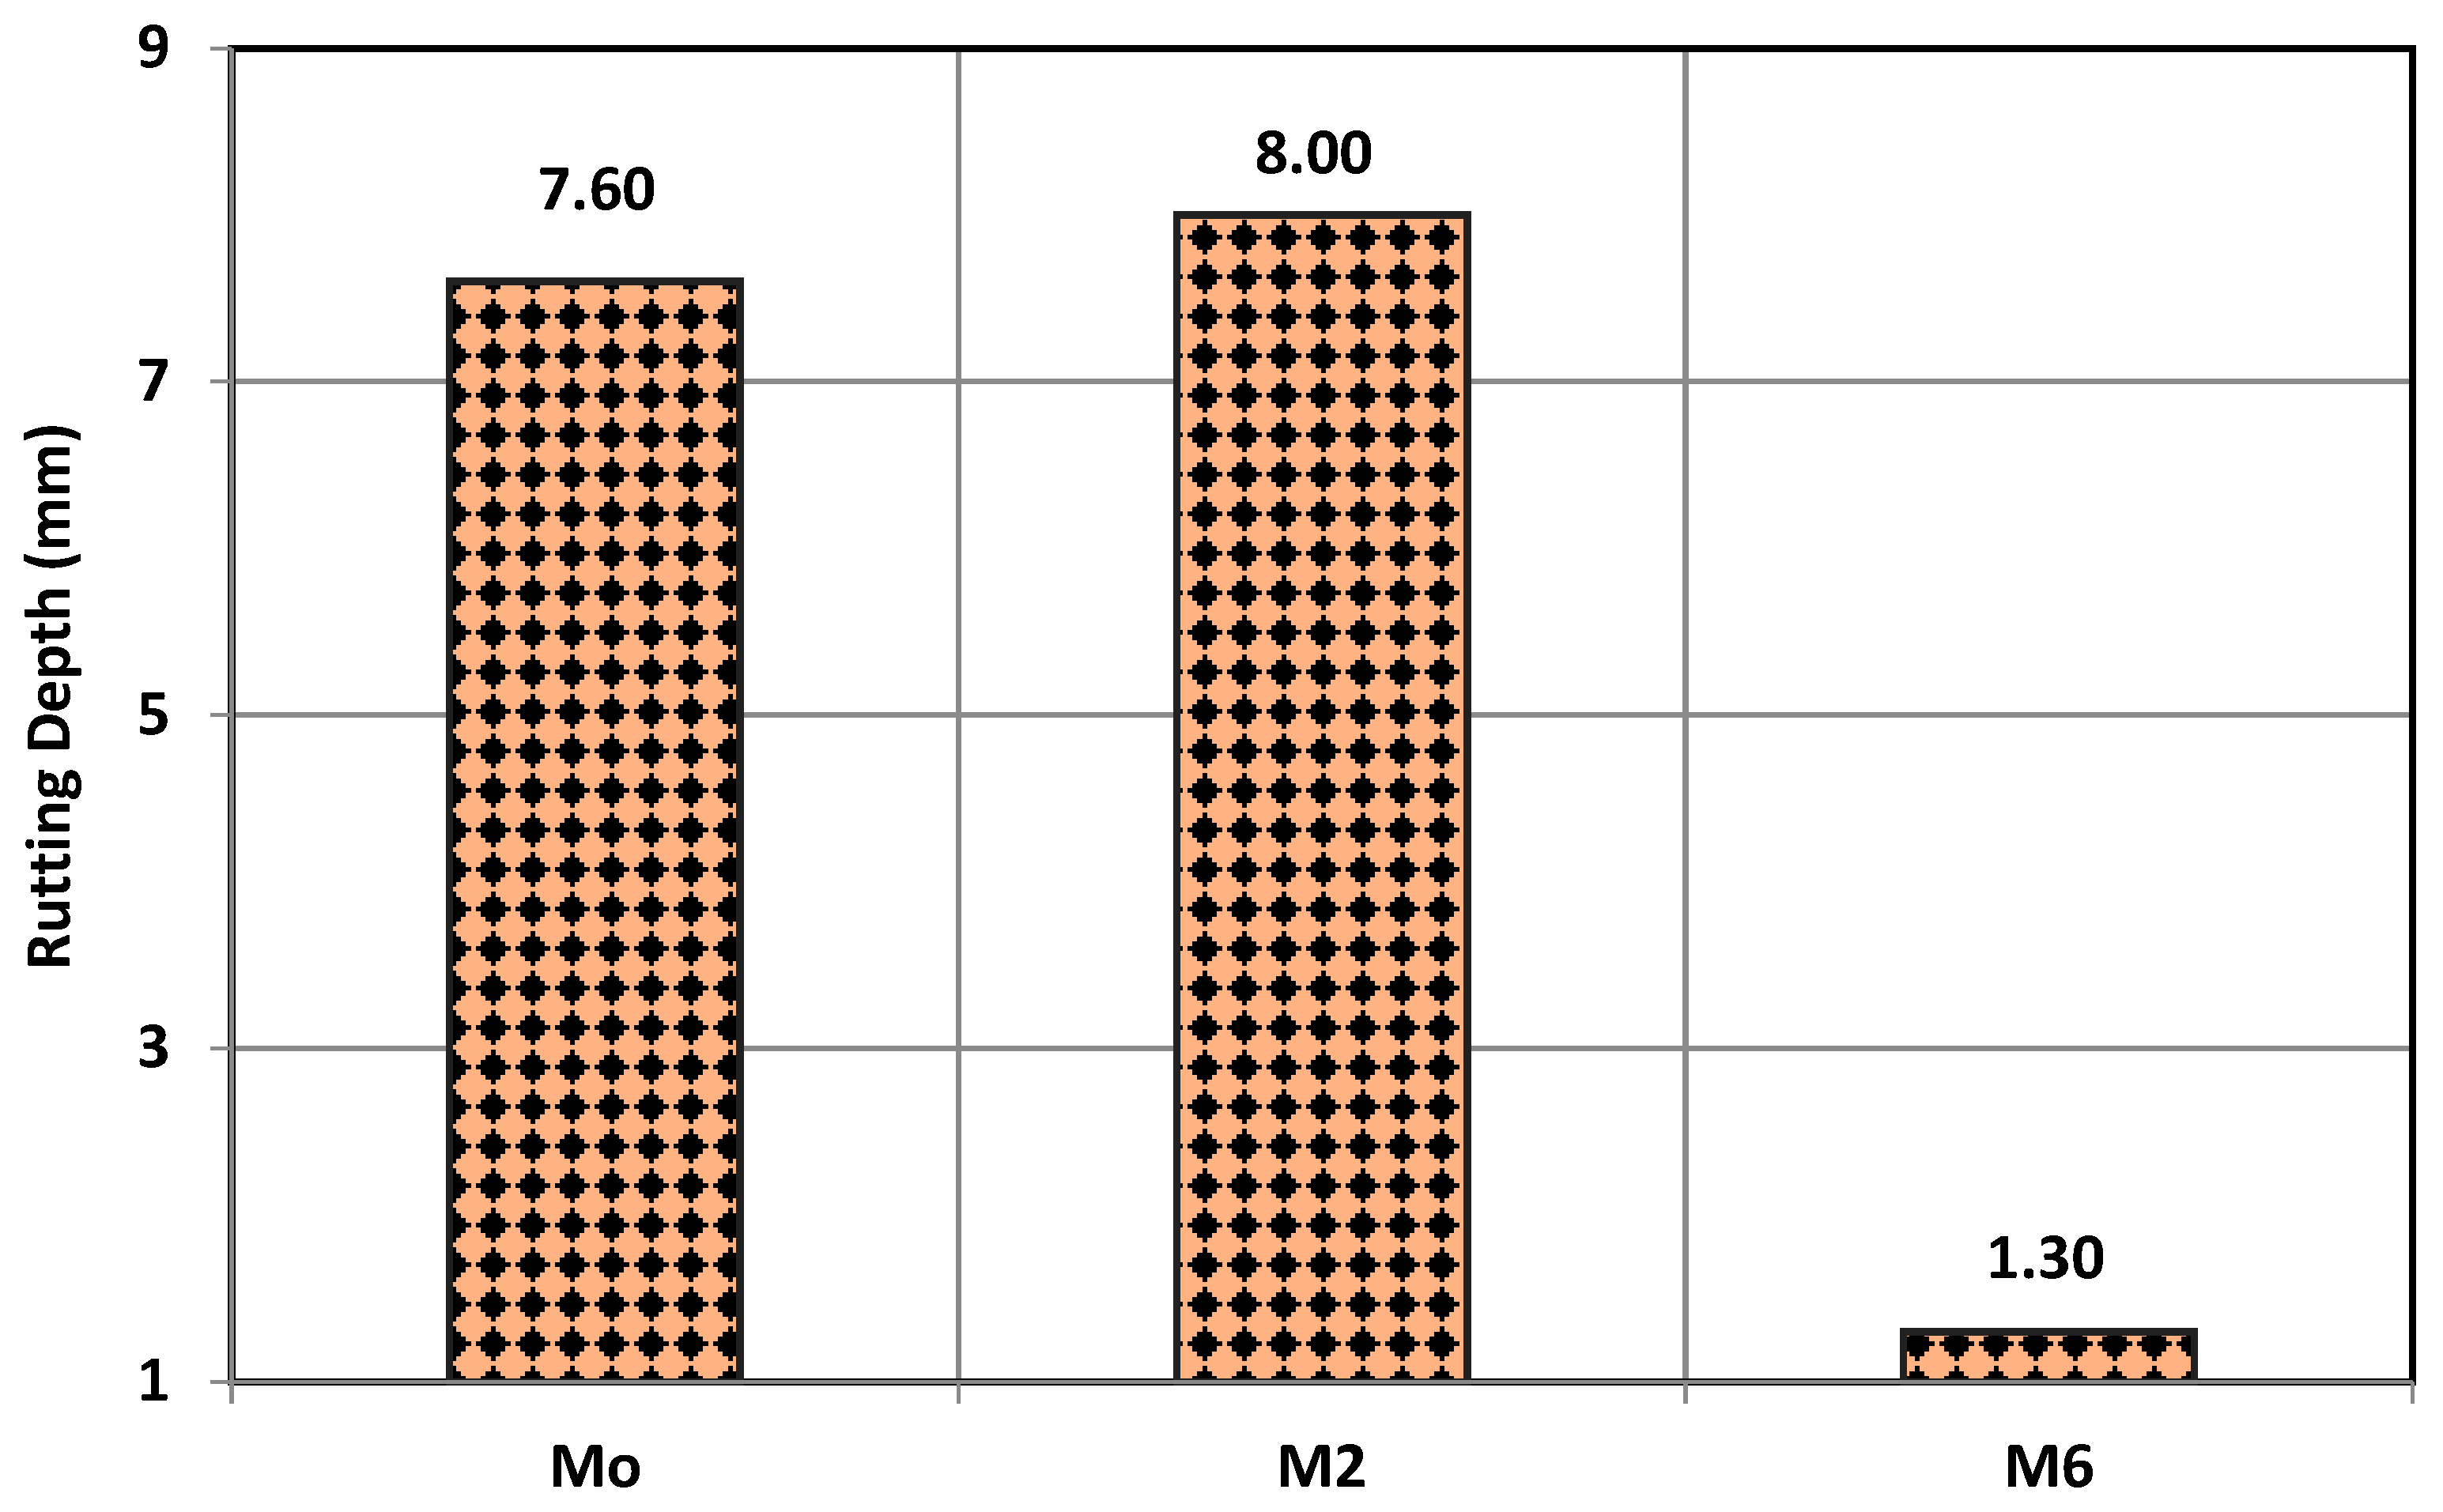
3.5. Rutting Results
A wheel loading test was used in the study to measure the rutting caused by a repeat bearing wheel.
Figure 24 illustrates the results of the rutting depth for M0, M2, and M6. Based on the results of the study, M2 had the highest value for rutting depth, which was 8 mm, and M6 achieved the lowest value, which was 1.3 mm for rutting depth. The value for M2 increased by about 5.26%, and the rut depth of M6 decreased by about 82.9% compared with the control mix (M0). The decrease in the rutting depth results from 7.6 mm at M0 to 1.3 mm at M6 confirms the effect of adding polyethylene in improving rutting resistance because polyethylene is a kind of thermoplastic material with a high melting point, and these properties improve the binder stiffness, which may minimize asphalt deformation under repetitive wheel loading. The increase in the rutting depth results from 7.6 mm at M0 to 8.0 mm at M2 shows the effect of adding RAP, which deteriorates the rutting resistance.
3.6. Indirect Tensile Strength Results
The tensile strength ratio (TSR) was used to measure the erosion resistance of the asphalt mixtures. The TSR results are illustrated in
Figure 25. In light of the results, M2 had the highest value of the TSR ratio, which was 86.6%, and the lowest value of ITS in both cases, conditioned and unconditioned, compared with M0 and M6. This could be attributed to the effect of adding RAP without polyethylene instead of coarse aggregate. M6 had the lowest value of the TSR ratio, which was 80.7%, and the highest value of the ITS in both cases compared with M0 and M2; this shows the effect of adding polypropylene to mix with RAP.
Finally, adding RAP without polyethylene had the worst ITS values when in wet or dry states compared with the others, even though it had the highest percentage for the TSR. In contrast, adding polyethylene to mix with RAP increased the ITS values when in wet or dry states compared with the others, even though it got the lowest percentage for the TSR.
3.7. Environmental Impacts for the Mixtures
3.7.1. Total Life Cycle Impact Assessment Results
Comparisons and analyses of the results for three types of bituminous mixtures are illustrated in
Figure 26 and
Table 15. The results revealed that the mixture modified with RAP only (M2) recorded a significant improvement in the environmental profile, more than the other kinds of bituminous mixtures in all the impact categories. Nonetheless, the mixture containing polyethylene and RAP (M6) produced the highest damage in all the environmental impact categories, followed by the control mixture (M0).
The results indicated that M2 had a noteworthy enhancement in human health impacts of 11.60% less than the base mix. Meanwhile, M6 led to a high deterioration in human health impacts by 100.04% compared to the base asphalt mixture. M6 also documented a negative environmental effect on ecosystems with a decrease of 105.03%, whereas M2 presented an improvement of 11.50% in ecosystems over the base asphalt mixture. Similarly, M2 confirmed the lowest resource availability impact of 14.60% more than the base mixture. M6 produced the highest resource availability impact, with a respective value of 31.46% as related to the base mixture.
3.7.2. Contribution Analysis
This part displays the contributions of each process from cradle to grave to the environmental profile of the three types of bituminous mixes in
Figure 27,
Figure 28 and
Figure 29. The analysis confirms that the production of polyethylene and bitumen dominates the environmental profile of the bituminous mixtures. In contrast, the other processes, such as transportation, aggregate extraction, and binder base course construction, contributed a small share of the total impact. The polyethylene production process had the largest effect on all the impact categories, human health, ecosystems, and natural resources, whereas the electricity consumed in asphalt production had the lowest effect on the total impact category.
Figure 27 shows an analysis of the contribution of each process in the various mixes to the human health category. Based on the results, M0 recorded the highest impact for limestone and bitumen compared with the other mixes. Meanwhile, M2 recorded the greatest effect of electricity and diesel fuel consumption on human health. From the values, M6 had the least effect on human health according to limestone, bitumen, electricity, and diesel compared with the other mixes; however, the main problem was that polyethylene recorded the greatest negative effect on human health category.
According to the ecosystem results shown in
Figure 28, the effect of limestone for M6 and M2 decreased in the ecosystem category in comparison with M0. In addition, the largest effect for bitumen was recorded in M0, at 52.98% of the total score in the ecosystems category. In addition, M6 documented the largest influence on the ecosystem category, where the polyethylene produced contributed to 60% of the total endpoint score.
The contribution analysis of natural resources is presented in
Figure 29. The environmental impact of limestone for M0 had the largest negative impact among all the mixes. The influence of bitumen production on the resource category had the worst impact in M0, followed by M2 and M6. The electricity consumed in the asphalt in all the mixtures was almost similar. The results for diesel fuel recorded the smallest effect in M6 and the greatest effect in M2 on the environmental profile. Finally, one can say that the mixture modified with polyethylene and RAP (M6) documented the highest damage influence in all the environmental impact categories, followed by the control mixture (M0). The mixture modified with RAP only (M2) is the best environmental alternative among all the mixtures.
4. Conclusions
In the present study, eight asphalt mixtures were prepared with different percentages of RAP—25%, 50%, 75%, and 100%—instead of the weight of coarse aggregate (Pin 2); then, the optimum RAP hot mix asphalt was modified by adding polyethylene in proportions of 1%, 2%, 3%, and 4% instead of the weight of the optimum RAP percent in the hot mix asphalt. From the experimental results of the Marshall loss of stability, wheel loading tracking, and indirect tensile strength, as well as the life cycle assessment (LCA), the following main conclusions can be summarized:
Adding RAP only to the asphalt concrete mixtures (M2) decreased the OBC but impaired all the Marshall characteristics; notwithstanding, it satisfied standard specifications.
Adding polyethylene to the mixtures which include RAP (M6) led to the best Marshall properties among all the mixes.
M6 improves the pavement performance (i.e., water damage resistance, high-temperature stability, and stiffness) due to the loss of stability ratio, decreases the rut depth value, and increases the indirect tensile strength value relative to the other mixes.
According to the LCA outcomes, M2 recorded the lowest values for human health, ecosystems, and resources, according to the ReCipe 2016 Endpoint.
The effect of bitumen had the highest impact on human health, ecosystems, and resources for M0 and M2.
The polyethylene production for M6 had the largest negative impact in comparison with the effects for bitumen, diesel fuel, and electricity.
The LCA has a great methodology and can be used in Egypt by decision makers to improve the performance of asphalt pavement construction.


