Article

Numerical Investigation on the Seismic Behavior of Novel Precast Beam–Column Joints with Mechanical Connections

1
School of Transportation and Civil Engineering, Nantong University, Nantong 226019, China
2
Water Resources Research Institute of Shandong Province, Jinan 250013, China
3
School of Civil Engineering, Shandong University, Jinan 250061, China
4
School of Civil Engineering and Architecture, Suqian College, Suqian 223800, China
5
School of Civil Engineering, Southeast University, Nanjing 211189, China
*
Author to whom correspondence should be addressed.
Buildings 2024, 14(5), 1199; https://doi.org/10.3390/buildings14051199
Submission received: 6 March 2024 / Revised: 13 April 2024 / Accepted: 19 April 2024 / Published: 23 April 2024

Abstract

:
Traditional cast-in-place beam–column joints have the defects of high complexity and high construction difficulty, which seriously affect the efficiency and safety of the building construction line, and precast beam–column joints (PBCJs) can greatly improve the construction efficiency and quality. At present, the investigations on the seismic behavior of precast reinforced concrete structures are still mainly focused on experiments, while the numerical simulations for their own characteristics are still relatively lacking. In the present study, the seismic behavior of novel precast beam–column joints with mechanical connections (PBCJs-MCs) is investigated numerically. Based on the available experimental data, fiber models for four PBCJs-MCs are developed. Then, the simulated and experimental seismic behaviors of the prefabricated BCJs are compared and discussed. Finally, the factors influencing the seismic behavior of the PBCJs-MCs are further investigated numerically. The numerical results indicate that the fiber models can consider the effect of the bond–slip relationship of concrete and reinforcement under reciprocating loads. The relative errors of the simulated seismic behavior indexes are about 15%. The bearing capacity and displacement ductility coefficients of the PBCJs-MCs decrease rapidly as the shear-to-span ratio (λ) increases. It is recommended that the optimum λ for PBCJs-MCs is 2.0–2.5. The effect of the axial load ratio on the seismic behavior of PBCJs-MCs can be negligible in the case of the PBCJs-MCs with a moderate value of λ.

1. Introduction

Compared with cast-in-place concrete structures, the most prominent feature of precast concrete structures is that the main concrete elements are prefabricated in the factory, a feature that allows them to show many advantages during construction. Each prefabricated component is equivalent to further discretizing the overall concrete structure. The composition of its basic units is more adapted to standardization and parameterization compared to the overall structure, which can enable the standardized design and factory flow production upstream and downstream of the whole industry [1]. With the main components prefabricated in the factory, the environmental pollution of the on-site construction can be effectively controlled, while the construction waste such as waste water and waste gas can be significantly reduced under the flow-through production method, and the turnover rate of auxiliary materials such as formwork can be improved to achieve energy conservation and environmental protection [2]. The standardized design is in line with the development trend of construction informationization, and, combined with BIM technology, big data technology, and information and communication technology, it can effectively improve the degree of informationization in the construction industry and realize modernization [3].
Precast reinforced concrete (PRC) structures have been widely used in civil engineering [3,4]. Beam–column joints (BCJs) in PRC structures are the core force-bearing parts, which not only affect the seismic behavior of PRC structures but also directly relate to the convenience and economy of construction. According to the presence or absence of post-cast sections at the joints, the precast concrete BCJs are divided into wet and dry connection forms [2,5]. At present, the investigations on the seismic behavior of PRC structures are still mainly focused on experiments [6,7,8,9], while numerical simulations for their own characteristics are still relatively lacking [10]. The experimental investigations on precast frame joint specimens are focused on the influence of parameters such as the connection methods on the seismic performance of BCJs [5]. However, most of the experimental studies on the seismic behavior of specimens are limited by the test conditions, time, and funding.
With the continuous development of elastic–plastic finite element theory and the rapid improvement of computer operation and processing capability, numerical simulation methods with good accuracy [10,11,12] have been widely applied in civil engineering. On one hand, numerical simulation can carry out a wide range of parameterized analyses on the basis of experiments and obtain richer analysis data while reducing the test input. On the other hand, numerical simulation can be used for structural optimization analysis, which can play an important role in guiding the experimental design and actual engineering design. Combined with experiment investigations, numerical methods are important for predicting the structural response of buildings. So far, many finite element models (FEMs) [13] have been developed to simulate the seismic behavior of reinforced concrete (RC) members. Precast BCJs are subjected to complex stresses and are prone to the formation of structural defects that lead to stress concentrations. In practical engineering, while the entire structure is often in an elastic phase, the joints may have transitioned to a plastic phase and suffered severe damage. This can eventually lead to structural failure. Therefore, it is crucial to focus on BCJs analysis for RC frame structures in numerical modeling. How to use the numerical simulation analysis to effectively reflect the seismic behavior of precast BCJs is of great significance to promote their development. Kremmyda et al. [14] simulated the hysteretic properties of precast joints using the ABAQUS software (ABAQUS 2011). In FEMs, a reasonable contact was set at the connection interface to simulate the shear damage of splice joints under reciprocating loads. Zoubek et al. [15] simulated the hysteresis performance of precast pin connection joints using the ABAQUS software. In Zoubek’s model, solid elements were used for the beam–column members and concealed pins, which can simulate the slip effect of concealed pin connections under seismic action more accurately. Cao et al. [16] carried out an in-depth study on the numerical simulation method of PBCs using the OpenSees software, proposing a more refined analysis model applicable to both types of joints with wet and dry connections. In the model, the influence of energy dissipation elements such as prestressing and angles on the structure was considered. The seismic behavior of ten different types of precast joints was simulated to validate the accuracy of the FEMs. Most of the existing numerical simulation methods for precast concrete structures can be divided into two categories according to their modeling ideas: numerical simulation methods based on beam–column link elements and 3D solid elements [17]. The two types of numerical simulation methods either pursue the convenience of use or the accuracy of the mechanism; it is difficult to achieve unity in efficiency and precision, and each has its own advantages and disadvantages. Therefore, combined with the characteristics of the assembled concrete structures, the development of fine and efficient numerical simulation methods is still worthy of in-depth study.
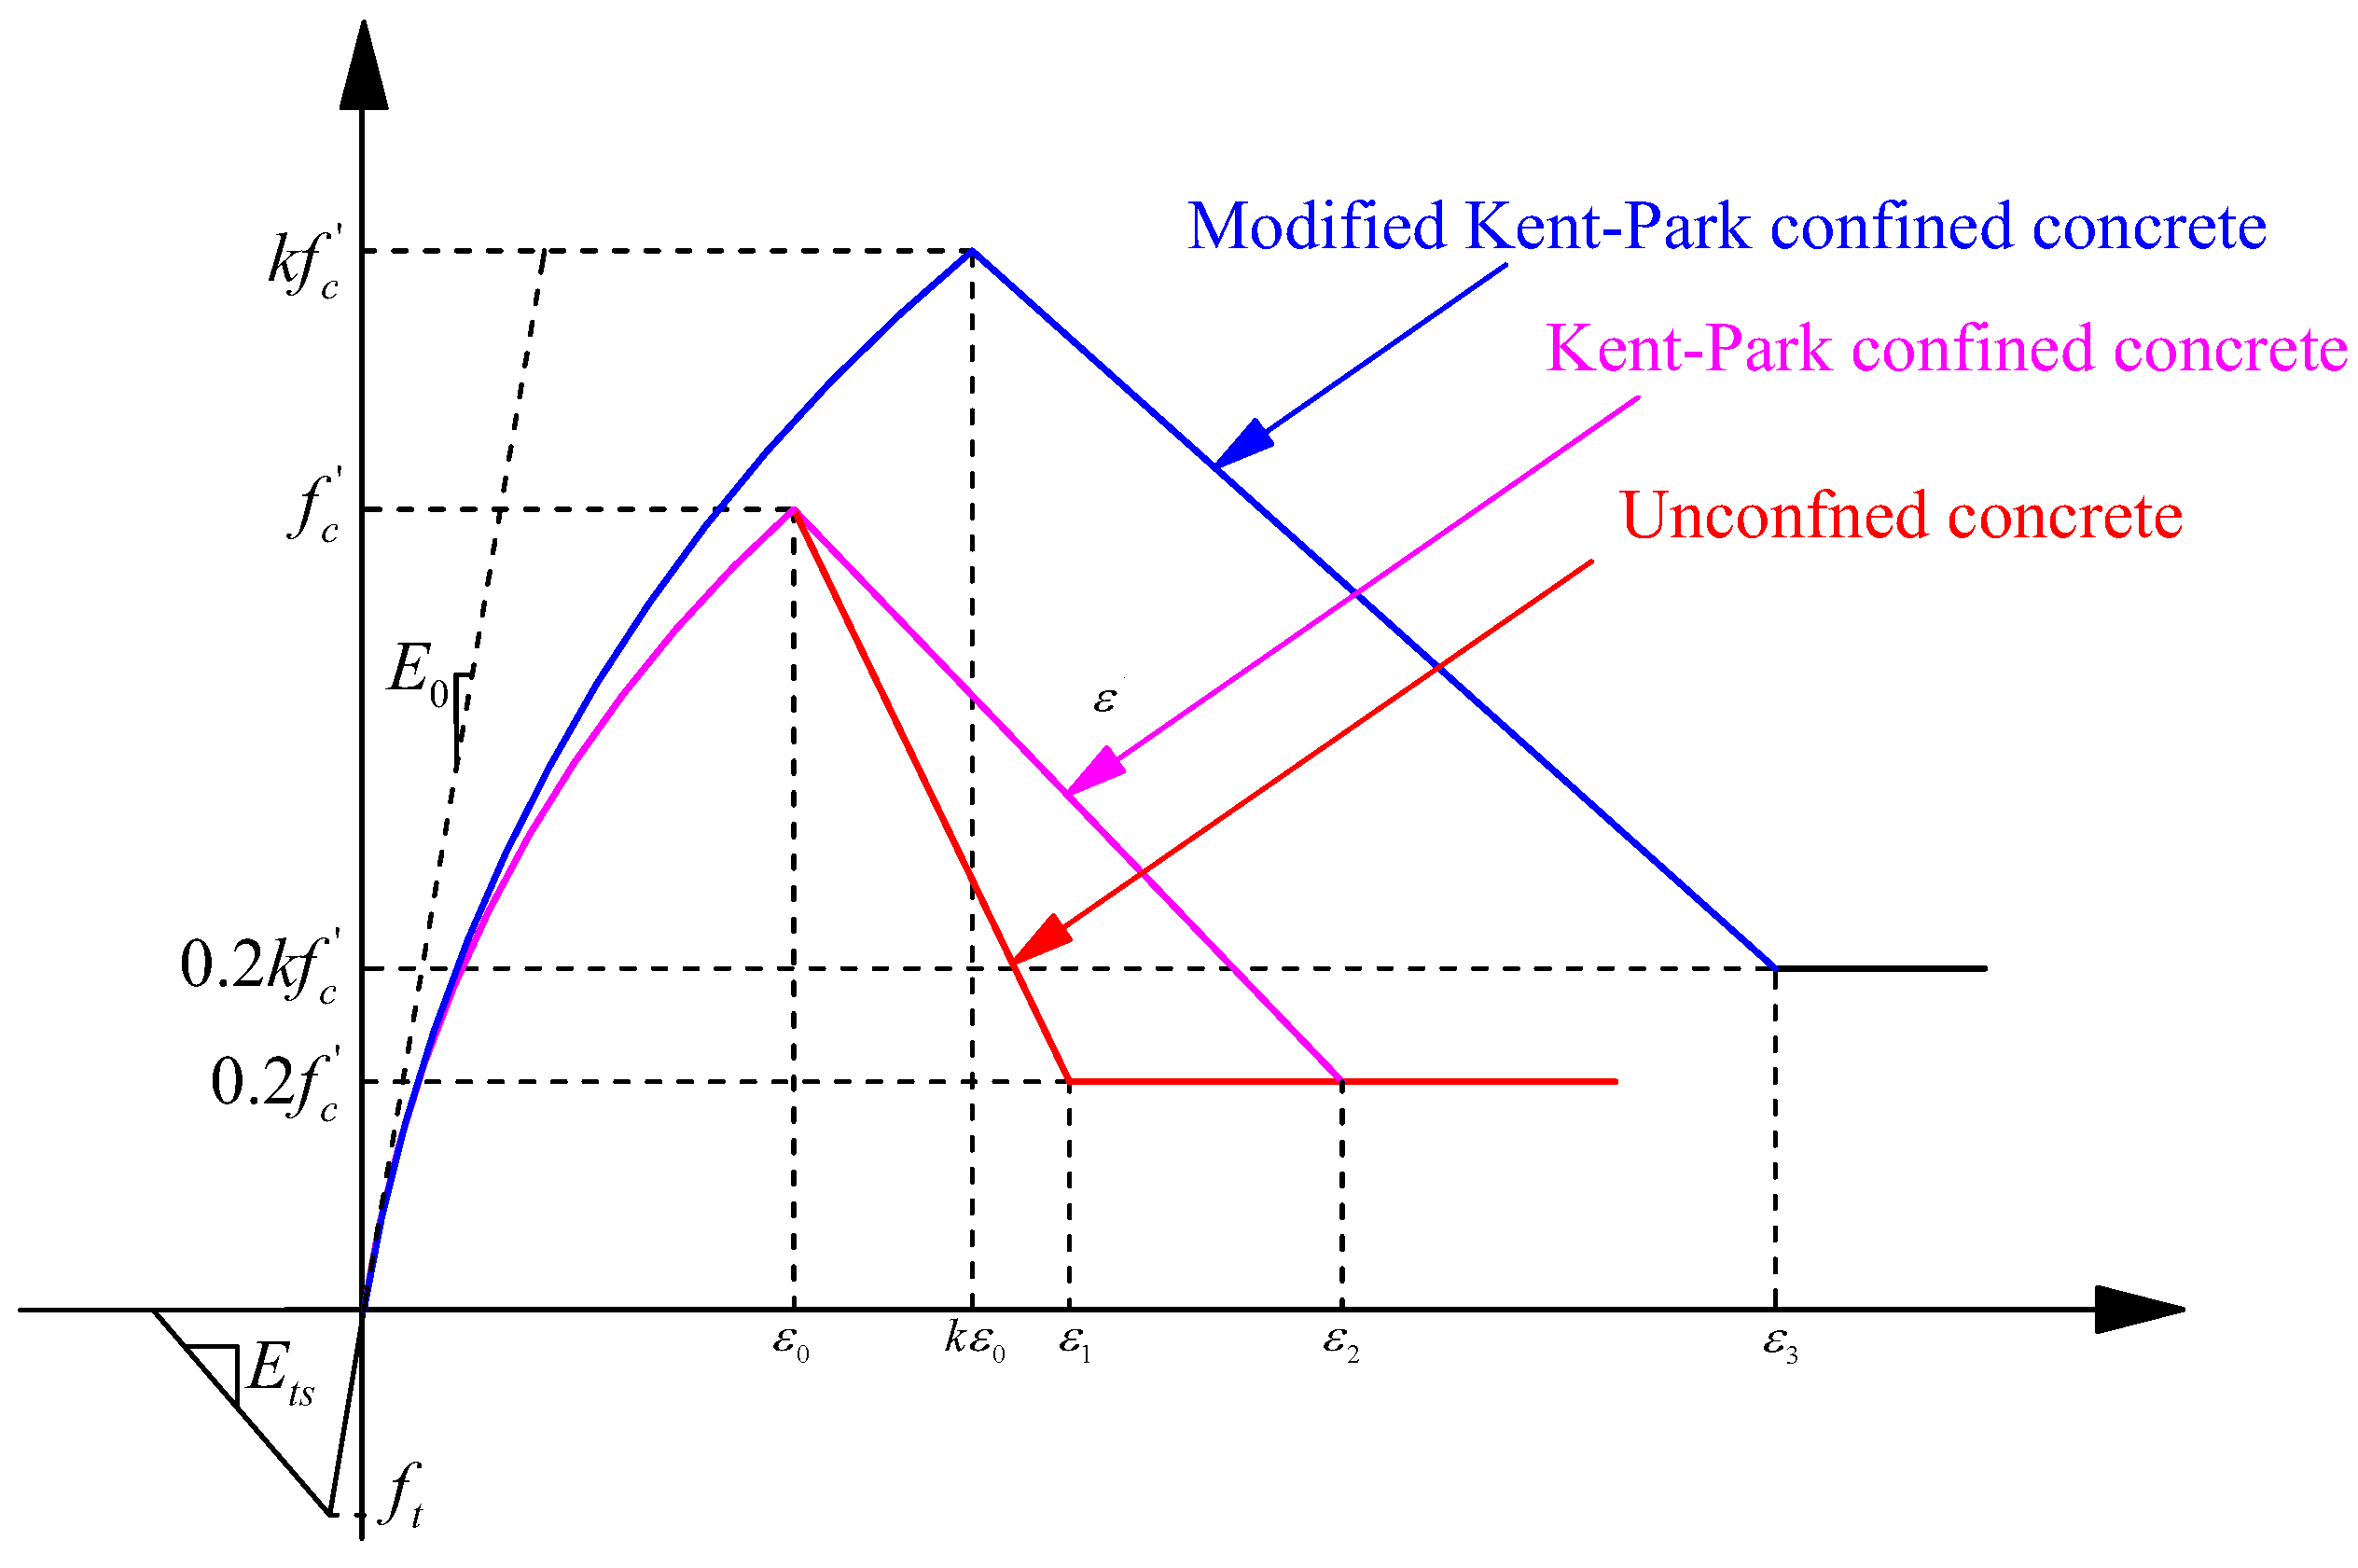
The existing numerical simulation methods can approximate the specific force characteristics of precast structures such as bond–slip, shear behavior at the joint, etc. The accuracy of FEMs is closely related to the selected material constitutive model [18]. Currently, the OpenSees software has been widely adopted in various countries to conduct numerous simulations regarding practical engineering and tests. The accuracy and efficiency of the simulation results using the software have been verified [13,18]. In the OpenSees software, there are three main types of models used for the simulation of reinforced concrete members with link elements, namely member models based on test data, section models based on section stress–strain, and fiber models at the material level. Among them, the fiber models are computationally inexpensive, easy to model, and have better accuracy [17]. Paulay [
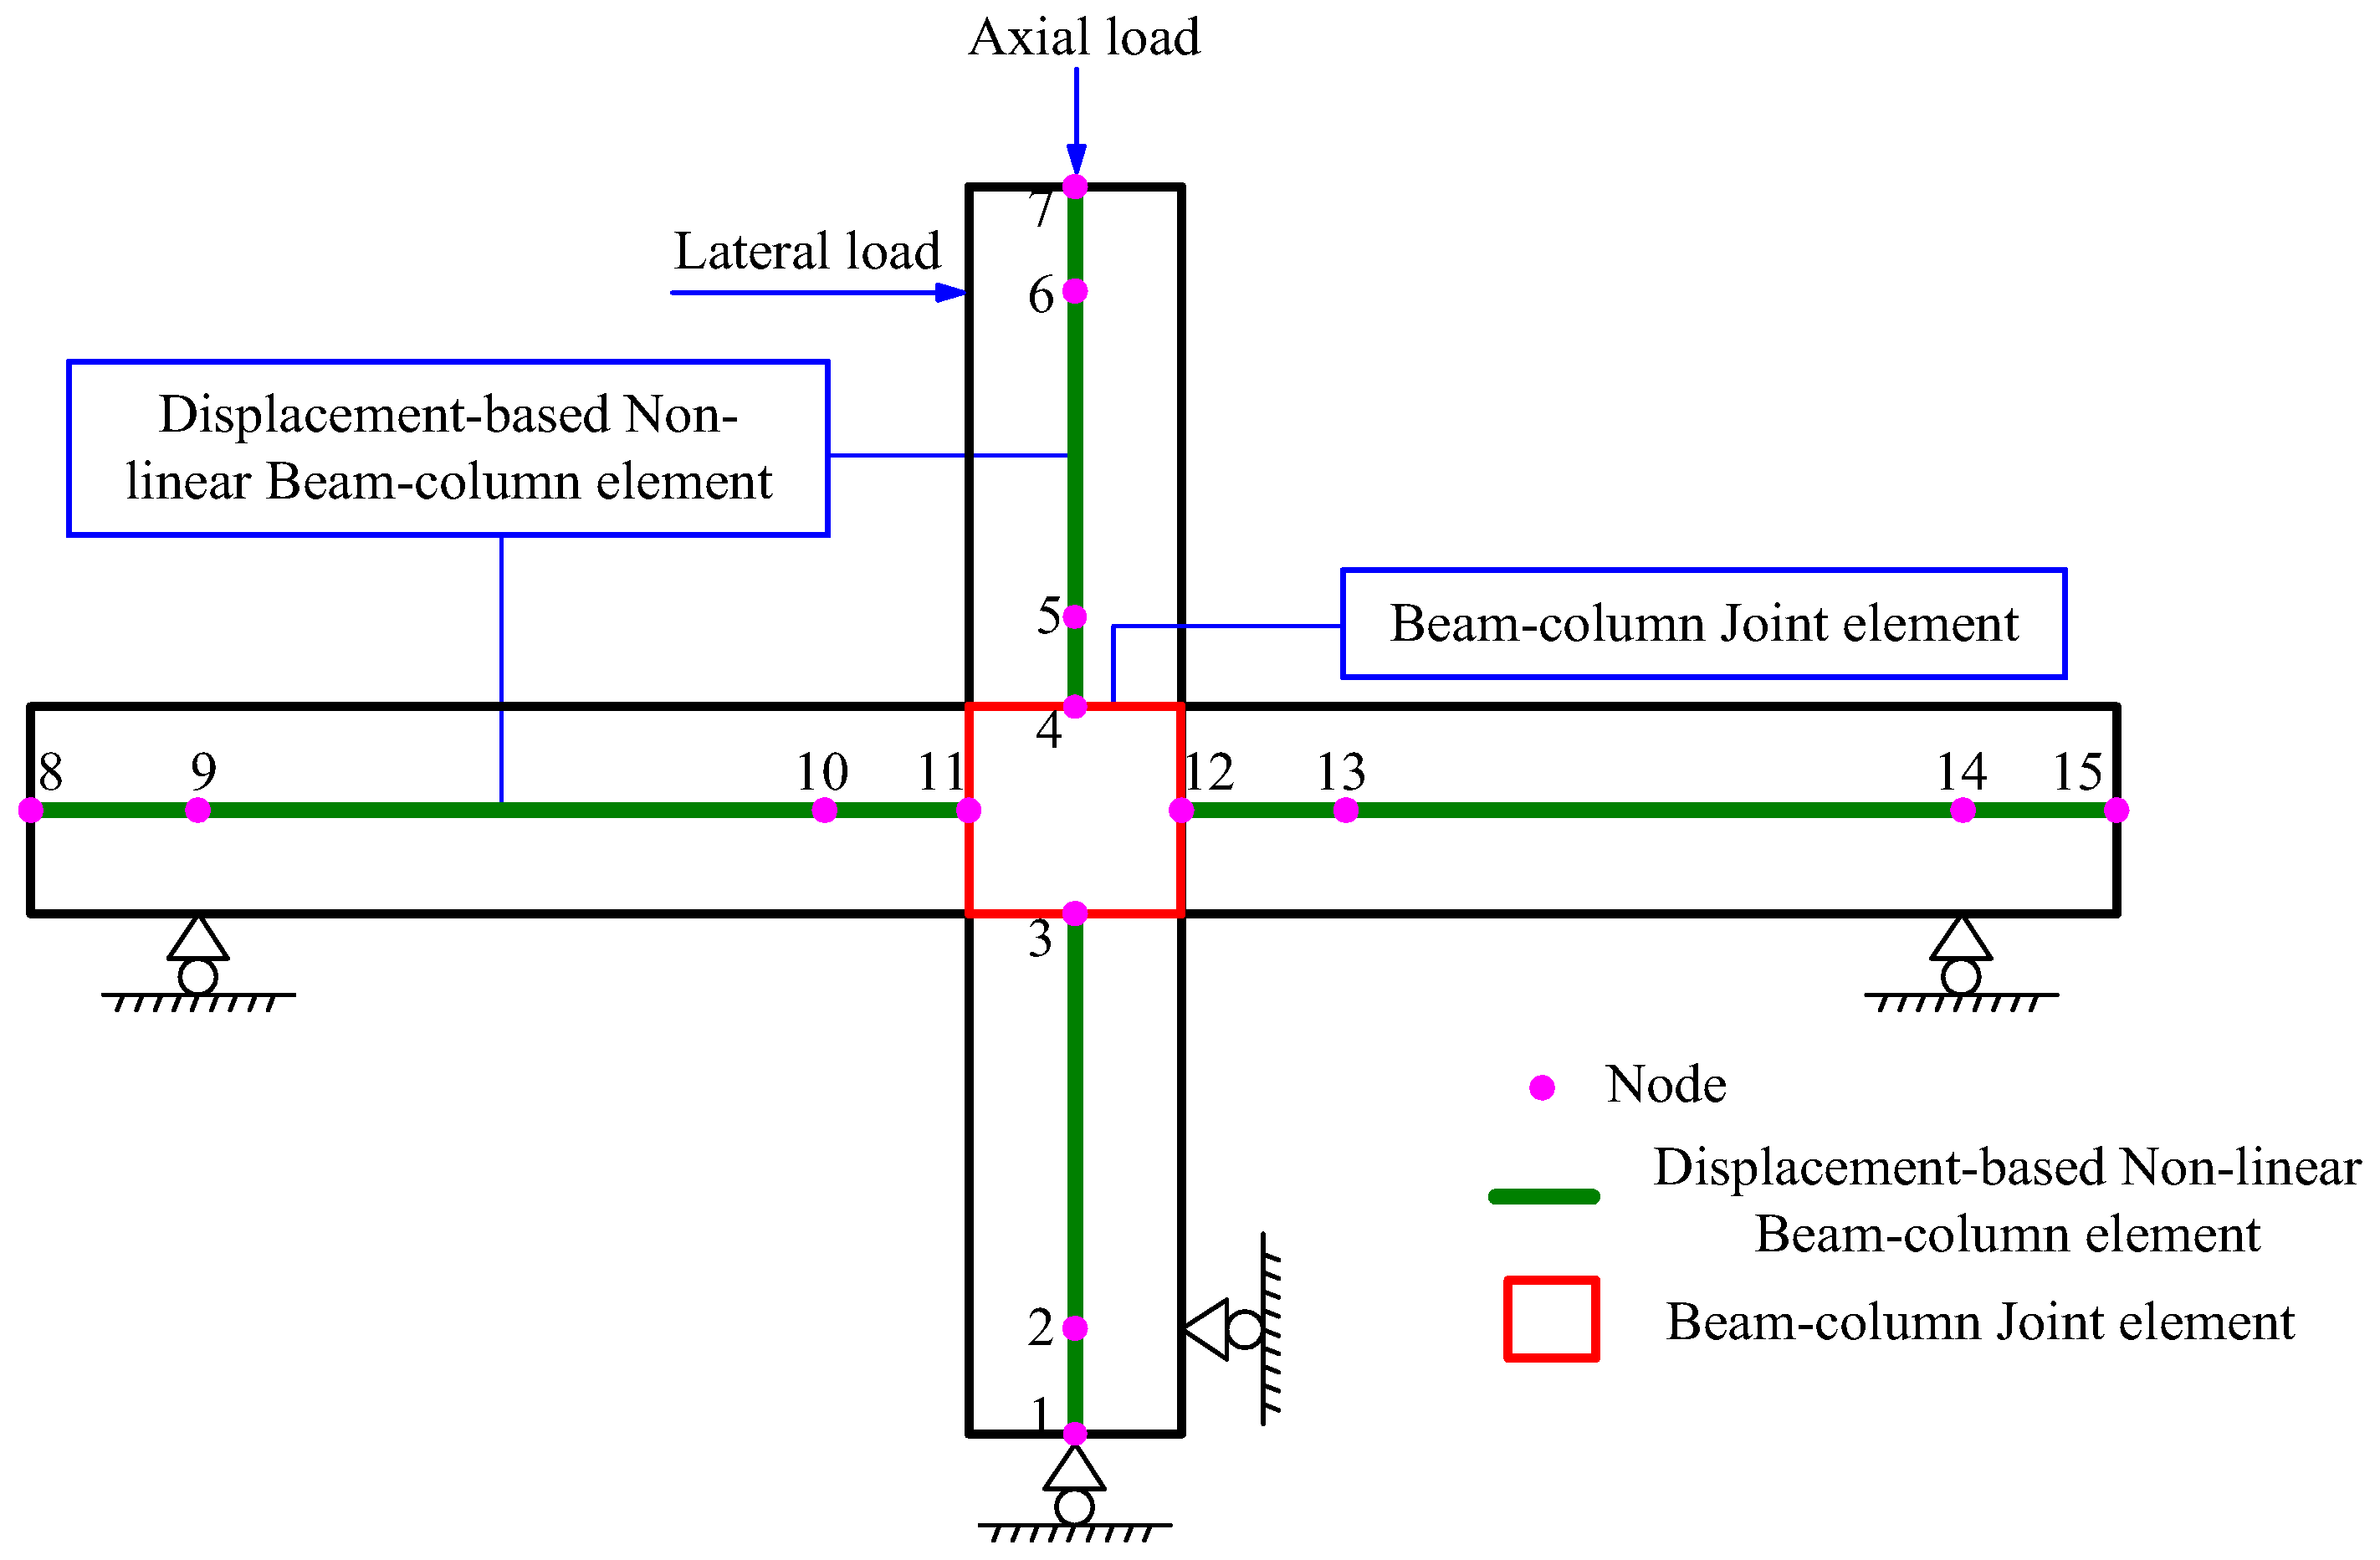
19] pointed out that the deformation of BCJs consisted mainly of the shear deformation of joint shear blocks and corner deformation of the beam–column intersection through. Pantazopoulou and Bonacci [20] pointed out that the slip of reinforcement would lead to blocked load transfer at the intersection and further lead to damage of the joint shear blocks. The beam–column joint element proposed by Lowes and Altoontash [21] and improved by N-Mitra [22] consisted of three components to simulate different damage behaviors at the BCJs. The shear panel component in the middle of the beam–column joint element is used to simulate the shear behavior of the stiffness and strength degradation of the joint core under shear damage. Under low-cycle reciprocating loads, bond–slip occurs between the reinforcement and the concrete, which in turn leads to hysteresis loop pinching. A reinforcement bond–slip model, Bar–Slip, is developed in the OpenSees software using the reinforcement stress–slip relationship proposed by Eligehausen and Hawkins [23,24]. It can take into account the effects of the material properties of concrete strength, reinforcement, and the degree of anchorage, and thus analyzes the effect of the slip on the overall joint performance.
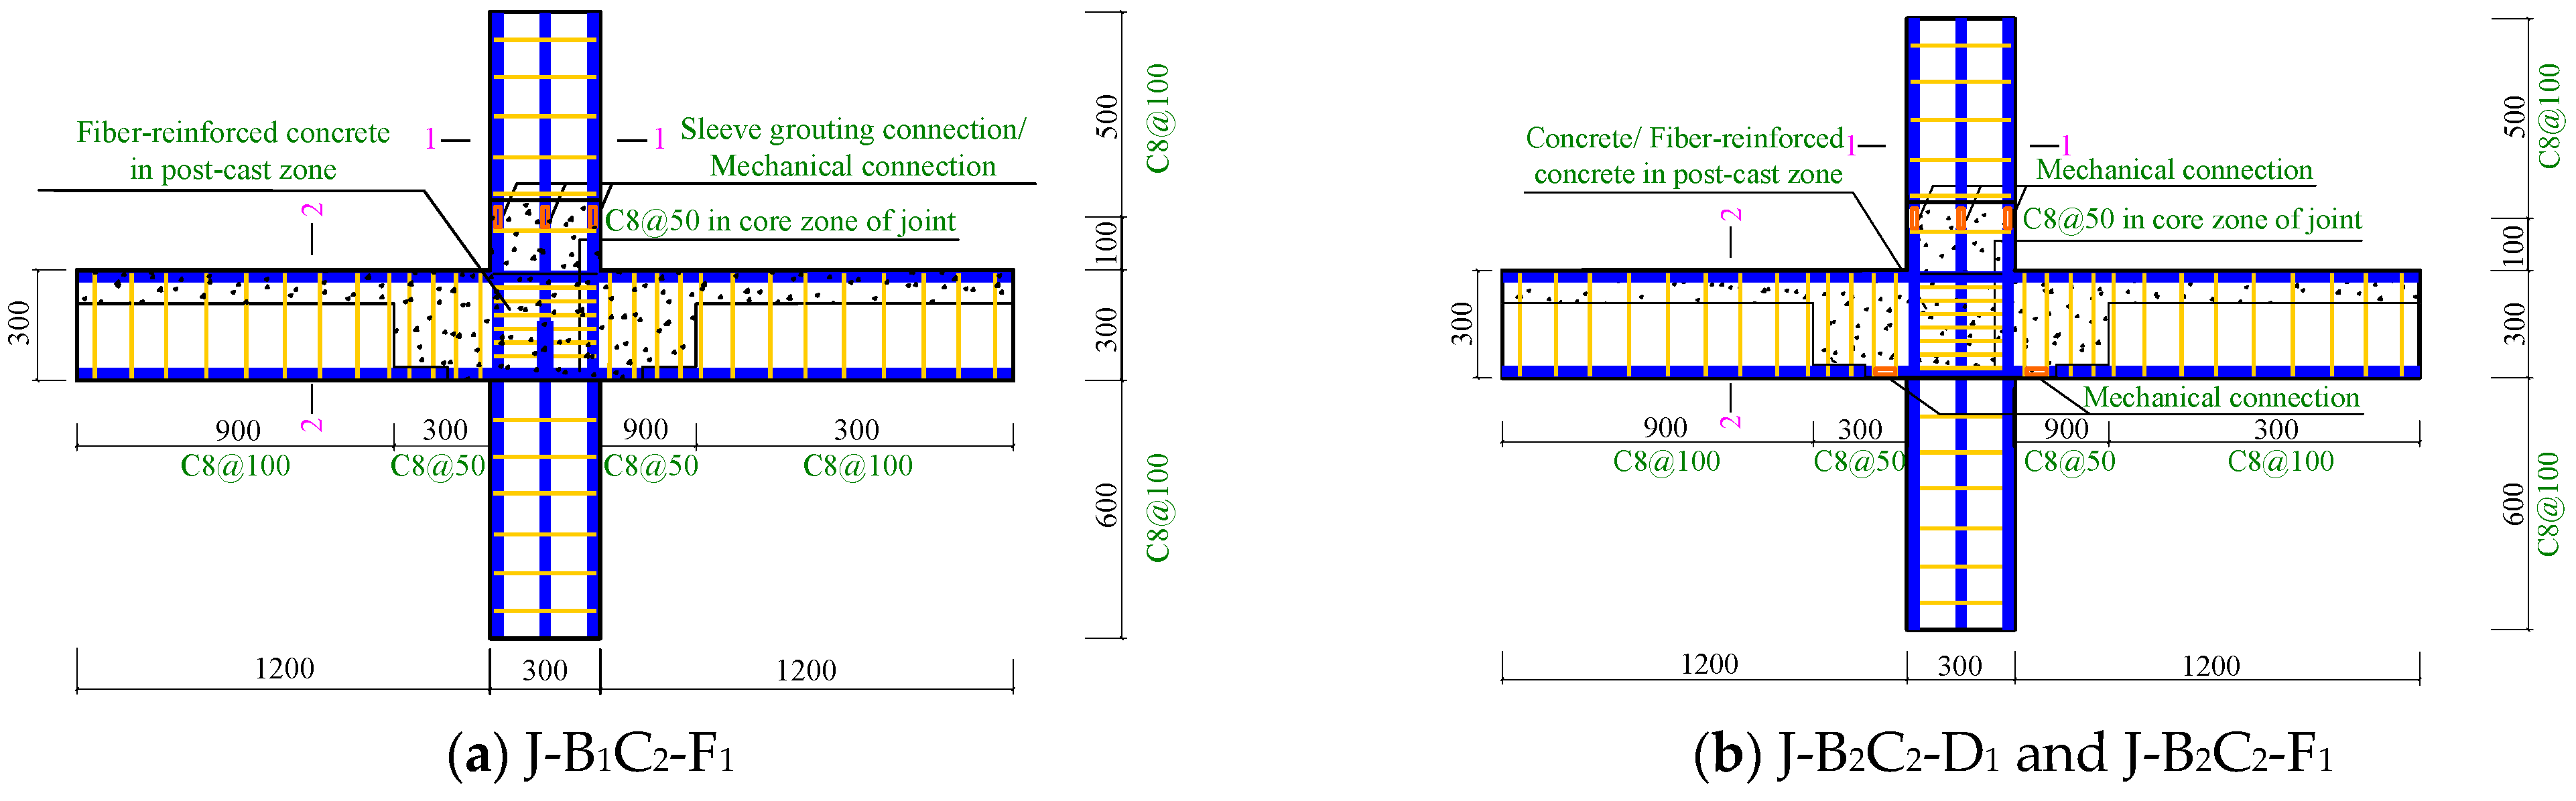
In a previous study [2], novel precast BCJs using mechanical connections (PBCJs-MCs) were proposed to improve the reliability and construction efficiency of PRC structures (see Figure 1). In Figure 1, the steel bars in the columns are bolted to the nuts [2]. Currently, there are some investigations on the seismic behaviors of PRC BCJs. Paul and Tanapornraweekit [25] evaluated the seismic performance improvement of composite BCJs using the LS-DYNA finite element software (Version 11 R 11.0.0). Yang et al. [26] tested and simulated the seismic performance of precast BCJs and found that the accuracy of the simulated results obtained from the ABAQUS software was good. Bohara et al. [27] evaluated the seismic behavior of composite wide BCJs and found that the simulated result using the LS-DYNA finite element software was in agreement with the experimental result. However, there are few numerical simulation studies on the seismic behavior of PBCJs-MCs.
Whether the existing constitutive models of concrete or reinforcement can accurately simulate the seismic behavior of PBCJs-MCs should be verified. Moreover, the parameters influencing the seismic behavior of PBCJs-MCs need to be analyzed using the numerical simulation method. In this present study, selecting appropriate element types and material constitutive models, the FEMs of PBCJs-MCs are established to analyze the seismic behavior of novel precast BCJs with mechanical connections. The simulation results are compared with the experimental results. Based on this, the factors influencing the seismic behavior of PBCJs-MCs are further investigated numerically.

2. Numerical Models of PBCJs-MCs

2.1. Overall Design of the Quasi-Static Test Program

Four PBCJs-MCs (specimens J-B1C2-F1, J-B2C2-D1, J-B2C2-F1, and J-B2C2-D2) from Ref. [2] are selected for the numerical simulation. The axial load ratios (n) of the four PBCJs-MCs are all 0.15. The shear-to-spans (λ) of the four PBCJs-MCs are all 2.0. The design drawing of the four specimens is described in Figure 2. In Figure 2, C denotes HPB300 steel bars and D denotes HRB400 steel bars. All precast columns are specified by mechanical connections. Other design details of the four PBCJs-MCs are listed in Table 1. The concrete grade of precast beams and columns are composed of C35. From Ref. [2], the material properties of concrete and steel bars can be obtained.

2.2. Establishment of FEMs

The fiber model is used for the FEMs, as shown in Figure 3. S1 area represents the core concrete, i.e., the confined concrete area. S2, S3, S4, and S5 areas outside the confined concrete area represent the unconfined concrete area. The fiber cross-sections can be mainly discretized into confined concrete fibers, unconfined concrete fibers, and reinforcing fibers. Fiber cross-section model with the number of segments and the number of integration points of the number of segments increases, and the distribution of sectional curvature in the direction of the extended height of the member is more reasonable, but the amount of calculation also increases. Gauss–Legendre formula is used to set 4 integration points for the segmentation basis of the finite element of the rod system [28]. The fiber cross-section is divided uniformly with the number of 30–50 [29], which can ensure accuracy while significantly reducing the computational effort.
The beam or column of the finite element model is simulated using the displacement-based nonlinear beam–column element. The action of the longitudinal reinforcement and stirrups is considered using the fiber cross-section in Figure 3. Concrete02 model is used for concrete fibers, and Reinforcing Steel model is used for steel fibers. Figure 4 shows a schematic diagram of the finite element model. Five fiber column elements are established (nodes 1–6). Six fiber beam elements are established (nodes 8–15). Beam–column joint elements are established between nodes 3, 4, 10, and 11 to simulate the bond–slip behavior of the reinforcement concrete at the joint and the shear behavior at the core of the joint. The loading mode of the FEMs (see Table 2) is the same as that of the test in Ref. [2], being drift ratio-controlled loading modes.

2.3. Element

Displacement-based nonlinear beam–column element is used to simulate beam and column elements, together with the fiber model (see Figure 4). Its advantage is that the internal force distribution of the element is more stable. The mechanical behavior of the concrete member can be simulated using fewer elements, but it is prone to the phenomenon of computational non-convergence. Beam–column joint element improved by N-Mitra [22] (see Figure 5) is used to simulate different damage behaviors of BCJs.
The shear panel component is used to simulate the shear behavior of joints in terms of stiffness and strength degradation under shear damage. Eight zero-length springs (Bar–Slip springs) are used to simulate the bond–slip mechanism of the reinforcement and concrete. Four zero-width shear springs (interface-shear springs) connecting external nodes 1–4 and internal nodes 5–8 are applied to simulate the beam–column interfacial shear transfer failure mechanism. Four interface-shear springs are used to simulate the degradation of shear transfer capacity at the joint interface. Because plastic hinge rotation is at the beam–column joint during the test without significant vertical sliding, interface-shear spring element is defined as an elastic material with high elasticity to weaken the shear transfer failure mechanism in the fiber model.

2.4. Constitutive Models

2.4.1. Concrete

In nonlinear fiber beam–column elements, it is necessary to assign corresponding constitutive relationship to concrete fibers [15,16]. The Concrete02 model is used. Based on the improved Kent–Park concrete model, Concrete02 constitutive model (see Figure 6) is proposed to effectively consider the tensile properties of concrete [30], thus being able to simulate the hysteretic properties of confined concrete in tension and compression. Introducing the confinement factor K, the confining effect of stirrup reinforcement on the strength and ductility of concrete in the core zone can be considered in the FEMs, which can more accurately simulate the concrete constitutive relationship.

2.4.2. Reinforcement

The hysteresis curve of reinforced concrete members is more closely related to the uniaxial constitutive model of reinforcement with the increase in the loading displacement. The selection of a reasonable and accurate constitutive model of reinforcement is the key to the accuracy of numerical simulation. There are currently eight constitutive models of reinforcement available in the OpenSees Version 3.0.0 software, including Steel01, Steel02, and Reinforcing Steel. Table 3 lists the different constitutive models of reinforcement; thus, Reinforcing Steel model (see Figure 7) is selected. In Figure 7, fy, fu are the reinforcing yield strength and ultimate strength, respectively; ε sh is the reinforcing strain hardening point strain and ε u is the reinforcing strain corresponding to fu; Es is the initial modulus of elasticity of reinforcement; Esh is the reinforcing starting point modulus. The above parameters can be obtained from the material property tests of reinforcement in Ref. [2]. Dhakal–Maekawa buckling model [17] is used to simulate the buckling of compressed reinforcement [17]. The Coffin–Manson model is applied to simulate the adverse effects of the low-cycle fatigue accumulation damage of reinforcing steel [17]. It has three parameters, namely the strength degradation parameter Cd, the fatigue damage parameter Cf, and the fatigue damage index α2. According to the previous study in Ref. [17], the three parameters in the Coffin–Manson model can be taken as 0.140, 0.379, and 0.379, respectively.

2.4.3. Shear Panel

The constitutive model of the shear panel is Pinching4 model (see Figure 8). It can synthesize the characteristics of strength degradation, stiffness degradation, and pinch shrinkage effect of joints. In this model, the skeleton curve envelope is multilinear and the unloading–reloading path is trilinear. The key to defining this material model is to define 16 parameters for the 8 characteristic points of the skeleton curve envelope in positive and negative directions, 6 key parameters for the unloading–reloading path, and stiffness and strength degradation criteria.
Pinching4 model skeleton curves reflect the shear capacity of BCJs. The modified mild compression field theory (MCFT) assumes that the shear force is uniformly distributed and that the shear force is transmitted only through the diagonal compression bar, considers the tensile stress effect after concrete cracking, establishes the deformation compatibility condition and stress balance relationship between reinforcement and concrete, and is widely used in concrete shear calculation. According to the modified MCFT, the Membrane-2000 Version 1.0 software proposed by Bentz and Collins was used to calculate the parameters related to the characteristic points of the skeleton curve [31].

2.4.4. Constitutive Model of Bar–Slip Springs

Under low-cycle reciprocal loading, bond–slip between the reinforcing steel and concrete occurs. It leads to hysteresis loop pinching and has a great influence on the load–displacement curves. A reinforcement bond–slip model, Bar–Slip, was developed in the OpenSees Version 3.0.0. software using the stress–slip relationship for reinforcing steel proposed by Eligehausen and Hawkins [23,24]. The Bar–Slip model can consider the effects of concrete strength, reinforcement material properties, and the degree of anchorage, and thus analyze the effect of the slip on reinforcement on the overall performance of BCJs.
It should be noted that the simulation of the reinforcement bond–slip effect can be achieved more accurately with the Pinching4 constitutive model by setting two co-coordinate points and assigning fiber sections to the ends of beams and columns considering the reinforcement stress–slip relationship. After that, the bending moment–angle relationship curves were obtained from the proposed fiber section analysis and converted to the skeleton curve parameters in Pinching4 model. Considering that the mechanical connection of the specimen is at a certain distance from the end of the beam and that the stress–slip relationship cannot be accurately expressed, the Bar–Slip springs (uniaxial material constitutive) are used in the establishment of the beam–column joint element model.

2.4.5. Constitutive Model of Reinforcement Bond–Slip

There are differences in construction quality, curing conditions, and methods between wet precast concrete joints and post-cast zone concrete, and the adhesion between reinforcement and concrete is susceptible to the effects of greater reinforcement slippage in the specimens, as shown by the experimental hysteresis curves [2]. Therefore, the reinforcement at the end of the beam and column is provided a uniaxial constitutive model, Bond_SP01 model [17] (see Figure 9), to simulate the bond–slip effect of the reinforcement at the end of the beam and column, while the voids inside the mechanical joints are also equated to this reinforcement bond–slip effect. It has a total of 6 parameters, namely the yield strength fy, slip at yield Sy, slip at failure Su, intensification factor at the initial intensification phase b, and hysteresis factor R. Zhao and Sritharan [32] calculated and analyzed a large amount of pull-out test data to obtain a fitting formula for Sy, as well as the recommended range of parameters Su, b, and R.
Figure 10 shows the stress–slip curves of HRB400 steel bars-reinforced C35 concrete and PVA FRC in uniaxial tension (S is the slip value). Before yielding, the slip of the reinforcement increases very slowly and the slip value is small. After yielding, the slip of the reinforcement increases rapidly with essentially no increase in stress and the slip phenomenon is very obvious. This is also consistent with the phenomenon that the degradation rate of the bond between the steel bars and concrete (or FRC) gradually increases after the concrete or FRC has gone through the stages of cracking and crushing in the test. The slip value of the reinforcement with a greater diameter is large under the same stress conditions and its bond–slip effect is more significant, which is consistent with the findings in Ref. [33].

3. Numerical Simulation Results and Discussion

Due to the experimental hysteresis curves in Ref. [2] being affected by various factors, the measured hysteresis curves in the positive direction (+) and negative direction (−) demonstrate asymmetric characteristics, while the numerical models are established without distinguishing the loading directions. The Pinching4 model is based on the principle that the envelopes of the skeleton curves are identical in the positive and negative directions. The specific hysteresis rules and loading and unloading stiffness in the positive and negative directions of the numerical model are adjusted according to the experimental results so that the difference between the simulated hysteresis curves in the positive and negative loading directions is minimal. Therefore, the experimental hysteresis curves are moderately shifted to compare the accuracy of the FEMs, which has no effect on the calculation of the relevant seismic behavior indexes. The comparison of the experimental and simulated peak loads of the PBCJs-MCs is shown in Table 4. The errors of the peak loads are below 7.0%, reflecting a better simulation effect. It is worth mentioning that the peak loads obtained from the simulations are generally small compared to the experimental results. Because there are differences between the strengths of new-to-old concrete in the specimens (J-B2C2-D1 and J-B2C2-D2), the Concrete 02 model does not reflect the mechanical properties of FRC in an integrated manner (J-B1C2-F1 and J-B2C2-F1), and the numerical model does not effectively consider the strength provided by the additional U-shaped reinforcement (J-B2C2-D2).

3.1. Hysteresis Curves

The simulated and experimental hysteresis curves of the PBCJs-MCs are compared in Figure 11. The simulation results basically match the experimental results, reflecting the loading–unloading paths and directions of the experimental hysteresis curves, and the selected element types and material constitutive models can better reflect the shear effect and reinforcement bond–slip effect at the core zone of the joint. For specimen J-B1C2-F1, the simulation is able to simulate the differences between the positive and negative hysteresis curves by adjusting the relevant hysteresis rules and degradation parameters in the Pinching4 model. In general, the numerical simulation model, element types, and material constitutive relationships selected reflect the force characteristics of the PBCJs-MCs more accurately and have a good simulation effect on the reinforcement slip effect reflected by the hysteresis curve.

3.2. Skeleton Curves

The simulated and experimental skeleton curves of the PBCJs-MCs are compared in Figure 12. The simulated skeleton curves are closer to the experimental ones during positive loading, while the experimental results during negative loading are influenced by the larger loading device, with very slow growth initially, but the two are also closer in the later stages of loading. The rising section of the simulated skeleton curve of specimen J-B1C2-F1 is better simulated. The simulated skeleton curve also reflects the process of decreasing the bearing capacity of specimen J-B1C2-F1 after the damage of the column end. The falling section of the simulated skeleton curve is similar to the experimental results. For specimens J-B2C2-D1, J-B2C2-F1, and J-B2C2-D2, the slow growth of the skeleton curve during the loading displacement amplitudes of 7.5–15 mm occurs due to the existence of internal voids in the mechanical joints, causing the reinforcing steel to slip. The rising sections of the simulated skeleton curves are rather consistent after the loading displacement amplitude of 7.5 mm.

3.3. Energy Dissipation Capacity

The normalized cumulative hysteretic energy coefficient EN is calculated using the same method in Ref. [17]. The total cumulative hysteretic energy dissipation curves of the numerical simulations and experiments are calculated in Table 5. The normalized cumulative hysteretic energy coefficients of the numerical models and experimental specimens are shown in Figure 13. The total cumulative energy dissipation of the FEMs is relatively close to the experimental results. The maximum relative error of the simulated results is less than 15%. At the last loading displacement, the increase in the simulated total cumulative energy dissipation of each specimen is smaller than the experimental result. For specimen J-B2C2-F1, the obvious differences between the energy dissipation–displacement curves of the test and simulation results are due to the insufficient accuracy of the model data for the bond–slip relationship, which needs to be improved by supplementing the bond–slip tests in the subsequent study. In addition, the unloading stiffness of the model at large displacements has a decreasing process with the unloading process. The Pinching4 model cannot effectively simulate this phenomenon, which needs to be corrected in further research.

3.4. Stiffness Degradation

The average loop stiffness K [17] is used to measure the stiffness degradation of the PBCJs-MCs. The stiffness degradation curves of the numerical simulation and experiment are compared as described in Figure 14. Some distinct branches are detectable in the stiffness degradation of the PBCJs-MCs. This is first due to the individual differences of the test specimens. Secondly, there is a slight increase in stiffness in the range of 15–20 mm, which is due to the over-limit of bond stress in the longitudinal reinforcement in the plastic hinge zone of the beam–column joints, leading to a surge in sliding displacement and resulting in the above phenomenon. The average loop stiffness of each specimen at a loading displacement of 4.5 mm differs from the experimental data to a certain extent, probably because the experimental data at this stage are susceptible to interference from external factors. After 4.5 mm, the trend of the simulated stiffness degradation curves is almost the same as that of the experiment, and the average loop stiffness values of the numerical simulation and experiment are very close to each other.

4. Parametric Analysis of Effect Factors

4.1. Effect of the Shear-to-Span Ratio

The difference in the shear span ratios of the generally recognized members affects the difference in the damage form of the concrete member. The damage of long columns with λ > 2, is calculated, which is mainly ductile damage. The normal shear span ratio of columns in ordinary RC structures is between 2 and 3, so it is not urgent to consider the shear span ratios greater 4. The effect of the shear-to-span ratio (λ) on the seismic behavior of PBCJs-MCs is analyzed. λ is set to 2.0, 2.5, 3.0, and 3.5 to study the seismic behavior of the PBCJs-MCs with the other parameters of specimen J-B2C2-D2 (n = 0.15) unchanged. The simulated skeleton curves of the PBCJs-MCs are shown in Figure 15. The simulated bearing capacity and displacement ductility coefficients of the PBCJs-MCs are shown in Table 6. The bearing capacity of the PBCJs-MCs gradually decreases as λ increases. Displacement ductility is the ability of a structure or member to withstand displacement before failure. With the increase in λ, the ultimate displacement of the PBCJs-MCs under the damage state because of the limit value of the PBCJs-MCs with the change in λ is not much different, but the yield displacement with the increase in λ regarding the PBCJs-MCs occurs with an increase in the yield displacement; the coefficient of ductility ratio decreases accordingly. The coefficient of ductility is a criterion for evaluating the ductility of the member. It can be concluded that the displacement ductility of the PBCJs-MCs gradually decreases as λ increases. When λ is greater than 2.5, the ductility coefficient of the PBCJs-MCs is greater than 3.0. Therefore, it is recommended that the optimum range of λ for PBCJs-MCs is 2.0–2.5.
If common building structures (e.g., classrooms, houses, hospitals, etc.) with columns have a shear span ratio greater than 3, it is not necessary to add seismic measures for the use of such RC structures. The use of columns with λ > 3 is limited in the buildings with seismic classifications of Class I and Class II. Because of the high energy dissipation capacity and ductility requirements of the columns in regions prone to both seismic and high wind events, it is prudent to use columns with λ > 3.

4.2. Effect of the Axial Load Ratio

The effect of the axial load ratio (n) on the seismic behavior of the PBCJs-MCs is also analyzed. Indeed, n is set to 0.1, 0.15, 0.3, 0.4, 0.5, and 0.7 to study the seismic behavior of the PBCJs-MCs with the other parameters of specimen J-B2C2-D2 (λ = 2.0) unchanged. The simulated skeleton curves of the PBCJs-MCs are described in Figure 16. The simulated skeleton curves basically demonstrate no differences as n increases. When n is not greater than 0.4, the bearing capacity of the PBCJs-MCs increases slightly; when n is greater than 0.4, the bearing capacity of the PBCJs-MCs is almost unchanged. From the parametric analysis of λ, it can be concluded that the effect of n on the seismic behavior of the PBCJs-MCs can be negligible in the case of the PBCJs-MCs with a moderate value of λ.
When the shear-to-span ratio is between 2 and 3, the axial load has less influence on the bearing capacity and ductility of the column, so, for such columns, the axial load ratio limit is appropriately relaxed, and, for the reinforced concrete frame structures of seismic Class I and Class II, the axial load ratio of the center column can be increased from 0.65 and 0.75, which are stipulated in the specification, to 0.85, which can reduce the column section under the premise of ensuring the seismic performance of the structure, save the amount of reinforcing steel and concrete, and increase the structural internal space.

5. Conclusions and Measurements

In the present study, the seismic behavior of PBCJs-MCs is investigated numerically. The following conclusions are obtained.
(1)
The Concrete02 model and Reinforcing Steel model can accurately simulate the constitutive relationship of concrete and reinforcement, respectively. The beam–column joint elements can accurately simulate the different damage behaviors of the joint zone. The Bond_SP01model can accurately simulate the bond–slip between the reinforcing steel, concrete, and mechanical connections.
(2)
The simulated hysteresis curves and skeleton curves of the PBCJs-MCs are similar to the experimental results. The simulated seismic behavior indexes, such as bearing capacity, energy dissipation capacity, and stiffness degradation, are not much different from the experimental results, with a relative error of about 15%.
(3)
The bearing capacity and displacement ductility coefficients of the PBCJs-MCs decrease rapidly as λ increases. It is recommended that the optimum λ range for PBCJs-MCs is 2.0–2.5. Regarding the high energy dissipation capacity and ductility requirements of the members in regions prone to both seismic and high wind events, it is prudent to use columns with λ > 3.
(4)
The axial load ratio has a very small influence on the seismic behavior of the PBCJs-MCs. The effect of the axial load ratio on the seismic behavior of the PBCJs-MCs can be negligible in the case of the PBCJs-MCs with a moderate value of shear-to-span ratio.
In reflecting on the broader implications of the study’s findings for seismic design standards and building codes, the following measures can be taken to incorporate these insights into regulatory frameworks in a manner that both promotes innovation in precast construction techniques and ensures the safety and resilience of structures in earthquake-prone areas.
(1)
Researchers should be down-to-earth, strictly abide by academic ethics, rigorously conduct research to ensure the validity of research results and the reliability of research conclusions, and actively maintain cooperation with enterprises so that the benign development of the assembly building industry can be ensured.
(2)
For prefabricated assembly building construction technology, the government should take assembly building as a key research support area and provide multi-party support in terms of research funding and research conditions, strengthen the industry’s supervision and review mechanism to ensure the safety of the technology, and leave its beneficial attributes to the market to decide.
The numerical model and related measures obtained in the present study help to provide an effective theoretical basis and technical support for the application of PBCJs-MCs in assembled building structures.

Author Contributions

Conceptualization, M.-L.Z. and C.S.; Methodology, L.B.; Formal analysis, M.-L.Z. and L.B.; Investigation, C.S.; Data curation, R.A., Y.H. and G.B.; Writing—original draft, M.-L.Z. and Y.H.; Writing—review & editing, Z.Y. and R.A.; Visualization, C.S., Z.Y. and G.B.; Supervision, Z.Y. and L.B.; Project administration, Z.Y. and R.A.; Funding acquisition, Z.Y. and R.A. All authors have read and agreed to the published version of the manuscript.

Funding

This research received no external funding.

Data Availability Statement

The data and materials used to support the findings of this study are available from the corresponding author upon request.

Conflicts of Interest

The authors declare no conflicts of interest.

References

  1. Liu, Y.; Li, X.P.; Zheng, X.H.; Song, Z. Experimental study on seismic response of precast bridge piers with double-grouted sleeve connections. Eng. Struct. 2020, 221, 111023. [Google Scholar] [CrossRef]
  2. Sun, C.Z.; Zhuang, M.L.; Bai, L.T. Experimental study on seismic behavior of novel precast concrete beam-column joints using mechanical connections. Bull. Earthq. Eng. 2023, 21, 4429–4448. [Google Scholar] [CrossRef]
  3. Qiao, D.H.; Xu, Y.Q.; Zhang, X.; Gao, L.; Yu, C.R.; Yang, J.; Zhu, H.B.; Qiao, Y.; Shao, Y.F.; Zhang, W.H. Seismic behaviour and size effect of column base joints with inverted exposed grouted sleeves. J. Build. Eng. 2022, 51, 104333. [Google Scholar] [CrossRef]
  4. Hadade, M.; Ferreira, M.; Carvalho, R.C.; Catoia, B. Moment-rotation response of beam-column connections in precast concrete structures. Solid State Phenom. 2017, 259, 269–274. [Google Scholar] [CrossRef]
  5. Sun, C.Z.; Zhuang, M.L.; Wang, Z.B.; Chen, B.D.; Gao, L.; Qiao, Y.; Zhu, H.B.; Zhang, W.H.; Yang, J.; Yu, C.R. Experimental investigation on the seismic behavior of prefabricated fiber reinforced concrete beam-column joints using grouted sleeve connections. Struc. Concr. 2023, 24, 4702–4718. [Google Scholar] [CrossRef]
  6. Chen, W.H.; Feng, K.; Wang, Y. Seismic Performance of a Novel Precast Beam-Column Joint Using Shape Memory Alloy Fibers-Reinforced Engineered Cementitious Composites. Buildings 2022, 12, 1404. [Google Scholar] [CrossRef]
  7. Wang, Z.; Feng, D.C.; Wu, G. Experimental Study on Seismic Behavior of Precast Bolt-Connected Steel-Members End-Embedded Concrete (PBSEC) Beam-Column Connections. Buildings 2022, 12, 1652. [Google Scholar] [CrossRef]
  8. Zheng, J.H.; Pan, Z.Z.; Zhen, H.; Deng, X.H.; Zheng, C.M.; Xie, L.P.; Xiong, Z.; Li, L.J.; Liu, F. Experimental Investigation on the Seismic Behavior of Precast Concrete Beam-Column Joints with Five-Spiral Stirrups. Buildings 2023, 13, 2357. [Google Scholar] [CrossRef]
  9. Peng, W.; Lu, W.; Liu, S.; Liu, Y.; Xu, L.; Li, F. Experimental and Numerical Study on the Seismic Performances of Reinforcement-Embedded RC Column-to-Precast Cap Beams with Socket Connections. Buildings 2023, 13, 2367. [Google Scholar] [CrossRef]
  10. Bert, C.W.; Malik, M. Differential quadrature: A powerful new technique for analysis of composite structures. Compos. Struct. 1997, 39, 179–189. [Google Scholar] [CrossRef]
  11. Wang, Y.Y.; Gu, Y.; Liu, J.L. A domain-decomposition generalized finite difference method for stress analysis in three-dimensional composite materials. Appl. Math. Lett. 2020, 104, 106226. [Google Scholar] [CrossRef]
  12. Kabir, H.; Aghdam, M.M. A generalized 2D Bézier-based solution for stress analysis of notched epoxy resin plates reinforced with graphene nanoplatelets. Thin Wall. Struct. 2021, 169, 108484. [Google Scholar] [CrossRef]
  13. Ni, X.Y.; Qiang, Z.; Li, Y.Z. Cyclic test and numerical analysis of the seismic behavior of concrete columns reinforced by HRB600 steel bars. J. Build. Eng. 2022, 50, 104211. [Google Scholar] [CrossRef]
  14. Kremmyda, G.D.; Fahjan, Y.M.; Tsoukantas, S.G. Nonlinear FE analysis of precast RC pinned beam-to-column connections under monotonic and cyclic shear loading. Bull. Earthq. Eng. 2014, 12, 1615–1638. [Google Scholar] [CrossRef]
  15. Zoubek, B.; Isakovic, T.; Fahjan, Y.; Fischinger, M. Cyclic failure analysis of the beam-to-column dowel connections in precast industrial buildings. Eng. Struct. 2013, 52, 179–191. [Google Scholar] [CrossRef]
  16. Cao, X.Y.; Feng, D.C.; Wang, Z.; Gang, W. Investigation on modelling approaches for prefabricated concrete beam-to-column connections using openSEEs. China Civil Eng. 2019, 52, 13–27. [Google Scholar]
  17. Zhuang, M.L.; Sun, C.Z.; Dong, B. Experimental and numerical investigations on seismic behavior of HTRB630 high-strength steel bars reinforced concrete columns. Case Stud. Constr. Mater. 2022, 17, e01185. [Google Scholar]
  18. Mazzoni, S.; McKenna, F.; Scott, M.H.; Fenves, G.L. Open System for Earthquake Engineering Simulation User Commandlanguage Manual; University of California: Berkeley, CA, USA, 2009. [Google Scholar]
  19. Paulay, T. Equilibrium criteria for reinforced concrete beam-column joints. ACI Struct. J. 1989, 86, 635–643. [Google Scholar]
  20. Pantazopoulou, S.J.; Bonacci, J.F. On earthquake-resistant reinforced concrete frame connections. Can. J. Civil Eng. 1994, 21, 307–328. [Google Scholar] [CrossRef]
  21. Lowes, L.N.; Altoontash, A. Modeling Reinforced Concrete Beam-Column Joints Subjected to Cyclic Loading. J. Struct. Eng. 2003, 129, 1686–1697. [Google Scholar] [CrossRef]
  22. Mitra, N. An Analytical Study of Reinforced Concrete Beam-Column Joint Behavior under Seismic Loading; University of Washington: Washington, DC, USA, 2007. [Google Scholar]
  23. Eligehausen, R.; Popov, E.P.; Bertero, V.V. Local Bond Stress-Slip Relationships of Deformed Bars under Generalized Excitations; EERC Report; University of California: Berkeley, CA, USA, 1982. [Google Scholar]
  24. Hawkins, N.M.; Lin, I.J.; Jeang, F.L. Local Bond Strength of Concrete for Cyclic Reversed Loadings; Bartos, P., Ed.; Bond in Concrete; Applied Science Publishers Ltd.: London, UK, 1982; pp. 151–161. [Google Scholar]
  25. Paudel, S.G.; Tanapornraweekit, G.; Tangtermsirikul, S. Numerical study on seismic behavior improvement of composite wide beam-column interior joints. J. Build. Eng. 2022, 46, 103637. [Google Scholar] [CrossRef]
  26. Yang, J.; Guo, T.; Chai, S. Experimental and numerical investigation on seismic behaviours of beam-column joints of precast prestressed concrete frame under given corrosion levels. Structures 2020, 27, 1209–1221. [Google Scholar] [CrossRef]
  27. Bohara, R.P.; Tanapornraweekit, G.; Tangtermsirikul, S. Experimental and numerical investigation on seismic behavior of a composite wide beam-column interior joint. Structures 2021, 30, 560–573. [Google Scholar] [CrossRef]
  28. Gharakhanloo, A. Distributed and Concentrated Inelasticity Beam-Column Elements Used in Earthquake Engineering; Norwegian University of Science and Technology: Tromsoe, Norway, 2014. [Google Scholar]
  29. Huang, Z.M. Finite Element Flexibility Method Based 3D Inelastic Seismic Response Analysis of Reinforced Concrete Frames; Chongqing University: Chongqing, China, 2013. [Google Scholar]
  30. Scott, B.D.; Park, R.; Priestley, M.J. Stress-strain behavior of concrete confined by overlapping hoops at low and high strain rate. J. Am. Conc. Inst. 1982, 79, 13–27. [Google Scholar]
  31. Bentz, E.C. Sectional Analysis of Reinforced Concrete Members. Ph.D. Thesis, University of Toronto, Toronto, ON, Canada, 2000. [Google Scholar]
  32. Zhao, J.; Sritharan, S. Modeling of Strain Penetration Effects in Fiber-Based Analysis of Reinforced Concrete Structures. ACI Struct. J. 2007, 104, 133–141. [Google Scholar]
  33. Cao, W.; Liu, X.; Qiao, Q.; Tian, Z.; Lin, D. Experimental study on bond slip behavior of ordinary and high strength recycled concrete and steel bars. J. Build. Struct. 2016, 37 (Suppl. S2), 127–134. [Google Scholar]
Figure 1. Mechanical connection of reinforcements.
Buildings 14 01199 g001
Figure 2. Design details of the four PBCJs-MCs.
Buildings 14 01199 g002aBuildings 14 01199 g002b
Figure 3. Schematic diagram of the fiber model.
Buildings 14 01199 g003
Figure 4. Schematic diagram of the finite element model for PBJs-MCs.
Buildings 14 01199 g004
Figure 5. Beam–column joint element model.
Buildings 14 01199 g005
Figure 6. Concrete02 model.
Buildings 14 01199 g006
Figure 7. Reinforcing Steel model.
Buildings 14 01199 g007
Figure 8. Pinching4 model.
Buildings 14 01199 g008
Figure 9. Bond_SP01 model.
Buildings 14 01199 g009
Figure 10. Stress–slip curves of HRB400 reinforcement.
Buildings 14 01199 g010
Figure 11. Comparison of experimental and simulated hysteresis curves for each specimen.
Buildings 14 01199 g011
Figure 12. Comparison of experimental and simulated skeleton curves for each specimen.
Buildings 14 01199 g012
Figure 13. Comparison of experimental and simulated energy consumption capacity for each specimen.
Buildings 14 01199 g013
Figure 14. Comparison of experimental and simulated average loop stiffness degradation curves for each specimen.
Buildings 14 01199 g014
Figure 15. Skeleton curves of PBCJs-MCs with different values of λ.
Buildings 14 01199 g015
Figure 16. Skeleton curves of PBCJs-MCs with different values of n.
Buildings 14 01199 g016
Table 1. Design parameter details of the four PBCJs-MCs.
SpecimenPrecast BeamDifferences in the Joint Zone
J-B1C2-F1Anchor connectionPCFRC
J-B2C2-D1Mechanical connectionPCC
J-B2C2-F1Mechanical connectionPCFRC
J-B2C2-D2Mechanical connectionPCC
Note: PCFRC represents post-cast fiber reinforced concrete; PCC represents post-cast concrete.
Table 2. Lateral load loading mode of PBCJs-MCs.
Loading LevelDrift Ratio (%)Displacement (mm)Number of Cycle
10.101.503
20.304.503
30.507.503
40.7511.253
51.0015.003
61.5022.503
72.0030.003
82.7541.253
93.5052.503
Table 3. Comparison of different constitutive models of reinforcement.
Constitutive ModelStress–Strain Curve ShapeBauschinger Effect Is Considered?Compression Flexure Effect Is Considered?Fatigue Damage Effect Is Considered?
Steel 01Bending LinesNoNoNo
Steel 02Smooth curvesYesNoNo
Reinforcing SteelSmooth curvesYesYesYes
Table 4. Comparison of simulation and experimental peak loads.
Specimen No.Test Result T (kN)Simulated Result S (kN)Er (%)
+++
J-B1C2-F194.3−93.990.1−90.2−4.5−3.9
J-B2C2-D196.7−89.291.8−91.3−5.12.4
J-B2C2-F1100.8−99.799.8−99.6−1.0−0.1
J-B2C2-D297.9−101.294.4−94.3−3.6−6.8
Table 5. Numerical simulation results and accuracy of the total cumulative hysteretic energy dissipation.
Specimen No. Test   Value   T   ( kN m ) Numerical   Simulation   Value   S   ( kN m )Relative Error ((S-T)/T)
J-B1C2-F140.937.7−7.8%
J-B2C2-D141.937.0−11.7%
J-B2C2-F141.936.1−13.8%
J-B2C2-D269.569.1−0.6%
Table 6. Bearing capacity and displacement ductility of PBCJs-MCs with different shear-to-span ratios.
λFyc (kN)Δyc (mm)Fmc (kN)Δuc (mm) μ c
2.068.719.693.463.83.3
2.559.221.182.563.83.0
3.052.825.973.163.82.5
3.545.929.965.263.82.2
Note: Δyc and Δuc indicate the numerical displacements at the numerical yield load Fyc and ultimate load Fuc, respectively; Fmc is the numerical maximum load; μ c is the numerical ductility coefficient, and μ c = Δ u c / Δ y c .
Disclaimer/Publisher’s Note: The statements, opinions and data contained in all publications are solely those of the individual author(s) and contributor(s) and not of MDPI and/or the editor(s). MDPI and/or the editor(s) disclaim responsibility for any injury to people or property resulting from any ideas, methods, instructions or products referred to in the content.

