Article

Prediction of the Properties of Vibro-Centrifuged Variatropic Concrete in Aggressive Environments Using Machine Learning Methods

by
Alexey N. Beskopylny
1,*,
Sergey A. Stel’makh
2,
Evgenii M. Shcherban’
3,
Irina Razveeva
2,
Alexey Kozhakin
2,4,
Anton Pembek
5,
Tatiana N. Kondratieva
6,
Diana Elshaeva
2,
Andrei Chernil’nik
2 and
Nikita Beskopylny
7
1
Department of Transport Systems, Faculty of Roads and Transport Systems, Don State Technical University, 344003 Rostov-on-Don, Russia
2
Department of Unique Buildings and Constructions Engineering, Don State Technical University, 344003 Rostov-on-Don, Russia
3
Department of Engineering Geology, Bases, and Foundations, Don State Technical University, 344003 Rostov-on-Don, Russia
4
OOO VDK, SKOLKOVO, Bolshoi Boulevard, 42, 121205 Moscow, Russia
5
Chair of Quantum Statistics and Field Theory, Faculty of Physics, Lomonosov Moscow State University, Leninskiye Gory, 1, 119991 Moscow, Russia
6
Departments of Mathematics and Informatics, Faculty of IT-Systems and Technology, Don State Technical University, 344003 Rostov-on-Don, Russia
7
Department of Hardware and Software Engineering, Faculty of IT-Systems and Technology, Don State Technical University, 344003 Rostov-on-Don, Russia
*
Author to whom correspondence should be addressed.
Buildings 2024, 14(5), 1198; https://doi.org/10.3390/buildings14051198
Submission received: 16 March 2024 / Revised: 8 April 2024 / Accepted: 19 April 2024 / Published: 23 April 2024
(This article belongs to the Section Building Materials, and Repair & Renovation)

Abstract

:
In recent years, one of the most promising areas in modern concrete science and the technology of reinforced concrete structures is the technology of vibro-centrifugation of concrete, which makes it possible to obtain reinforced concrete elements with a variatropic structure. However, this area is poorly studied and there is a serious deficiency in both scientific and practical terms, expressed in the absence of a systematic knowledge of the life cycle management processes of vibro-centrifuged variatropic concrete. Artificial intelligence methods are seen as one of the most promising methods for improving the process of managing the life cycle of such concrete in reinforced concrete structures. The purpose of the study is to develop and compare machine learning algorithms based on ridge regression, decision tree and extreme gradient boosting (XGBoost) for predicting the compressive strength of vibro-centrifuged variatropic concrete using a database of experimental values obtained under laboratory conditions. As a result of laboratory tests, a dataset of 664 samples was generated, describing the influence of aggressive environmental factors (freezing–thawing, chloride content, sulfate content and number of wetting–drying cycles) on the final strength characteristics of concrete. The use of analytical techniques to extract additional knowledge from data contributed to improving the resulting predictive properties of machine learning models. As a result, the average absolute percentage error (MAPE) for the best XGBoost algorithm was 2.72%, mean absolute error (MAE) = 1.134627, mean squared error (MSE) = 4.801390, root-mean-square error (RMSE) = 2.191208 and R2 = 0.93, which allows to conclude that it is possible to use “smart” algorithms to improve the life cycle management process of vibro-centrifuged variatropic concrete, by reducing the time required for the compressive strength assessment of new structures.

1. Introduction

Modern construction requires new approaches to constructive, technological and design solutions in the erection of buildings and structures of different degrees of responsibility. At the same time, a new culture of construction processes comes to the fore, which consists of ensuring high-quality support over the entire life cycle of construction projects. It should be understood that, like many decades ago, the main type of structural element is reinforced concrete structures [1]. At the same time, reinforced concrete structures imply a variety of different solutions in terms of new materials, new technologies and new design solutions. Thus, it is advisable to apply, in construction processes, new knowledge obtained in the course of scientific research, as well as during pilot industrial testing of the most effective technologies, design solutions and materials [2]. Lately, the technology of vibro-centrifugation, specifically of concrete, has emerged as one of the most promising areas in modern concrete science and technology, allowing for reinforced concrete elements with a variatropic structure. Quite a lot of relevant and interesting scientific works are devoted to this issue from the points of view of materials [3,4,5], design solutions [6,7] and forecasting methods [8,9,10]. However, this area is poorly studied and there is a serious deficiency in both scientific and practical terms, which is expressed in the absence of systematic knowledge about the life cycle management processes of vibro-centrifuged variatropic concrete. Artificial intelligence methods seem to be one of the most promising methods for improving the process of managing the life cycle of such concrete in vibro-centrifuged reinforced concrete structures.
When predicting the physical and mechanical properties of concrete, machine learning methods demonstrate a high prediction quality, which is comparable to traditional methods [11,12,13]. Linear machine learning models, characterized by their simplicity and good interpretability, are especially valued when solving practical industrial problems where the cost of error is high [14,15]. Researchers in [16] demonstrated the performance of multiple linear regression (MLR) and polynomial regression (PR) using the Konstanz Information Miner (KNIME) analytical platform. These methods achieved coefficient of determination values R2 = 0.589 and 0.745, respectively, on a small dataset (202 observations with 26 attributes). Another study [17] established a linear regression mathematical model to predict the 28-day compressive strength of concrete using accelerated boiling water curing method. The 28-day strength value predicted by the model equation agrees well with the observed 28-day wet concrete strength obtained using the Student’s t-test statistic at the 5% significance level. Other works [18,19] confirmed the feasibility of using linear models when analyzing the strength characteristics of concrete at different ages, taking into account a variety of both external and internal factors. Metric methods, based on the assumption that the properties of an object can be learned by having an idea of its neighbors, have almost no learning phase (lazy learning), but at the same time they have good predictive ability [20,21]. Different works [22,23,24] showed models using one of the most famous metric algorithms—the k-nearest neighbors (KNN) method. The coefficient of determination, R2, which is used to evaluate the performance of regression-based machine learning models, in the presented models obtained values from 0.92–0.99. This algorithm is recommended for the design and development of various concretes with improved characteristics [25]. Analysis of the strength characteristics of various concretes in practice often requires engineers to use a lot of time and conduct expensive experiments. Tree structures and boosting are innovative methods that reduce costs and reduce risks. Determining the compressive strength of concrete using ground granulated blast furnace slag is a difficult task because of the complex calculation involved in determining the mixture composition [26]. The results in [27] show that the random forest (RF) algorithm is an excellent forecaster with a root mean square error (RMSE) and mean absolute error of 4.9585 and 3.9423, respectively. Positive experiences in using this class of machine learning methods are a growing trend [28,29,30]. In predicting the strength of concrete, the ensemble regression tree algorithms [31] and extreme gradient boosting (XGBoost) [32] demonstrated high accuracy. Artificial neural networks are capable of capturing hidden nonlinear relationships in data, which is an important property when trying to predict the concrete’s strength [33,34,35]. Deep neural networks also have high prediction accuracy; the correlation coefficient between real and predicted values when used in [36] is 0.9882, and the relative error was up to 1%. Hybrid models are a combination of different approaches and methods for solving problems [37,38], combining the advantages of different models and algorithms to achieve a more efficient and accurate solution to the problem. This class has many potential benefits for the construction industry [39,40]. In their study [41], the researchers used an RF model and a bagging algorithm together to predict concrete’s compressive strength. The article [42] examines the combination of support vector regression (SVR) with an enhanced particle swarm algorithm and genetic algorithm through hybridization testing. The combination of least squares support vector regression (LSSVR) and grey wolf optimization (GWO) in a hybrid AI model effectively predicts foam concrete compression with a correlation coefficient of 0.991 and MAPE of 3.54% [43].
An analysis of the scientific literature suggests the need to expand the theoretical justification and practically confirm, using real experimental data, the feasibility of using machine learning methods to analyze the strength characteristics of concrete that is heterogeneous in cross-section. Consideration of the results of various machine learning methods to improve the process of managing the life cycle of vibro-centrifuged variatropic concrete will allow the selection of the most promising, fast and reliable technologies. In the course of analyzing the scientific literature, we selected the three most well-known models from different classes, which differ in the principle of their operation. One of the tasks of the study was to assess the impact of the feature engineering process on the accuracy of models that are different in nature. Their introduction into the process of assessing the quality of structures and products made from the concrete material in question will reduce the research time. The scientific novelties of the study are as follows:
-
The expansion of theoretical knowledge about the applications of machine learning methods in predicting the strength of vibro-centrifuged variatropic (heterogeneous in cross section) concrete, considering the influence of environmental conditions;
-
A description of the possibility of practical use of the developed methods to optimize the production process of vibro-centrifuged variatropic concrete;
-
Recommendations for participants in the construction industry on the implementation of intelligent models in order to achieve an economic effect by improving the process of monitoring the physical and mechanical properties of the concrete in question under the influence of aggressive environmental factors.
The main new results of the work are the formation of a dataset during laboratory tests with its subsequent in-depth analysis, as well as increasing the accuracy of the proposed intelligent models using modern approaches.
The purpose of this work is to improve the process of managing the life cycle of vibro-centrifuged variatropic concrete through machine learning methods, namely, predicting compressive strength using the extended linear regression method—ridge regression— and algorithms based on decision tree and XGBoost tree structures. The research plan is as follows:
(1)
Application of existing experience in theoretical analysis and practical implementation of machine learning methods in the life cycle management of vibro-centrifuged variatropic concrete;
(2)
Justification of the need to expand the stack of technologies to determine the physical and mechanical properties of vibro-centrifuged variatropic concrete by creating regression models based on machine learning methods;
(3)
Testing of samples made of vibro-centrifuged variatropic concrete under laboratory conditions, with the subsequent formation of a dataset for the training, optimization and testing of regression models;
(4)
Analysis of the data obtained, identifying the main statistical characteristics and determining dependencies;
(5)
Creating an expanded dataset by adding new features at the feature engineering stage;
(6)
Description and implementation of the ridge regression method on original dataset and feature-engineered dataset;
(7)
Description and implementation of the decision tree and XGBoost method on original dataset and feature-engineered dataset;
(8)
Description and implementation of the XGBoost method on original dataset and feature-engineered dataset;
(9)
Comparative analysis of the results of all models based on the values of the main metrics to assess the quality of the forecast when solving a regression problem;
(10)
Determination of prospects and features of implementation of developed forecasting methods into practice;
(11)
Determining the possibility of “learning transfer” by adapting the results obtained to other types of concrete.

2. Materials and Methods

2.1. Materials

The following materials were utilized for the study:
(1)
Portland cement CEM I 52.5N, produced at the Serebryakovcement enterprise (Mikhailovka, Russia); a compressive strength at 28 days of age of at least 56.0 MPa and a specific surface area of 3400 cm2/g.
(2)
The Kagalnitsky quarry in Kagalnik, Russia provided river sand with a fineness modulus of 1.43 and a bulk density of 1400 kg/m3.
(3)
Crushed sandstone, mined in the Sokolovsky quarry (Novoshakhtinsk, Russia); grain dimensions were from 5 to 20 mm.

2.2. Composition, Manufacturing Parameters and Properties of Vibro-Centrifuged Variatropic Concrete

The concrete mixture was prepared using the following proportions:
-
cement—375 kg/m3;
-
water—185 L/m3;
-
sand—694 kg/m3;
-
crushed stone—1113 kg/m3.
The concrete was molded and compacted in a laboratory centrifuge equipped on the support and drive shafts with steel ribs 5 mm high and 20 mm long, located at a distance of 300 mm from each other, providing high-frequency vibrations when the mold moved. The shafts rotated at a speed of 156 rad/s, and the molding time was 12 min. After molding, the samples were kept in the molds for 24 h, then removed from the molds and hardened under natural conditions until they reached 28 days of age. The manufactured ring-section elements were sawed on a stone-cutting machine into samples of standard sizes and shapes and were exposed to cycles of freezing and thawing, wetting and drying, and chloride and sulfate attacks [44,45,46,47].
The finished concrete had the following characteristics: slump of the fresh concrete cone—from 3 to 4 cm; compressive strength—58.2 ± 3.26 MPa.

2.3. Description and Analysis of the Dataset

Figure 1 provides a visualization of the research process. After data collection, an initial data analysis (EDA) phase was carried out (Figure 1), which involved examining the data to identify anomalies, deviations, missing values and possible relationships between them.
After analyzing the existing data set, an “original dataset” was formed, and it was suggested that conducting an additional, deeper and more complex analysis, including the use of statistical methods and analytical techniques to extract additional knowledge from the data, would help improve the final predictive properties of the models. Thus, using various techniques at the feature engineering stage, an expanded dataset was obtained (hereinafter referred to as “feature-engineered dataset”), which was subsequently adapted for each model using the feature selection method. The next stages of the research are the implementation of machine learning models, subsequent assessment of their quality, and summing up.
As a result of laboratory tests to determine the compressive strength of vibro-centrifuged variatropic concrete, a dataset was generated that describes the impact of aggressive environmental factors on the final characteristics [44,45,46,47].
In a series of experiments, strength measurements (Y, in MPa) were obtained for 664 samples of vibro-centrifuged variatropic concrete while fixing the following characteristics:
  • X1—number of freezing–thawing cycles;
  • X2—chloride content, mg/dm3;
  • X3—sulfate content, mg/dm3;
  • X4—number of moistening–drying cycles.
All of the above factors directly affect the strength of the building material under study [10,48,49]. From the point of view of construction, these parameters are sufficient to assess strength under the influence of an aggressive environment, since the data obtained have undergone mathematical statistical processing and the number of tests performed corresponds to the methods of regulatory and technical documents and, moreover, exceeds the standard quantity. It should be noted here that regulatory methods in construction themselves imply the possibility of projecting the results of a certain sample of tests onto the results of an entire large batch of building products and structures. Reliable and accurate strength predictions for new samples of variatropic concrete under similar operating conditions, without laboratory testing, will speed up construction processes.

3. Results and Discussion

3.1. Creation of Feature-Engineered Dataset and Feature Selection

In this study, the following information technologies and libraries were used for further processing of the resulting dataset: high-level language Python 3.10.11, Sklearn 1.3.2 and Optuna 3.5.0 (Preferred Networks, Inc., Tokyo, Japan) for hyperparameter optimization of intelligent models. A framework for automated search for optimal hyperparameters for machine learning models, Optuna, compared to the traditional GridSearch method, offers a more effective optimization method, due to the speed of operation, in the case of a large search space [50,51].
An important step in preparing data for submission to a regression model is the analysis of all attributes of the dataset, identifying the boundaries of values, and also determining correlations. Table 1 presents the description of the data (Std is standard deviation, Min is minimum value, Max is maximum value).
Figure 2 shows the correlation matrix, wherein we can observe a strong negative correlation between the attack factors (X1X4) and the predicted compressive strength column (Y).
It is also worth noting the presence of multicollinearity. Today, a number of researchers are of the opinion that it is necessary to combat multicollinearity only if it leads to significant problems, for example, to the deliberate inadequacy of the results obtained [52]. Figure 3 allows you to understand how data are distributed within a dataset and identify the main features of their distribution.
The graph shows the dependencies that are actually noted by researchers when working with concrete: with an increase in the degree of exposure to aggressive environmental factors, we observe a decrease in the strength characteristics of the concrete under study. It can also be noted in the figure that, in the “sulfate content” column, the statistical distribution is shifted towards larger values. The “compressive strength” column has more data in the range of 20–40 MPa. This dataset is saved and designated “original dataset” and will subsequently be fed as an input data to the model during machine learning. Points that differ from the total mass in Figure 3 are measured under different conditions and are not outliers.
When conducting a more in-depth analysis of the original dataset (advanced data analysis), the t-SNE (t-distributed Stochastic Neighbor Embedding) dimensionality reduction method was used [53]. Its principle is based on reducing the difference between the data distribution in the original space and the reduced-dimensional space using the Kullback–Leibler distance.
The Kullback–Leibler minimization formula (KL-divergence) works in such a way that the distribution in the low-dimensional space is as close as possible to the distribution in the original space, as follows:
K L P Q = i P i log P i Q i
where P is the probability distribution in high-dimensional space and Q is the probability distribution in low-dimensional space.
After using the t-SNE algorithm to reduce the dimension of space to two coordinates, clusters were discovered that were characterized by close values of the target variable (Figure 4).
The graph axes (Figure 4) represent a display of the influence of all parameters while preserving metric properties in a new low-dimensional space. Figure 4 shows the distribution of strength versus input parameters. Thanks to the t-SNE algorithm, the conclusion is formulated that the data form a cluster structure; the characteristics of the clusters were subsequently used to generate features.
The elbow method [54] was employed to find the optimal number of clusters. To implement this approach, it is necessary to plot the average intra-cluster distance depending on the number of clusters and select the bend of the curve as the number of clusters used. Figure 5 shows how the average distance according to the Euclidean metric changes for each instance of the dataset to the center of the cluster in which it is located.
The optimal number of clusters is at the inflection of the graph (the red dot indicates the “elbow”), since it minimizes the distance between instances of the cluster and its centers but is not redundant. In this way, the clusters are generalized in the best possible way. Using this graph, it was determined that the optimal number of clusters was seven.
The final visualization of clusters using t-SNE is presented in Figure 6, where the centers of the seven selected clusters are marked with asterisks.
According to the figure, cluster No. 1 contains specimens with maximum strength values, while cluster No. 7 contains specimens with minimal strength.
Next, based on information about the belonging of each object to a specific cluster, various descriptive characteristics (features) were formed, which add information content and detail to the understanding of the essence of the data (Table 2).
To select the features that are most significant and can have a significant impact on the process of predicting the final strength value of vibro-centrifuged variatropic concrete, the sequential feature selection algorithm was used.
Initially, all 15 features were taken for analysis (the original X1X4 and the new X5X15), and then we removed from the dataset one of the features, the absence of which improves the accuracy of the model in cross-validation. The algorithm converges iteratively when removing a certain number of features and no longer has the effect of improving the forecast. For each machine learning method implemented in this study, feature selection was carried out individually, which made it possible to generate its own set of the most suitable input features—a feature-engineered dataset. Subsequently, when training, validating and testing machine learning models, each of the datasets (both original and feature-engineered datasets) was divided as follows: 65% for training, 15% for validation and 20% for testing.

3.2. Ridge Regression

Ridge regression (RD) is a modification of linear regression. The main difference from linear regression is that, when training the model, it is additionally penalized quadratically for the value of the norm of weights w, and the penalty is weighted by the hyperparameter λ (lambda). This scheme is also called L2-regularization. In this way, it is possible to control the values of the weights, which makes the model more stable and prevents a sharp increase in the weights. The ridge regression loss function is expressed by the following formula:
J R i d e = X w y 2 + λ w 2
Overall, ridge regression is an important machine learning technique, especially in cases where the input data are highly correlated, as seen in our study.
For the ridge regression method, the eight most significant features were selected in the feature-engineered dataset, shown in Table 2. In addition to the main initial feature X1 (number of freeze–thaw cycles), seven artificially obtained parameters had an impact: Cluster, Cluster_mean, Cluster_std, Cluster_q75, Cluster_q25, Cluster_max, Cluster_neighbours (Table 3).
Despite the elimination of features X2X4, information about them is stored in artificially created features, the obtaining of which is based on preserving the strength of influence of each of the original features on the cluster membership of each instance of the dataset.
The selection of optimal hyperparameter values for ridge regression for both the original dataset and the feature-engineered dataset, performed using Optuna, is shown in Table 4.

3.3. Decision Tree

To tackle regression problems, decision trees (DT) is an effective non-parametric supervised learning approach. Based on data features, the DT decision tree uses simple decision rules to predict the value of a target variable [55]. Trees can be viewed as a piecewise constant approximation; they cannot extrapolate. This predictive analysis method is especially in demand in commercial and industrial data mining applications [56].
A clear advantage of this method is its ease of understanding and interpretation. Trees can be visualized. Figure 7 shows a visualization of the tree built for this study on the original dataset.
Among the disadvantages, it is worth noting that, during the execution of the algorithm, overly complex over-trained trees can be created.
For the DT method, the 10 most significant features were selected in the feature-engineered dataset, shown in Table 5. Features X2X4 turned out to be the least significant for this machine learning method.
To minimize the problem of overfitting for a tree that is prone to this process, hyperparameter optimization is necessary [51]. Table 6 presents the final parameter values for the DT model, selected using Optuna for the original and feature-engineered dataset.
As can be seen from the comparison of hyperparameters, the trees became less deep as the model received higher-level features, due to which it became easier to capture patterns (the generalization ability of the model improved). Among the parameters there is “criterion”, a rule by which the most optimal division of a node in the sheet is selected (options “squared_error”, “friedman_mse”, “absolute_error”, “poisson”). “friedman_mse” is selected, which uses mean squared error with Friedman’s improvement score for potential splits.

3.4. XGBoost

XGBoost (XGB) is an optimized distributed gradient boosting library designed to be highly efficient, flexible and portable [57,58]. It is an ensemble learning method that sequentially builds shallow trees that are further ensembled to achieve a more accurate and reliable prediction. XGBoost has proven itself to be a powerful algorithm in the field of machine learning when solving regression problems.
A characteristic feature of the objective function when implementing this algorithm is that it consists of two parts—the learning loss and the regularization term. The regularization inclusion acts as a penalty, reducing model complexity and improving model generalizability and robustness, as follows:
o b j θ = L θ + Ω θ
where L is the learning loss function; Ω is the regularization term; and θ signifies the parameters that the model learns from the provided dataset.
Our model’s ability to predict the training data is measured by the training loss. The mean squared error is often chosen for L. When implementing the XGBoost algorithm, the responses are summed over all trees of the ensemble:
F x = k = 1 K f k x
where f k is the k-e tree of the ensemble.
For the implementation of the XGBoost method, 14 features turned out to be significant, except for Cluster q50.
Table 7 presents the summary parameters for the XGBoost model. When moving from the original dataset to the feature-engineered dataset, there was a decrease in the number of trees from 1993 to 841, but at the same time the maximum tree depth has increased by three units.
Figure 8 shows XGBoost training graphs ((a)—original dataset, (b)—feature-engineered dataset). The number of trees is represented on the x-axis, while the loss-function values are shown on the y-axis.
Overtraining is not observed in both cases; learning occurs steadily without sudden jumps. The number of trees along the OX axis in Figure 8b is smaller, since, when working with an extended dataset, the XGBoost algorithm identifies dependencies faster.
Since the algorithm is based on a tree structure, it can be visualized for a more detailed understanding of the logic of the method. Figure 9 shows a visualization corresponding to the logic of the algorithm on the original dataset.

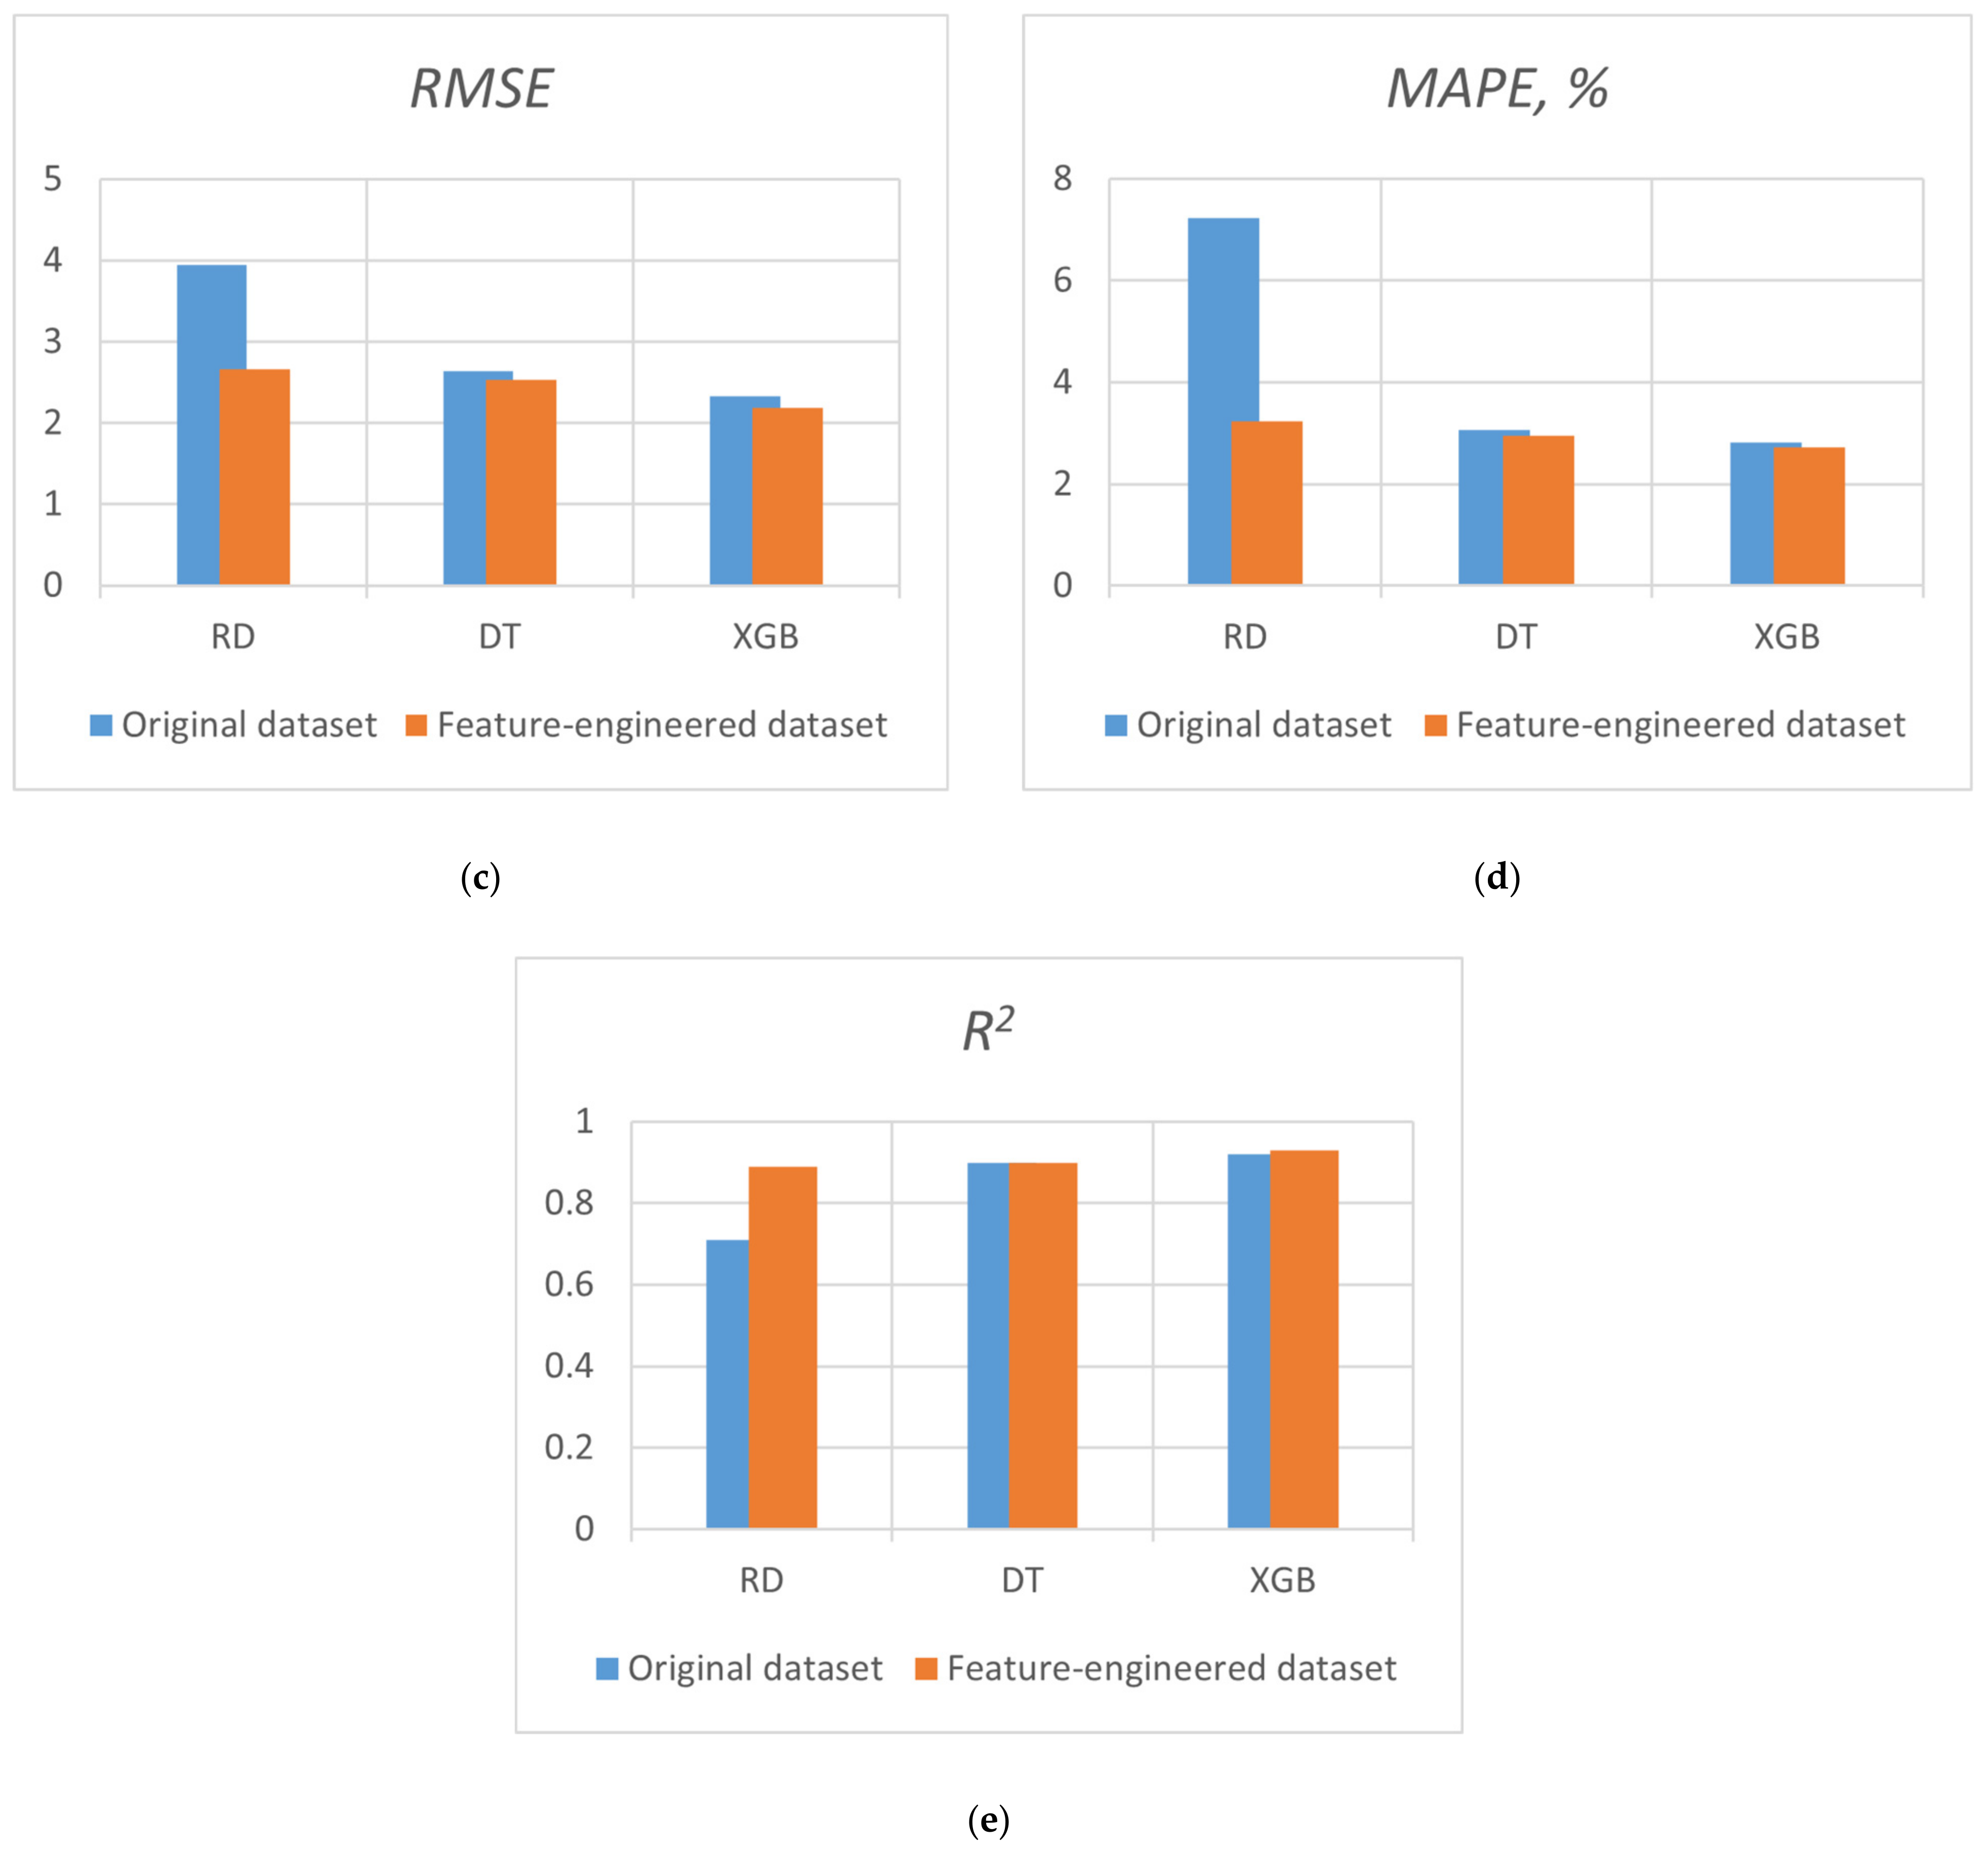
3.5. Assessing the Quality of the Machine Learning Methods Used

The chosen metrics for evaluating and comparing the forecast accuracy of the machine learning models were “mean absolute error” (MAE), “mean squared error” (MSE), “root-mean-square error” (RMSE), “mean absolute percentage error” (MAPE) and the coefficient of determination R2. Below are the formulas for calculating (5)–(9), as follows:
M A E = 1 n i = 1 n y i y ^
M S E = 1 n i = 1 n y i y ^ 2
R M S E = 1 n i = 1 n y i y ^ 2
M A P E = 1 n i = 1 n y i y ^ i y ^ i × 100
R 2 = 1 i = 1 n y i y ^ i 2 i = 1 n y i y ¯ 2
where y i represents the actual value of the compressive strength; y ^ i is the predicted value of compressive strength; and y ¯ is the average value for y i .

3.6. Results of the Used Machine Learning Methods

The prediction error plots presented in Figure 10 reflect the distribution of actual strength values for samples from the test set, in comparison with the values obtained as a result of prediction using the implemented machine learning algorithms. The red lines show the boundary ∆ = ±5 MPa [10].
The worst fit into a given “tube” of acceptable values, as well as a low value of the coefficient of determination, is observed in the RD model trained on the original dataset. However, when checking the RD algorithm on the feature-engineered dataset, a significant improvement in the predictive properties is observed: an increase in R2 to 0.89 and a reduction in the number of emissions outside the specified range ∆ = ±5 MPa, as well as the distribution of points along the blue straight line y = x on the graph. As outliers in Figure 10, when assessing the quality of the model, points are identified that go beyond the boundaries of ±5 MPa. The fight against outliers consisted of using regularization methods at the model training stage.
According to Figure 10, the best fit within the specified boundaries is demonstrated by the XGB algorithm. This is due to the fact that the XGB algorithm itself is a fairly strong model, and a deep analysis of the data made it possible to identify a number of informative features that increased the predictive qualities of the model, reaching a coefficient of determination of R2 = 0.93.
Analyzing Table 8, which shows the metrics calculated on the test specimens, it can be concluded that the XGBoost gradient boosting algorithm for decision trees is the best among the implemented models for predicting the strength of vibro-centrifuged variatropic concrete when analyzing the influence of aggressive environmental factors. At the same time, for all models there is an improvement in metrics when moving from the original dataset to the feature-engineered dataset.
In Figure 11, for a more visual interpretation and a good understanding of the results, Table 8 is visualized in the form of graphs.
Based on the graphs, we can conclude that, when working with a feature-engineered dataset, the metrics of all models improve: errors are reduced, and the coefficient of determination increases. The changes are especially noticeable when working with the ridge regression algorithm. Thus, the average absolute error in percentage decreased from 7.23 to 3.23%, while the root-mean-square error decreased by 2.2 times.
As a result of this research, several predictive models were created based on ML-algorithms, namely ridge regression, decision tree and XGBoost. The implemented models can be used to improve the process of managing the life cycle of vibro-centrifuged variatropic concrete by reducing the time required to determine the compressive strength of new samples that were subject to similar aggressive influences from external factors. It is assumed that data collected in laboratory conditions are as close as possible to data from field conditions. However, to confirm, test calculations should be carried out, based on which it is possible to track the emergence of data drift or concept drift with further adaptation of the algorithm and taking into account new factors, if any are discovered.
The effectiveness of using the implemented machine learning methods to predict the strength of vibro-centrifuged variatropic concrete is comparable to traditional methods. MAE = 1.134627, MSE = 4.801390, RMSE = 2.191208 and MAPE = 2.72%, as well as R2 = 0.93 are not inferior to traditional methods, where these values are usually in the range of 6–7%. Such an error is quite acceptable and adequate for obtaining reinforced concrete products and structures of stable quality. It should be noted that standard calculations in predicting the properties of various reinforced concrete structures differ somewhat depending on the type of these structures. It should be emphasized that, here, we are dealing with vibro-centrifuged concrete; that is, with a rather complex advanced technology. Moreover, the accuracy of predicting such materials with a variatropic structure can reach an error of 10–12%. Here, in our case, we have a significantly lower error; that is, our proposed method is effective, especially for the proposed variatropic vibro-centrifuged concrete. From the point of view of regulatory documents of various countries, the error can reach 13–15%.
Therefore, it is necessary to note the effectiveness of our proposed method and propose it for implementation to manage the life cycle of reinforced concrete structures and products obtained using vibration centrifugation technology, as well as outline prospects for the development of research in the future. They lie in the direction of studying the proposed machine learning methods for reinforced concrete products and structures of other types; for example, with simple structures or variatropic structures of a different nature; for example, obtained not by vibration centrifugation technology, but by other technologies. The practical applicability of the results obtained lies in the direction of introducing these methods at enterprises producing precast reinforced concrete, as well as for specific construction projects that involve the use of particularly high-strength and high-quality vibro-centrifuged elements; for example, columns.
Comparing the results obtained with the results of other researchers who used ML, it can be noted that the performance assessment of the best model is not inferior to the assessment of metric methods in [22,23,24,25], and the root mean square and mean absolute error are lower than in the study that used tree structure model in [27].
To ensure responsible and unbiased use of the machine learning algorithms discussed in this study in actual construction industry practice, as part of the life cycle process of vibro-centrifuged variatropic concrete, the following must be ensured:
-
Transparency and interpretability of results with a clear justification of the limits of acceptable errors. Allowable errors must be within generally accepted building codes and regulations. If the permissible errors are exceeded, the forecast model should be modified.
-
Data security, in cases of supplementing models with information that is not subject to disclosure.
-
Training and regulation. Users of the final product with implemented “smart” algorithms must have clear instructions for their use and intelligently evaluate the decisions made by the system. It is planned to develop a user interface using the Streamlit framework [59].

4. Conclusions

There is a serious deficiency, in both scientific and practical terms, expressed in the lack of a systematic knowledge base, about the life cycle management processes of vibro-centrifuged variatropic concrete using machine learning methods. A comparison was made of the developed machine learning algorithms based on ridge regression, decision tree and XGBoost for predicting the compressive strength of vibro-centrifuged variatropic concrete using a database of 664 samples of experimental values obtained under laboratory conditions. Both theoretical and practical aspects are revealed in the results of the work, as follows:
(1)
A database has been compiled, containing information on vibro-centrifuged concrete strength and its susceptibility to aggressive environmental factors. The collected dataset has been compiled into a database and is planned to be made publicly available to interested researchers.
(2)
A hypothesis was put forward and confirmed about the possibility of dividing data into clusters with the subsequent use of analytical techniques to extract additional knowledge from the dataset, which contributed to improving the final metrics of regression models.
(3)
Machine learning methods have been implemented, optimized and tested; namely, ridge regression, decision tree and XGBoost. The hyperparameters of each model were optimized using the Optuna optimization system.
(4)
The XGBoost model showed the best quality metrics: MAE = 1.134627, MSE = 4.801390, RMSE = 2.191208, MAPE = 2.72% and R2 = 0.93.
(5)
Overall, strength prediction of vibro-centrifuged variatropic concrete using ML methods was found to be effective and accurate. In addition, the use of feature engineering and feature selection techniques made it possible to improve the quality of the models.
(6)
The developed models can provide additional information for civil engineers and materials science specialists to make informed decisions regarding the impact of environmental factors on variatropic concrete strength.
(7)
The models implemented in this study were saved with the best parameters and can later be used to analyze new numerical datasets; predictions of compressive strength values for new samples are made by running through the final XGBoost model.
(8)
It is possible to adapt the algorithms for other types of concrete that face challenging environments. To consider a variety of material properties and transitions, it is recommended to employ data drift, concept drift and domain adaptation technologies. This ensures the inclusion of new relationships without compromising quality. It is planned to develop a user interface using the Streamlit framework.
However, this study is limited to the consideration of four characteristics of environmental influence and, therefore, there is scope for further development. In general, improvement in the research lies in the following areas of development: research into the influence of other aggressive factors, the expansion of a number of ML models and the creation of a user interface.

Author Contributions

Conceptualization, I.R., S.A.S., E.M.S., A.K., N.B., A.C., A.P. and D.E.; methodology, A.K., N.B. and I.R.; software, A.P., T.N.K., N.B., I.R. and A.K.; validation, I.R., A.K., T.N.K., A.P., S.A.S., E.M.S. and A.N.B.; formal analysis, A.K., I.R. and A.C.; investigation, I.R., S.A.S., E.M.S., A.N.B., A.K., N.B., A.C., A.P. and D.E.; resources, T.N.K., I.R, S.A.S. and E.M.S.; data curation, A.K., N.B. and I.R.; writing—original draft preparation, I.R., S.A.S., E.M.S. and A.N.B.; writing—review and editing, I.R., S.A.S., E.M.S. and A.N.B.; visualization, I.R., S.A.S., E.M.S. and A.N.B.; supervision, A.N.B.; project administration, A.N.B.; funding acquisition, E.M.S. and S.A.S. All authors have read and agreed to the published version of the manuscript.

Funding

The research was supported by the Russian Science Foundation, grant No. 23-79-10289, https://rscf.ru/en/project/23-79-10289/ (accessed on 18 April 2024).

Data Availability Statement

The original contributions presented in the study are included in the article, further inquiries can be directed to the corresponding author.

Acknowledgments

The authors would like to acknowledge the administration of Don State Technical University for their resources and financial support.

Conflicts of Interest

The authors declare no conflicts of interest.

References

  1. Akhverdov, I.N. Fundamentals of Concrete Physics; Stroyizdat: Moscow, Russia, 1981; 464p, Available online: https://search.rsl.ru/ru/record/01001052337 (accessed on 15 March 2024).
  2. Leonovich, S.N.; Shalyi, E.E.; Kim, L.V. Reinforced Concrete under the Action of Carbonization and Chloride Aggression: A Probabilistic Model for Life Prediction. Sci. Tech. 2019, 18, 284–291. [Google Scholar] [CrossRef]
  3. Kliukas, R.; Lukoševičienė, O.; Jaras, A.; Jonaitis, B. The Mechanical Properties of Centrifuged Concrete in Reinforced Concrete Structures. Appl. Sci. 2020, 10, 3570. [Google Scholar] [CrossRef]
  4. Refani, A.N.; Nagao, T. Corrosion Effects on the Mechanical Properties of Spun Pile Materials. Appl. Sci. 2023, 13, 1507. [Google Scholar] [CrossRef]
  5. Korolev, E.V.; Bazhenov, Y.M.; Smirnov, V.A. Building Materials of Variatropic Frame Structure; National Research Moscow State University of Civil Engineering: Moscow, Russia, 2011; 304p. [Google Scholar]
  6. Feng, B.; Zhu, Y.-H.; Xie, F.; Chen, J.; Liu, C.-B. Experimental Investigation and Design of Hollow Section, Centrifugal Concrete-Filled GFRP Tube Columns. Buildings 2021, 11, 598. [Google Scholar] [CrossRef]
  7. Indriūnas, S.; Kliukas, R.; Juozapaitis, A. Behavioral Analysis of a Mast with a Combined Prestressed Stayed Columns System and Core of a Spun Concrete Circular Cross-Section. Buildings 2023, 13, 2175. [Google Scholar] [CrossRef]
  8. Shen, Z.; Deifalla, A.F.; Kamiński, P.; Dyczko, A. Compressive Strength Evaluation of Ultra-High-Strength Concrete by Machine Learning. Materials 2022, 15, 3523. [Google Scholar] [CrossRef]
  9. Lapidus, A.; Makarov, A.; Kozlova, A. A Decision Support System for Organizing Quality Control of Buildings Construction during the Rebuilding of Destroyed Cities. Buildings 2023, 13, 2142. [Google Scholar] [CrossRef]
  10. Beskopylny, A.N.; Stel’makh, S.A.; Shcherban’, E.M.; Mailyan, L.R.; Meskhi, B.; Razveeva, I.; Kozhakin, A.; Pembek, A.; Elshaeva, D.; Chernil’nik, A.; et al. Prediction of the Compressive Strength of Vibro centrifuged Concrete Using Machine Learning Methods. Buildings 2024, 14, 377. [Google Scholar] [CrossRef]
  11. Nizina, T.A.; Nizin, D.R.; Selyaev, V.P.; Spirin, I.P.; Stankevich, A.S. Big data in predicting the climatic resistance of building materials. I. Air temperature and humidity. Constr. Mater. Prod. 2023, 6, 18–30. [Google Scholar] [CrossRef]
  12. Abramyan, S.G.; Klyuev, S.V.; Polyakov, V.G.; Sabitova, T.A.; Akopyan, G.O.; Guseynov, K.M. Specifics of information model development for functional conversion of offshore oil platforms. Constr. Mater. Prod. 2023, 6, 42–57. [Google Scholar] [CrossRef]
  13. Elshamy, M.M.M.; Tiraturyan, A.N.; Uglova, E.V.; Elgendy, M.Z. Evaluation of Pavement Condition Deterioration Using Artificial Intelligence Models. Adv. Eng. Res. 2022, 22, 272–284. [Google Scholar] [CrossRef]
  14. Yoon, Y.-S.; Kwon, S.-J.; Kim, K.-C.; Kim, Y.; Koh, K.-T.; Choi, W.-Y.; Lim, K.-M. Evaluation of Durability Performance for Chloride Ingress Considering Long-Term Aged GGBFS and FA Concrete and Analysis of the Relationship between Concrete Mixture Characteristic and Passed Charge Using Machine Learning Algorithm. Materials 2023, 16, 7459. [Google Scholar] [CrossRef]
  15. Chandramouli, P.; Jayaseelan, R.; Pandulu, G.; Sathish Kumar, V.; Murali, G.; Vatin, N.I. Estimating the Axial Compression Capacity of Concrete-Filled Double-Skin Tubular Columns with Metallic and Non-Metallic Composite Materials. Materials 2022, 15, 3567. [Google Scholar] [CrossRef]
  16. Achong, P.S.A.; Guntor, N.A.A. Concrete Strength Prediction Using Linear Regression of Machine Learning Algorithm. Recent Trends Civ. Eng. Built Environ. 2021, 2, 691–699. [Google Scholar]
  17. Neelakantan, T.R.; Ramasundaram, S.; Shanmugavel, R.; Vinoth, R. Prediction of 28-day Compressive Strength of Concrete from Early Strength and Accelerated Curing Parameters. Int. J. Eng. Technol. 2013, 5, 1197–1201. [Google Scholar]
  18. Zain, M.F.; Abd, S.M.; Sopian, K.; Jamil, M.; Che-Ani, A.I. Mathematical regression model for the prediction of concrete strength. In Proceedings of the MAMECTIS’08: Proceedings of the 10th WSEAS International Conference on Mathematical Methods, Computational Techniques and Intelligent Systems, Corfu, Greece, 26–28 October 2008; pp. 396–402. [Google Scholar]
  19. Wan, Z.; Xu, Y.; Šavija, B. On the Use of Machine Learning Models for Prediction of Compressive Strength of Concrete: Influence of Dimensionality Reduction on the Model Performance. Materials 2021, 14, 713. [Google Scholar] [CrossRef]
  20. Khademi, F.; Jamal, S.M.; Deshpande, N.; Londhe, S. Predicting strength of recycled aggregate concrete using Artificial Neural Network, Adaptive Neuro-Fuzzy Inference System and Multiple Linear Regression. Int. J. Sustain. Built. Environ. 2016, 5, 355–369. [Google Scholar] [CrossRef]
  21. Imran, H.; Al-Abdaly, N.M.; Shamsa, M.H.; Shatnawi, A.; Ibrahim, M.; Ostrowski, K.A. Development of Prediction Model to Predict the Compressive Strength of Eco-Friendly Concrete Using Multivariate Polynomial Regression Combined with Stepwise Method. Materials 2022, 15, 317. [Google Scholar] [CrossRef]
  22. Hsieh, S.-C. Prediction of Compressive Strength of Concrete and Rock Using an Elementary Instance-Based Learning Algorithm. Adv. Civ. Eng. 2021, 2021, 10. [Google Scholar] [CrossRef]
  23. Phan, T.D. Fast prediction of the compressive strength of high-performance concrete through a k-nearest neighbor approach. Asian J. Civ. Eng. 2023, 25, 51–66. [Google Scholar] [CrossRef]
  24. Beskopylny, A.N.; Stel’makh, S.A.; Shcherban’, E.M.; Mailyan, L.R.; Meskhi, B.; Razveeva, I.; Chernil’nik, A.; Beskopylny, N. Concrete Strength Prediction Using Machine Learning Methods CatBoost, k-Nearest Neighbors, Support Vector Regression. Appl. Sci. 2022, 12, 10864. [Google Scholar] [CrossRef]
  25. Lyngdoh, G.A.; Zaki, M.; Krishnan, N.A.; Das, S. Prediction of concrete strengths enabled by missing data imputation and interpretable machine learning. Cem. Concr. Compos. 2022, 128, 104414. [Google Scholar] [CrossRef]
  26. Shah, S.A.R.; Azab, M.; Seif ElDin, H.M.; Barakat, O.; Anwar, M.K.; Bashir, Y. Predicting Compressive Strength of Blast Furnace Slag and Fly Ash Based Sustainable Concrete Using Machine Learning Techniques: An Application of Advanced Decision-Making Approaches. Buildings 2022, 12, 914. [Google Scholar] [CrossRef]
  27. Thi Mai, H.-V.; Nguyen, T.-A.; Ly, H.-B.; Tran, V.Q. Prediction Compressive Strength of Concrete Containing GGBFS using Random Forest Model. Adv. Civ. Eng. 2021, 2021, 6671448. [Google Scholar] [CrossRef]
  28. Gupta, P.; Gupta, N.; Saxena, K.K.; Goyal, S. Random Forest Modeling for Fly Ash-Calcined Clay Geopolymer Composite Strength Detection. J. Compos. Sci. 2021, 5, 271. [Google Scholar] [CrossRef]
  29. Shaqadan, A.; Alrawashdeh, M. Prediction of concrete mix strength using random forest model. Int. J. Appl. Eng. Res. 2016, 11, 11024–11029. [Google Scholar]
  30. Al-Abdaly, N.M.; Al-Taai, S.R.; Imran, H.; Ibrahim, M. Development of prediction model of steel fiber-reinforced concrete compressive strength using random forest algorithm combined with hyperparameter tuning and k-fold cross-validation. East.-Eur. J. Enterp. 2021, 5, 59–65. [Google Scholar] [CrossRef]
  31. Stel’makh, S.A.; Shcherban’, E.M.; Beskopylny, A.N.; Mailyan, L.R.; Meskhi, B.; Razveeva, I.; Kozhakin, A.; Beskopylny, N. Prediction of Mechanical Properties of Highly Functional Lightweight Fiber-Reinforced Concrete Based on Deep Neural Network and Ensemble Regression Trees Methods. Materials 2022, 15, 6740. [Google Scholar] [CrossRef]
  32. Al-Taai, S.R.; Azize, N.M.; Thoeny, Z.A.; Imran, H.; Bernardo, L.F.A.; Al-Khafaji, Z. XGBoost Prediction Model Optimized with Bayesian for the Compressive Strength of Eco-Friendly Concrete Containing Ground Granulated Blast Furnace Slag and Recycled Coarse Aggregate. Appl. Sci. 2023, 13, 8889. [Google Scholar] [CrossRef]
  33. Lin, C.-J.; Wu, N.-J. An ANN Model for Predicting the Compressive Strength of Concrete. Appl. Sci. 2021, 11, 3798. [Google Scholar] [CrossRef]
  34. Kim, D.K.; Lee, J.J.; Lee, J.H.; Chang, S.K. Effective Modeling for Construction Activities of Recycled Aggregate Concrete Using Artificial Neural Network. J. Constr. Eng. Manag. 2022, 148, 04021206. [Google Scholar] [CrossRef]
  35. Hamid-Zadeh, N.; Jamali, A.; Nariman-Zadeh, N.; Kasani, H.A. A polynomial model for concrete compressive strength prediction using GMDH-type neural networks and genetic algorithm. In Proceedings of the 5th WSEAS Int. Conf. on System Science and Simulation in Engineering, Tenerife, Canary Islands, Spain, 16–18 December 2006. [Google Scholar]
  36. Chen, X.; Zhang, Y.; Ge, P. Prediction of concrete strength using response surface function modified depth neural network. PLoS ONE 2023, 18, e0285746. [Google Scholar] [CrossRef]
  37. Abed, M.; Mehryaar, E. A Machine Learning Approach to Predict Relative Residual Strengths of Recycled Aggregate Concrete after Exposure to High Temperatures. Sustainability 2024, 16, 1891. [Google Scholar] [CrossRef]
  38. Zheng, J.; Yao, T.; Yue, J.; Wang, M.; Xia, S. Compressive Strength Prediction of BFRC Based on a Novel Hybrid Machine Learning Model. Buildings 2023, 13, 1934. [Google Scholar] [CrossRef]
  39. Yang, Y.; Liu, G.; Zhang, H.; Zhang, Y.; Yang, X. Predicting the Compressive Strength of Environmentally Friendly Concrete Using Multiple Machine Learning Algorithms. Buildings 2024, 14, 190. [Google Scholar] [CrossRef]
  40. Nazar, S.; Yang, J.; Ahmad, W.; Javed, M.F.; Alabduljabbar, H.; Deifalla, A.F. Development of the New Prediction Models for the Compressive Strength of Nanomodified Concrete Using Novel Machine Learning Techniques. Buildings 2022, 12, 2160. [Google Scholar] [CrossRef]
  41. Bader, A.A.A.; Habibur, R.S. The Role of Hybrid Machine Learning for Predicting Strength Behavior of Sustainable Concrete. Civ. Eng. Arch. 2023, 11, 2012–2032. [Google Scholar] [CrossRef]
  42. Hameed, M.M.; Abed, M.A.; Al-Ansari, N.; Alomar, M.K. Predicting Compressive Strength of Concrete Containing Industrial Waste Materials: Novel and Hybrid Machine Learning Model. Adv. Civ. Eng. 2022, 2022, 5586737. [Google Scholar] [CrossRef]
  43. Pham, A.D.; Ngo, N.T.; Nguyen, Q.T. Hybrid machine learning for predicting strength of sustainable concrete. Soft Comput. 2020, 24, 14965–14980. [Google Scholar] [CrossRef]
  44. Beskopylny, A.N.; Stel’makh, S.A.; Shcherban’, E.M.; Mailyan, L.R.; Meskhi, B.; Chernil’nik, A.; El’shaeva, D.; Pogrebnyak, A. Influence of Variotropy on the Change in Concrete Strength under the Impact of Wet–Dry Cycles. Appl. Sci. 2023, 13, 1745. [Google Scholar] [CrossRef]
  45. Beskopylny, A.N.; Shcherban’, E.M.; Stel’makh, S.A.; Mailyan, L.R.; Meskhi, B.; Chernil’nik, A.; El’shaeva, D. Influence of Variatropy on the Evaluation of Strength Properties and Structure Formation of Concrete under Freeze-Thaw Cycles. J. Compos. Sci. 2023, 7, 58. [Google Scholar] [CrossRef]
  46. Shcherban’, E.M.; Stel’makh, S.A.; Beskopylny, A.N.; Mailyan, L.R.; Meskhi, B.; Varavka, V.; Chernil’nik, A.; Elshaeva, D.; Ananova, O. The Influence of Recipe-Technological Factors on the Resistance to Chloride Attack of Variotropic and Conventional Concrete. Infrastructures 2023, 8, 108. [Google Scholar] [CrossRef]
  47. Shcherban’, E.M.; Stel’makh, S.A.; Beskopylny, A.N.; Mailyan, L.R.; Meskhi, B.; Elshaeva, D.; Chernil’nik, A. Physical and Mechanical Characteristics of Variotropic Concrete during Cyclic and Continuous Sulfate Attack. Appl. Sci. 2023, 13, 4386. [Google Scholar] [CrossRef]
  48. Liu, J.; Zang, S.; Yang, F.; Zhang, M.; Li, A. Fracture Mechanical Properties of Steel Fiber Reinforced Self-Compacting Concrete under Dry–Wet Cycle Sulfate Attack. Buildings 2022, 12, 1623. [Google Scholar] [CrossRef]
  49. SP 28.13330.2017 Protection against Corrosion of Construction. Available online: https://docs.cntd.ru/document/456069587 (accessed on 15 March 2024).
  50. Akiba, T.; Sano, S.; Yanase, T.; Ohta, T.; Koyama, M. Optuna: A Next-generation Hyperparameter Optimization Framework. arXiv 2019, arXiv:1907.10902v1. Available online: https://arxiv.org/pdf/1907.10902.pdf (accessed on 15 March 2024).
  51. Wakjira, T.G.; Ibrahim, M.; Ebead, U.; Alam, M.S. Explainable machine learning model and reliability analysis for flexural capacity prediction of RC beams strengthened in flexure with FRCM. Eng. Struct. 2022, 255, 113903. [Google Scholar] [CrossRef]
  52. Frost, J. Regression Analysis: An Intuitive Guide for Using and Interpreting Linear Models, 1st ed.; Jim Publishing: Costa Mesa, CA, USA, 2020; p. 223. Available online: https://statisticsbyjim.com/ (accessed on 18 April 2024).
  53. van der Maaten, L.; Hinton, G. Visualizing High-Dimensional Data Using t-SNE. J. Mach. Learn. Res. 2008, 9, 2579–2605. [Google Scholar]
  54. Syakur, M.A.; Khotimah, B.K.; Rochman, E.M.S.; Satoto, B.D. Integration K-Means Clustering Method and Elbow Method for Identification of The Best Customer Profile Cluster. IOP Conf. Ser. Mater. Sci. Eng. 2018, 336, 012017. Available online: https://iopscience.iop.org/article/10.1088/1757-899X/336/1/012017 (accessed on 18 April 2024).
  55. Quinlan, J.R. Induction of Decision Trees. Mach. Learn. 1986, 1, 81–106. [Google Scholar] [CrossRef]
  56. Apte, C.; Weiss, S. Data mining with decision trees and decision rules. Future Gener. Comput. Syst. 1997, 13, 197–210. [Google Scholar] [CrossRef]
  57. Chen, T.; Guestrin, C. XGBoost: A Scalable Tree Boosting System. arXiv 2016, arXiv:1603.02754. [Google Scholar] [CrossRef]
  58. Babushkina, N.E.; Lyapin, A.A. Solving the Problem of Determining the Mechanical Properties of Road Structure Materials Using Neural Network Technologies. Adv. Eng. Res. (Rostov-on-Don) 2022, 22, 285–292. [Google Scholar] [CrossRef]
  59. Wakjira, T.G.; Abushanab, A.; Alam, M.S. Hybrid machine learning model and predictive equations for compressive stress-strain constitutive modelling of confined ultra-high-performance concrete (UHPC) with normal-strength steel and high-strength steel spirals. Eng. Struct. 2024, 304, 117633. [Google Scholar] [CrossRef]
Figure 1. Visualization of the research process.
Buildings 14 01198 g001
Figure 2. Correlation matrix.
Buildings 14 01198 g002
Figure 3. Data characteristics distribution of input and output variables: blue dots are experimental data; light blue dots are predicted values; blue line is probability distribution density.
Buildings 14 01198 g003
Figure 4. Clusters in the data.
Buildings 14 01198 g004
Figure 5. Determining the optimal number of clusters.
Buildings 14 01198 g005
Figure 6. Result of cluster analysis.
Buildings 14 01198 g006
Figure 7. Visualization of a decision tree.
Buildings 14 01198 g007
Figure 8. XGBoost training: (a) on original dataset; (b) on feature-engineered dataset.
Buildings 14 01198 g008
Figure 9. Visualization of XGBoost.
Buildings 14 01198 g009
Figure 10. Graphs of forecast errors for (a) RD/original dataset; (b) RD/feature-engineered dataset; (c) DT/original dataset; (d) DT/feature-engineered dataset; (e) XGB/original dataset; (f) XGB/feature-engineered dataset.
Buildings 14 01198 g010
Figure 11. Graphical interpretation of quality metrics (a) MAE; (b) MSE; (c) RMSE; (d) MAPE; (e) R2.
Buildings 14 01198 g011aBuildings 14 01198 g011b
Table 1. Data description.
Number of
Freeze–Thaw Cycles
Chloride Content (mg/dm3)Sulfate Content (mg/dm3)Number
of Wet–Dry Cycles
Compressive Strength (MPa)
Mean124.38774.85621.37249.9841.51
Std.71.9272.1580.03148.648.59
Min1.00650.00450.001.0028.50
25%61.00715.75562.75120.7533.90
50%120.00768.50626.00236.5040.35
75%188.00837.25690.00377.2548.53
Max250.00900.00750.00500.0063.20
Table 2. Additional features based on knowledge about the cluster.
NoParameterFeatureCharacteristics
1X5ClusterCluster number
2X6Cluster_mean (Cluster_q50)Average target value in the cluster
3X7Cluster_stdStandard deviation of target in cluster
4X8Cluster_q9595th percentile of target values in the cluster
5X9Cluster_q7575th percentile of target values in the cluster
6X10Cluster_q2525th percentile of target values in the cluster
7X11Cluster_q55th percentile of target values in the cluster
8X12Cluster_medianMedian of target values in a cluster
9X13Cluster_maxMaximum target value in the cluster
10X14Cluster_minMinimum target value in the cluster
11X15Cluster_neighboursAverage of the nearest neighbors to our point in 4th space
Table 3. Feature-engineered dataset for ridge regression.
MethodNumber of Selected FeaturesFeatures
Ridge Regression8Number of freeze–thaw cycles
Cluster
Cluster_mean
Cluster_std
Cluster_q75
Cluster_q25
Cluster_max
Cluster_neighbours
Table 4. Parameters for RD.
NoParameterDefinitionOriginal DatasetFeature-Engineered Dataset
1λThe Power of Regularization0.0425050.072677
Table 5. Parameters for DT.
MethodNumber of Selected FeaturesFeatures
Decision tree10Number of freeze–thaw cycles
Cluster_mean
Cluster_std
Cluster_q75
Cluster_q25
Cluster_q5
Cluster_q95
Cluster_q50
Cluster_max
Cluster_min
Table 6. Parameters for the DT model.
NoParameterDefinitionOriginal DatasetFeature-Engineered Dataset
1CriterionCriterion that was used to construct each branchfriedman msefriedman mse
2Max depthMax depth of one tree684255
3Min samples split“Minimum number of objects in a sheet to split it”72
4Min samples leaf“Minimum number of objects in a sheet for it to exist”24
Table 7. Parameters for XGB.
NParameterDefinitionOriginal DatasetFeature-Engineered Dataset
1lambdaL2 regularization0.4252075030.0675070558
2alphaL1 regularization0.0055203390.0053793840
3Colsample bytreethe proportion of features that will be used to construct each tree10.6
4subsamplefraction of the training sample that will be used to build each tree0.80.6
5learning_ratelearning rate0.0140.016
6n estimatorsnumber of trees1993841
7Max depthmaximum tree depth1114
Table 8. The obtained metrics values on the test sample.
NModelMAEMSERMSEMAPE, %R2
1RD/Original dataset3.03580915.6012313.9498397.230.71
2RD/Feature-engineered dataset1.3646477.0619222.6574283.230.89
3DT/Original dataset1.2907146.9577452.6377543.060.90
4DT/Feature-engineered dataset1.2520096.4041982.5306522.950.90
5XGB/Original dataset1.1818085.4131742.3266232.820.92
6XGB/Feature-engineered dataset1.1346274.8013902.1912082.720.93
Disclaimer/Publisher’s Note: The statements, opinions and data contained in all publications are solely those of the individual author(s) and contributor(s) and not of MDPI and/or the editor(s). MDPI and/or the editor(s) disclaim responsibility for any injury to people or property resulting from any ideas, methods, instructions or products referred to in the content.

