
Research on the Crushing of Reinforced Concrete Two-Way Slabs by Pulse Power Discharge Technology

1
College of Civil Engineering and Architecture, Xiamen City University, Xiamen 361008, China
2
Fuzhou Academy of Building Research Co., Ltd., Fuzhou 350001, China
3
Xiamen Municipal Construction Group Co., Ltd., Xiamen 361008, China
4
Huadong Engineering (Fujian) Corporation Limited, Fuzhou 350003, China
*
Author to whom correspondence should be addressed.
Buildings 2024, 14(5), 1222; https://doi.org/10.3390/buildings14051222
Submission received: 12 March 2024
/
Revised: 19 April 2024
/
Accepted: 22 April 2024
/
Published: 25 April 2024
(This article belongs to the Special Issue Dynamic Response of Structures)
Abstract
:The application of pulse power discharge (PPD) technology in the crushing and dismantling of concrete structures has characteristics related to both green and environmental protection, as well as safety and reliability, with broad application prospects in the construction and municipal engineering fields in dense urban areas. Nevertheless, the research into using this technology to break reinforced concrete (RC) slabs is very limited, while the influence of key parameters on the crushing effect of reinforced concrete slabs is not clear. To solve this problem, a finite element model of an RC slab was established by ABAQUS. The effect of a shock wave generated by PPD on the surrounding concrete was simulated by an explosion-load equivalent, and the development process of concrete crack was simulated by a cohesive force model. Based on the results of the model analysis, the effects of reinforcement spacing, as well as diameter and concrete strength on the crushing effect of RC slabs were investigated. The results show that the increase in reinforcement diameter and the decrease in reinforcement spacing have a significant effect on limiting the development of cracks. According to the development of cracks, they can be divided into three types: edge cracks, cracks between central holes, and cracks between edge holes. The influence of reinforcement spacing and diameter on the first two crack widths is the most obvious. The increase in concrete strength also reduces the width of cracks. Based on the analysis results, the calculation expressions of the crushing effect of the PPD technique on RC slabs were established, which provides theoretical support for the popularization and application of this technique.
1. Introduction
With the continuous advancement of the global urbanization process, a large number of urban buildings and municipal engineering structures need to be demolished [1]. In some special cases (such as medium- and high-rise buildings in dense urban areas, as well as municipal engineering facilities that have a strict impact on the surrounding environment), problems such as environmental pollution, uncontrollable crushing effect, and hidden safety hazards existing in traditional demolition methods, such as mechanical demolition and blasting demolition, have become more and more prominent [2]. In addition, at present, the waste concrete in most areas of construction and municipal engineering is transported to the suburbs for landfill, while a small part is used for building or road cushion use; however, the utilization rate is low. If the crushing and demolition is carried out according to the predetermined effect, it will be conducive to the reuse of the waste concrete. Therefore, the development of green demolition technology with environmental protection, energy saving, safety and reliability, and controllable crushing effects has become a focus of attention [3,4,5,6]. Among them, pulse power discharge (PPD) technology has been widely used in the fields of underwater plasma sound sources [7], extracorporeal lithotripsy [8], metal forming [9], mining [10], oil-well plugging removal [11], etc., and it has the advantages of high efficiency, low noise, no harmful gases, low vibration, controllable crushing effects, etc. [12]. At present, some researchers have tried to break brittle solid materials by using this technology, placing high and low electrodes on solid surfaces at intervals. When a high voltage is released between the electrodes, the inside of the solid material is electrically broken down, forming a plasma channel, which expands and leads to internal rupture [13]. This technique can be called the direct-shock piercing method. The effects of discharge parameters, material properties, and other factors on electrical breakdown were experimentally and theoretically analyzed [14,15,16,17,18]. However, most of them involve the surface stripping of brittle materials, such as rocks and concrete [19,20], while the construction efficiency of large volume structures is low. Another method involves putting the solid to be broken in the liquid while the two electrodes are also placed in the liquid. When high voltage electricity is passed into the electrode, the liquid between the two electrodes is broken down, forming a plasma channel. If in a closed space, due to the incompressibility of the surrounding liquid, the shock wave generated by the expansion of the plasma is transmitted to the nearby solid material, thus causing damage to it. This method can be called the electrohydraulic effect method, but the problem is that the conversion rate of initial electric energy into released impact energy is relatively low [21,22,23]. Similarly, a metal wire is wound between electrodes. When the electrode is passed through high voltage electricity, the metal wire is broken down by the strong current to form plasma, and the resulting shock wave damages the surrounding brittle material. This method can be called the wire explosion method, which has a higher conversion rate of electrical energy to impact energy than the electro-hydraulic effect method [24,25].
In terms of experimental research on PPD-crushing of brittle materials, Zhao [26] uses PPD technology to conduct crushing tests on waste photovoltaic panels. The results show that PPD has the most obvious crushing effect on silver, followed by Si and glass. The recovery rate of silver can be effectively improved by adjusting the electrode gap. When Song [27] conducted the test, the PPD voltage was 160 kV, with 300 pulse times, and the energy consumption was 192.99 J/g, while the photovoltaic panels could be broken into particles with an average size of 4.1 mm (13.7% of the initial size). Yan [28,29] conducted PPD tests on anthracite and bituminous coal samples at different breakdown voltages and capacities. The results show that the electric impulse penetration of anthracite coal is mainly realized through the thermal breakdown stage and the electrical breakdown stage. The duration of the former is longer, while the duration of the latter is shorter. The seepage pores of coal samples show obvious fractal characteristics, and several radial tensile microcracks are formed in the coal body. The electric capacity has no significant effect on the breakdown voltage of the coal body, and increasing the electric capacity can effectively improve the porosity of coal core. Lay [30] designed a new electrode that integrates ore crushing and size-based separation into a single step, increasing efficiency. Qin [31] first conducted a PPD pre-treated magnetite quartzite test study, and the results showed that the relative grindability increased significantly with the increase in pulse number, then decreased with the increase in grinding fineness and grinding time. Subsequently, the PPD crushing ore test [32] was carried out, and it was found that PPD could significantly reduce the mechanical strength of the ore and improve the grinding efficiency of the ore. Yan [33] studied the critical crushing characteristics and influencing factors of ore particles in regard to PPD, analyzing the transformation of crushing mechanism, discussing the energy conversion efficiency in the process of PPD crushing, and revealing the law of influence of ore particles on PPD crushing. Yin [34] conducted a PPD experiment on the change in peak voltage of the heated granite sheet, using the Particle Flow Code numerical simulation method to simulate the pulse power crushing process of the granite. The PPD-crushing process and crack propagation mode of granite are described. At present, there is a lack of research on PPD crushing test of reinforced concrete members, and the main ones are the crushing of small-volume block materials equipped with reinforcements. Yudin [35] conducted a PPD crushing test on a reinforced concrete block sized 600 mm × 450 mm × 300 mm. The results showed that the reinforced concrete block could be broken by multiple dischargings under a single release of 1 kJ energy. Shigeru [36] conducted a PPD crushing test on a reinforced concrete block of 500 mm × 500 mm × 80 mm, adopting a liquid that can cause secondary detonation as the discharge medium. Uenishi [37] et al. have carried out PPD crushing tests on cylindrical concrete specimens, and the results show that this method can produce multiple cracks on reinforced concrete specimens. Wang conducted systematic PPD test studies on reinforced concrete slabs [38], columns [39] and beams [40], respectively. The results show that reinforced concrete members can be broken effectively under multiple discharges, and the breaking effect of reinforced concrete columns can only be achieved by increasing the number of discharges accordingly. The cross-section size and reinforcement amount of beams, slabs, and columns used in the test are constant, and the variable parameters are the discharge voltage and number of explosive wires.
In terms of the simulation of PPD crushing solid materials, Zhu [41,42] conducted simulation research on PPD crushing granite and proposed the mechanism of electrical breakdown. According to the simulation results, the breakdown process of brittle material electrical breakdown is subdivided into partial electrical breakdown and complete electrical breakdown. The finer the granite size, the better the PPD breakage degree. The total length of the plasma channel is positively correlated with the energy efficiency of PPD. Based on the simulation results, the relation expressions among voltage loading parameters, electrode structure parameters, and rock electrical parameters were established. Li [43] used the time-transient dielectric breakdown model and finite difference numerical method to study the electrodynamic mechanism of electrical breakdown. The simulation results show that the highly conductive inclusions can reduce the minimum voltage required for the breakdown of mineralized particles. Che [44] studied the response of discharge channels during PPD-based granite crushing by using a physical mathematical model and a numerical simulation model. The results show that increasing the initial voltage of the PPD power supply can improve the crushing effect. Tan [45] established a PPD crushing-energy calculation model for coal with a wide coarse-particle size distribution through the analysis of coal particle size distribution and the energy particle size relationship. Kuznetsova [46] established an analytical model of PPD that describes the operation of the discharge loop, the initiation and expansion of the plasma channel, as well as the generation and propagation of shock and pressure waves in destructible solids. It is shown that the fracture efficiency of the solid depends on the pressure pulse waveform, which in turn depends on the rate of deposition of electrical energy into the plasma channel. Ouyang [47] proposed a numerical solution of PPD-fractured rock based on a hydrodynamic model. Shi [48] used the user subroutine provided by ANSYS AUTODYN to build a coupling model containing the circuit, the burst wire, and the surrounding water to simulate the copper wire explosion in the liquid.
In summary, researchers have conducted a preliminary study on the application of PPD technology in the demolition of buildings and municipal engineering structures. However, the current experimental and simulation studies mainly focus on brittle materials such as rock, coal seam, and plain concrete, which are quite different from the mechanical properties of reinforced concrete structures in practical engineering. The findings of this research are not directly transferable to the context of reinforced concrete structures. This is due to the presence of reinforcement bars within these structures, which significantly constrain the progression of cracking. Such limitations play a crucial role in affecting the structural integrity, specifically in terms of resistance to crushing and demolition [49]. However, the existing research takes the discharge energy as the change parameter and does not consider the influence of the key parameter of reinforcement dosage. Therefore, the current theoretical and experimental research of PPD technology crushing reinforced concrete members is obviously not enough to support the popularization and application of this technology in engineering. The research on the plane structure, such as with the reinforced concrete slab, is even less. In order to solve this problem, the CONWEP model was used to simulate the impact load generated by PPD, and the cohesive force model was used to simulate the cracks of concrete so as to realize the real-time observation of the crack width and extension length of reinforced concrete slabs at different periods. The model of reinforced concrete slab established in this paper takes the diameter of reinforcement, spacing, and strength of concrete as parameters, considering the different constraints on the crack development at different positions in the slab. The influence law of key parameters on the effect of PPD crushing reinforced concrete slabs was analyzed systematically, and the corresponding mathematical expression of PPD crushing reinforced concrete slabs was established. The research in this paper will provide a theoretical basis for the application of PPD-broken reinforced concrete slabs.
2. Methods and Models
2.1. Methods
In order to investigate the effect of reinforcement spacing, reinforcement diameter, and concrete strength on the PPD crushing effect, ABAQUS finite element software v.2021 was used to simulate and analyze the whole process of PPD crushing. The discharge voltage of 100 kV and 60 copper wires were used as the basic parameters. The plane size of the reinforced concrete slab was 1600 mm × 1600 mm, the thickness was 140 mm, and the bottom two-way single-layer reinforcement was adopted. The steel bars were evenly distributed, and the spacing was 100 mm, 150 mm, 200 mm, 250 mm, and 300 mm, respectively. The diameter of the reinforcement was selected as 6 mm, 8 mm, 10 mm, 12 mm, and 14 mm, respectively. Cylindrical holes were set in the concrete slab, 120 mm away from the bottom, to simulate the pre-drillings of the concrete slab in the actual project. The borehole diameter was 40 mm, and the interval of 300 mm was evenly arranged in the concrete slab. The distance from the outermost hole to the edge of the slab was 200 mm. The concrete strength grades were C30, C40, and C50. The discharge method was to insert the copper wire with a wound electrode into the pre-drilling hole of the slab, applying a high voltage to make the copper wire form plasma and expand in a closed space in order to generate an impact load on the surrounding concrete. Since the shock wave generated by PPD is similar to the shock wave generated by an explosion, the impact load generated by PPD was equivalently simulated by using an explosion load in the finite element model. Another difficulty in the process of model building is to simulate and monitor the crack width of the concrete slab under the impact load. In this paper, a bilinear cohesive force model is introduced to solve this problem. In the area where the cohesive force unit is set, the material gradually transitions from the undamaged state to the completely separated state in the process of gradual stress, and this transition is described by the damage initiation rule and damage evolution rule of the cohesive force unit. The crack width can be observed in real time by reading the distance of the adjacent cohesive force units.
2.2. Concrete Material Model
Concrete Damaged Plasticity (CDP) model was used to simulate the concrete.
2.2.1. Tensile and Compressive Constitutive Relation of Concrete
In the CDP model, it is necessary to define the stress–strain relationship of concrete under tension and compression, as well as the evolution process of damage under load. For the tensile and compressive behavior of concrete, the stress–strain curves of concrete under tension and compression are shown in Figure 1, and the specific constitutive equations can be seen from reference [50].
2.2.2. Damage Factor
The uniaxial stress–strain relationship curve in Figure 1 does not consider the plastic deformation of the material. If the calculation results are calculated directly, the plastic strain will not be included, and it is easy to cause the problem of non-convergence of the finite element calculation. Starting from the concept of effective stress tensor, Sidoroff, F. et al. proposed a general method to solve anisotropic damage and summarized the principle of energy equivalence [51,52]. Based on the energy equivalence principle, the damage evolution parameter d is converted into damage factor. The conversion relationship between damage evolution parameter d and damage factor D is shown in Equation (1).
2.2.3. Dynamic Amplification Factor
The dynamic amplification factor of a material is a parameter that quantifies the degree to which the response of a material is enhanced under dynamic loads compared to static loads. This coefficient represents the difference between the behavior of a material under dynamic and static loads. According to the dynamic amplification factor, the strength of materials under dynamic loading can be calculated, such as impact, explosion, etc. [53,54]. Due to the extremely high strain rate generated by the material under the explosive load, the strength of the material will be increased at the high strain rate. Therefore, DIF (Dynamic Increase Factor) is introduced, which is equal to the ratio of dynamic strength to static strength [55]. The dynamic amplification coefficients of concrete and rebar are shown in Equations (2) and (3).
where: fdc is the dynamic compressive strength of concrete, fc is the compressive strength of concrete, and fdy is the dynamic yield strength of reinforcement. Additionally, fy is the yield strength of reinforcement, fdu is the dynamic ultimate strength of reinforcement, fu is the ultimate strength of the reinforcement.
2.3. Establishment of the Slab Model
The constraints of the concrete slab were free on four sides, and the concrete model was divided into a finite element model consisting of hexahedral units with a mesh size of 10 mm using structural meshing techniques. The mesh size was more uniform by the way of separate seed distribution at the edge of the drilling hole. The mesh division of the whole concrete slab and the mesh division around the drilling hole is shown in Figure 2. The partition of the hexahedral element grid needs to ensure that every part of the whole structure is a hexahedron. For some complex structures, the automatic generation of a hexahedral element is relatively difficult. However, hexahedral mesh still has significant advantages compared with other types of mesh in finite element analysis, as it simultaneously considers all nodes and elements in the entire structure, ensuring the continuity and structural integrity of the mesh and helping to improve the stability and accuracy of numerical calculation. In addition, hexahedral meshes require fewer units while maintaining the same analytical accuracy, significantly reducing storage requirements. Concrete was simulated using an 8-node solid unit C3D8R.
2.4. The Material Model of Steel
A double broken-line reinforced plastic model is used to describe the stress–strain response of steel. After the reinforcement enters the yield state, the stress–strain curve can be approximated as a straight line with a lower slope, which is conducive to the stability and convergence behavior of the calculation in the numerical simulation. The reinforced plastic model is shown in Figure 3, where εu is the ultimate strain of the reinforcement, εy is the yield strain of the reinforcement, fu is the ultimate strength of the reinforcement, and fy is the yield strength of the reinforcement. The specific constitutive equation can be seen in reference [50].
2.5. Establishment of the Reinforcement Model
The reinforcement model is usually created using linear geometry, and its diameter can be determined by entering the reinforcement section area when setting the section type to truss. The reinforcement model adopts the free grid division technique to divide the grid, and the mesh size is 10 mm. The interaction between the reinforcement and concrete is performed using the built-in zone method, which simplifies the model construction process and allows the reinforcement to be directly embedded in the concrete unit without complex mesh matching, making it suitable for structural simulations of various complexities. More importantly, it can better-simulate the effect of reinforcement on the stress distribution in concrete, which is particularly important for the study of concrete cracks. The unit type of reinforcement is the T3D2 unit. The T3D2 is a three-dimensional truss unit with two nodes specifically designed to withstand axial tensile or compressive forces. The unit type is simple in structure and can effectively simulate the main axial force of the reinforcement. In addition, the T3D2 unit accurately represents the behavior of the reinforcement under various loading conditions and is compatible with the concrete unit; therefore, it effectively represents the interaction between the reinforcement and concrete.
2.6. Equivalence of Impact Loads
2.6.1. CONWEP Model
The CONWEP model can simulate the shock wave effect generated by an explosion, and its main advantage is that it considers the change law of a shock wave in terms of space and time dimensions, also integrating the formation, diffusion, and interaction with the structures of the shock wave [56]. Therefore, the CONWEP model can efficiently simulate the effect of an explosion on the structure without the need to establish a medium unit, which can significantly improve the computational efficiency [57,58]. In ABAQUS, the CONWEP model needs to be set in the interaction module, and the TNT equivalent and the distance from the explosion loading point to the action surface needs to be given during calculation so that the overpressure of the explosive acting on the structure can be calculated. In this paper, the loading point of the explosion is the center of the drilling hole, and the explosion distance R is the radius of the drilling hole. The loading diagram of CONWEP inside the drill hole in the reinforced concrete slab and the loading in ABAQUS is shown in Figure 4.
The CONWEP model calculates the explosion impact pressure based on the proportional distance Z, and the explosion shock wave pressure Ps can be expressed as a function of the proportional distance Z, as shown in Equation (4).
Since the destruction effect of the explosion mainly depends on the energy of the explosive and the distance from the explosion source to the action surface, the proportional distance Z can be expressed by the explosive quantity W and the detonation distance R in the calculation formula of overpressure, as shown in Equation (5).
By inserting Equation (5) into Equation (4), Equation (6) can be obtained:
By expanding Equation (6) into a power series form, Equation (7) is obtained.
2.6.2. Equivalence of Shock Pressure
The impact pressure of pulse power on the hole wall is affected by many factors, such as peak pressure, circuit capacitance, and discharge voltage, among which the energy released by discharge equipment directly affects the impact pressure. According to the experimental research results of shock wave characteristics of discharge in liquid conducted by Touya et al. [59], the empirical formula of impact compression stress P is shown in Equation (8).
where: E1 is the energy released in the liquid and d is the distance between the discharge point and the test point.
Considering the similarity of the shock wave generation and propagation between the discharge explosion of metal wire in liquid and the conventional explosion, the shock wave generated by the discharge explosion of metal wire in water is simulated by the shock pressure equivalent method and the CONWEP model in ABAQUS.
2.7. Simulation of Concrete Crack Propagation Based on Cohesive Force Model
The cohesive force model was used to simulate the cracking of concrete. The cohesive force model is a model that describes the interaction force between the crack surfaces inside the material. It takes into account the friction, tension and shear between the crack surfaces, and it can more truly simulate the failure and crack expansion process of concrete under stress. When cracks in concrete structures expand to a certain extent, the cohesion force can no longer effectively resist the further expansion of cracks, resulting in structural damage [60]. When the cohesive force model is applied in ABAQUS, a layer of cohesive force unit is usually embedded in the middle of two adjacent solid units, and the crack will propagate forward along the cohesive force unit. According to the corresponding tractive force displacement relationship, the stress of the cohesive force element decreases continuously under the action of load until the element fails and, finally, cracks are formed. The cohesive force model describes the material behavior between cracks, which defines the relationship between the opening or sliding displacement of cracks and the tractive force on the crack surface. Its main function is to simulate the formation and expansion process of tiny cracks in the material.
The key of the cohesive force model to simulate crack development is to simulate the nonlinear fracture process near the crack tip. In the region where the cohesive force unit is set, the fracture process of the material is no longer a simple binary state (that is, complete or broken), but a continuous damage evolution process. In this process, the material gradually transitions from the undamaged state to the completely separated state, which is described by the damage initiation rule and the damage evolution rule of the cohesive force unit. Among them, the damage initiation rule of the cohesive force unit can be used to determine the initial damage. When the stress and strain at the crack tip reach the critical value, the stiffness of the material at the cohesive force unit begins to decrease, which marks the beginning of the damage.
In ABAQUS, it is not necessary to separate the grid for the cohesive force unit, and the establishment of the cohesive force model requires the grid division of the concrete slab first, followed then by selecting a specified position in the concrete grid model according to the occurrence of cracks to insert the cohesive force model so as to simulate the crack development behavior of the concrete slab under stress. It can be seen from the test results of broken reinforced concrete slabs by a metal wire explosion in liquid that cracks mainly occur between drilling holes and between drilling holes and the edge of the slabs. The cohesive force unit is inserted according to the location of cracks in the test, as shown in Figure 5.
The cohesive force model in this paper uses a bilinear cohesive force constitutive relation, a maximum nominal stress criterion (MAXS) as damage initiation criterion, and an energy-based damage evolution process. The Cohesive force model in ABAQUS is based on COH3D8 (namely, a three-dimensional eight-node cohesive force unit). The cohesive force unit inserted between adjacent units is shown in Figure 6. In Figure 6, 1 and 1’, 2 and 2’, 3 and 3’, 4 and 4’ are adjacent cells, respectively. The unit is specially designed to simulate the damage and separation of the interface between materials, and it is often used to simulate the stratification and fracture behavior of materials, being able to effectively simulate the cracking process of concrete materials. The crack width can be obtained by measuring the spacing of adjacent cohesive force elements.
3. Model Verification
3.1. Model Test
Wang [46] conducted a pulse power discharge crushing test on six reinforced concrete slabs. The plane size of the slab was 1.6 m × 1.6 m, the thickness was 140 mm, and the bottom of the slab was equipped with ![Buildings 14 01222 i001]() . The specific crushing method was to pre-drill the reinforced concrete slab 300 mm or 400 mm apart, and so the distance from the outermost row hole to the edge of the slab was 200 mm, the aperture was 40 mm, the hole depth was 110 mm, and this hole was filled with tap water. A copper wire was wound around the electrode and inserted into the borehole to generate pulsed power by releasing high voltage electricity. The mechanical properties of concrete and reinforcement are shown in Table 1 and Table 2. The holes were numbered B1 to B6. The spacing between drilling holes B1 and B3 was 300 mm, and the spacing between drilling holes B4 and B6 was 400 mm. For concrete strength grades, slabs B1 and B4 were C20, slabs B2 and B5 were C30, and slabs B3 and B6 were C40. The parameters of the test were the discharge voltage and the number of copper wires. The discharge voltage was 40 kV, 60 kV, 80 kV, and 100 kV, and the number of copper wires was 30, 40, 50, and 60.
. The specific crushing method was to pre-drill the reinforced concrete slab 300 mm or 400 mm apart, and so the distance from the outermost row hole to the edge of the slab was 200 mm, the aperture was 40 mm, the hole depth was 110 mm, and this hole was filled with tap water. A copper wire was wound around the electrode and inserted into the borehole to generate pulsed power by releasing high voltage electricity. The mechanical properties of concrete and reinforcement are shown in Table 1 and Table 2. The holes were numbered B1 to B6. The spacing between drilling holes B1 and B3 was 300 mm, and the spacing between drilling holes B4 and B6 was 400 mm. For concrete strength grades, slabs B1 and B4 were C20, slabs B2 and B5 were C30, and slabs B3 and B6 were C40. The parameters of the test were the discharge voltage and the number of copper wires. The discharge voltage was 40 kV, 60 kV, 80 kV, and 100 kV, and the number of copper wires was 30, 40, 50, and 60.
 . The specific crushing method was to pre-drill the reinforced concrete slab 300 mm or 400 mm apart, and so the distance from the outermost row hole to the edge of the slab was 200 mm, the aperture was 40 mm, the hole depth was 110 mm, and this hole was filled with tap water. A copper wire was wound around the electrode and inserted into the borehole to generate pulsed power by releasing high voltage electricity. The mechanical properties of concrete and reinforcement are shown in Table 1 and Table 2. The holes were numbered B1 to B6. The spacing between drilling holes B1 and B3 was 300 mm, and the spacing between drilling holes B4 and B6 was 400 mm. For concrete strength grades, slabs B1 and B4 were C20, slabs B2 and B5 were C30, and slabs B3 and B6 were C40. The parameters of the test were the discharge voltage and the number of copper wires. The discharge voltage was 40 kV, 60 kV, 80 kV, and 100 kV, and the number of copper wires was 30, 40, 50, and 60.
3.2. Comparison between Experimental Results and Simulation Results
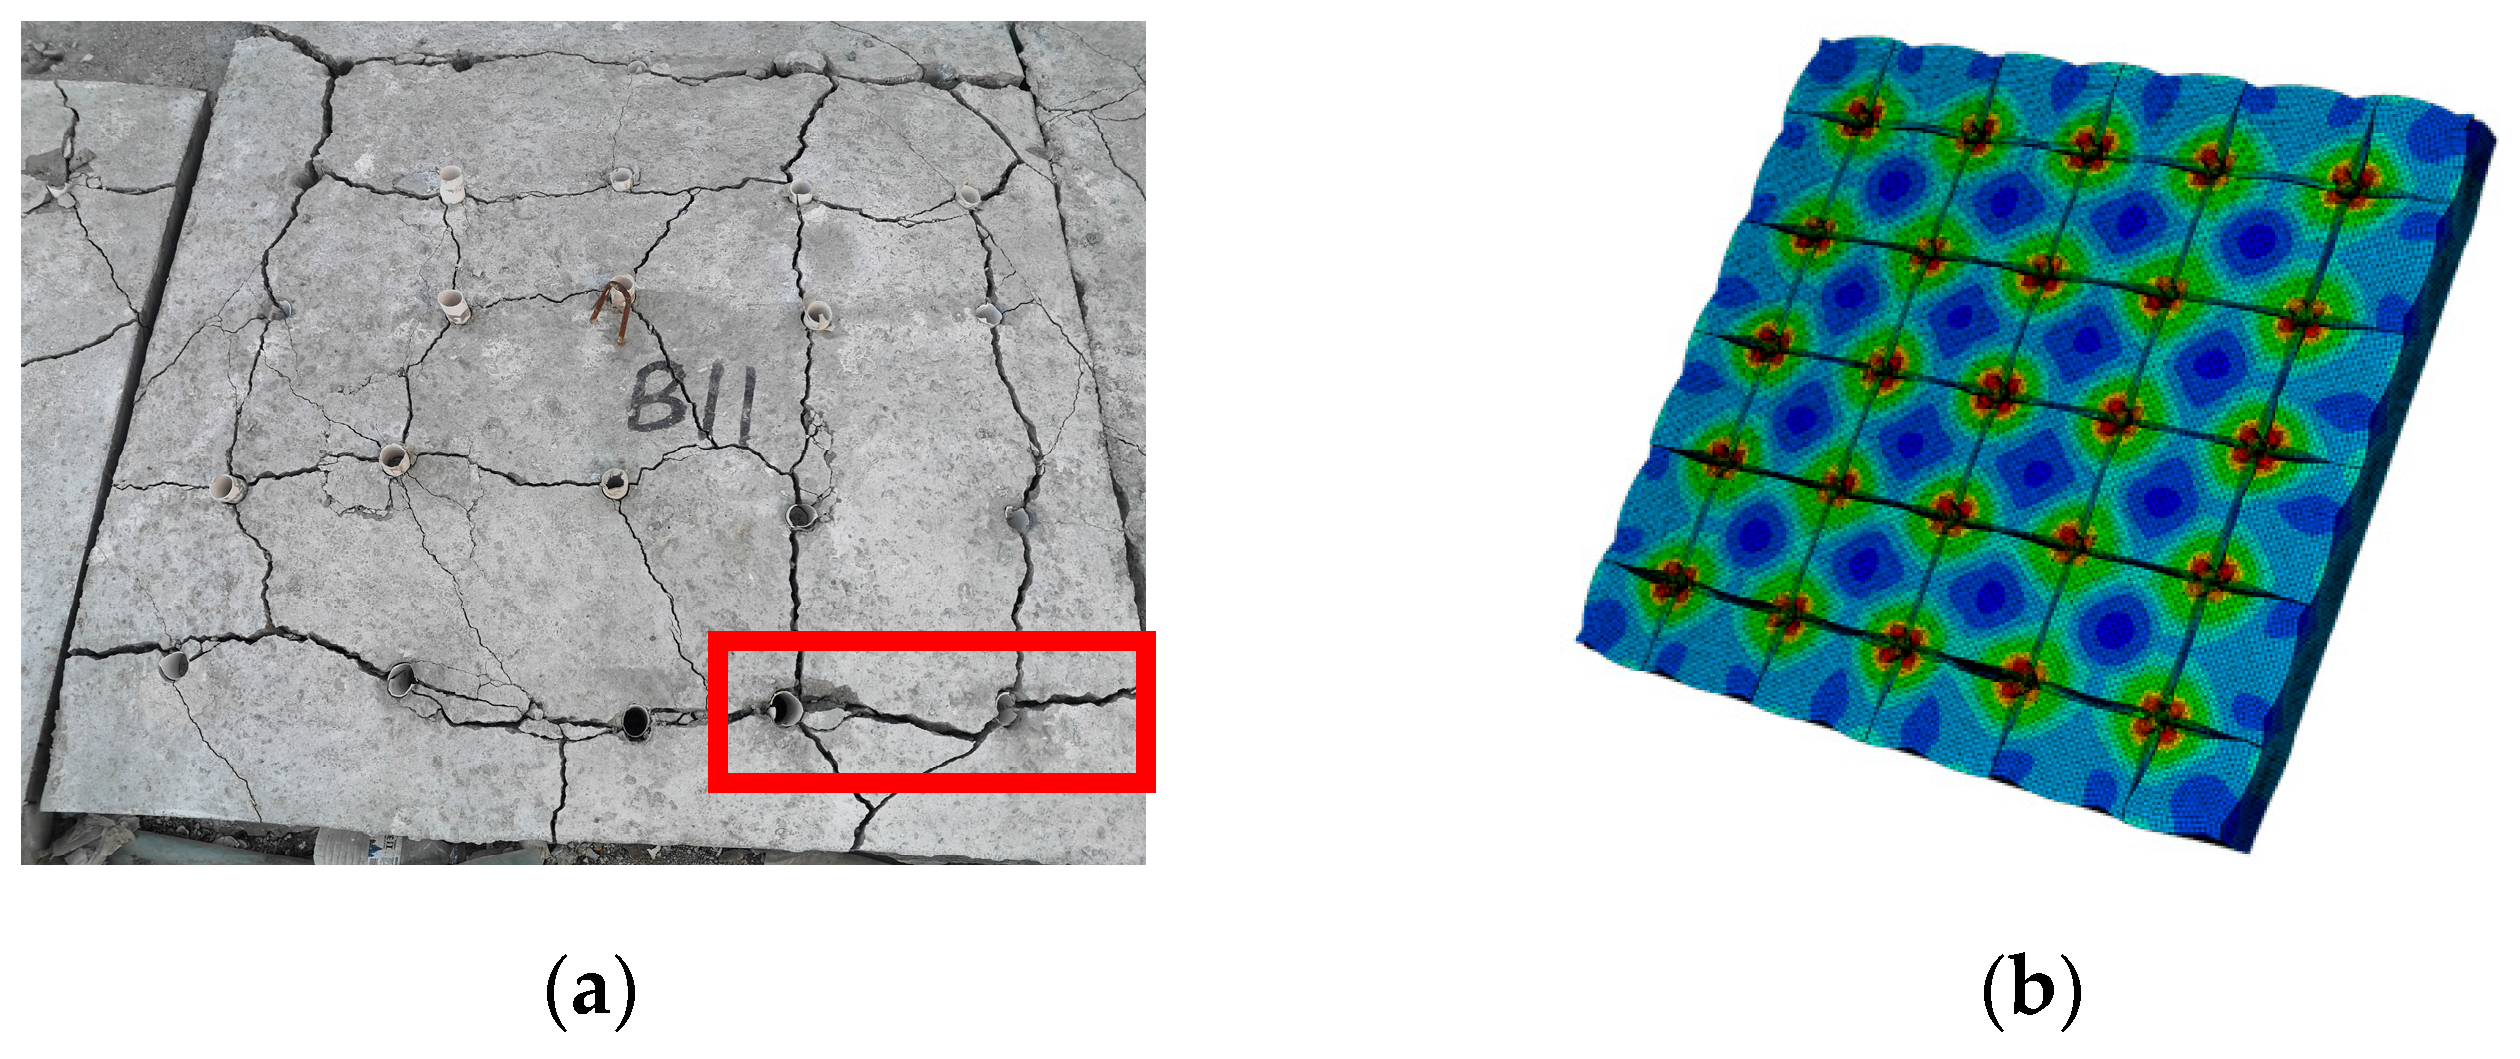
Taking slab B1 as an example, the comparison of the crushing effect between the test and simulation after the PPD of reinforced concrete slab is shown in Figure 7. Figure 8 shows the comparison between the test and simulation results of the cracks between the adjacent holes, and Figure 9 shows the comparison between the test and simulation results of the cracks between the holes and the edges of the slab. From Figure 7, Figure 8 and Figure 9, it can be seen that the fracture effect of simulation is basically the same as that of the test. The cracks between each adjacent borehole are all connected, and the cracks around the outermost borehole extend to the edge of the slab, while the whole reinforced concrete slab is divided into several small plates by cracks.
In order to verify the accuracy of the finite element analysis results, the test results of the crack width of a reinforced concrete slab under the same conditions were compared with the simulation results. The comparison of the crack width data under the strength of C20, C30, and C40 is shown in Figure 10, Figure 11, and Figure 12, respectively. The average value of the crack width ws data under the same number of copper wires n and the same voltage was taken. As can be seen from Figure 10, Figure 11 and Figure 12 simulation data and test data fit well, and the relative errors of the measured crack width and simulation analysis value are both within 10% under the same conditions.
4. Results
4.1. Analysis of the Whole Process of Reinforced Concrete Slab Loading
Taking slab B1 as an example, the stress distribution generated by pulsed power discharge at each stage is shown in Figure 13. At the initial 0–60 µs, the concrete slab produced an initial stress wave near the borehole due to the instantaneous impact of the explosive. The strength of these stress waves was relatively small, and the concrete temporarily maintained its integrity without cracks. At 80 µs, stress waves began to diffuse within the concrete slab, converging and overlapping with each other. With the accumulation of stress, the cracks gradually extended from the edge of the drilling hole to the adjacent drilling hole or slab edge, and the crack width around the drilling hole was the largest. This stage can be regarded as the initial development stage of cracks, and stress concentration and diffusion was the main reason for the formation of cracks. At 130 µs, stress was more unevenly distributed across the concrete slab. Cracks grew faster but did not penetrate the entire concrete slab, while the cracks between adjacent holes tended to be connected. At 150 µs, the cracks between the adjacent holes were connected and the cracks extended to the edge of the slab. At 170 µs, the width and depth of the cracks further increased, indicating that the concrete slab had been damaged. At 190 µs, the discharge ended and the slab had been divided into several small blocks.
4.2. Influence of Reinforcement Diameter on Cracks of Reinforced Concrete Slab
Due to the different constraints, the degree of crack development near the drill hole in different positions of the reinforced concrete slab is also different. According to the different positions of cracks, cracks are divided into three types: edge cracks (cracks between the outermost hole and the edge of the slab), cracks between edge holes, and cracks between internal holes. The width of the three kinds of cracks was taken from the average crack width between the adjacent holes and the cracks between the holes and the edge of the slab.
4.2.1. Influence of Reinforcement Diameter on Edge Crack Width w1
According to the simulation analysis results, the variation curve of edge crack width w1 with reinforcement diameter d under different reinforcement spacing is shown in Figure 14. As can be seen from Figure 14, when the concrete strength and the reinforcement spacing are the same, the edge crack width decreases with the increase in the reinforcement diameter. When the reinforcement diameter increases from 6 mm to 14 mm, the edge crack width of the C30 reinforced concrete slab decreases by 23.22%, 27.10%, 18.10%, 17.22%, and 18.28%, respectively, for the reinforcement spacing of 100 mm, 150 mm, 200 mm, 250 mm, and 300 mm. For C40 reinforced concrete slabs, the decrease was 24.99%, 25.77%, 14.58%, 21.44%, and 17.51%, respectively. For C50 reinforced concrete slabs, the decrease was 28.98%, 27.01%, 16.35%, 22.11%, and 17.35%, respectively.
4.2.2. Influence of Reinforcement Diameter on Crack Width w2 between Edge Holes
According to the simulation analysis results, the variation curve of crack width w2 between edge holes with reinforcement diameter d under different reinforcement spacing is shown in Figure 15. As can be seen from Figure 15, when the concrete strength and the reinforcement spacing are the same, the crack width between edge holes decreases with the increase in the reinforcement diameter. When the reinforcement diameter increases from 6 mm to 14 mm, the crack width between the edge holes of the C30 reinforced concrete slab decreases by 20.16%, 19.26%, 13.13%, 14.79%, and 14.63%, respectively, for the reinforcement spacing of 100 mm, 150 mm, 200 mm, 250 mm, and 300 mm. For C40 reinforced concrete slabs, the decrease is 24.99%, 16.55%, 17.10%, 13.51%, and 14.18%, respectively. For C50 reinforced concrete slabs, the decrease is 17.63%, 10.36%, 17.86%, 20.92%, and 14.58%, respectively.
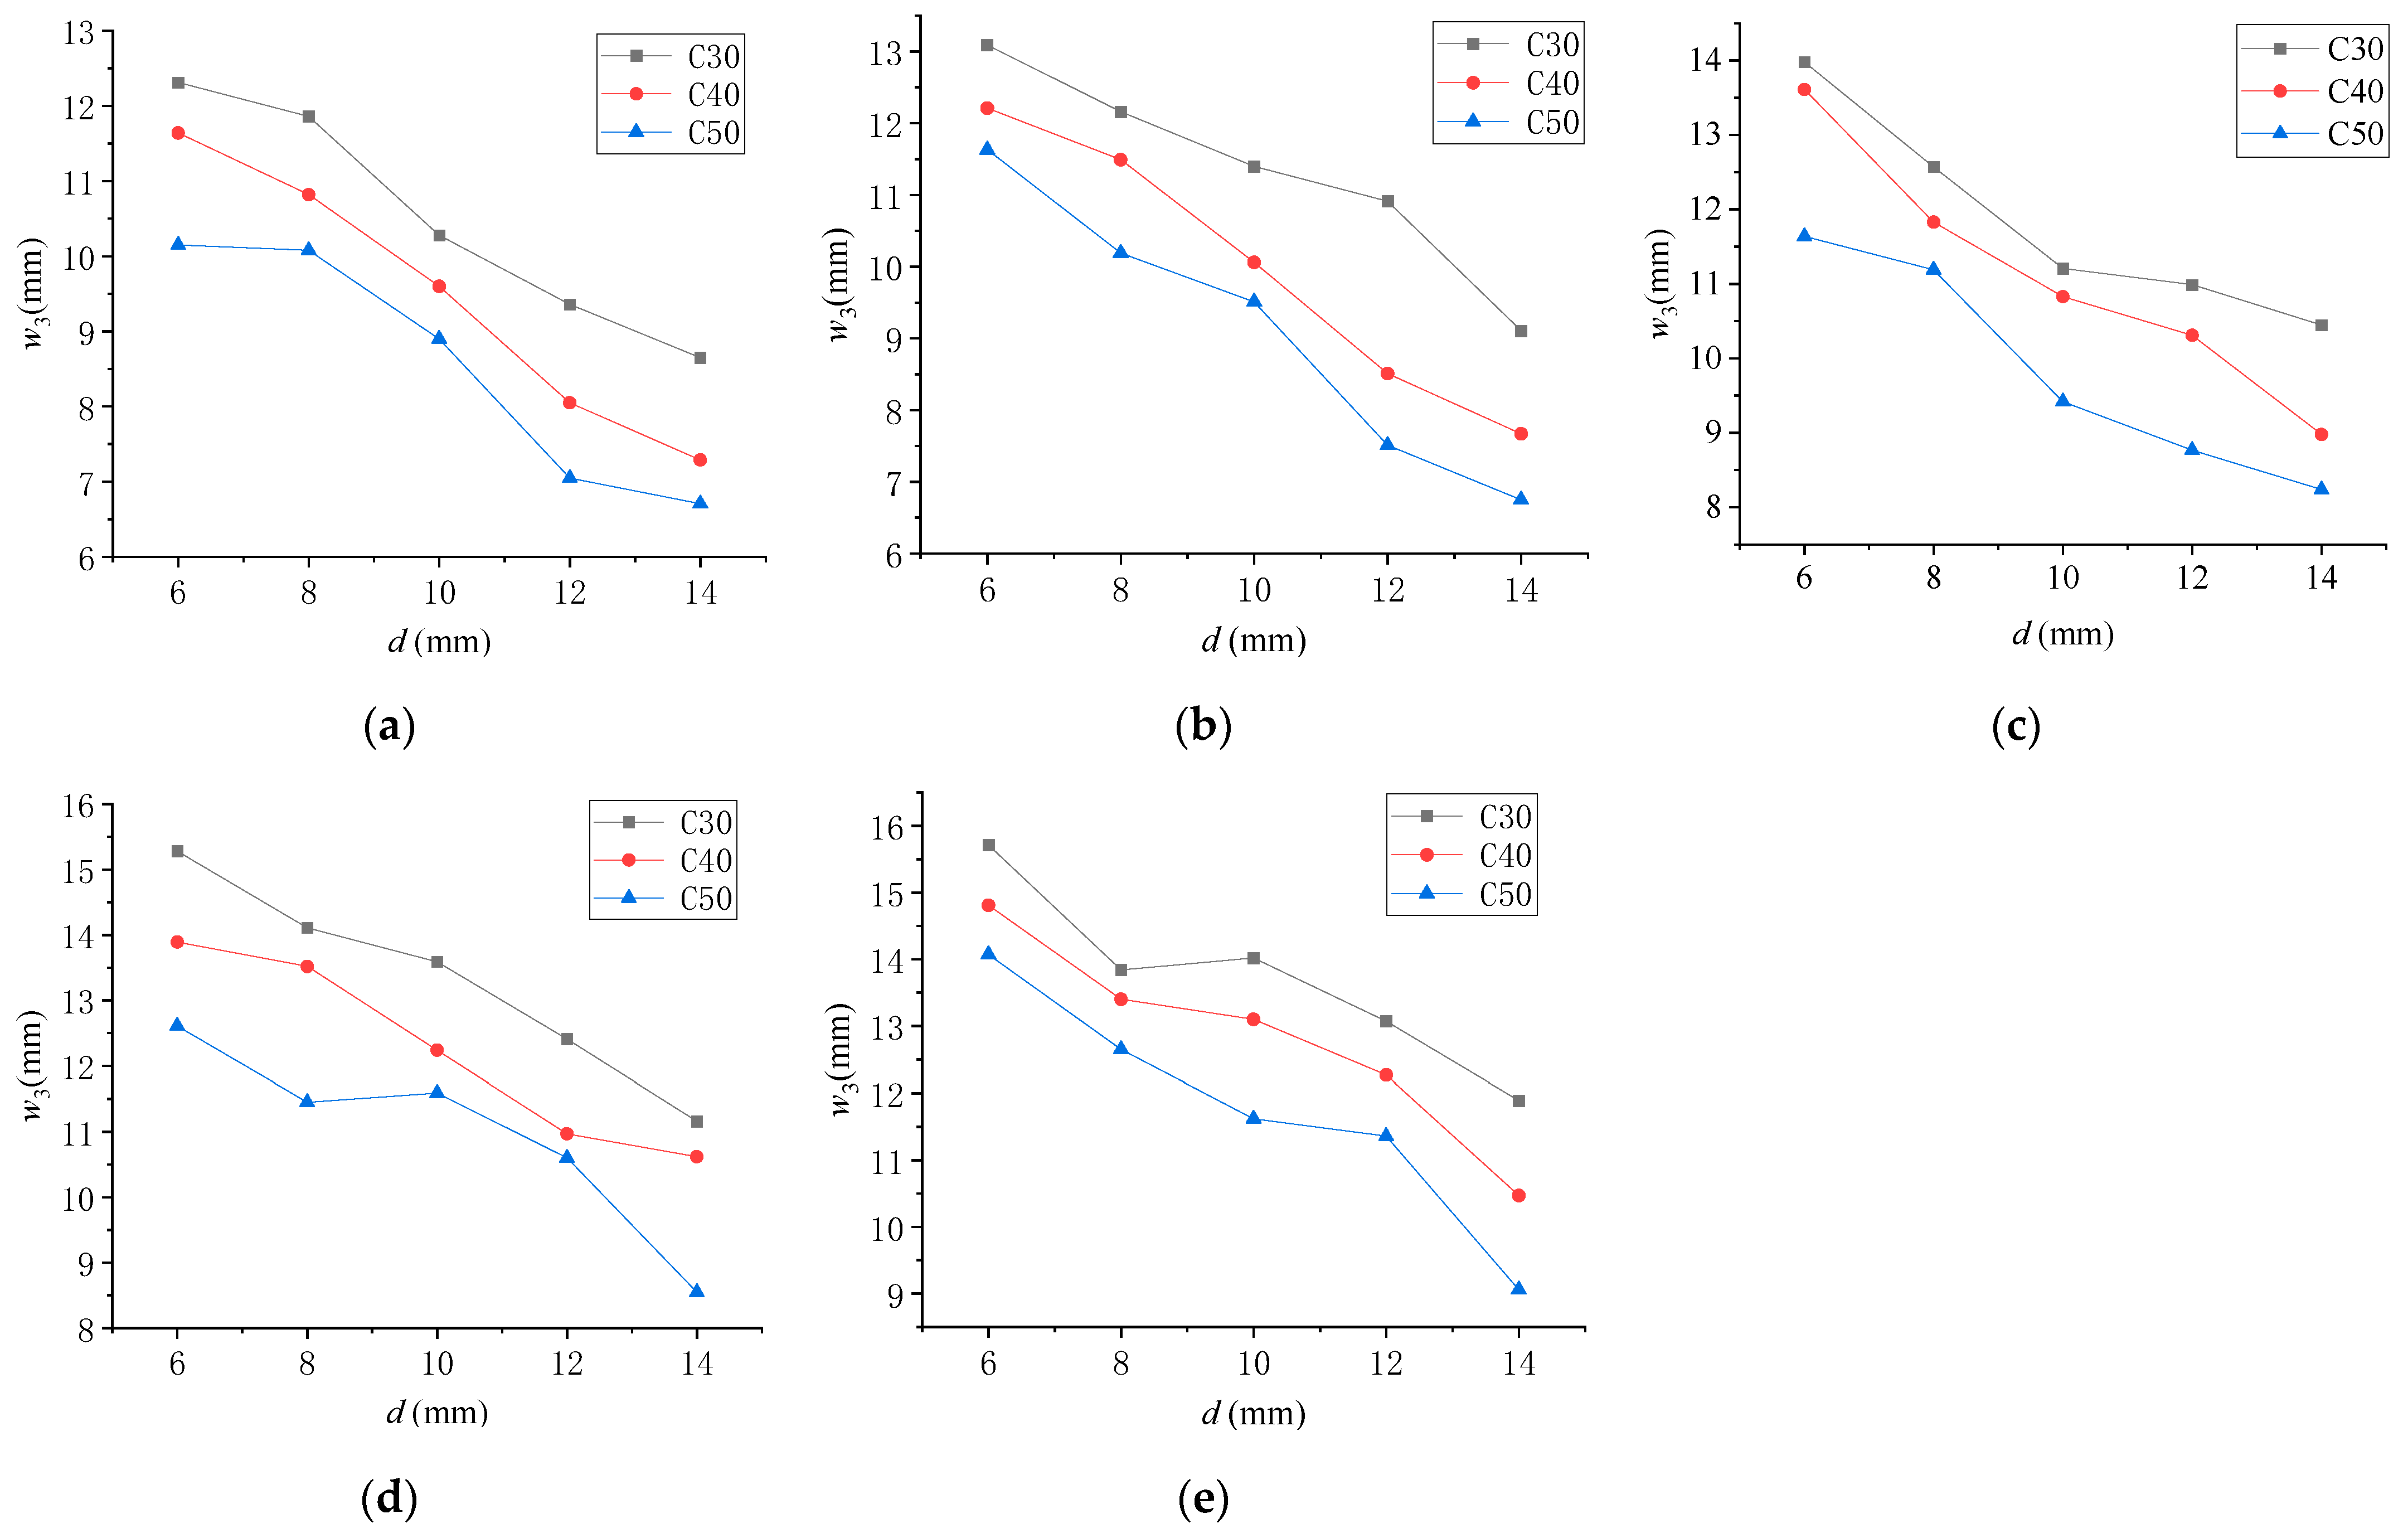
4.2.3. Influence of Reinforcement Diameter on Crack Width w3 between Internal Holes
According to the simulation analysis results, the variation curve of crack width w3 between internal holes with reinforcement diameter d under different reinforcement spacing is shown in Figure 16. As can be seen from Figure 16, when the concrete strength and the reinforcement spacing are the same, the crack width between internal holes decreases with the increase in the reinforcement diameter. When the diameter of reinforcement increases from 6 mm to 14 mm, the crack widths between internal holes of C30 reinforced concrete slab with reinforcement spacings of 100 mm, 150 mm, 200 mm, 250 mm, and 300 mm decreases by 29.73%, 30.40%, 25.25%, 26.96%, and 24.32%, respectively. For C40 reinforced concrete slabs, the decreases are 37.37%, 37.18%, 34.02%, 23.54%, and 29.30%, respectively. For C50 reinforced concrete slabs, the decrease is 33.89%, 41.96%, 29.21%, 32.20%, and 35.61%, respectively.
4.3. Influence of Reinforcement Spacing on Cracks of Reinforced Concrete Slab
4.3.1. Influence of Reinforcement Spacing on Edge Crack Width w1
According to the simulation analysis results, the variation curve of edge crack width w1 with reinforcement spacing s under different reinforcement diameters is shown in Figure 17. As can be seen from Figure 17, when the strength of concrete is the same as the diameter of reinforcements, the widths of edge cracks increase with the increase in the spacing of reinforcements. When the reinforcement spacing increases from 100 mm to 300 mm, the edge crack widths of 6 mm, 8 mm, 10 mm, 12 mm, and 14 mm of C30 reinforced concrete slab increase by 23.22%, 27.10%, 18.10%, 17.22%, and 18.28%, respectively. For C40 reinforced concrete slabs, the increase is 24.99%, 25.77%, 14.58%, 21.44%, and 17.51%, respectively. For C50 reinforced concrete slabs, the increase is 28.98%, 27.01%, 16.35%, 22.11%, and 17.35%, respectively.
4.3.2. Influence of Reinforcement Spacing on Crack Width w2 between Edge Holes
According to the simulation analysis results, the variation curve of the crack width w2 between edge holes with the reinforcement spacing s under different reinforcement diameters is shown in Figure 18. As can be seen in Figure 18, when the strength of concrete is the same as the diameter of reinforcements, the crack width between edge holes increases with the increase in the spacing of reinforcements. When the reinforcement spacing increases from 100 mm to 300 mm, the crack widths between the edge holes of the C30 reinforced concrete slab with the reinforcement diameters of 6 mm, 8 mm, 10 mm, 12 mm, and 14 mm increase by 13.32%, 12.11%, 11.53%, 16.01%, and 13.24%, respectively. For C40 reinforced concrete slabs, the increases are 9.90%, 14.09%, 12.92%, 16.17%, and 13.27%, respectively. For C50 reinforced concrete slabs, the increase is 13.67%, 19.28%, 15.63%, 16.75%, and 16.33%, respectively.
4.3.3. Influence of Reinforcement Spacing on Crack Width w3 between Internal Holes
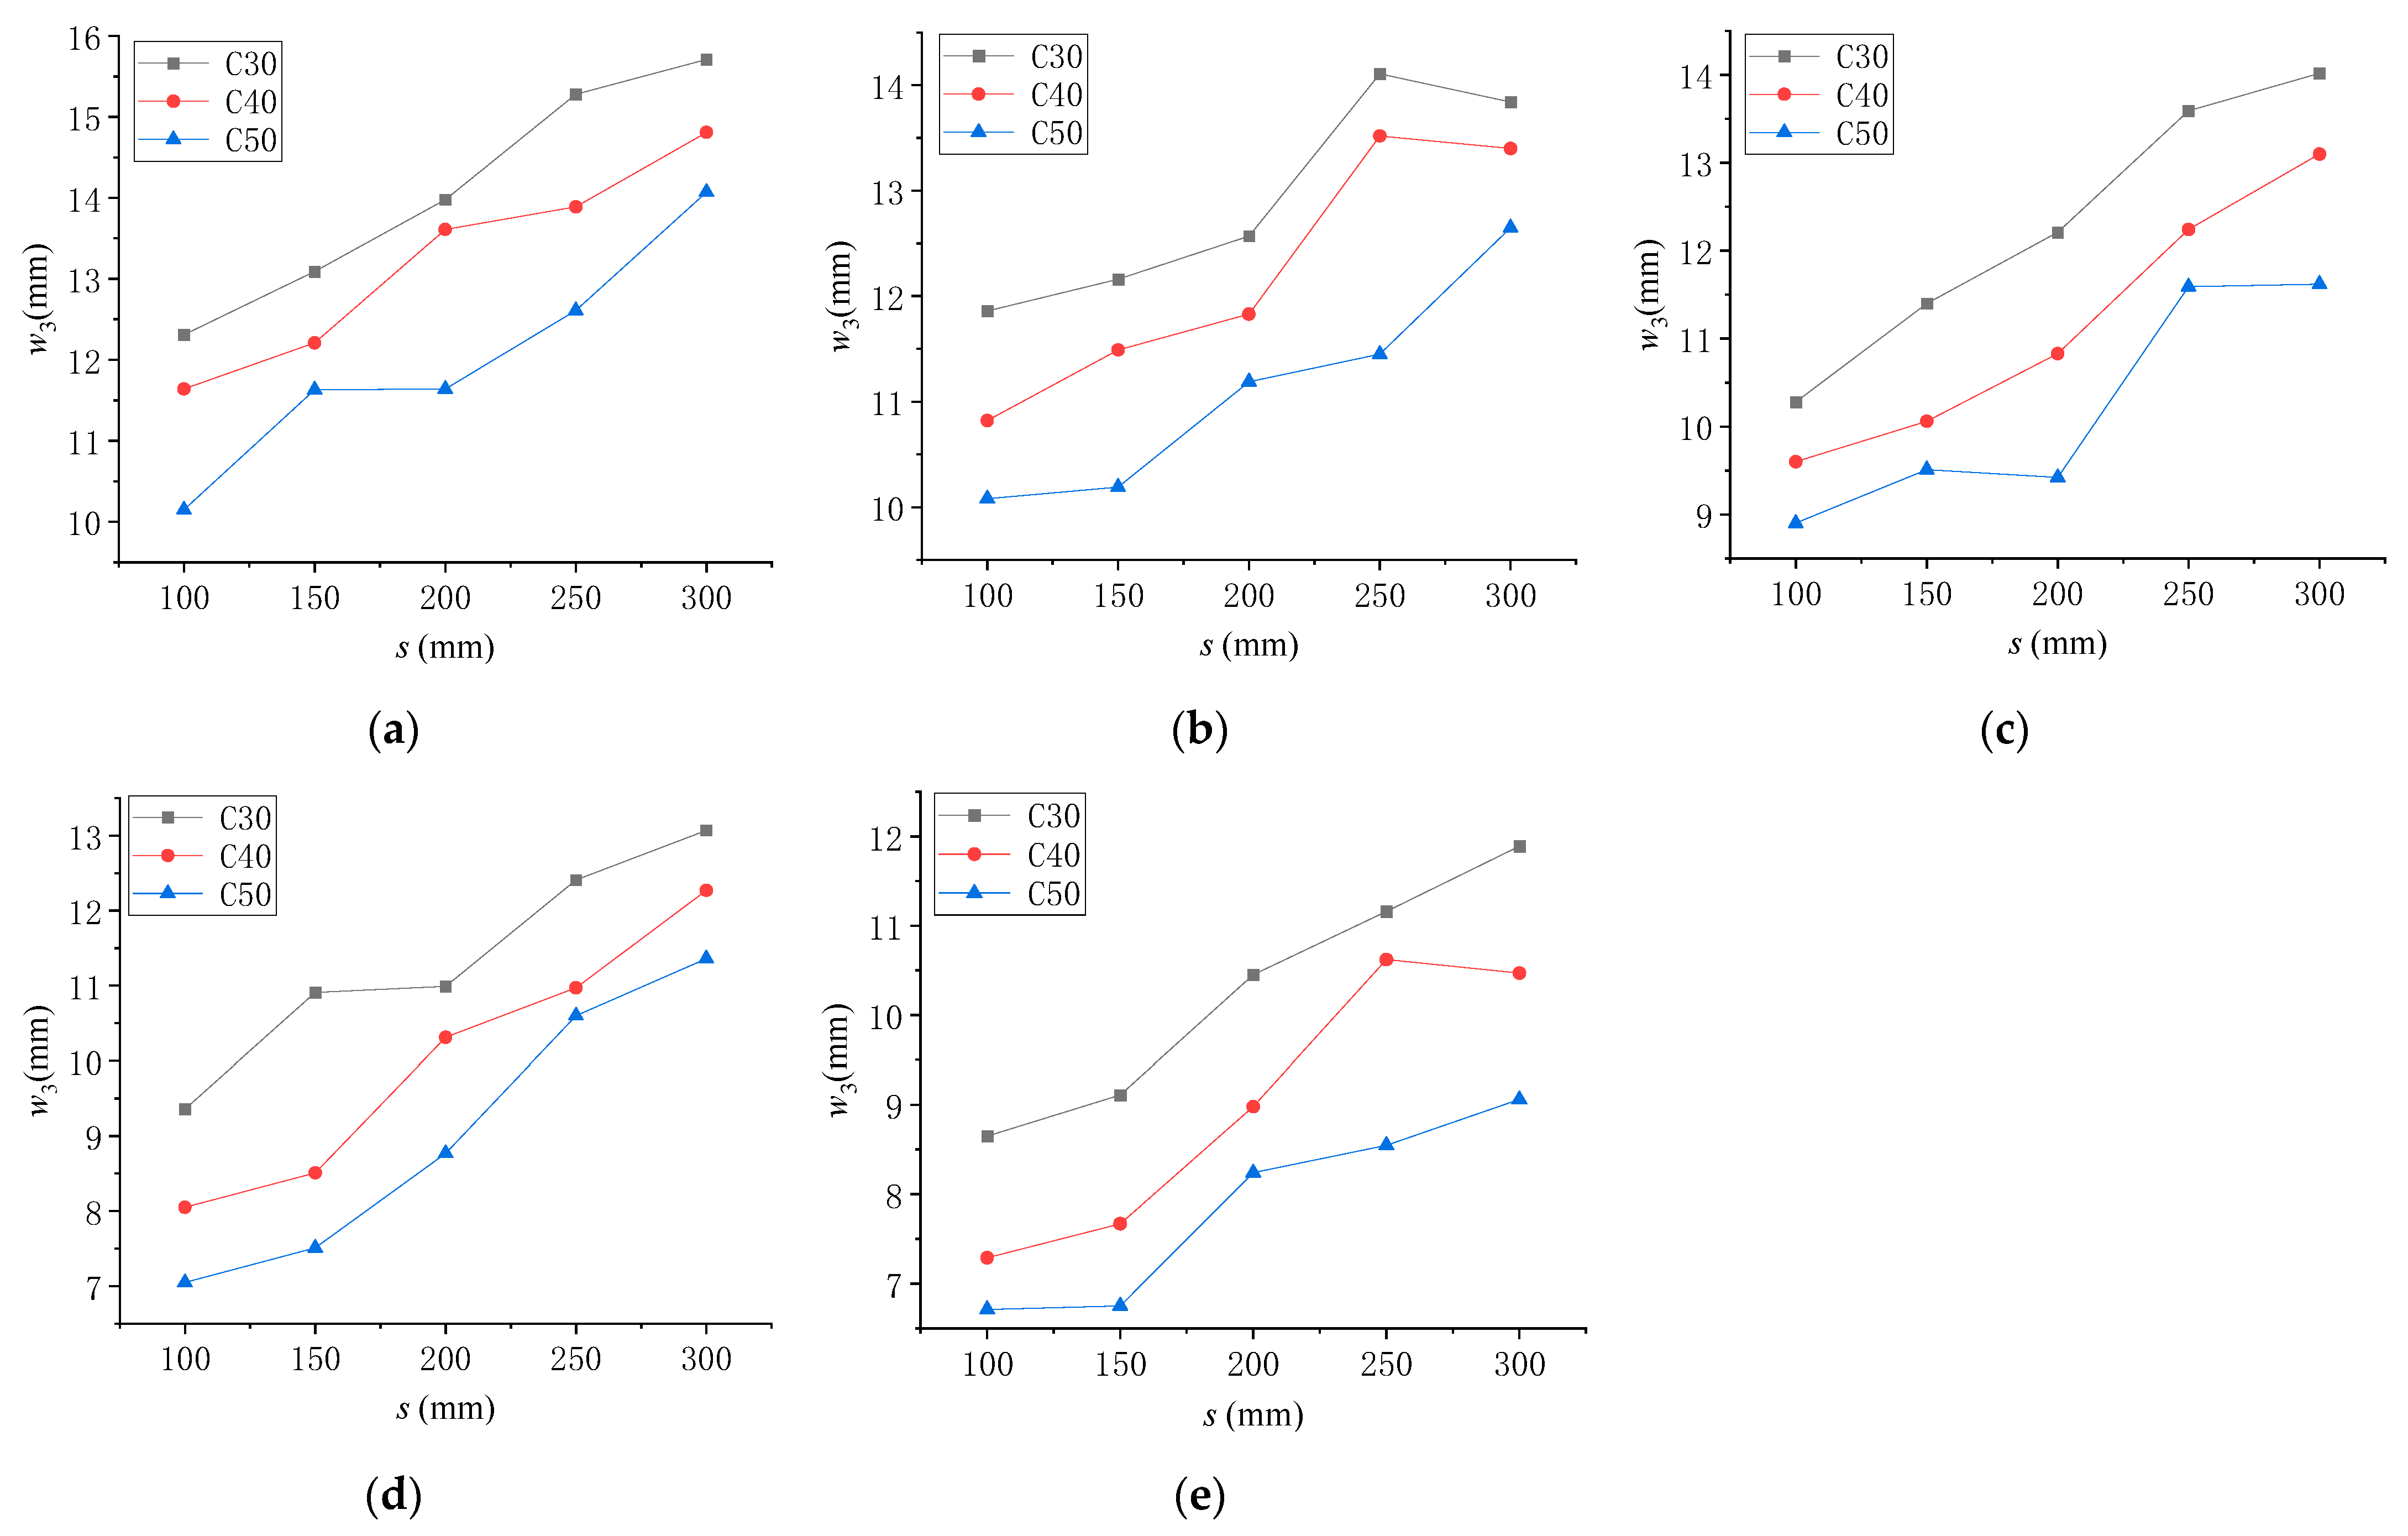
According to the simulation analysis results, the variation curve of crack width w3 between internal holes with reinforcement spacing s under different reinforcement diameters is shown in Figure 19. As can be seen from Figure 19, when the strength of concrete is the same as the diameter of reinforcements, the crack width between internal holes increases with the increase in the spacing of reinforcements. When the reinforcement spacing increases from 100 mm to 300 mm, the crack widths between the internal holes of the C30 reinforced concrete slab with the reinforcement diameters of 6 mm, 8 mm, 10 mm, 12 mm, and 14 mm increases by 21.64%, 14.31%, 26.68%, 27.25%, and 22.47%, respectively. For C40 reinforced concrete slabs, the increases are 21.40%, 19.5%, 26.72%, 30.37%, and 24.44%, respectively. For C50 reinforced concrete slabs, the increase is 27.86%, 20.32%, 23.41%, 25.94%, and 24.38%, respectively.
4.4. Influence of Reinforcement Spacing on Cracks of Reinforced Concrete Slab
From Figure 14, Figure 15, Figure 16, Figure 17, Figure 18 and Figure 19, it can be seen that the increase in concrete strength will also limit the development of cracks. The higher the strength of concrete, the higher the ultimate tensile stress and ultimate tensile strain, and the bond between reinforcements and concrete will also be enhanced. This means that the higher the strength of concrete, the stronger the ability of the reinforced concrete slab to resist the formation and development of cracks under the impact of PPD. When the concrete strength classification increases from C30 to C50, the crack width decreases by 10~25%.
5. Discussion
From Figure 15, Figure 16 and Figure 17, it can be seen that, under the impact load of PPD, the larger the diameters of reinforcements, the smaller the crack widths of concrete slabs. The reason is that the increase in the diameter of a reinforcement causes an increase in the contact area between the reinforcement and the concrete, meaning that the restraint effect of the reinforcement on the deformation of the concrete is enhanced, limiting the development of cracks. In addition, in the same slab, the width of cracks between edge holes w2 > the edge crack width w1 > the crack width between internal holes w3. The reason for this is that the cracks at different positions are subject to different constraints; additionally, the impact of the PPD-shock stress wave is different. The specific reason is that the four sides of the concrete slab are free, and the lateral development of the cracks between the edge holes is limited to the least, so its width is relatively maximum. The cracks between the internal holes are the most constrained from the farthest distance from the free slab edge, while the development of the cracks is squeezed by the shock wave generated by the explosion impact in the surrounding holes, meaning the crack width is the smallest.
From Figure 17, Figure 18 and Figure 19, it can be seen that, under the same diameter, the crack width of the concrete slab increases with the increase in the spacing of reinforcement. This is because the smaller the spacing of the reinforcements, the stronger the constraint of the single reinforcement on the surrounding concrete. As a result, the crack width of the reinforced concrete slab is reduced under the impact of PPD. In addition, the smaller the spacing of reinforcements, the more reinforcements in the same size of the concrete slab, which further inhibits the expansion of cracks.
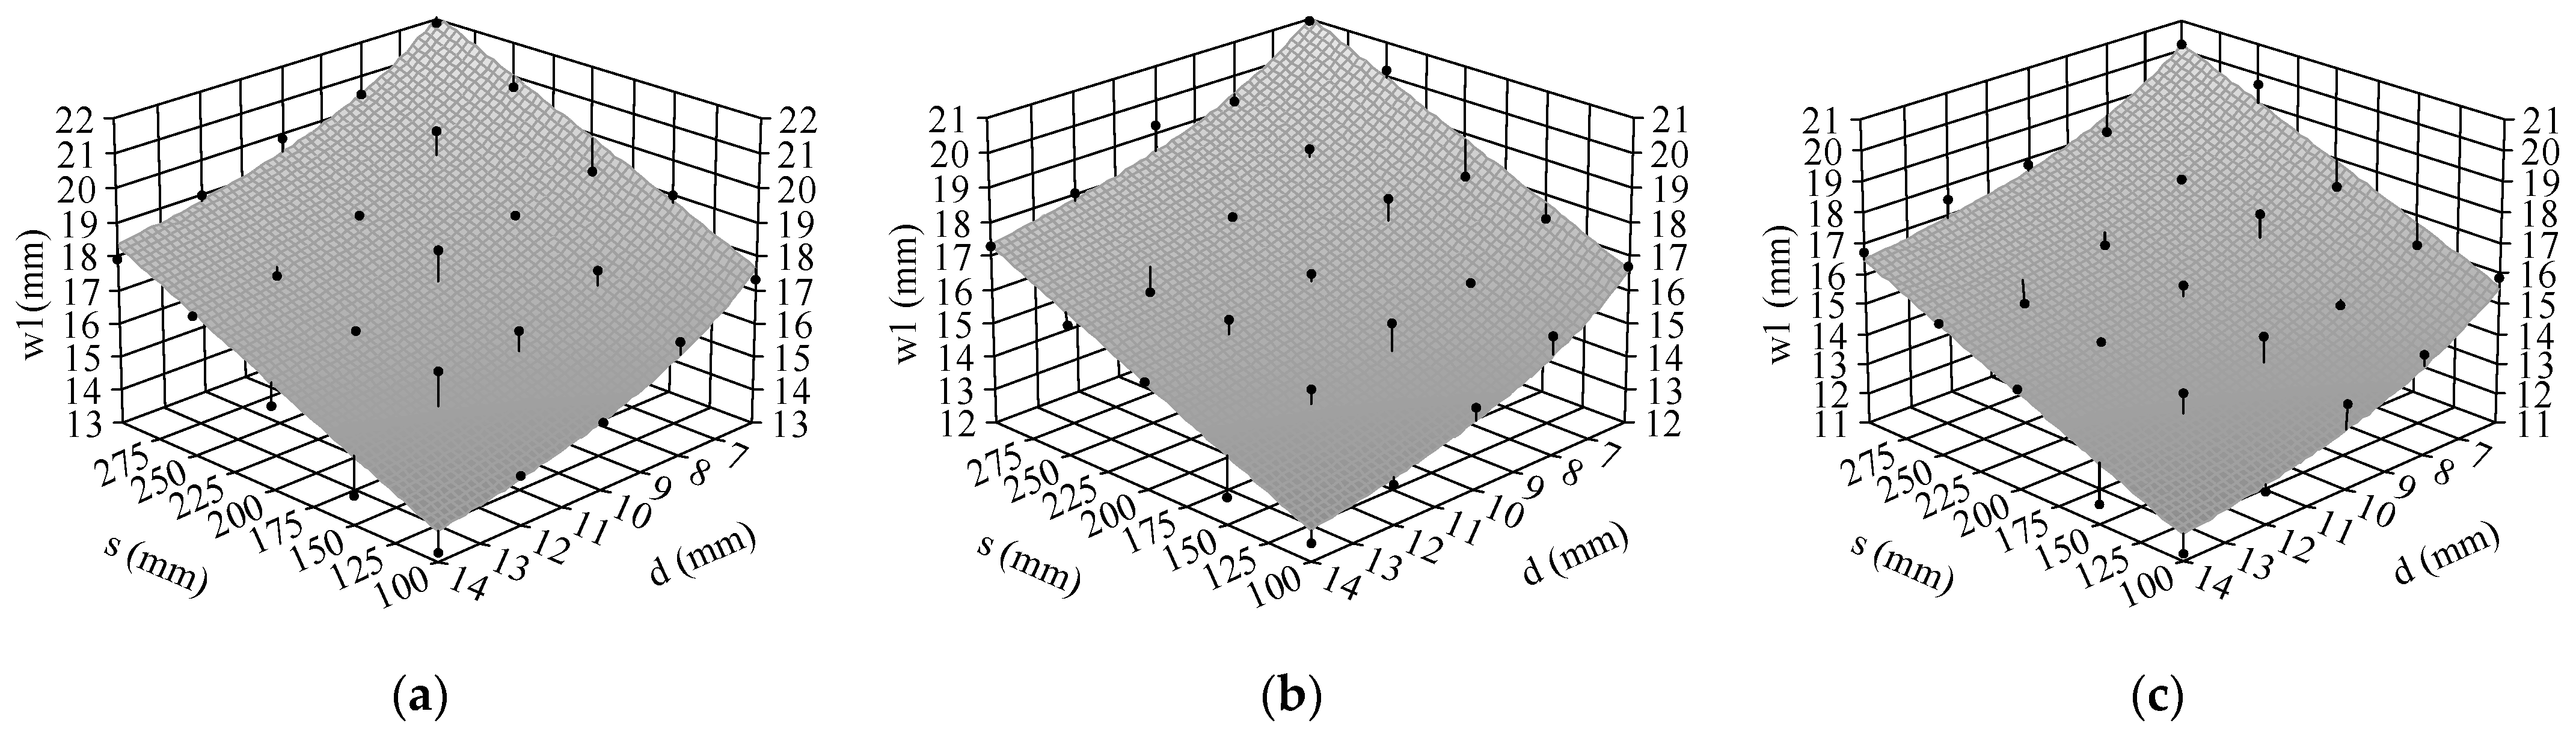
In order to facilitate an engineering application, based on the above simulation analysis results, the relationship between crack width at different positions of concrete slabs and reinforcement spacing s and reinforcement diameter d was analyzed. Taking edge cracks as an example, the 3D fitting surface is shown in Figure 20.
According to the three-dimensional fitting surfaces, the mathematical expressions with the removal effect of reinforced concrete slabs as the objective function under each concrete strength and key parameters, such as reinforcement spacing s and reinforcement diameter d, as independent variables were established. The unified formula can be seen in Equation (9). The coefficients calculated for crack widths at different locations can be calculated according to Table 3.
w = αs + β/d + γ
The finite element simulation results in this paper are the same as the test results of Wang [11], i.e., the discharge voltage of 100 kV and the pulse power shock wave generated by a certain number of copper wires can cause cracks of different widths in reinforced concrete slabs. However, it should be noted that the reinforcement is still anchored in the concrete slab and plays a bridging role in the crack section. If the reinforced concrete slab is to be divided into several pieces for easy transportation and cleaning, mechanical tools are needed for processing. The reinforcement can also be cut off at a certain distance before PPD is then performed. Another method is to replace the water in the holes with self-reactive liquid, which further improves the crushing effect on the concrete slab. On the other hand, this paper takes 100 kV voltage as the basic parameter for simulation analysis, and increasing the discharge voltage can further improve the crushing effect, which will cause the cost of discharge equipment to increase significantly. However, the effective conversion rate of discharge energy can be improved by adjusting the parameters of discharge equipment, while the crushing effect of the concrete slab can be improved without increasing the discharge voltage. Therefore, the research and development of PPD equipment for the crushing of reinforced concrete structures will be one of the most important priorities for the further promotion and application of this technology.
6. Conclusions
In this paper, the impact load generated by PPD was equivalent to the explosion impact load, and the crack development of a reinforced concrete slab was simulated by the cohesive force model. The finite element model of reinforced concrete slab was established with the parameters of the reinforcement diameter, spacing and concrete strength. The influence of key parameters such as reinforcement diameter, spacing, and concrete strength on crack width at different positions in the slab was studied. The following conclusions were obtained.
- (1)
- The CONWEP method was used to simulate the impact load produced by PPD and the cohesive force model was used to simulate the development of cracks. By comparing the results of the PPD crushing test and simulation analysis, the relative errors of the test value and simulation analysis value of crack width were less than 10%. It shows that the finite element model has good accuracy in regard to analyzing the crack width of reinforced concrete slabs crushed by PPD.
- (2)
- According to the different degrees of concrete constraint on cracks, it can be divided into three categories according to its position in the slab: edge cracks, cracks between edge holes and cracks between central holes. The order of crack width in the same slab under the same conditions is cracks between edge holes > edge cracks > cracks between internal holes.
- (3)
- The amount of reinforcement in the slab has a great influence on the crushing effect of PPD. When the reinforcement spacing was reduced from 300 mm to 100 mm, the width of edge cracks, cracks between edge holes, and cracks between internal holes were reduced by 21.33%, 16.15%, and 31.40%, respectively. When the reinforcement diameter increased from 6 mm to 14 mm, the three crack widths decreased by 23.45%, 14.28%, and 23.76%. The increase in concrete strength also reduced the crack widths. When the concrete strength grade increased from C30 to C50, the crack widths decreased by 10~25%.
- (4)
- Taking the diameter and spacing of reinforcements and strength of concrete as independent variables, a unified formula for calculating the crack width of fractured reinforced concrete slabs with PPD was established, and the calculation coefficients for the width of edge cracks, cracks between edge holes, and cracks between internal holes were given, respectively. The goodness of fit R2 of statistical formula is above 0.88.
- (5)
- In this paper, a simulation analysis of the square bidirectional slab with a single bottom reinforcement was conducted. The PPD crushing effect of the reinforced concrete slab with an upper and lower double reinforcement mesh and each aspect ratio will be the focus of the next research.
Author Contributions
Conceptualization, writing—review and editing, X.L. software, writing—original draft preparation, F.Y.; data curation, investigation, Y.L.; supervision, visualization, Y.Y. All authors have read and agreed to the published version of the manuscript.
Funding
This research received no external funding.
Data Availability Statement
Data available in a publicly accessible repository that does not issue DOIs. Publicly available datasets were analyzed in this study. This data can be found here: https://pan.baidu.com/s/1iM7GLPMnRIrD5LcAHX1Zqg?pwd=4vhe.
Conflicts of Interest
Author Fei Yang is employed by the Fuzhou Academy of Building Research Co., Ltd. Author Youwei Liu is employed by the Xiamen Municipal Construction Group Co., Ltd. Author Yang Yang is employed by the Huadong Engineering (Fujian) Corporation Limited. The remaining authors declare that the research was conducted in the absence of any commercial or financial relationships that could be construed as a potential conflict of interest.
References
- de Andrade Salgado, F.; de Andrade Silva, F. Recycled aggregates from construction and demolition waste towards an application on structural concrete: A review. J. Build. Eng. 2022, 52, 104452. [Google Scholar] [CrossRef]
- Allam, A.S.; Nik-Bakht, M. From demolition to deconstruction of the built environment: A synthesis of the literature. J. Build. Eng. 2023, 64, 105679. [Google Scholar] [CrossRef]
- He, Z.; Han, X.; Zhang, M.; Yuan, Q.; Shi, J.; Zhan, P. A novel development of green UHPC containing waste concrete powder derived from construction and demolition waste. Powder Technol. 2022, 398, 117075. [Google Scholar] [CrossRef]
- Abina, A.; Puc, U.; Zidanšek, A. Challenges and opportunities of terahertz technology in construction and demolition waste management. J. Environ. Manag. 2022, 315, 115118. [Google Scholar] [CrossRef] [PubMed]
- Kumar, A.; Singh, G.J.; Raj, P.; Kumar, R. Performance of Quality-Controlled Recycled Concrete Aggregates. ACI Mater. J. 2024, 121, 17. [Google Scholar] [CrossRef]
- Li, Y.; Li, M.; Sang, P. A bibliometric review of st.udies on construction and demolition waste management by using CiteSpace. Energy Build. 2022, 258, 111822. [Google Scholar] [CrossRef]
- Li, X.; Shi, H.; Hu, J.; Wu, J.; Li, X.; Qiu, A. A numerical model for the electrical and shock wave characteristics of underwater pulsed spark discharge. J. Appl. Phys. 2024, 135, 033302. [Google Scholar] [CrossRef]
- Liu, W.; Zhang, Y.; Zhu, X.; Feng, W. Numerical simulation study of rock breaking mechanism by high voltage electric pulse. Int. J. Min. Sci. Technol. 2023, 8, 642–653. [Google Scholar] [CrossRef]
- Ouyang, S.; Li, C.; Du, L.; Li, X.; Lai, Z.; Peng, T.; Han, X.; Cao, Q.; Li, L. Electromagnetic forming of aluminum alloy sheet metal utilizing a low-frequency discharge: A new method for attractive forming. J. Mater. Process. Technol. 2021, 291, 117001. [Google Scholar] [CrossRef]
- Huang, W.; Chen, Y. The application of high voltage pulses in the mineral processing industry—A review. Powder Technol. 2021, 393, 116–130. [Google Scholar] [CrossRef]
- Wang, J.; Xue, Q.; Du, X.; Cao, Y.; Yu, J.; Zhou, P.; Jiang, H. Study on the unplugging technology through electric explosion controllable shock wave. J. Energy Resour.-ASME 2021, 143, 053005. [Google Scholar] [CrossRef]
- Kuznetsov, Y.I.; Vazhov, V.F.; Zhurkov, M.Y. Electrical breakdown of solid dielectrics and rocks on the trailing edge of a voltage pulse. Russ. Phys. J. 2011, 54, 410–415. [Google Scholar] [CrossRef]
- Vogler, D.; Walsh, S.D.C.; Saar, M.O. A numerical investigation into key factors controlling hard rock excavation via electropulse stimulation. J. Rock Mech. Geotech. 2020, 12, 793–801. [Google Scholar] [CrossRef]
- Liu, W.; Zhang, Y.; Luo, Y.; Zhu, X. Generation mechanism of plasma channels for high-voltage electric pulses in rock. Acta Petrol. Sin. 2023, 44, 684–697. [Google Scholar] [CrossRef]
- Cho, S.H.; Cheong, S.S.; Yokota, M.; Katsuhiko, K. The dynamic fracture process in rocks under high-voltage pulse fragmentation. Rock Mech. Rock Eng. 2016, 49, 3841–3853. [Google Scholar] [CrossRef]
- Liu, W.; Zhang, Y.; Zhu, X. The partial electrical breakdown mechanism by high voltage electric pulses in multi-fractured granite. Geomech. Energy Environ. 2023, 34, 100459. [Google Scholar] [CrossRef]
- Lu, X.; Pan, Y. Theoretical Study on characteristics of discharge plasma in Water. Chin. J. Basic Eng. Sci. 2000, 8, 7. [Google Scholar] [CrossRef]
- Wong, T.; Timoshkin, I.; MacGregor, S.; Wilson, M.; Given, M. Dielectric Interfaces in High-Voltage Technology: Overview and Theoretical Approaches to the Modeling of Functional and Breakdown Behavior. IEEE Electr. Insul. Mag. 2023, 39, 34–49. [Google Scholar] [CrossRef]
- Lu, H.; Liu, Y.; Nie, B.; Nie, B.; Chen, X.; Xu, X. Crack Propagation Characteristics of Coal Samples Utilizing High-Voltage Electrical Pulses. ACS Omega 2021, 6, 34395–34405. [Google Scholar] [CrossRef]
- Li, C.; Duan, L.; Tan, S.; Chikhotkin, V.; Fu, W. Damage model and numerical experiment of high-voltage electro pulse boring in granite. Energies 2019, 12, 727. [Google Scholar] [CrossRef]
- Liu, K.; Zhang, H.; Cai, Z.; Yu, Q.; Wang, X.; Chen, Y.; Fu, H. Rock breaking characteristics of cyclic electrohydraulic shockwaves. J. Petrol. Sci. Eng. 2022, 210, 110024. [Google Scholar] [CrossRef]
- Xiong, L.; Liu, Y.; Yuan, W.; Huang, S.; Liu, H.; Li, H.; Lin, F.; Pan, Y. Experimental and numerical study on the cracking characteristics of repetitive electrohydraulic discharge shock waves. J. Phys. D Appl. Phys. 2020, 53, 495502. [Google Scholar] [CrossRef]
- Yu, Q.; Zhang, H.; Yang, R.; Cai, Z.; Liu, K. Experimental and numerical study on the effect of electrohydraulic shock wave on concrete fracturing. J. Petrol. Sci. Eng. 2022, 215, 110685. [Google Scholar] [CrossRef]
- Liu, Z.; Xu, C.; Fu, Y.; Wang, P.; Zou, X.; Wang, X. Molecular dynamics study of liquid–vapor transition in underwater electrical wire explosion. Phys. Plasmas 2022, 29, 123503. [Google Scholar] [CrossRef]
- Yuan, W.; Han, R.; Li, P.; Cao, Y.; Li, C.; Zhang, Y. Evolution of underwater shock wave in far-field regime of electrical wire explosion system over wide range of electric pulse energy. Exp. Therm. Fluid Sci. 2023, 149, 111022. [Google Scholar] [CrossRef]
- Zhao, P.; Guo, J.; Yan, G.; Zhu, G.; Zhu, X.; Zhang, Z.; Zhang, B. A novel and efficient method for resources recycling in waste photovoltaic panels: High voltage pulse crushing. J. Clean. Prod. 2020, 257, 120442. [Google Scholar] [CrossRef]
- Song, B.P.; Zhang, M.Y.; Fan, Y.; Jiang, L.; Kang, J.; Gou, T.; Zhang, C.; Yang, N.; Zhang, G.; Zhou, X. Recycling experimental investigation on end of life photovoltaic panels by application of high voltage fragmentation. Waste Manag. 2020, 101, 180–187. [Google Scholar] [CrossRef] [PubMed]
- Yan, F.; Xu, J.; Peng, S.; Zou, Q.; Zhou, B.; Long, K.; Zhao, Z. Breakdown process and fragmentation characteristics of anthracite subjected to high-voltage electrical pulses treatment. Fuel 2020, 275, 117926. [Google Scholar] [CrossRef]
- Yan, F.; Xu, J.; Peng, S.; Zou, Q.; Li, Q.; Long, K.; Zhao, Z. Effect of capacitance on physicochemical evolution characteristics of bituminous coal treated by high-voltage electric pulses. Powder Technol. 2020, 367, 47–55. [Google Scholar] [CrossRef]
- Lay, D.; Shi, F.; Antonio, C. Evaluation of a novel electrode design for high voltage pulse ore pre-concentration. Miner. Eng. 2023, 201, 108239. [Google Scholar] [CrossRef]
- Qin, Y.; Han, Y.; Gao, P.; Li, Y.; Yuan, S. Pre-weakening behavior of magnetite quartzite based on high-voltage pulse discharge. Miner. Eng. 2021, 160, 106662. [Google Scholar] [CrossRef]
- Qin, Y.; Han, Y.; Gao, P.; Li, Y.; Yuan, S. Characterization of chalcopyrite ore under high voltage pulse discharge: Particle size distribution, fractal dimension, specific energy consumption, grinding kinetics. Miner. Eng. 2022, 184, 107631. [Google Scholar] [CrossRef]
- Yan, G.; Zhang, M.; Sun, Z.; Zhao, P.; Zhao, B. Research on high voltage pulse breakage technology. Part 1: The breakdown characteristics of water. Miner. Eng. 2024, 205, 108478. [Google Scholar] [CrossRef]
- Yin, T.; Liu, C.; Chen, Y.; Zhuang, D.; Wu, Y.; Dai, H.; Su, J. Experimental and numerical study on the facture behavior of Heated-Granite subjected to High-Voltage electric pulse. Eng. Fract. Mech. 2024, 299, 109935. [Google Scholar] [CrossRef]
- Yudin, A.S.; Kuznetsova, N.S.; Bakeev, R.A.; Zhgun, D.V.; Stefanov, Y.P. Destruction of reinforced concrete by electric impulse discharges: Experiment and simulation. AIP Conf. Proc. 2017, 1909, 020234. [Google Scholar] [CrossRef]
- Tanaka, S.; Nishi, M.; Yamaguchi, M.; Bataev, I.; Hokamoto, K. Simultaneous initiation of nitromethane in two holes by pulsed wire discharge for crack control of a concrete block. J. Dyn. Behav. Mater. 2020, 6, 53–63. [Google Scholar] [CrossRef]
- Uenishi, K.; Yamachi, H.; Yamagami, K.; Sakamoto, R. Dynamic fragmentation of concrete using electric discharge impulses. Constr. Build. Mater. 2014, 67, 170–179. [Google Scholar] [CrossRef]
- Wang, X.; Li, N.; Wang, W. Experimental study on crushing of concrete slabs by high-voltage pulse discharge. Constr. Build. Mater. 2023, 401, 132951. [Google Scholar] [CrossRef]
- Wang, X.; Du, J.; Li, Q. Experimental study on crushing of concrete columns by high voltage pulse discharge. Case Stud. Constr. Mater. 2022, 16, e01090. [Google Scholar] [CrossRef]
- Wang, X.; Liu, P.; Sun, Y.; Wang, W. Study on breaking concrete structures by pulse power technology. Buildings 2022, 12, 274. [Google Scholar] [CrossRef]
- Zhu, X.; Luo, Y.; Liu, W.; He, L.; Gao, R.; Jia, Y. On the mechanism of high-voltage pulsed fragmentation from electrical breakdown process. Rock Mech. Rock Eng. 2021, 54, 4593–4616. [Google Scholar] [CrossRef]
- Zhu, X.; Chen, M.; Liu, W.; Luo, Y.; Hu, H. The fragmentation mechanism of heterogeneous granite by high-voltage electrical pulses. Rock Mech. Rock Eng. 2022, 55, 4351–4372. [Google Scholar] [CrossRef]
- Li, Y.; Liu, J.; Feng, B.; Zhang, X.; Zhang, M.; Xiao, H.; He, M.; Shi, F. Numerical modeling and simulation of the electric breakdown of rocks immersed in water using high voltage pulses. Geomech. Geophys. Geo-Energy Geo-Resour. 2021, 7, 1. [Google Scholar] [CrossRef]
- Che, L.; Pan, L.; Gu, X. Numerical Simulation of the Effect of Initial Generator Capacitor Voltage on Granite Fragmentation by High Voltage Pulse Discharge. Sci. Rep. 2024. submitted. [Google Scholar]
- Tan, L.; Yang, X.; Qiao, M. Fragmentation energy calculation model of coal crushed by impact load. Int. J. Coal Prep. Util. 2024, 45, 1–15. [Google Scholar] [CrossRef]
- Kuznetsova, N.; Zhgun, D.; Golovanevskiy, V. Plasma blasting of rocks and rocks-like materials: An analytical model. Int. J. Rock Mech. Min. 2022, 150, 104986. [Google Scholar] [CrossRef]
- Ouyang, P.; Rao, P.; Wu, J.; Cui, J.; Nimbalkar, S.; Chen, Q. Hydromechanical modeling of high-voltage electropulse-assisted fluid injection for rock fracturing. Rock Mech. Rock Eng. 2023, 56, 3861–3886. [Google Scholar] [CrossRef]
- Shi, H.; Li, T.; Hu, Y.; Li, X.; Wu, J.; Chen, L.; Qiu, A. Two-dimensional simulation of microsecond-timescale underwater electrical explosion of a copper wire. J. Phys. D Appl. Phys. 2022, 55, 405501. [Google Scholar] [CrossRef]
- Zhang, R.; Hu, Q.; Liu, S.; Hu, X. Discharge characteristics of high voltage pulses inside rocks with increasing their applied number. AIP Adv. 2017, 7, 115014. [Google Scholar] [CrossRef]
- Guo, Z. Principles of Reinforced Concrete, 3rd ed.; Tsinghua University Press: Beijing, China, 2014; pp. 18–121. [Google Scholar]
- Zhang, J.; Jia, J.; Xu, S.; Zhu, B.; Liu, Q. Comparison of concrete constitutive Model in ultimate load analysis of RC plate shell based on Layered shell modeling. Q. J. Mech. 2022, 43, 1001–1010. [Google Scholar] [CrossRef]
- Yao, Z.; Cui, T.; Dang, F.; Wen, S.; Linghu, T.; Qi, Y. Plastic damage performance of recycled concrete based on ABAQUS. J. Yangtze River Sci. Res. Inst. 2022, 39, 131–136+143. [Google Scholar] [CrossRef]
- Liu, P.; Guan, P.; Wang, H. Research progress of effect of strain rate on dynamic strength of concrete. J. Dalian Univ. 2009, 30, 79–84. [Google Scholar] [CrossRef]
- Du, X.; Tian, R.; Peng, Y.; Tian, Y. Micromechanical numerical simulation of compressive strength of concrete under impact load. J. Beijing Univ. Technol. 2009, 35, 213–217. [Google Scholar]
- Zhang, Y.; Fu, F. Study on bonding and sliding properties of CFRP bars and concrete under Explosion load and Numerical Simulation. Concrete 2022, 11, 15–22. [Google Scholar]
- Zhang, D.; Yang, J.; Zeng, D.; Chen, T.; Gao, J.; Tang, Y. Damage grades of reinforced concrete bent structures against blast. Explos. Shock 2020, 40, 46–57. [Google Scholar] [CrossRef]
- Cui, Z.; Li, H.; Pang, Y.; Tian, Y. Applicability of Conwep algorithm and pressure time history curve loading method in explosion damage analysis. J. Mil. Transp. Inst. 2021, 23, 88–94. [Google Scholar] [CrossRef]
- Yang, Y.; Chang, C.; Guan, Y.; Li, B.; Chang, J. Research on damage of reinforced concrete slab based on Conwep method. J. Mil. Transp. Inst. 2015, 17, 74–78. [Google Scholar] [CrossRef]
- Touya, G.; Reess, T.; Pécastaing, L.; Gibert, A.; Domens, P. Development of subsonic electrical discharges in water and measurements of the associated pressure waves. J. Phys. D Appl. Phys. 2006, 39, 5236–5244. [Google Scholar] [CrossRef]
- Zhang, P.; HU, X.; Yao, W. Analytical singular element for crack analysis of cohesive force model. Chin. J. Solid Mech. 2017, 38, 157–164. [Google Scholar]
Figure 1.
Uniaxial stress–strain curve of concrete [50]. (a) Uniaxial compression. (b) Uniaxial tension.
Figure 1.
Uniaxial stress–strain curve of concrete [50]. (a) Uniaxial compression. (b) Uniaxial tension.

Figure 2.
Grid division of concrete model. (a) Global meshing; (b) Grid division around borehole.
Figure 3.
Reinforced plastic model [50].
Figure 3.
Reinforced plastic model [50].
Figure 4.
Schematic diagram of CONWEP loading.
Figure 5.
Location diagram of cohesive force unit.

Figure 6.
Cohesive force unit.

Figure 7.
The overall crushing effect of the slab. (a) Test result. (b) Simulation result.

Figure 8.
Comparison of experimental and simulated results of cracks between borehole and slab edge. (a) Test result. (b) Simulation result.
Figure 8.
Comparison of experimental and simulated results of cracks between borehole and slab edge. (a) Test result. (b) Simulation result.

Figure 9.
Comparison of experimental and simulated results of cracks between adjacent boreholes. (a) Test result. (b) Simulation result.
Figure 9.
Comparison of experimental and simulated results of cracks between adjacent boreholes. (a) Test result. (b) Simulation result.
Figure 10.
Comparison of test and simulation analysis results of a C20 concrete slab. (a) 40 kV; (b) 60 kV; (c) 80 kV; (d) 100 kV.
Figure 10.
Comparison of test and simulation analysis results of a C20 concrete slab. (a) 40 kV; (b) 60 kV; (c) 80 kV; (d) 100 kV.
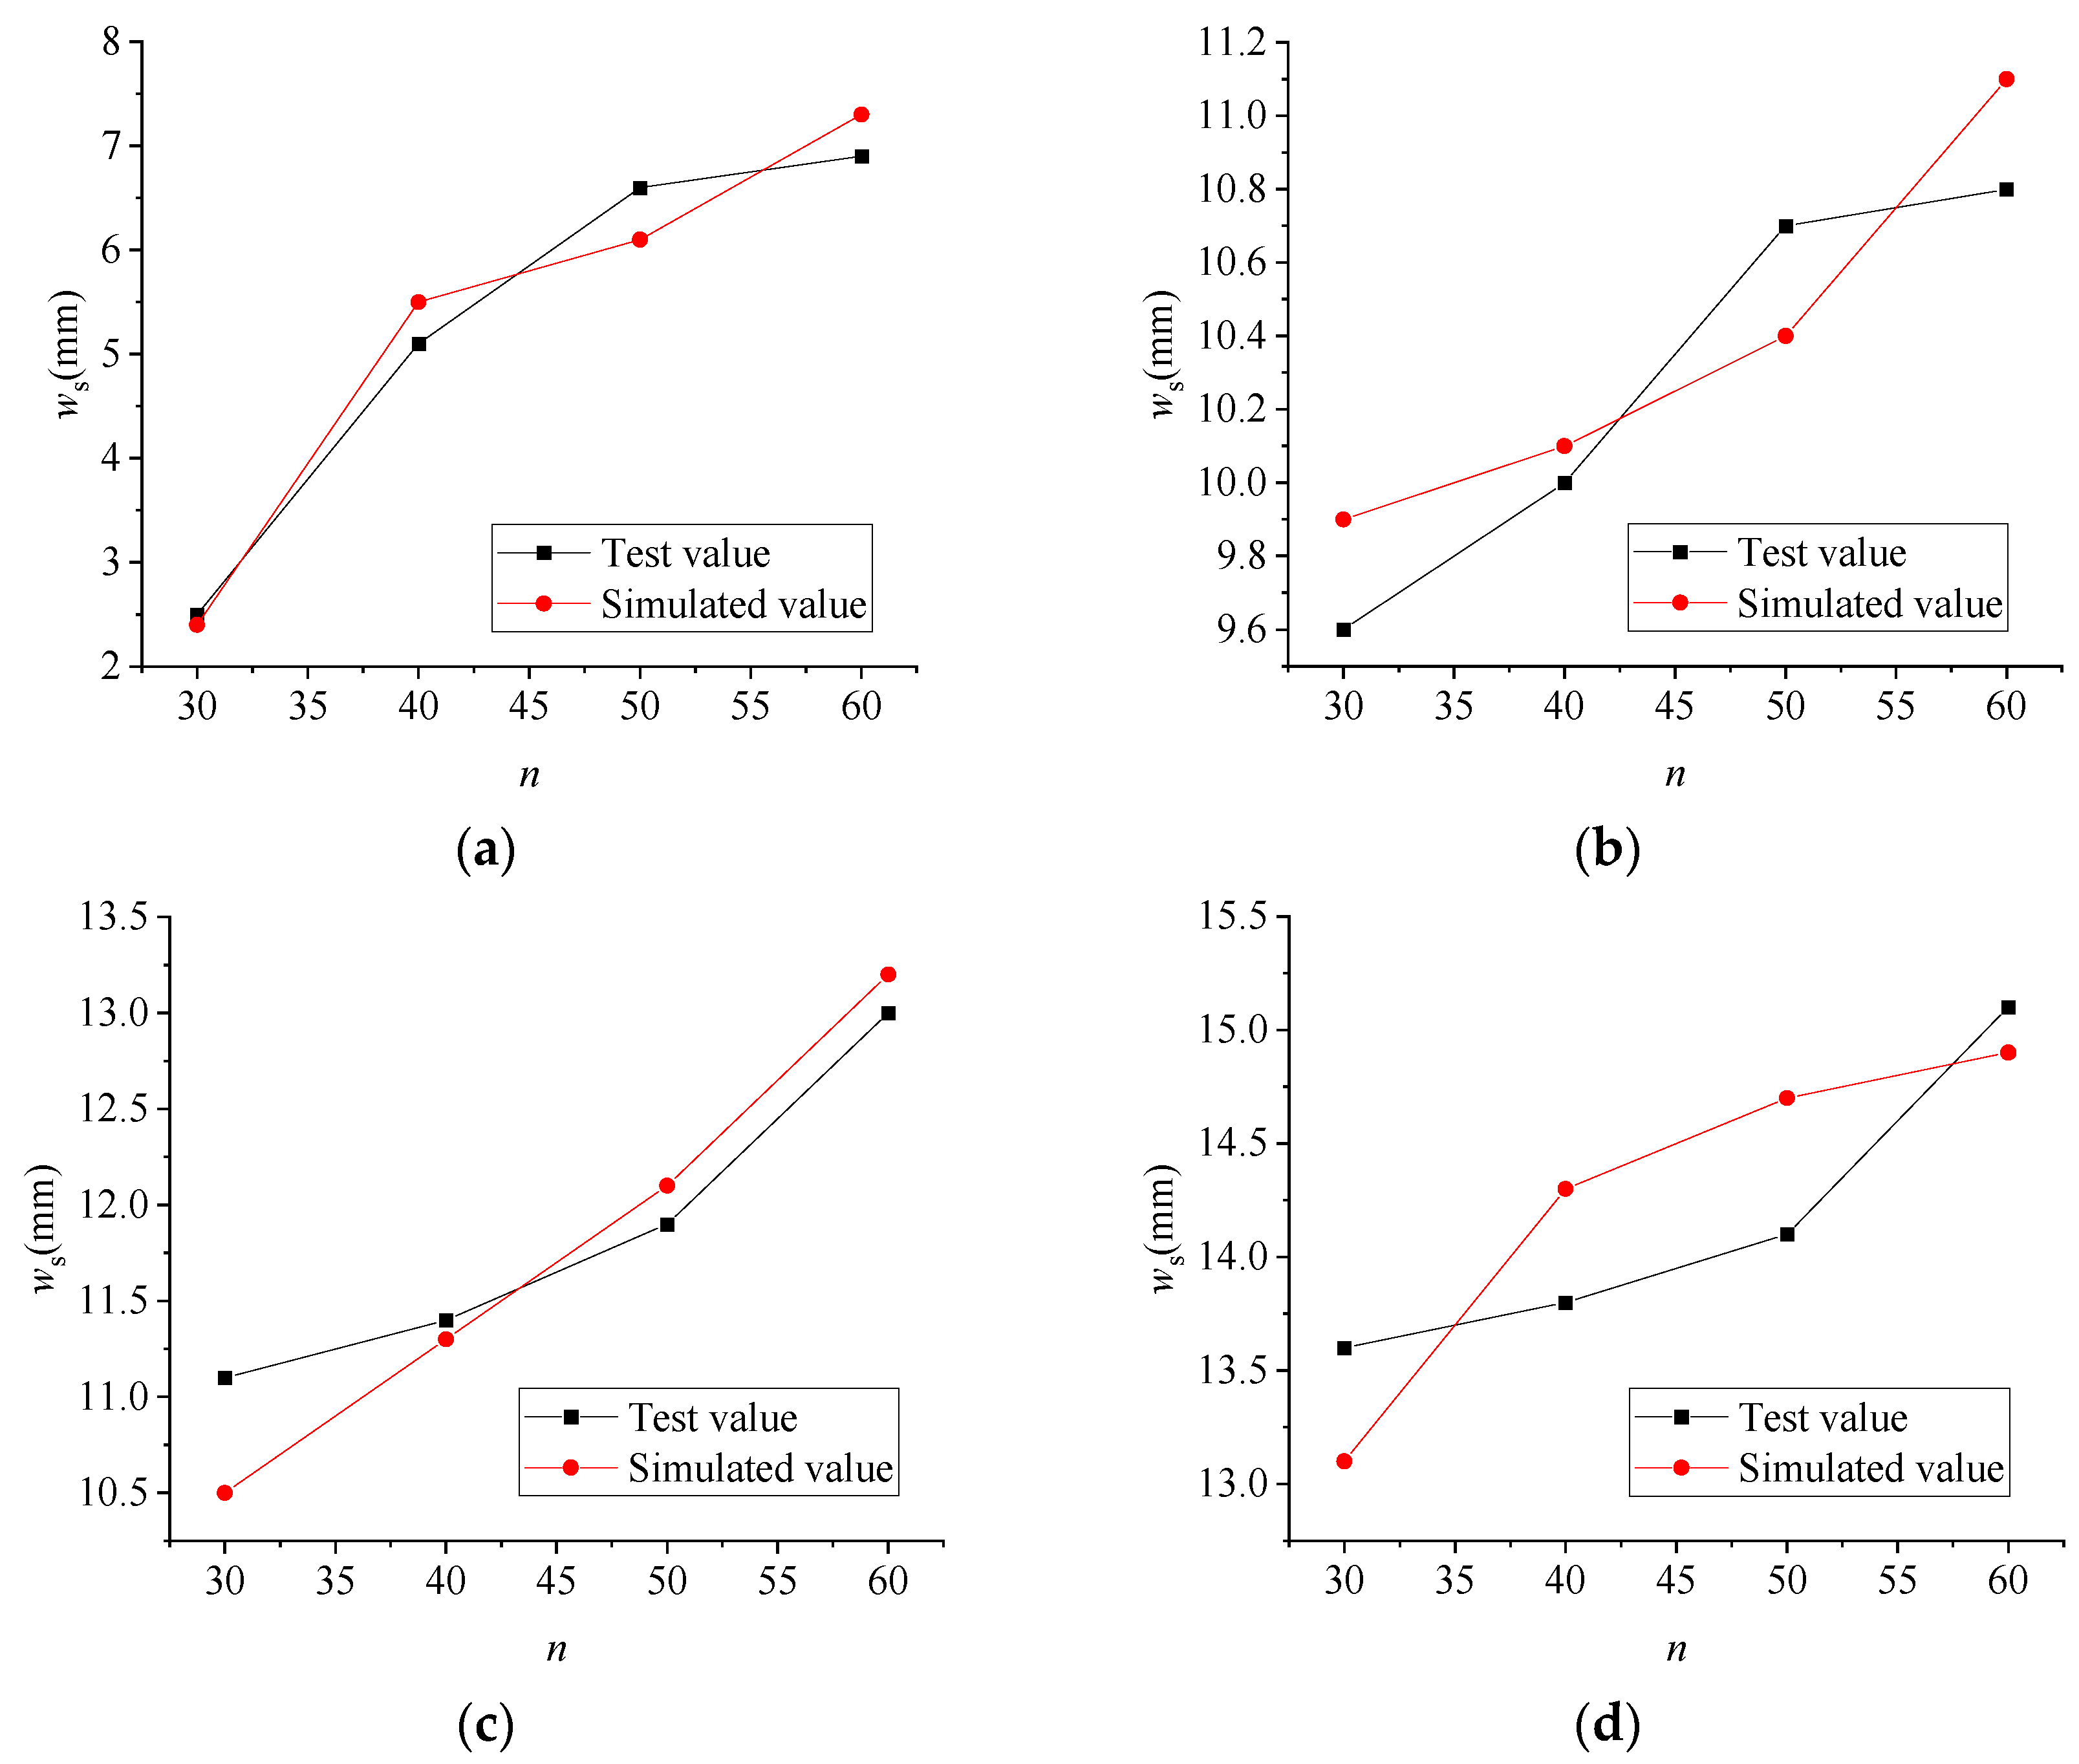
Figure 11.
Comparison of test and simulation analysis results of C30 concrete slab. (a) 40 kV; (b) 60 kV; (c) 80 kV; (d) 100 kV.
Figure 11.
Comparison of test and simulation analysis results of C30 concrete slab. (a) 40 kV; (b) 60 kV; (c) 80 kV; (d) 100 kV.

Figure 12.
Comparison of test and simulation analysis results of a C40 concrete slab. (a) 40 kV; (b) 60 kV; (c) 80 kV; (d) 100 kV.
Figure 12.
Comparison of test and simulation analysis results of a C40 concrete slab. (a) 40 kV; (b) 60 kV; (c) 80 kV; (d) 100 kV.
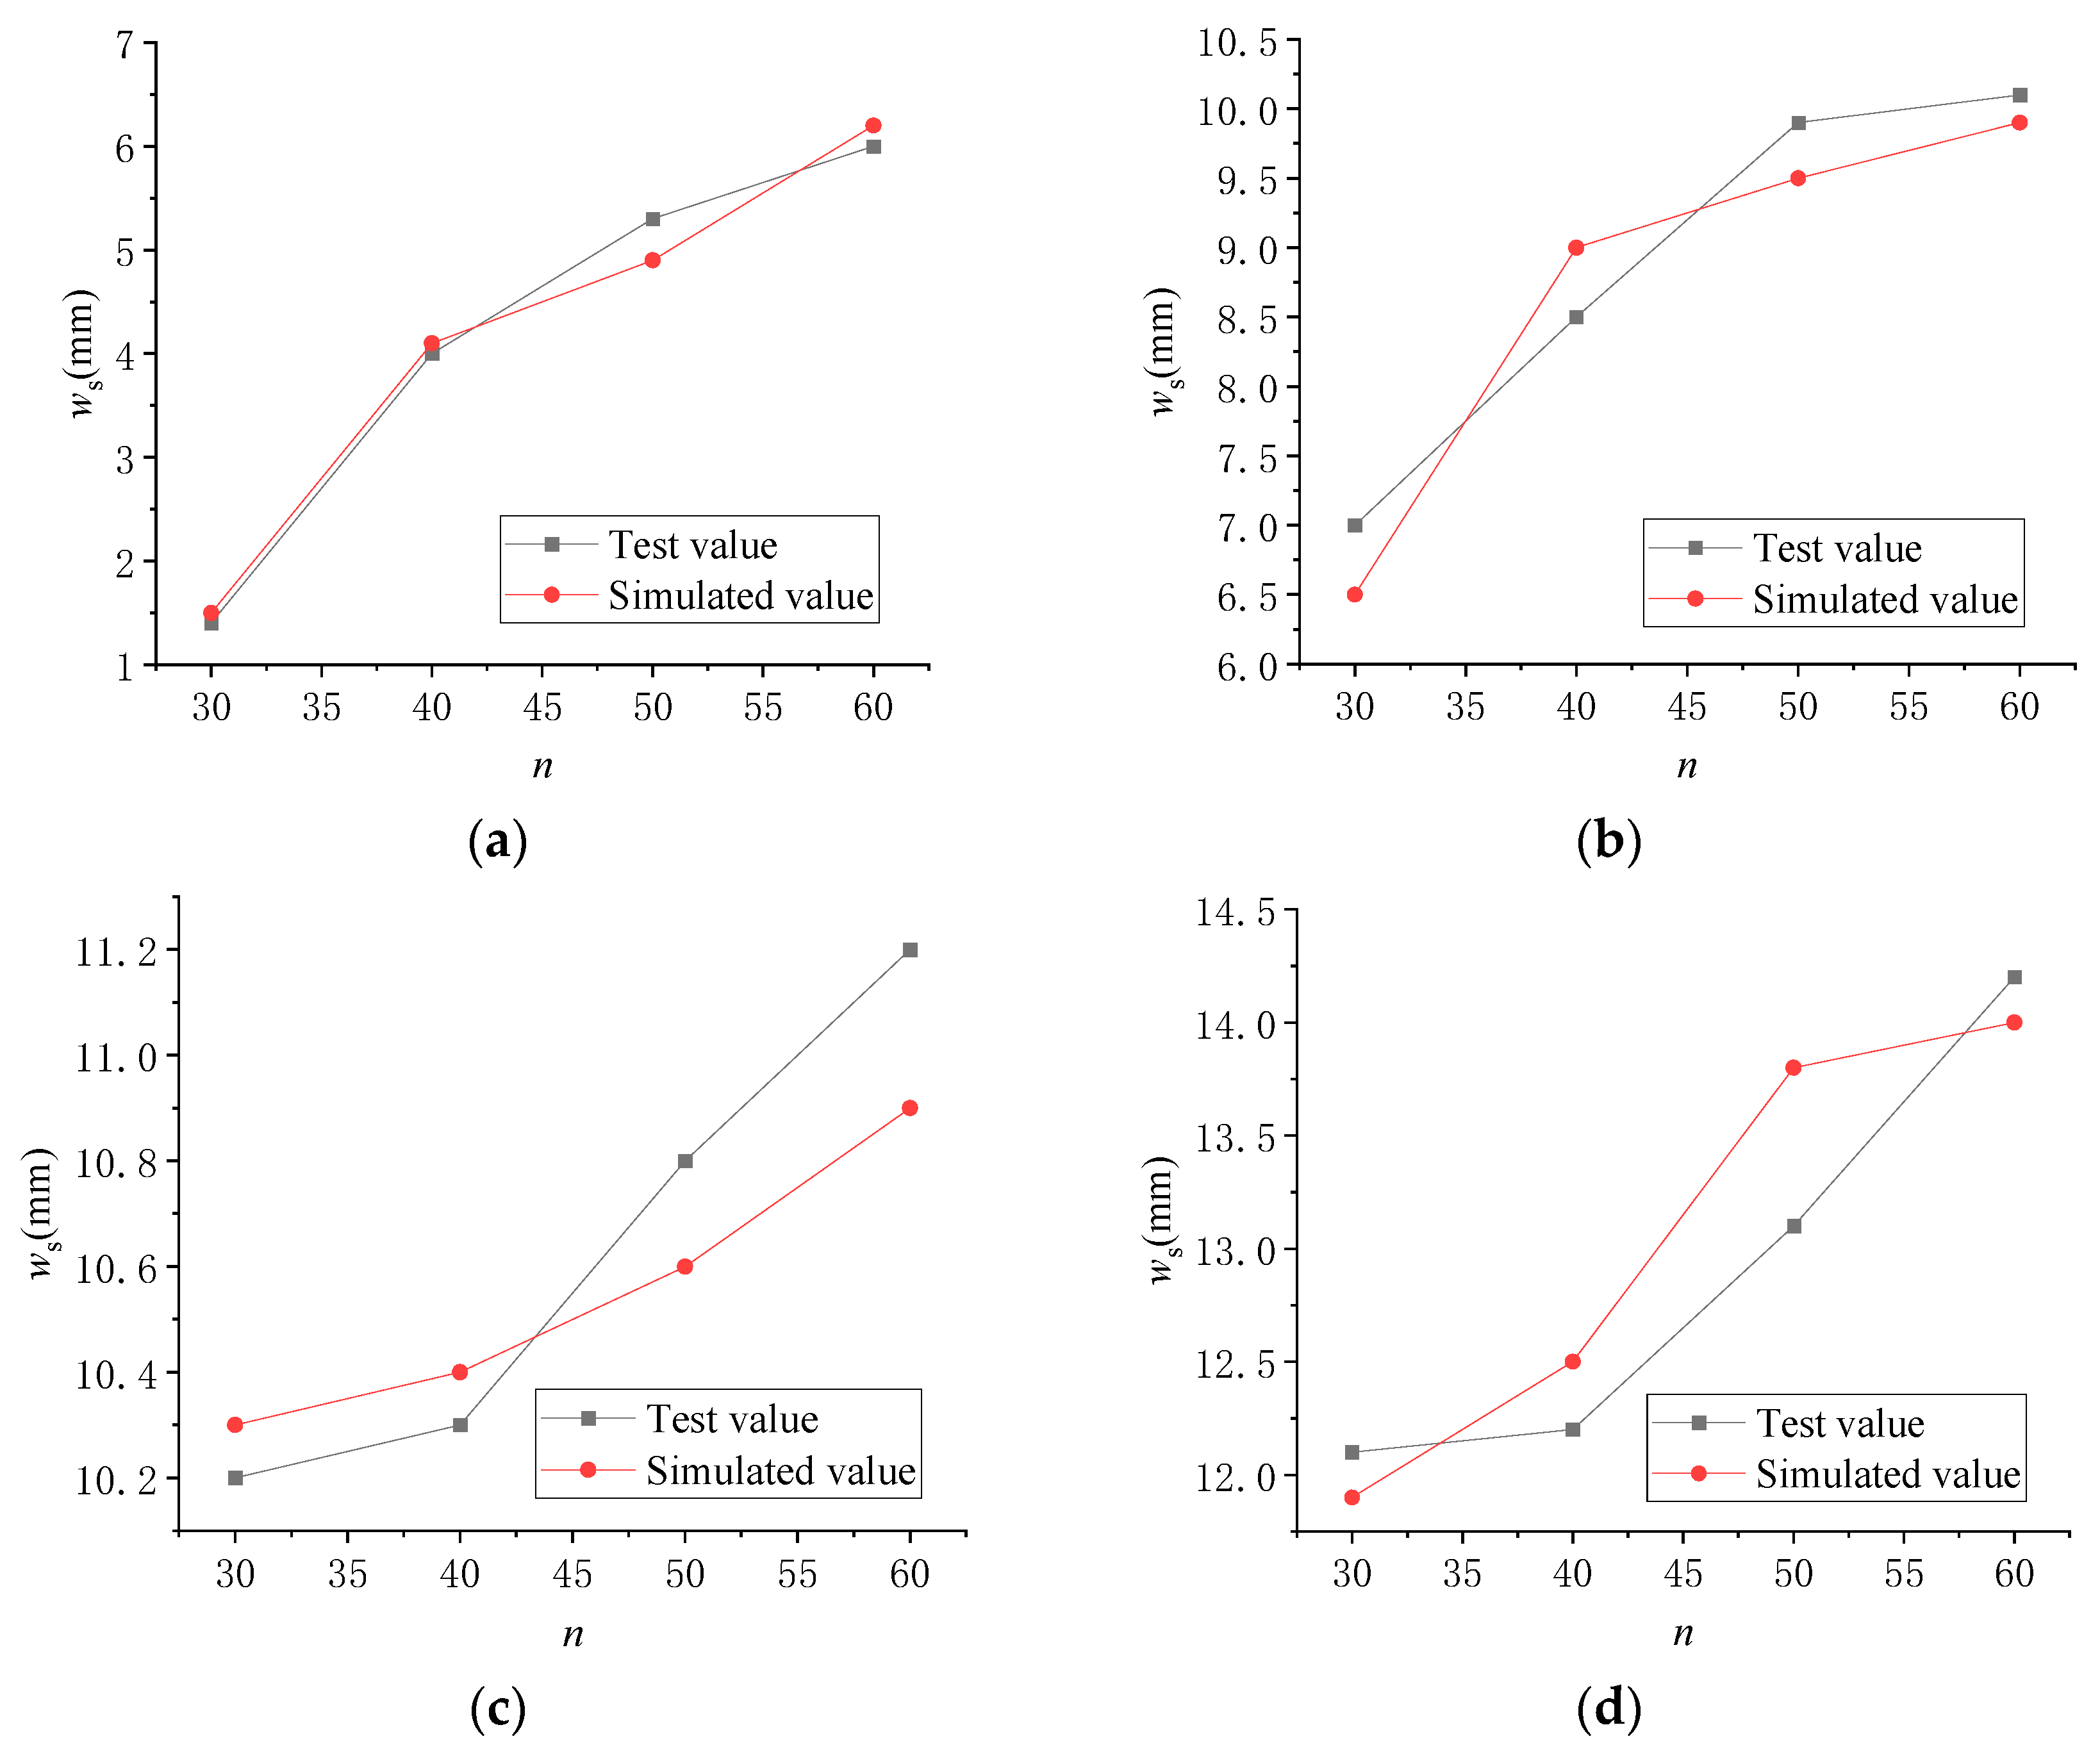
Figure 13.
The whole process of stress and crack expansion of reinforced concrete slab. (a) t = 60 µs; (b) t = 80 µs; (c) t = 130 µs; (d) t = 150 µs; (e) t = 170 µs; (f) t = 190 µs.
Figure 13.
The whole process of stress and crack expansion of reinforced concrete slab. (a) t = 60 µs; (b) t = 80 µs; (c) t = 130 µs; (d) t = 150 µs; (e) t = 170 µs; (f) t = 190 µs.
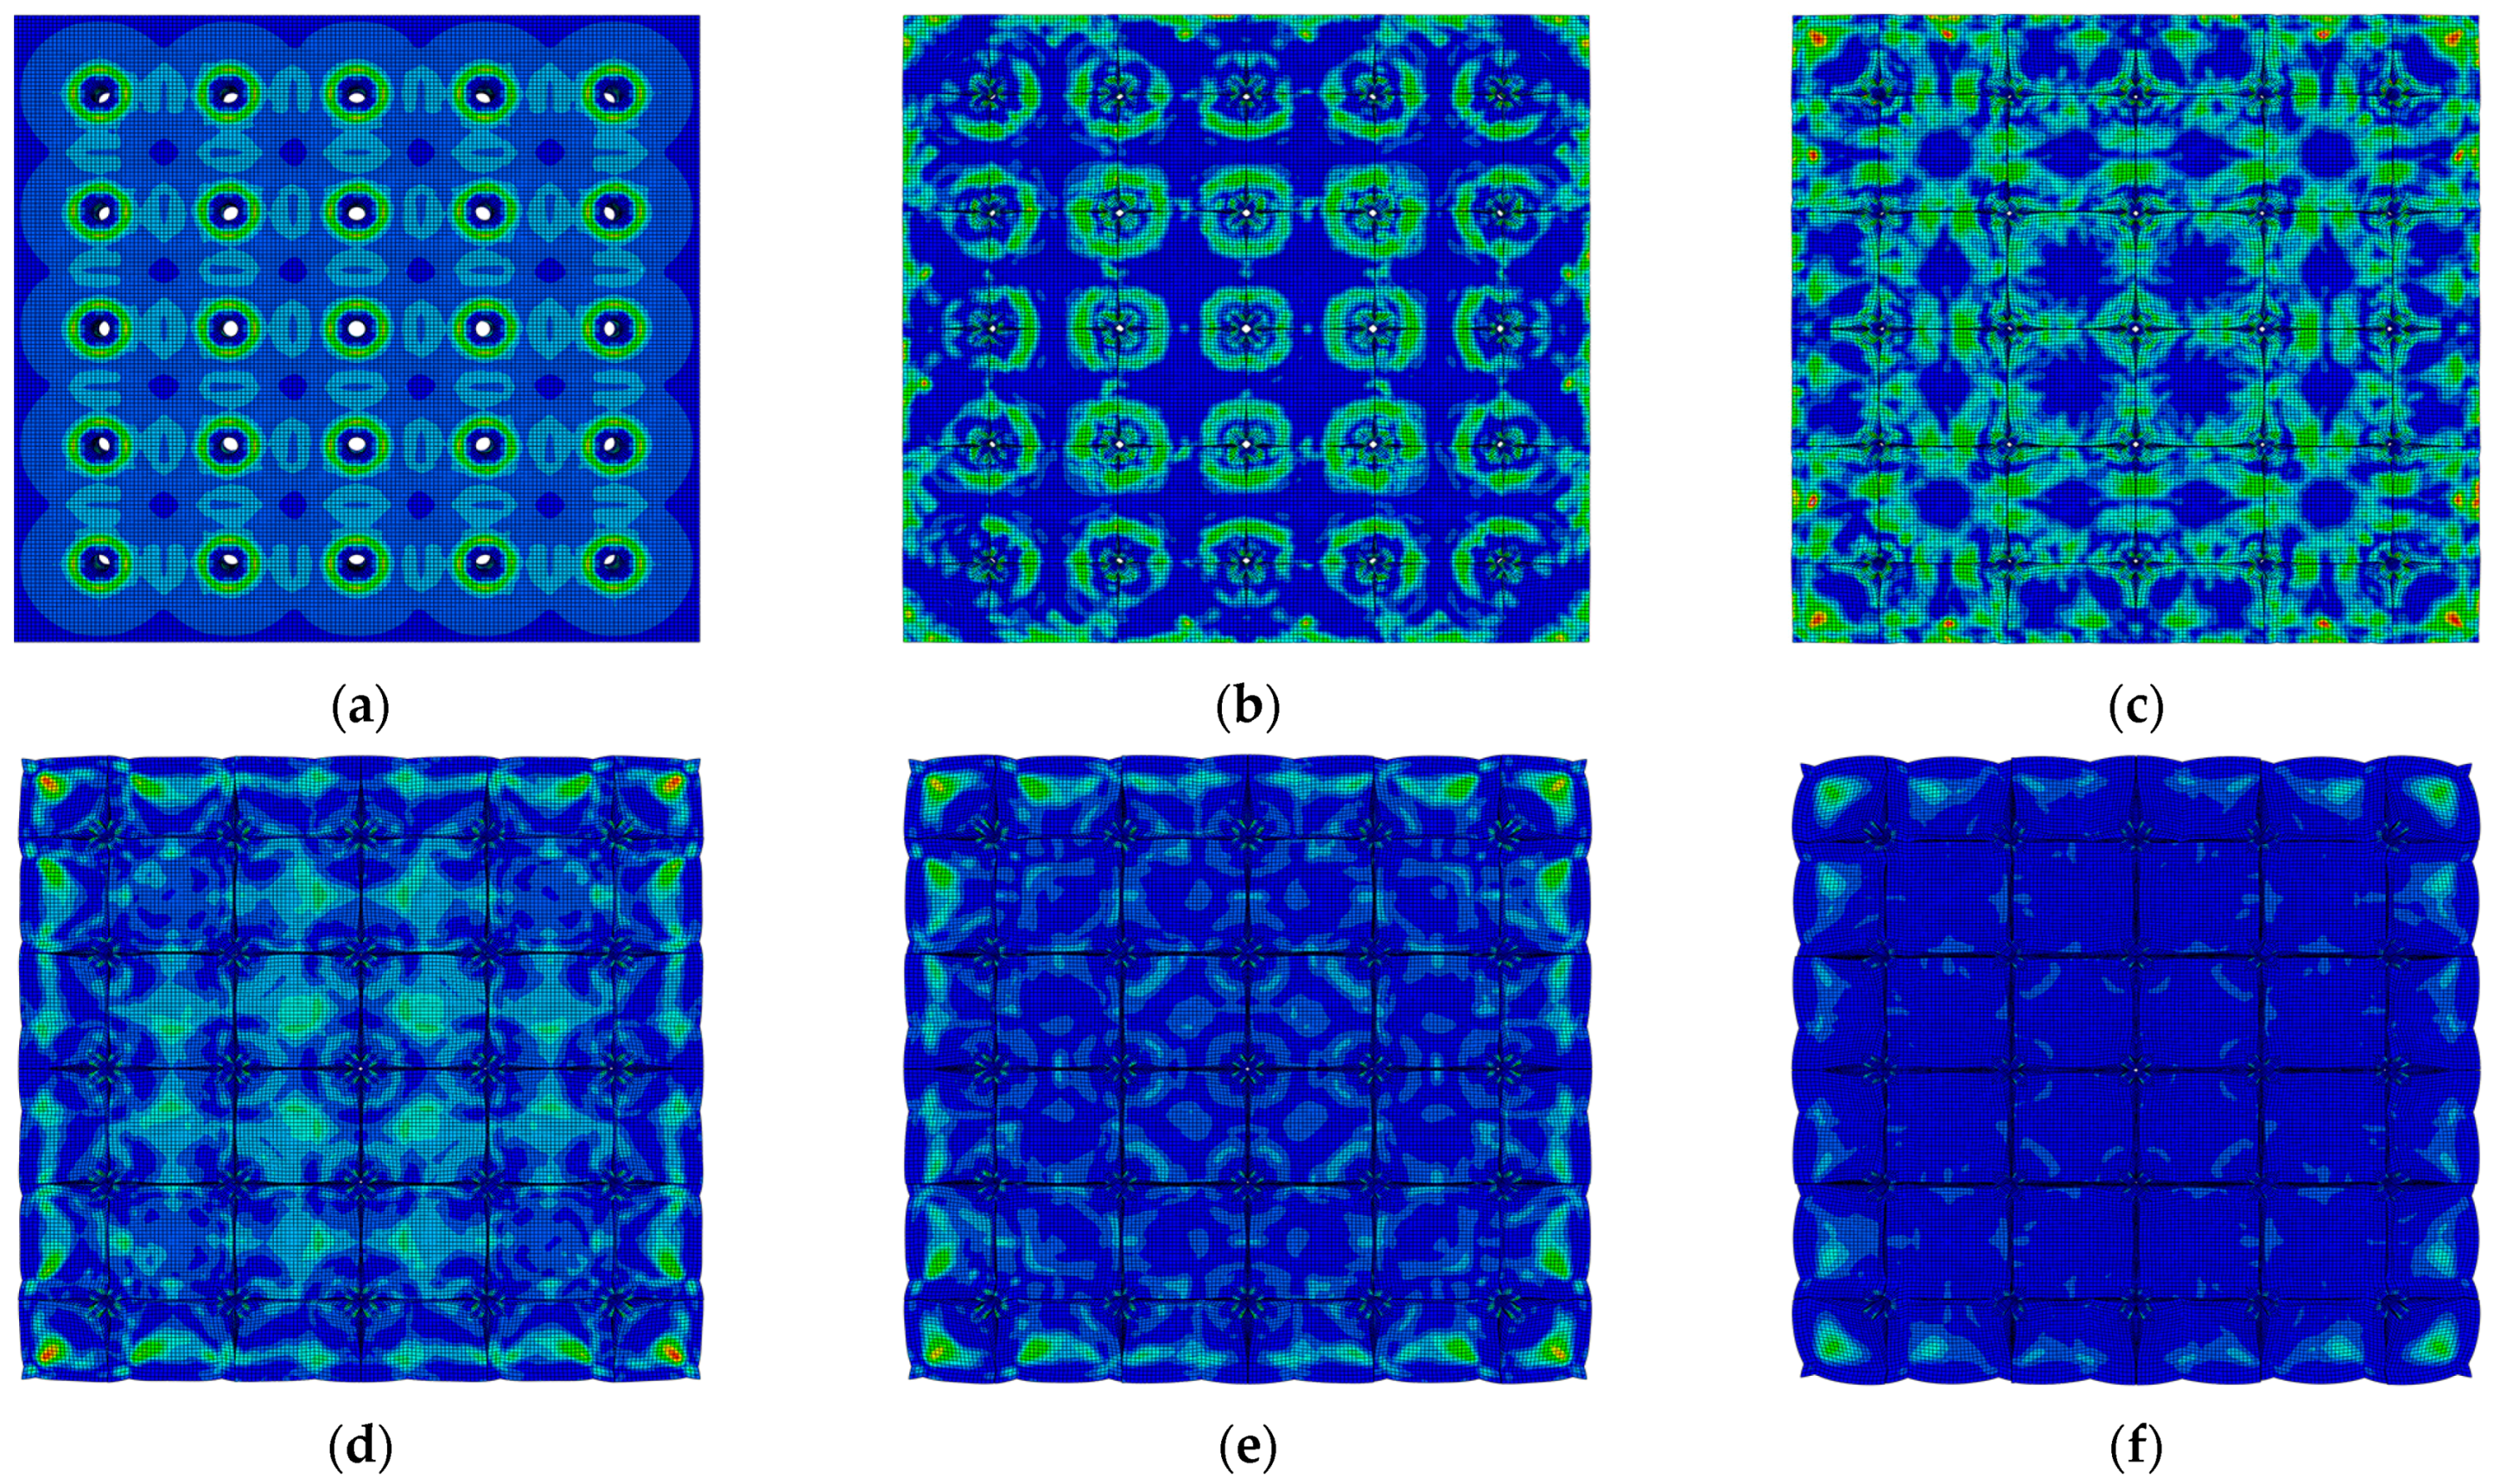
Figure 14.
Edge crack width w1 under different reinforcement diameters. (a) Spacing 100 mm; (b) Spacing 150 mm; (c) Spacing 200 mm; (d) Spacing 250 mm; (e) Spacing 300 mm.
Figure 14.
Edge crack width w1 under different reinforcement diameters. (a) Spacing 100 mm; (b) Spacing 150 mm; (c) Spacing 200 mm; (d) Spacing 250 mm; (e) Spacing 300 mm.
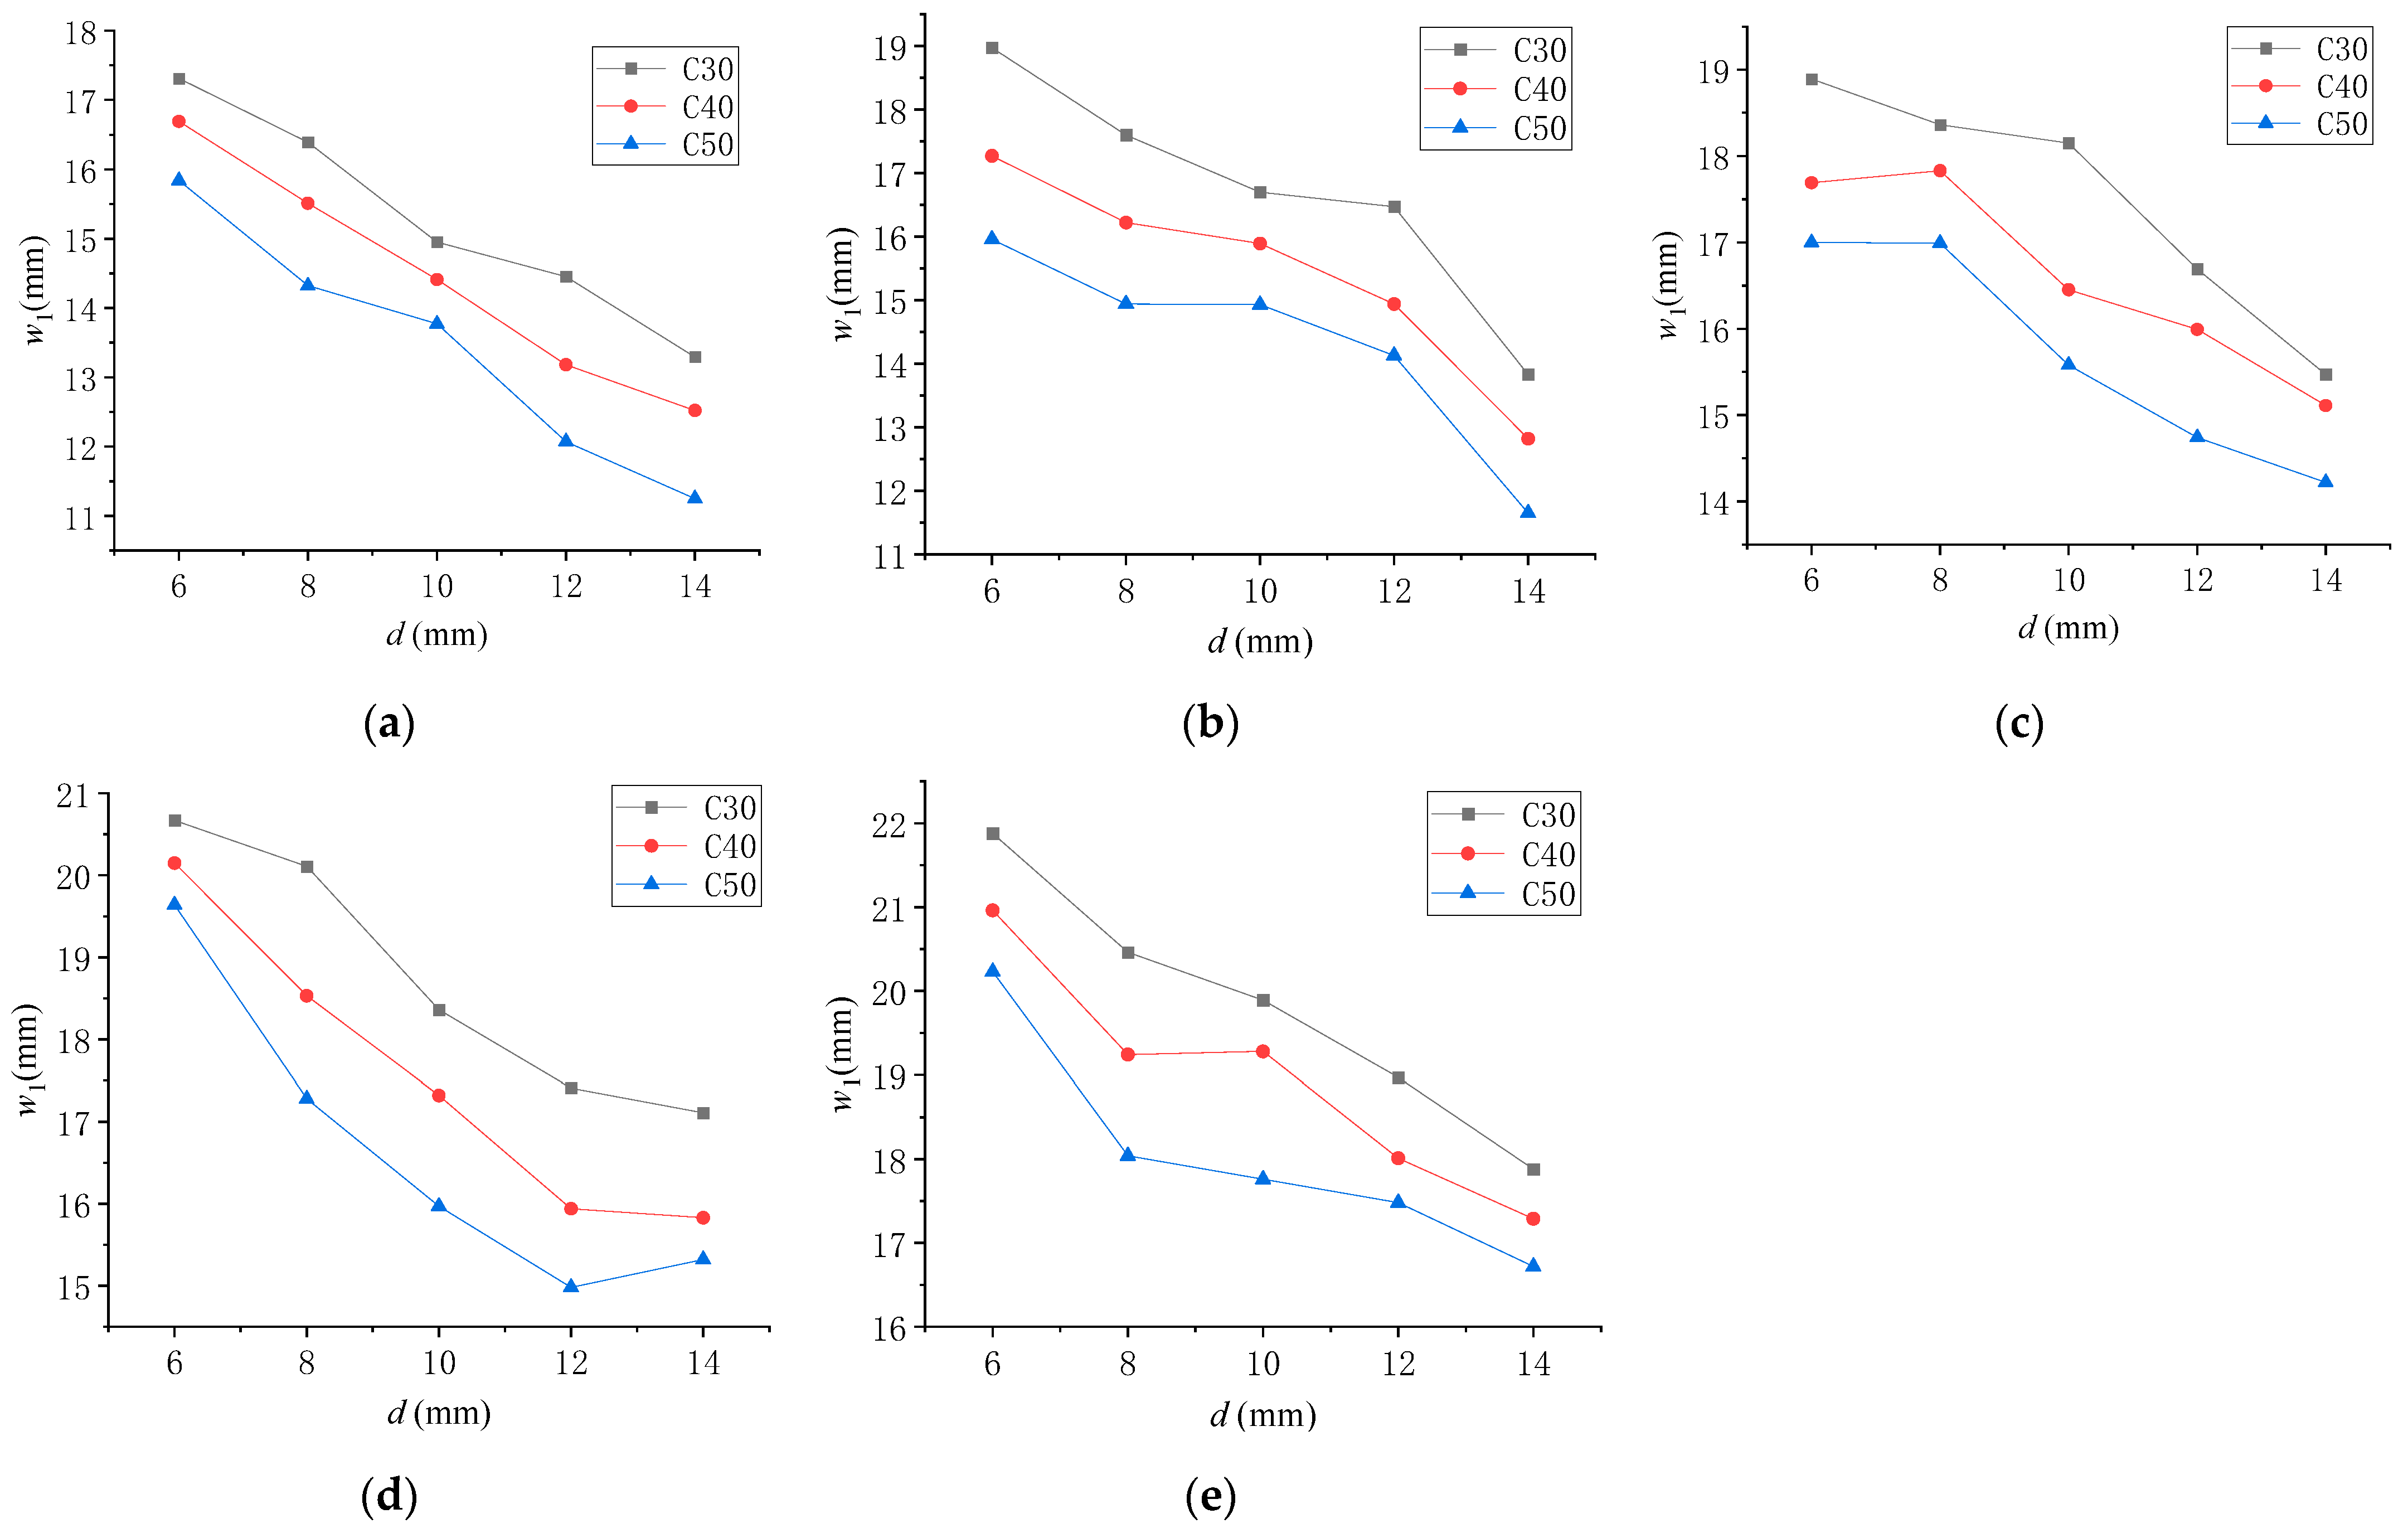
Figure 15.
Crack width between edge holes under different reinforcement diameters. (a) Spacing 100 mm; (b) Spacing 150 mm; (c) Spacing 200 mm; (d) Spacing 250 mm; (e) Spacing 300 mm.
Figure 15.
Crack width between edge holes under different reinforcement diameters. (a) Spacing 100 mm; (b) Spacing 150 mm; (c) Spacing 200 mm; (d) Spacing 250 mm; (e) Spacing 300 mm.
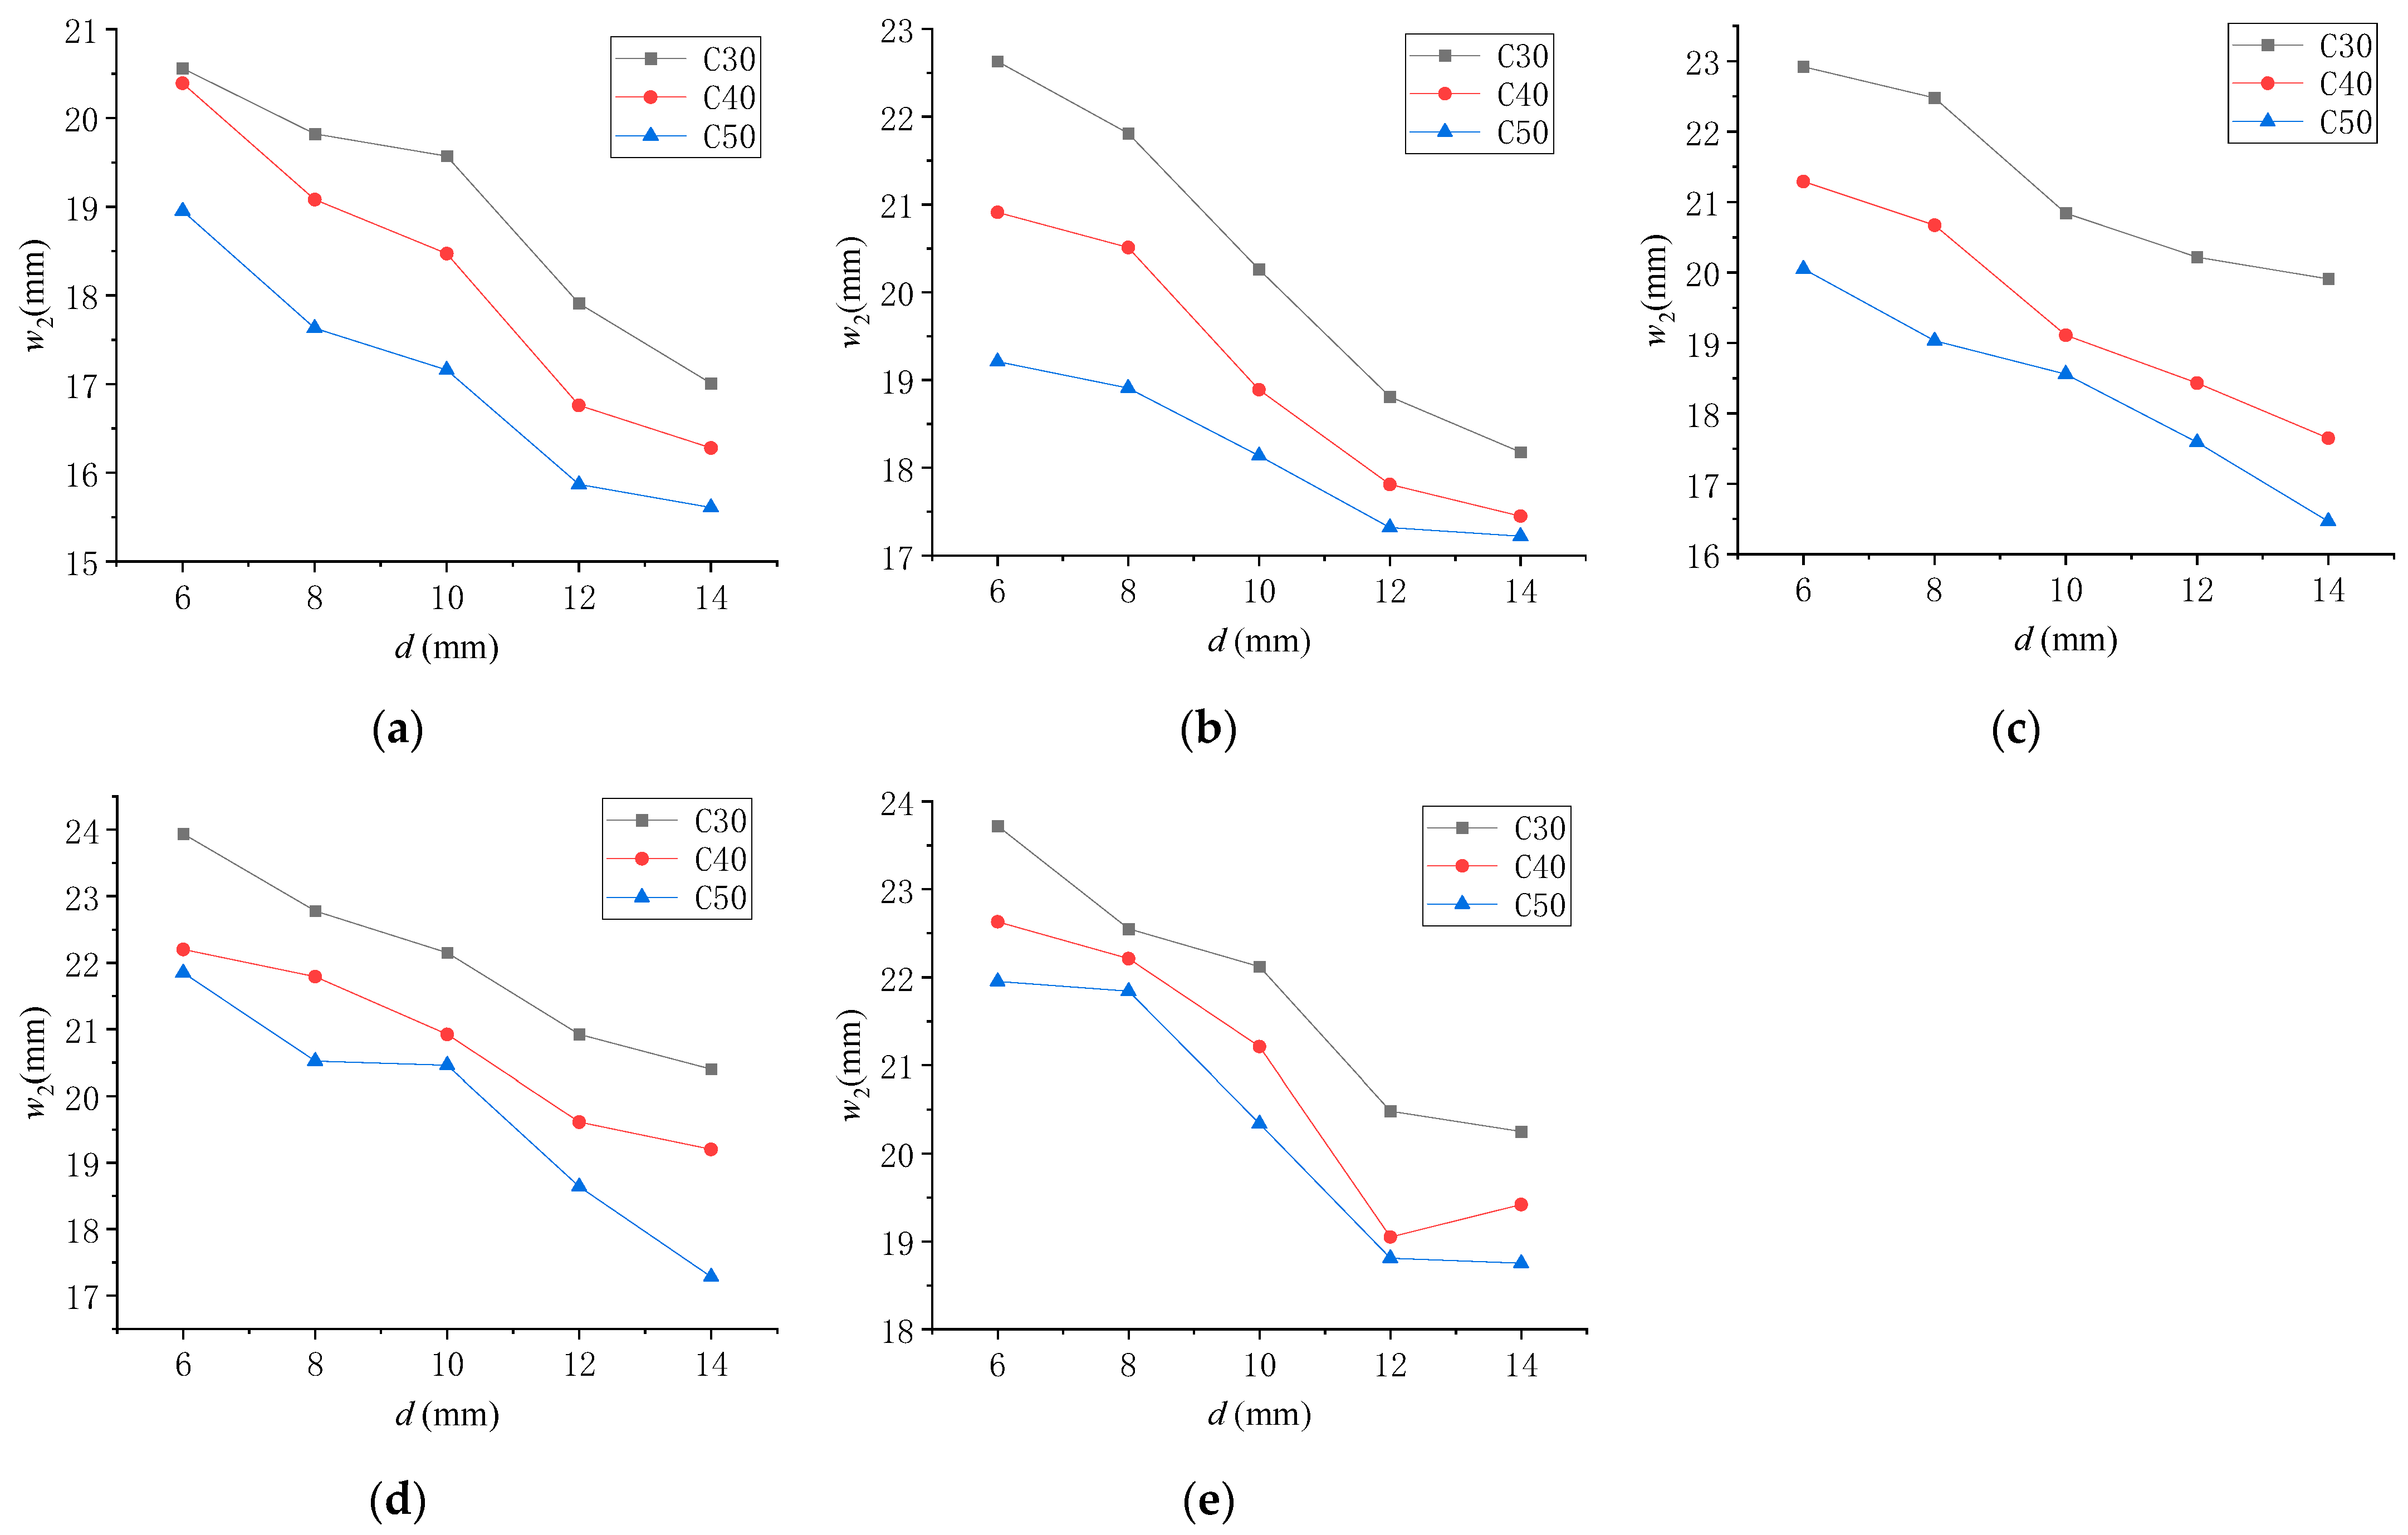
Figure 16.
Crack width between internal holes under different reinforcement diameters. (a) Spacing 100 mm; (b) Spacing 150 mm; (c) Spacing 200 mm; (d) Spacing 250 mm; (e) Spacing 300 mm.
Figure 16.
Crack width between internal holes under different reinforcement diameters. (a) Spacing 100 mm; (b) Spacing 150 mm; (c) Spacing 200 mm; (d) Spacing 250 mm; (e) Spacing 300 mm.

Figure 17.
Edge crack width with different reinforcement spacing. (a) Spacing 100 mm; (b) Spacing 150 mm; (c) Spacing 200 mm; (d) Spacing 250 mm; (e) Spacing 300 mm.
Figure 17.
Edge crack width with different reinforcement spacing. (a) Spacing 100 mm; (b) Spacing 150 mm; (c) Spacing 200 mm; (d) Spacing 250 mm; (e) Spacing 300 mm.

Figure 18.
Crack width between edge holes under different reinforcement spacing. (a) Spacing 100 mm; (b) Spacing 150 mm; (c) Spacing 200 mm; (d) Spacing 250 mm; (e) Spacing 300 mm.
Figure 18.
Crack width between edge holes under different reinforcement spacing. (a) Spacing 100 mm; (b) Spacing 150 mm; (c) Spacing 200 mm; (d) Spacing 250 mm; (e) Spacing 300 mm.

Figure 19.
Crack width between internal holes under different reinforcement spacing. (a) Spacing 100 mm; (b) Spacing 150 mm; (c) Spacing 200 mm; (d) Spacing 250 mm; (e) Spacing 300 mm.
Figure 19.
Crack width between internal holes under different reinforcement spacing. (a) Spacing 100 mm; (b) Spacing 150 mm; (c) Spacing 200 mm; (d) Spacing 250 mm; (e) Spacing 300 mm.

Figure 20.
Fitting surface of edge crack width with reinforcement diameter and spacing. (a) C30 concrete; (b) C40 concrete; (c) C50 concrete.
Figure 20.
Fitting surface of edge crack width with reinforcement diameter and spacing. (a) C30 concrete; (b) C40 concrete; (c) C50 concrete.

Table 1.
Physical and mechanical properties of concrete.
| Concrete Strength Grade | Compressive Strength of Cube/(MPa) | Compressive Strength of Prism/(MPa) | Tensile Strength of Prism/(MPa) | Elastic Modulus × 104 (MPa) |
|---|---|---|---|---|
| C20 | 25.6 | 19.5 | 1.9 | 2.83 |
| C30 | 34.6 | 26.1 | 2.5 | 3.14 |
| C40 | 44.3 | 30.9 | 2.7 | 3.20 |
Table 2.
Physical and mechanical properties of reinforcement.
| Steel Types | Tensile Yield Strength/(MPa) | Ultimate Tensile Strength/(MPa) | Modulus × 105/(MPa) |
|---|---|---|---|
 | 331.9 | 510.6 | 2.43 |
Table 3.
Coefficient of calculating crack width at different positions.
| Crack Width | Concrete Strength Classification | α | β | γ |
|---|---|---|---|---|
| Width of edge cracks w1 | C30 | 0.02 | 36.96 | 9.61 |
| C40 | 0.02 | 36.29 | 8.92 | |
| C50 | 0.02 | 38.21 | 7.68 | |
| Width of cracks between edge holes w2 | C30 | 0.01 | 38.26 | 13.75 |
| C40 | 0.01 | 38.41 | 12.66 | |
| C50 | 0.02 | 34.65 | 11.67 | |
| Width of cracks between central holes w3 | C30 | 0.02 | 37.58 | 4.67 |
| C40 | 0.02 | 42.99 | 2.86 | |
| C50 | 0.02 | 41.31 | 2.26 |
Disclaimer/Publisher’s Note: The statements, opinions and data contained in all publications are solely those of the individual author(s) and contributor(s) and not of MDPI and/or the editor(s). MDPI and/or the editor(s) disclaim responsibility for any injury to people or property resulting from any ideas, methods, instructions or products referred to in the content. |
© 2024 by the authors. Licensee MDPI, Basel, Switzerland. This article is an open access article distributed under the terms and conditions of the Creative Commons Attribution (CC BY) license (https://creativecommons.org/licenses/by/4.0/).
Share and Cite
MDPI and ACS Style
Lin, X.; Yang, F.; Liu, Y.; Yang, Y. Research on the Crushing of Reinforced Concrete Two-Way Slabs by Pulse Power Discharge Technology. Buildings 2024, 14, 1222. https://doi.org/10.3390/buildings14051222
AMA Style
Lin X, Yang F, Liu Y, Yang Y. Research on the Crushing of Reinforced Concrete Two-Way Slabs by Pulse Power Discharge Technology. Buildings. 2024; 14(5):1222. https://doi.org/10.3390/buildings14051222
Chicago/Turabian StyleLin, Xinxin, Fei Yang, Youwei Liu, and Yang Yang. 2024. "Research on the Crushing of Reinforced Concrete Two-Way Slabs by Pulse Power Discharge Technology" Buildings 14, no. 5: 1222. https://doi.org/10.3390/buildings14051222
Note that from the first issue of 2016, this journal uses article numbers instead of page numbers. See further details here.