1. Introduction
The Energy Performance of Buildings Directive (EPBD 2010/31/EU) [
1] established that all of the new constructions, from 31st December 2020, will have to reach the standard nearly Zero Energy Buildings (nZEBs), which implies a large scale deployment of this kind of buildings. As defined in the art.2, a ‘nearly Zero-Energy Building’ is a building with very high-energy performance that should cover the nearly zero energy (or at least a very low amount of it) required by on site or nearby energy production from Renewable Energy Source (RES). Such qualitative definition leaves a lot of space for national interpretation and for the adoption of the quantitative indices to be considered (i.e., performance targets, amount of renewables to be integrated, CO
2 emissions, etc.). Due to this reason and to specific local conditions as well as construction practice, European countries have adopted their own definition, and there are some relevant inconsistencies across Europe [
2,
3,
4].
In France, for example, an nZEB has to accomplish the “RT2012” (national law), which requires a primary energy consumption lower than 60 kWh/(m2·year) in new residential buildings (including heating, DHW, cooling, ventilation, lighting and auxiliary systems) and variable value limits for new non-residential buildings, as lower than 110 kWh/(m2·year) in office buildings (including heating, DHW, cooling, ventilation, lighting and auxiliary systems). Whereas in Austria, the “OIB Directive 6” (national law) establishes that a building is an nZEB when the primary energy is less than 160 kWh/(m2·year) in new residential (including heating, DHW, cooling, ventilation and electric appliances) and less than 170 kWh/(m2·year) in non-residential (including heating, DHW, cooling, ventilation, electric appliances and lighting). On the other hand, in Italy, the “DM 20 of June 2015” (national law) defines the primary energy limits of nZEBs using a calculation process based on reference buildings and introduces a minimum rate of renewables (including heating, DHW, cooling, ventilation in residential buildings and also lighting and mobility of persons (e.g., elevator) in non-residential ones).
Further than the comparative analysis of the European nZEB definitions, the project EU IEE ZEBRA2020 aims to assess the current state of transition of the building stock towards the nZEB target and to define solutions to overcome the identified market barriers. In fact, the project highlighted that, despite the technologies for nZEBs are ready and proven, the average EU rate of new nZEB construction is low and is increasing slowly, and thus targeted national countermeasures should be adopted.
In this regard, the identification of best practices, performance targets, technology solution sets and the definition of design guideline represent strategic actions that can support the designers in planning new nZEBs. These issues represent the key factors to foster the uptake of nZEB across Europe; in fact, there are a large number of European projects and an extensive literature in this field. In fact, there are several papers dealing with the definition of the general effective design approach based on cost-optimal principles [
5,
6], and that analyzes specific technologies influencing the nZEB performances. In particular, the focus is on the envelope features [
7,
8], the HVAC system components [
9,
10,
11] and the integration of renewable energies [
12].
Nevertheless, although the large number of papers dealing with the topic, currently, the impact of the technologies as well as the final performances are evaluated or by simulation activities or by monitoring a reduced number of real buildings. Currently, an evaluation of the nZEB features and related performances based on a large sample of buildings is missing. The main reason is the lack of structured and populated databases including nZEB data across Europe. In fact, in the past recent years, several European projects dealt with the setup of building databases, that represent an important starting point for this work, but none of them is specifically focused on nZEBs.
Among all, the main databases considered are: “EU IEE TABULA-EPISCOPE” [
13], aimed at classifying the building stock in representative typologies, “EU H2020 ODYSSE-MURE” [
14] that includes data to assess the general trends at country level and effectiveness of energy related implemented policies, “EU IEE ENTRANZE Data Tool” [
15] and “EU IEE ENTRANZE Cost Tool” [
16], that include detailed information on a set of buildings but are not specifically focused on nZEB.
Moreover, in the report “
A harmonized database to share nZEBs good practices” [
17] is described the framework and the main information to be collected for setting up a database for nZEBs in the Mediterranean-climate zone; nevertheless, it is not yet populated with a significant number of buildings.
Finally, it is under development the new release of the “EU Building Stock Observatory” (
https://ec.europa.eu/energy/en/eubuildings), an online database that monitors the energy performance of buildings across Europe and collects the building stock characteristics, the costs and state of implementation of relevant EU Directives across the Member States. “EU Building Stock Observatory” is an online database developed for the European Commission by Building Performance Institute Europe (BPIE) in collaboration with Ecofys, Energy Research Centre of the Netherlands (ECN), Enerdata, Seven and many national partners. The next developments will be focused on building renovation and nZEB.
The development of the database in EU IEE ZEBRA 2020 started from the structure and the indicators of these available tools. It is specifically focused on nZEBs, including buildings features, technical systems, passive and active solutions adopted, and it was populated with a significant number of cases that allows for carrying out analyses on the performances and on the features of nZEBs buildings across Europe.
The analysis reported in this paper represents a first step for the elaboration of an nZEB design guideline, and aims to identify the recurrent technology solutions, and the related performances in the nZEB building stock across Europe. The main nZEB features were identified by analyzing the solutions implemented in nZEB, considering both residential and non-residential buildings, new and renovated ones. The analysis is conducted in 17 European countries presenting different climatic conditions, building regulations and local nZEB definitions.
2. Methodology
In order to identify the nZEBs’ features, we performed an investigation in 17 European countries (Austria, Belgium, Czech Republic, Denmark, France, Germany, Italy, Lithuania, Luxemburg, Norway, Poland, Romania, Slovakia, Spain, Sweden, Netherlands and United Kingdom) on design strategies and technologies implemented on a sample of 411 residential and non-residential buildings. The analyzed buildings were identified in reports and Energy Performance Certificate (EPC) databases within the project EU IEE ZEBRA2020. In addition, the data collection was focused on buildings constructed or renovated after 2010, in order to represent the picture after the EPBD recast. Each country data elaboration was based on different sample size according to the availability of information.
It is estimated that most of the collected buildings fulfill the nZEBs target as defined at national and regional level. Nevertheless, when the data collection was taking place, some countries (e.g., Germany and Spain) involved in the analysis lacked of an official nZEB definition [
3,
4]. In these cases, we included in the sample a set of exemplary cases of high energy-efficient constructions.
European Climatic Zone
Local climate conditions are defined as “
the weather conditions prevailing in an area in general or over a long period” (
https://en.oxforddictionaries.com/definition/climate). As the history of architecture shows, the local climatic conditions have been one of the most significant factors that influence the building features. In the last century, the technology improvement changed the design approach and the impact of the climate boundaries on the architectural features decreased; thus, the buildings present homogeneous features across Europe. Currently, the introduction of the nZEB target increased the importance of reducing the energy needs, and the ‘passive design’ according to the local climate conditions becomes a recurrent practice. The main reason is that the implementation of passive design strategies allows for taking advantage of the local energy sources and reducing the energy needs for heating or cooling, also influencing the aesthetics and the functional building features.
In most of the cases, the energy performance indicators are based on climatic zones identified by external temperatures. Nevertheless, other factors like humidity, atmospheric pressure, wind, precipitation or solar radiation also play an important role in the energy needs of a building. A common standard for the classification of European climatic zones and for the consequent performance target normalization are still missing and in several studies, analysis or projects, a different classification is being used (e.g., MORE-CONNECT (
http://www.more-connect.eu/the-project/concept-and-approach/), GE20 (
http://geoclusters.eu/), iNSPiRe (
http://inspirefp7.eu/), TABULA and EPISCOPE (
http://episcope.eu/iee-project/tabula/), 4RinEU (
http://www.4rineu.eu/), etc.). Moreover, each country has defined its own national climatic zone classification in relation to the specific climatic characteristics, and according to them, also the variable limits of energy performance indicators [
18].
Within EU IEE ZEBRA2020 project, each nZEB included in the analysis was associated to the related Heating Degree Days (HDD) and Cooling Degree Days (CDD) using the same calculation method [
18]. In order to determine the values of HDD and CDD, we assumed identical reference temperatures for all nZEBs’ location (15 °C for HDD and 18.5 °C for CDD), and we adopted average daily temperature values of the last 36 months (the data were gathered from
http://www.degreedays.net) [
2]. Nevertheless, the level of accuracy of the climatic data for describing the conditions of the selected nZEBs can be affected by the distance between the building and the nearest weather station. In fact, different case studies, although located in different microclimates areas with different environment features (e.g., altitude, slope, orientation, soil type, solar irradiation), present the same HDD and CDD, due to the lack of more detailed data.
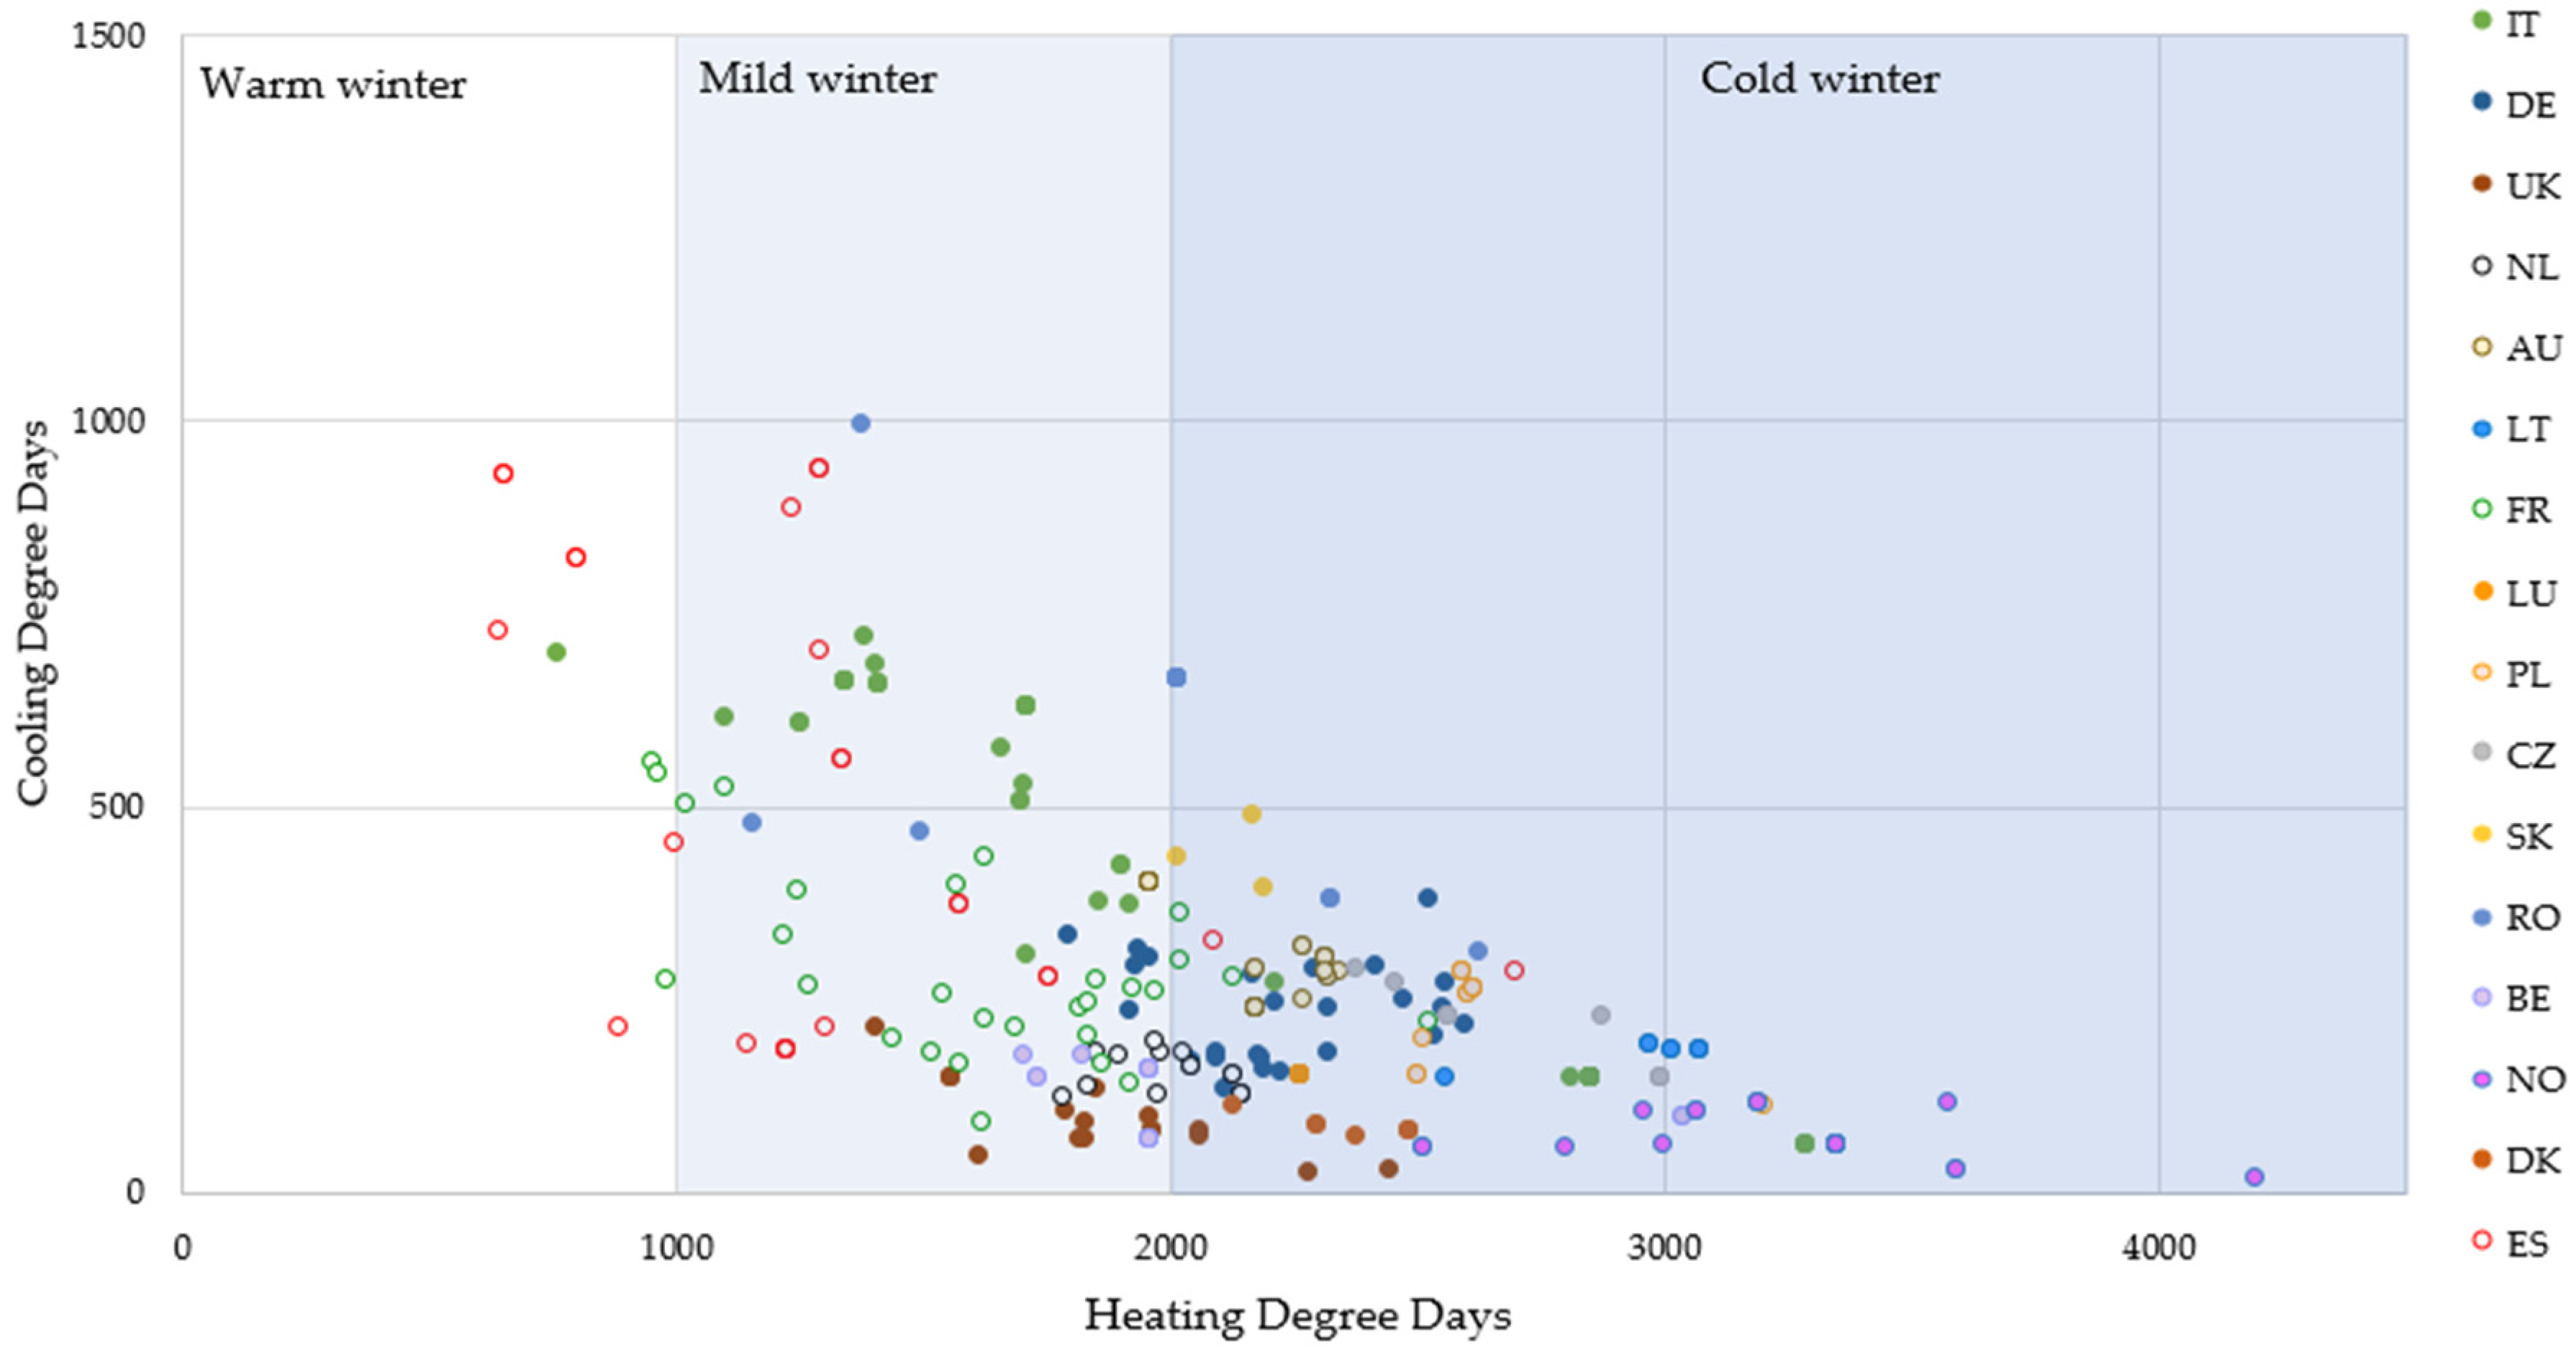
In order to classify the buildings, we adopted three winter climates (warm, mild and cold) according to HDD, as shown
Figure 1.
It is possible to point out that the buildings located in Norway, United Kingdom, Belgium, Denmark and Austria present a reduced climate variability, while those in Italy and Spain have larger ranges of HDD and CDD, according to the different climate zones in the countries.
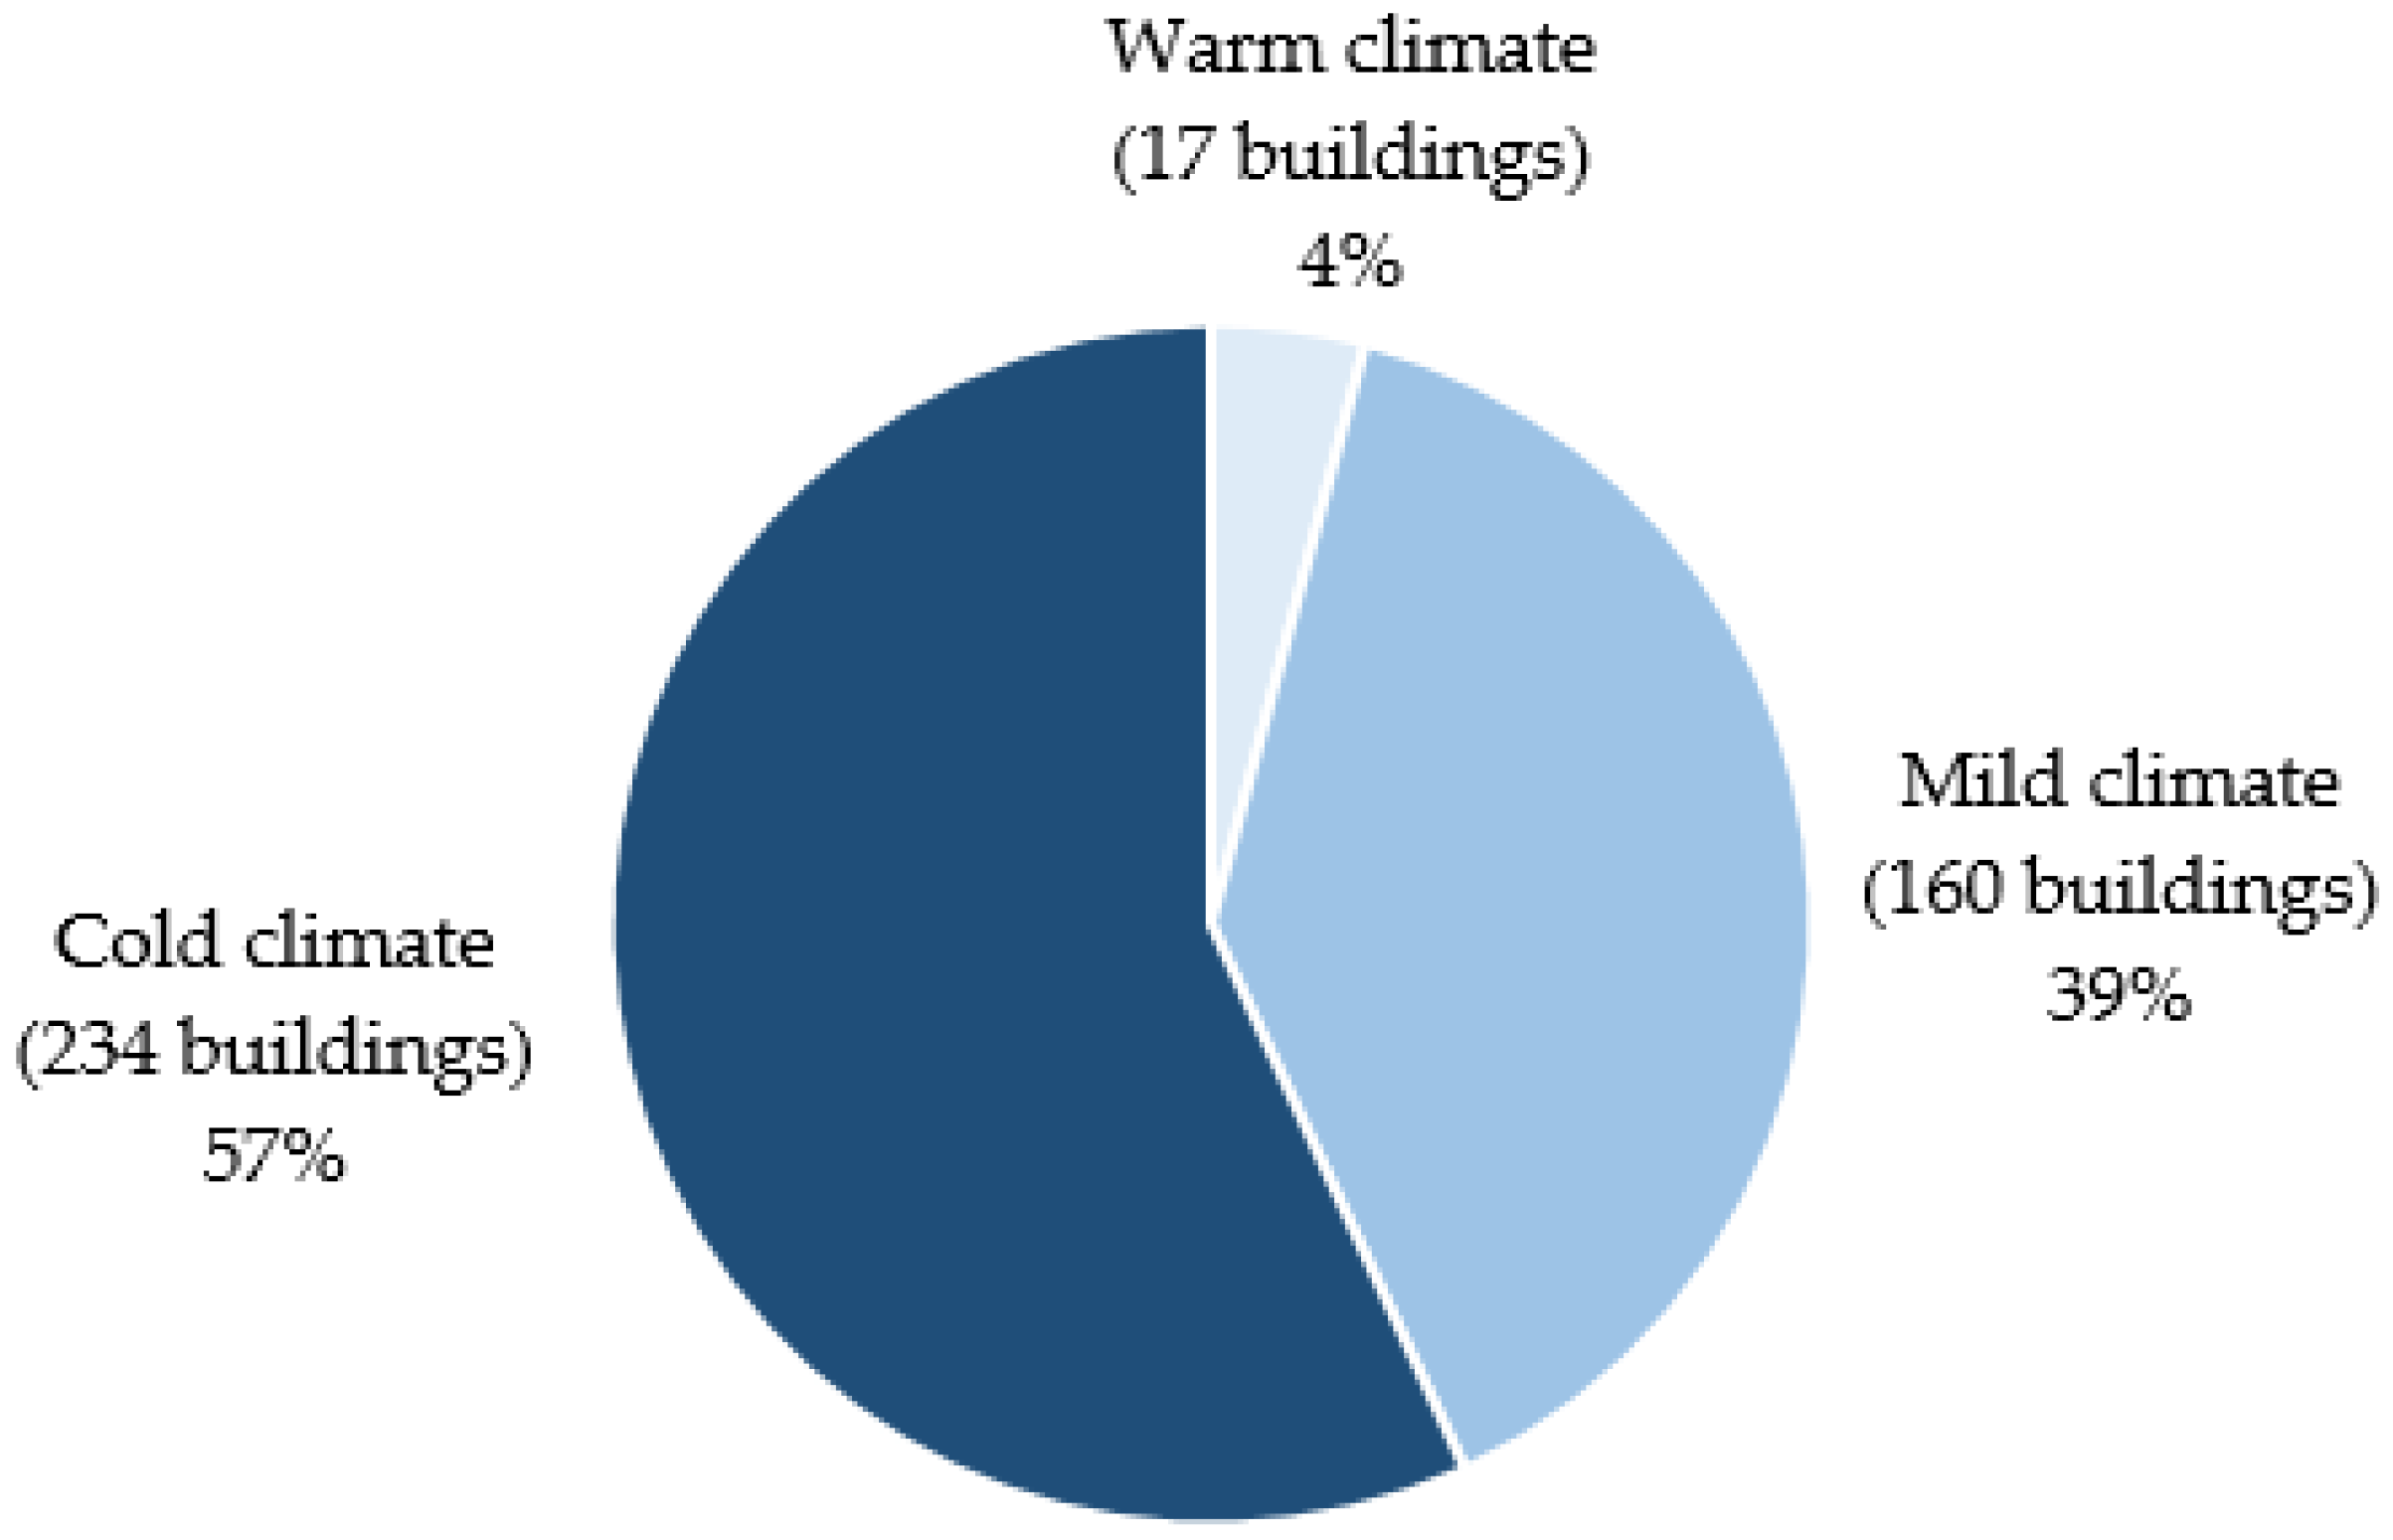
It is important to point out that, due to the reduced number of buildings available in the sample, as shown in
Figure 2, the technology analysis in the warm climatic zone could have a lower representativeness than the analysis in the mild and cold climates.
3. Data Collection
As showed in
Table 1, the analysis is based on 411 nZEBs (recently constructed or renovated) located in 17 European countries.
The collected data were deduced from EPCs, building databases and reports on energy efficiency buildings, providing information on:
type of building: residential and non-residential;
type of construction: new and renovated;
year of construction or renovation;
location and climate conditions (HDD and CDD);
energy performance: heating demand, understood as energy need (heat to be delivered to, or extracted from, a conditioned space to maintain the intended temperature conditions during a given period of time [
19]) and primary energy demand (energy that has not been subjected to any conversion or transformation process [
20]) according to national standards;
envelope features: thermal transmittance (U-values) and insulating materials;
windows features: thermal transmittance (Uwin-value), type of glass, solar gain (g-value) and frame material;
passive strategies implemented: sunshade, natural ventilation, night cooling, evaporative cooling, sunspaces, thermal mass or green roof;
HVAC systems: typology of heating, cooling, Domestic Hot Water (DHW) and mechanical ventilation systems;
Renewable Energy Systems (RES) installed: photovoltaic or solar thermal systems.
All of the above-mentioned information for the building samples is available in the ‘
Data tool nZEB buildings’, an online tool elaborated within EU IEE ZEBRA2020 project (
www.zebra2020.eu), where main nZEB features are shown by use (residential and non-residential), by country and by climatic zone.
4. Data Analysis
The sample is composed by 64% “residential” and 36% “non-residential” buildings, in line with the rates of the European building stock [
21]. In addition, 81% of the selected nZEBs are “new buildings”, while the “renovated buildings” represent the 19%.
Due to the different existing definitions and calculation approaches developed in Europe, a direct comparison among the level of global energy performance indicators cannot be performed. In particular, one of the most critical parameters is the primary energy demand, since it is calculated through different energy balance methods, with different boundary conditions, primary energy factors, CO2 equivalent emissions, and with different contributions of active and passive systems (i.e., heating, cooling, lighting, ventilation).
Consequently, we focused the analysis on the heating demand, since the discrepancies between countries in the calculation approach are reduced due to the common standard for the energy balance calculation provided by the EN ISO 13790 [
19].
Moreover, within this work, in order to reduce the inconsistencies due to the calculation method, we analyzed quantitative parameters calculated through EU standards (i.e., thermal transmittance), values coming from the technical sheets (i.e., efficiency of the HVAC devices), as well as qualitative data (i.e., the typology of technological systems installed).
4.1. Heating Demand
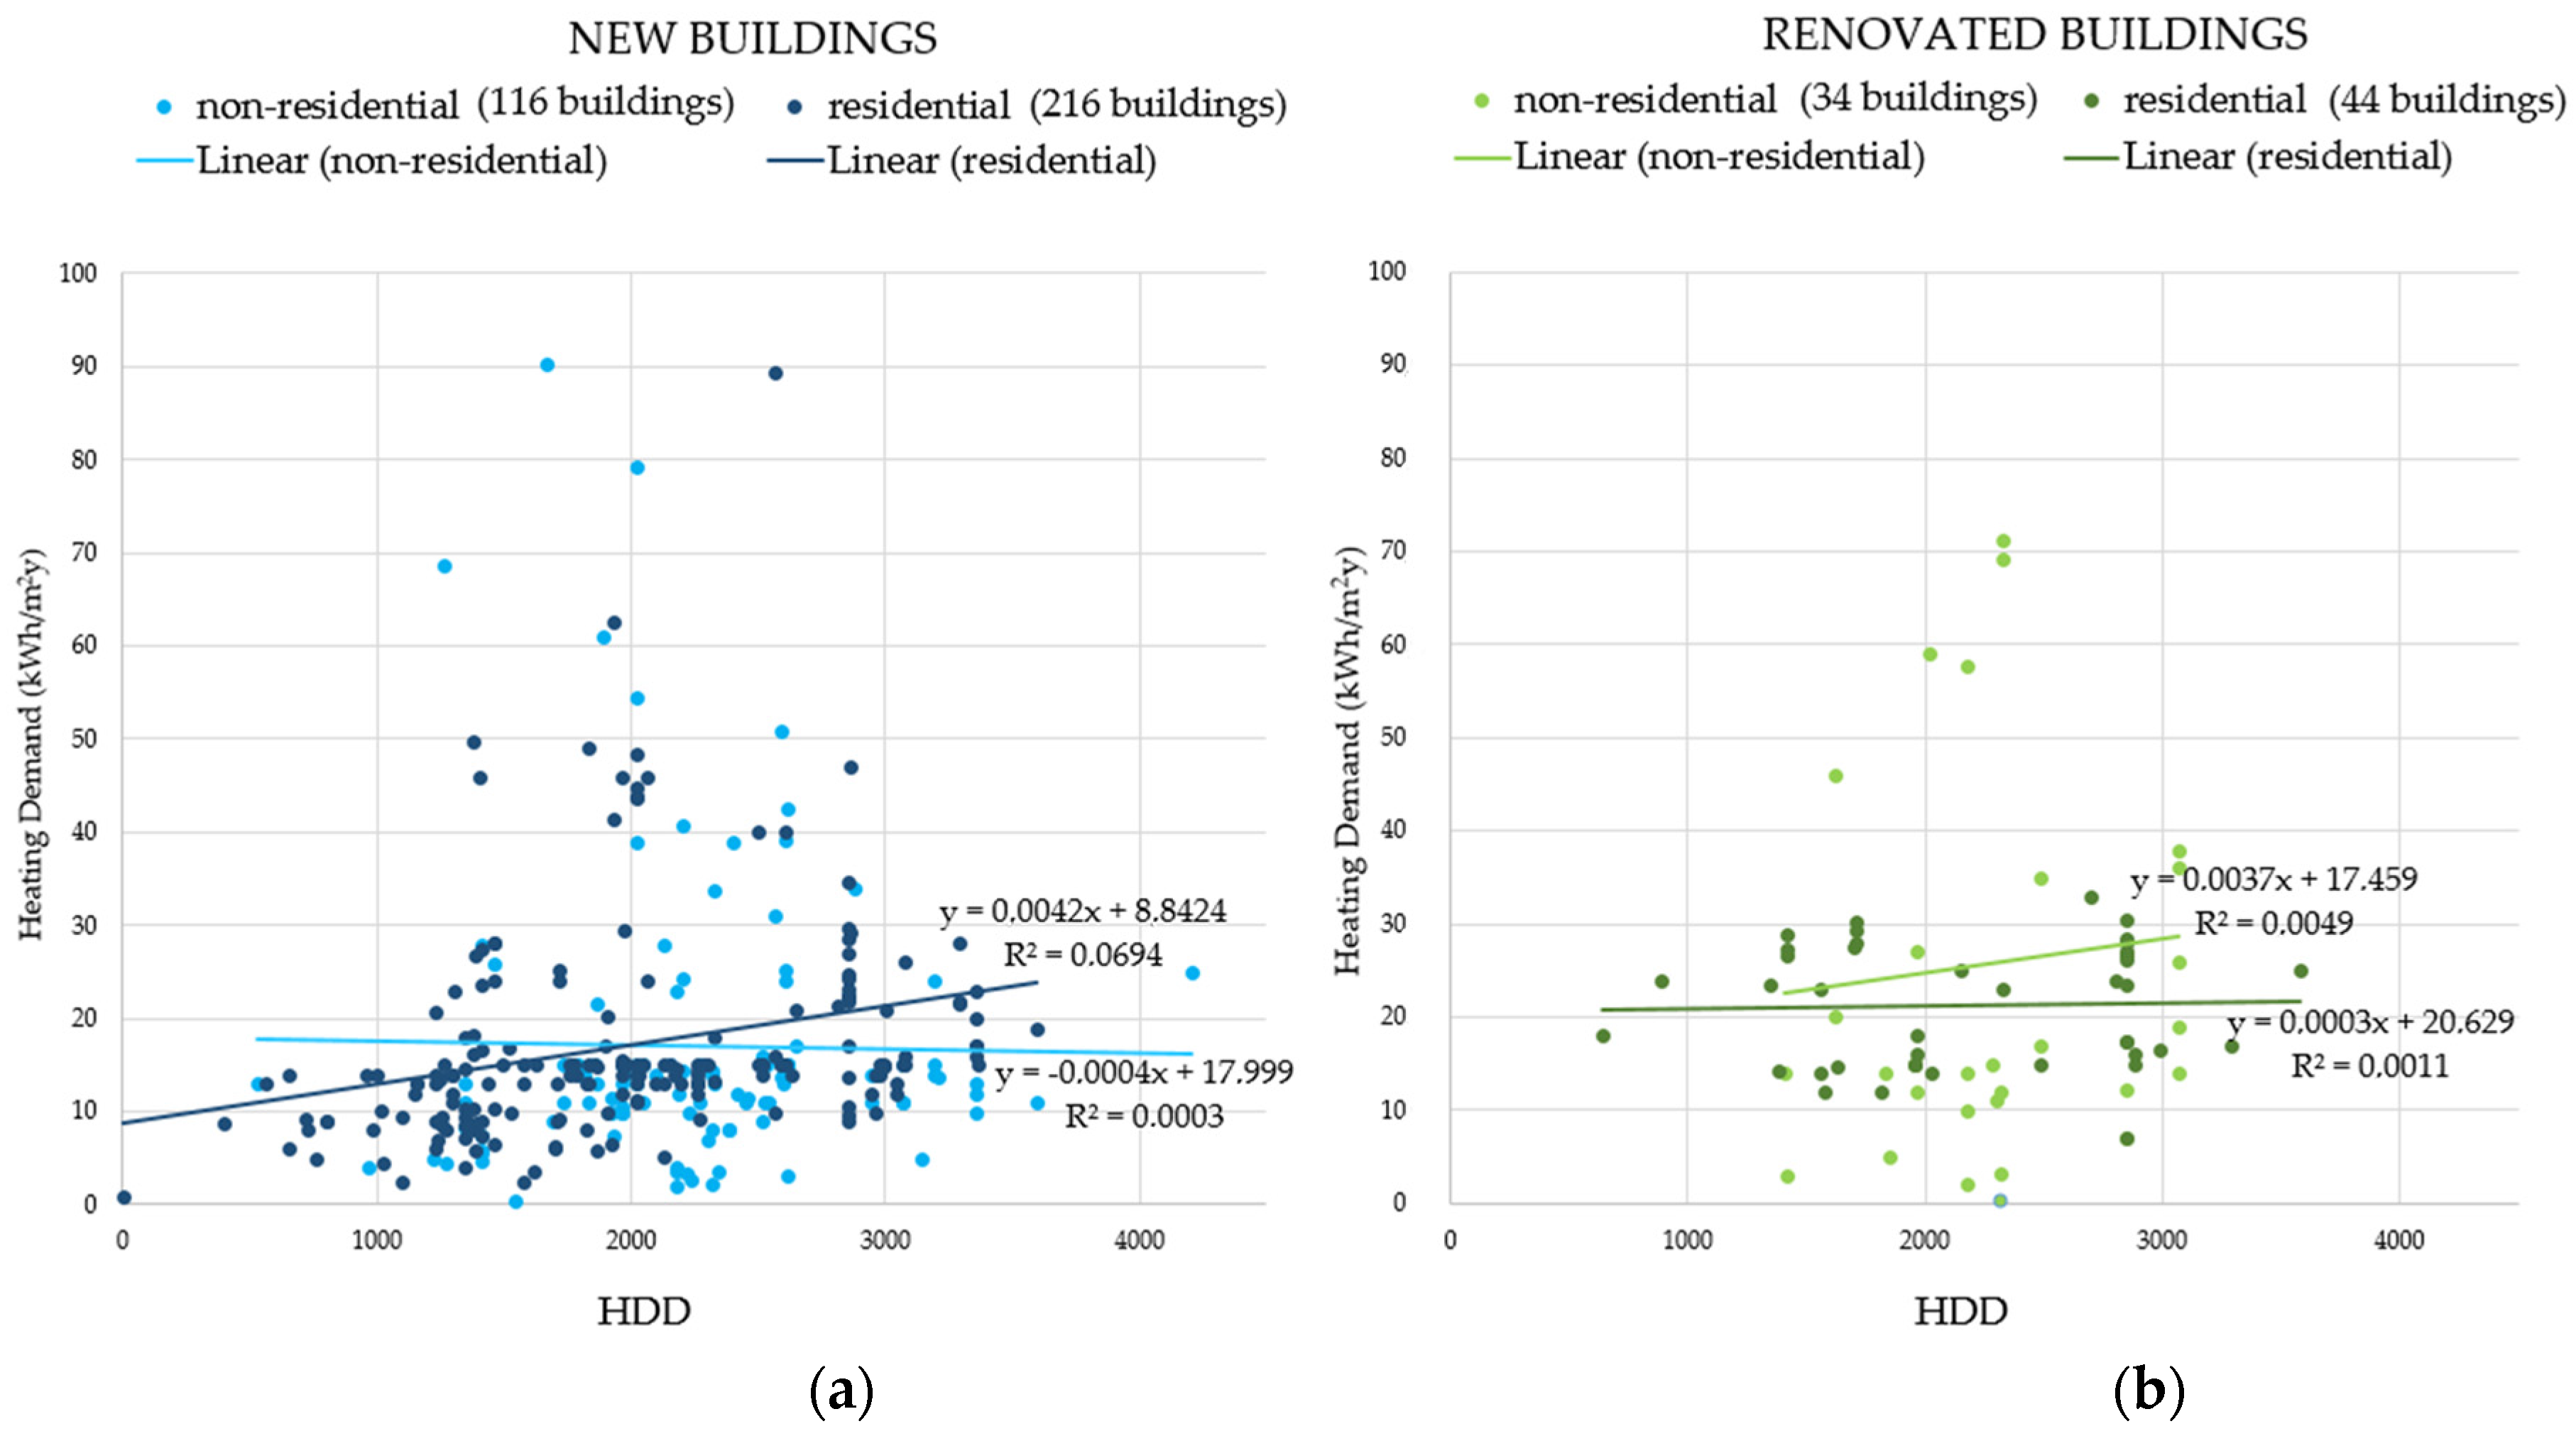
The analysis on the nZEBs “heating demand” were made according their HDD and in relation to the use of the buildings and construction typology, as shown in
Figure 3.
It can be pointed out that the coefficient of determination of the regression (R2) is very low in all cases (new or renovated and residential or non-residential buildings). Accordingly, there is no significant relation between the nZEB heating demand and HDD and the analyzed buildings present high performance levels despite the climate conditions. Furthermore, it could be deduced that the adoption of the energy efficiency technology is not strongly affected by the climate condition, with different levels of effort in design solutions. In fact, in the 93% of the buildings, the “heating demand” is lower than 40 kWh/(m2·year).
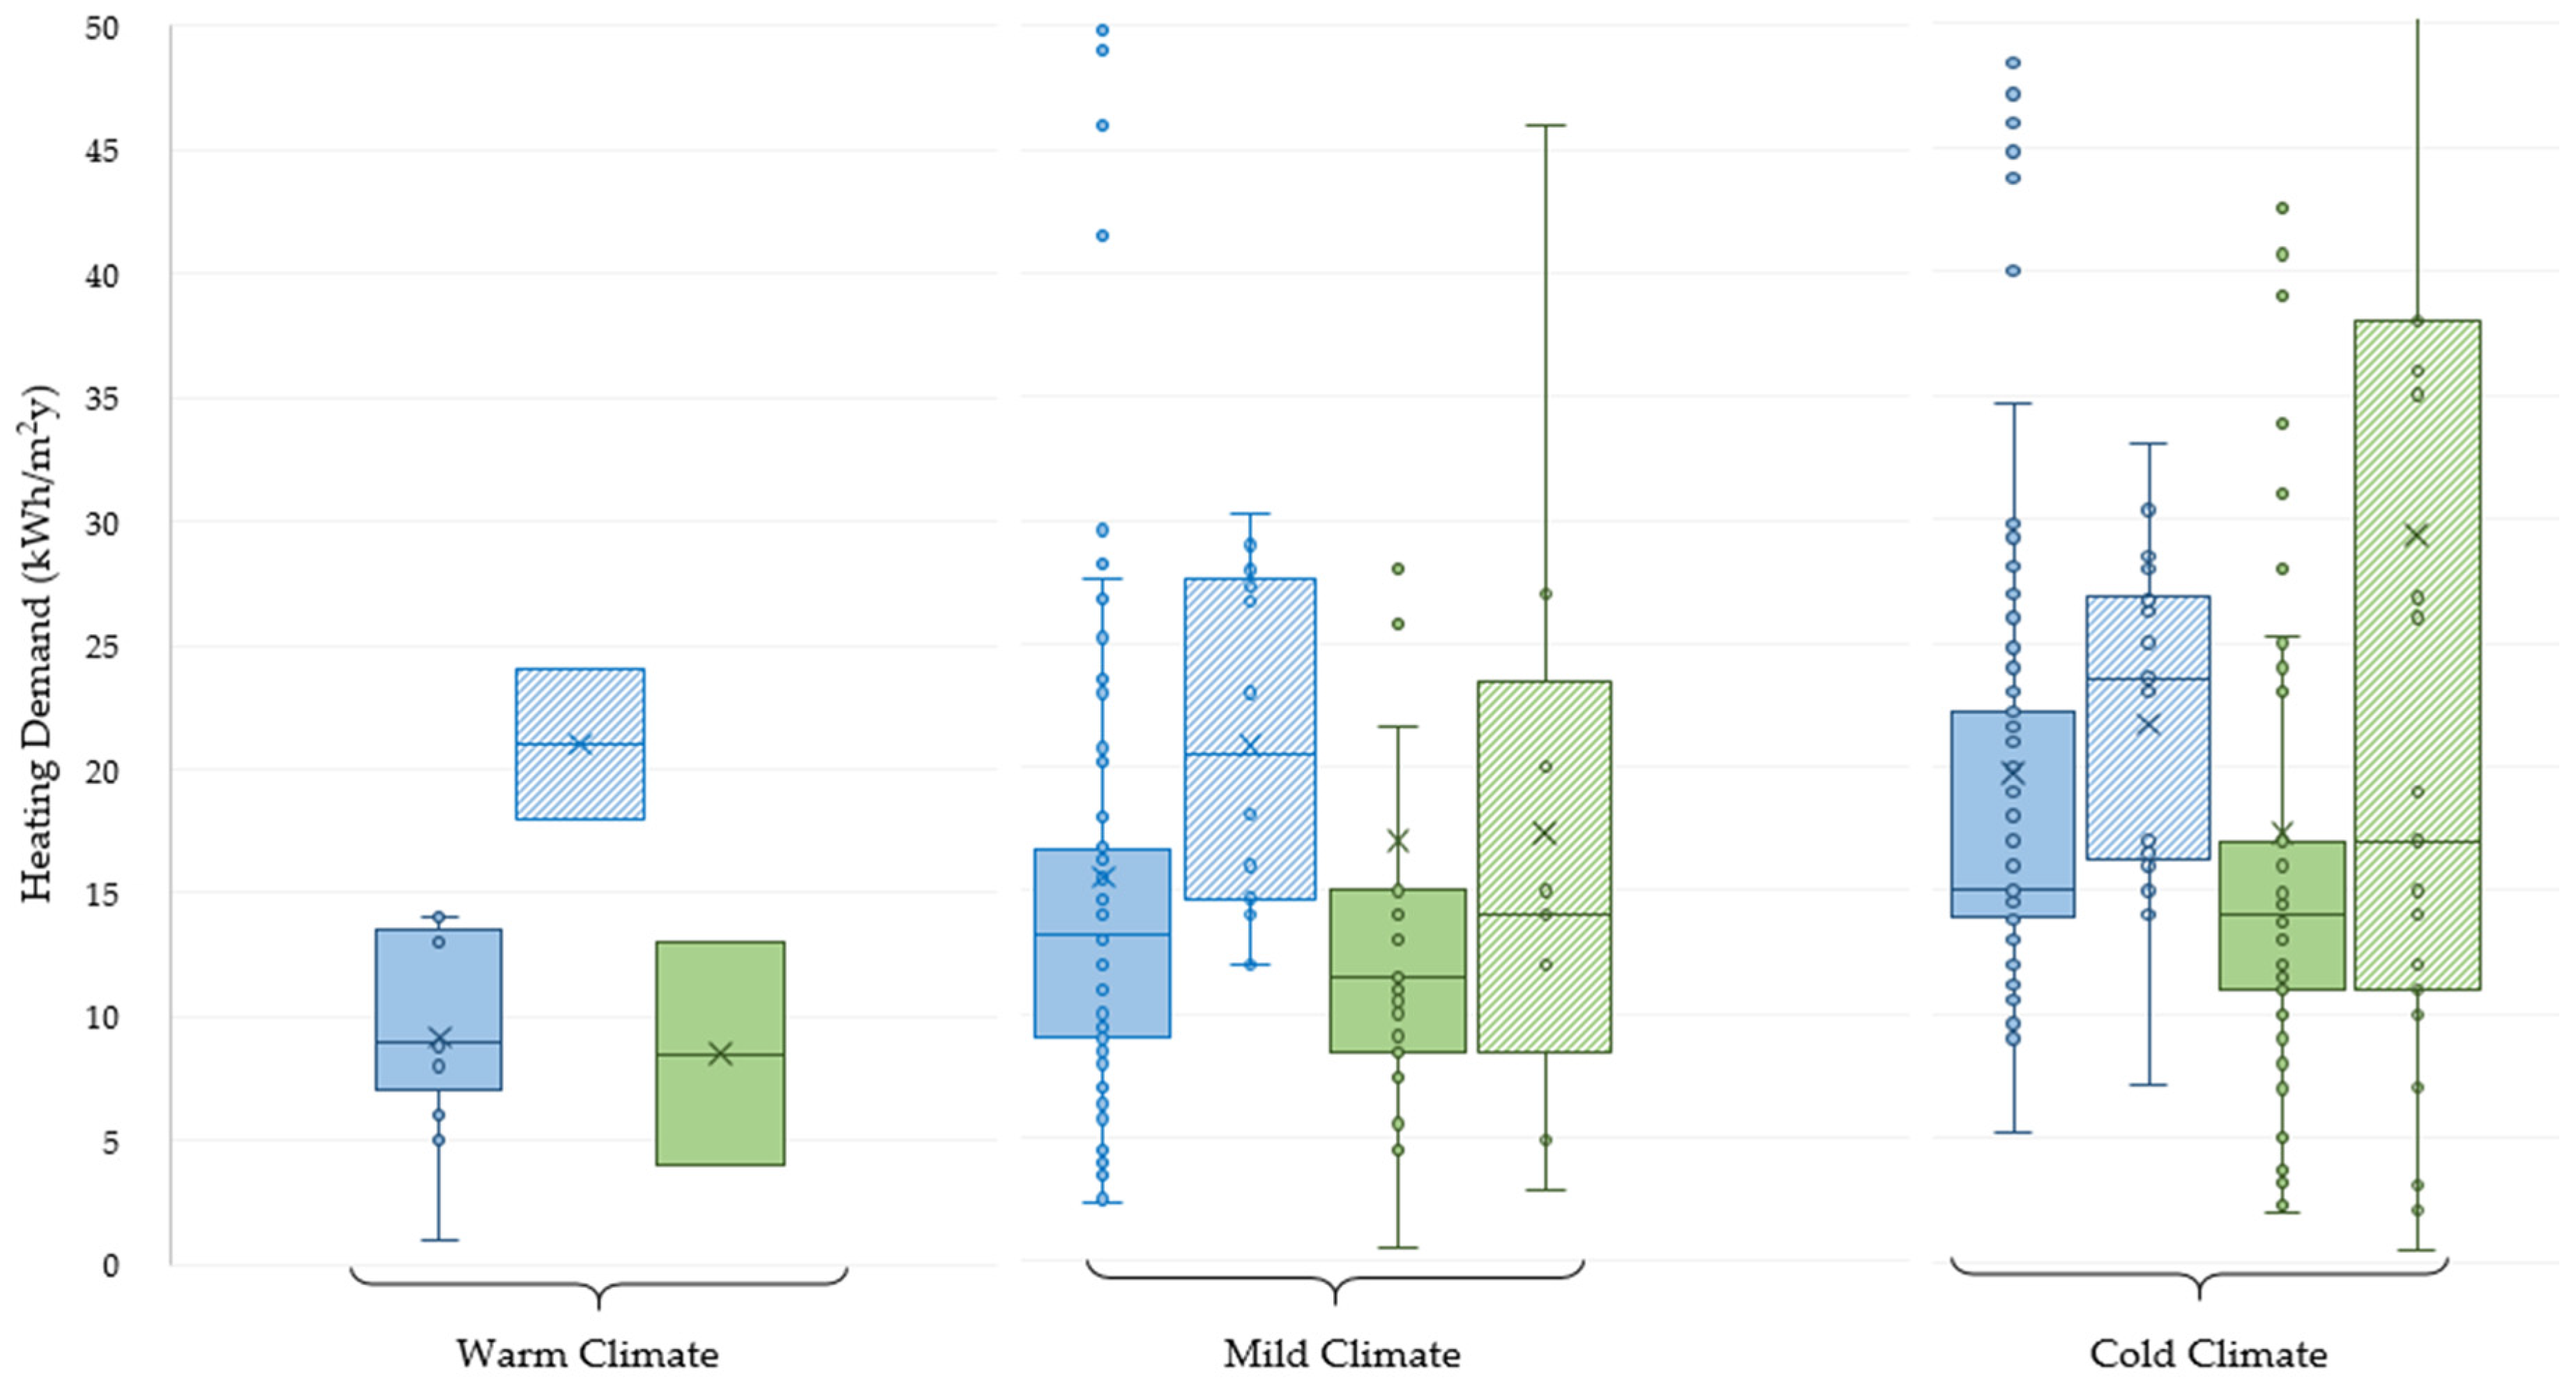
Going into more detail for each climatic zone, the boxplots of
Figure 4 show the median value of heating demand of nZEBs according to use of the building (residential and non-residential) and type of construction (new and renovated).
It can be noticed that the median values of the heating demand tend to grow according to the HDD, for all the building typologies and uses, as shown in
Figure 4. Nonetheless, in each climate rigidity, the interquartile ranges (i.e., central rectangle that includes the 50% of the “heating demand” values) of new buildings result in being more compact and lower than the renovated ones. This outcome highlights the difficult implementation in existing buildings of energy efficient measures like installation of insulating materials, improvement of the airtightness, and reduction of thermal bridges.
4.2. Features of the Thermal Envelope
The history of the architecture shows that, until the 19th century, building materials and features were strictly connected to the context, typical construction techniques and climate conditions.
The analysis of the European building stock characteristics (e.g., dimensional, technological, functional, etc.), performed within EU FP7-iNSPiRE project (FP7-iNSPiRE project:
www.inspirefp7.eu) [
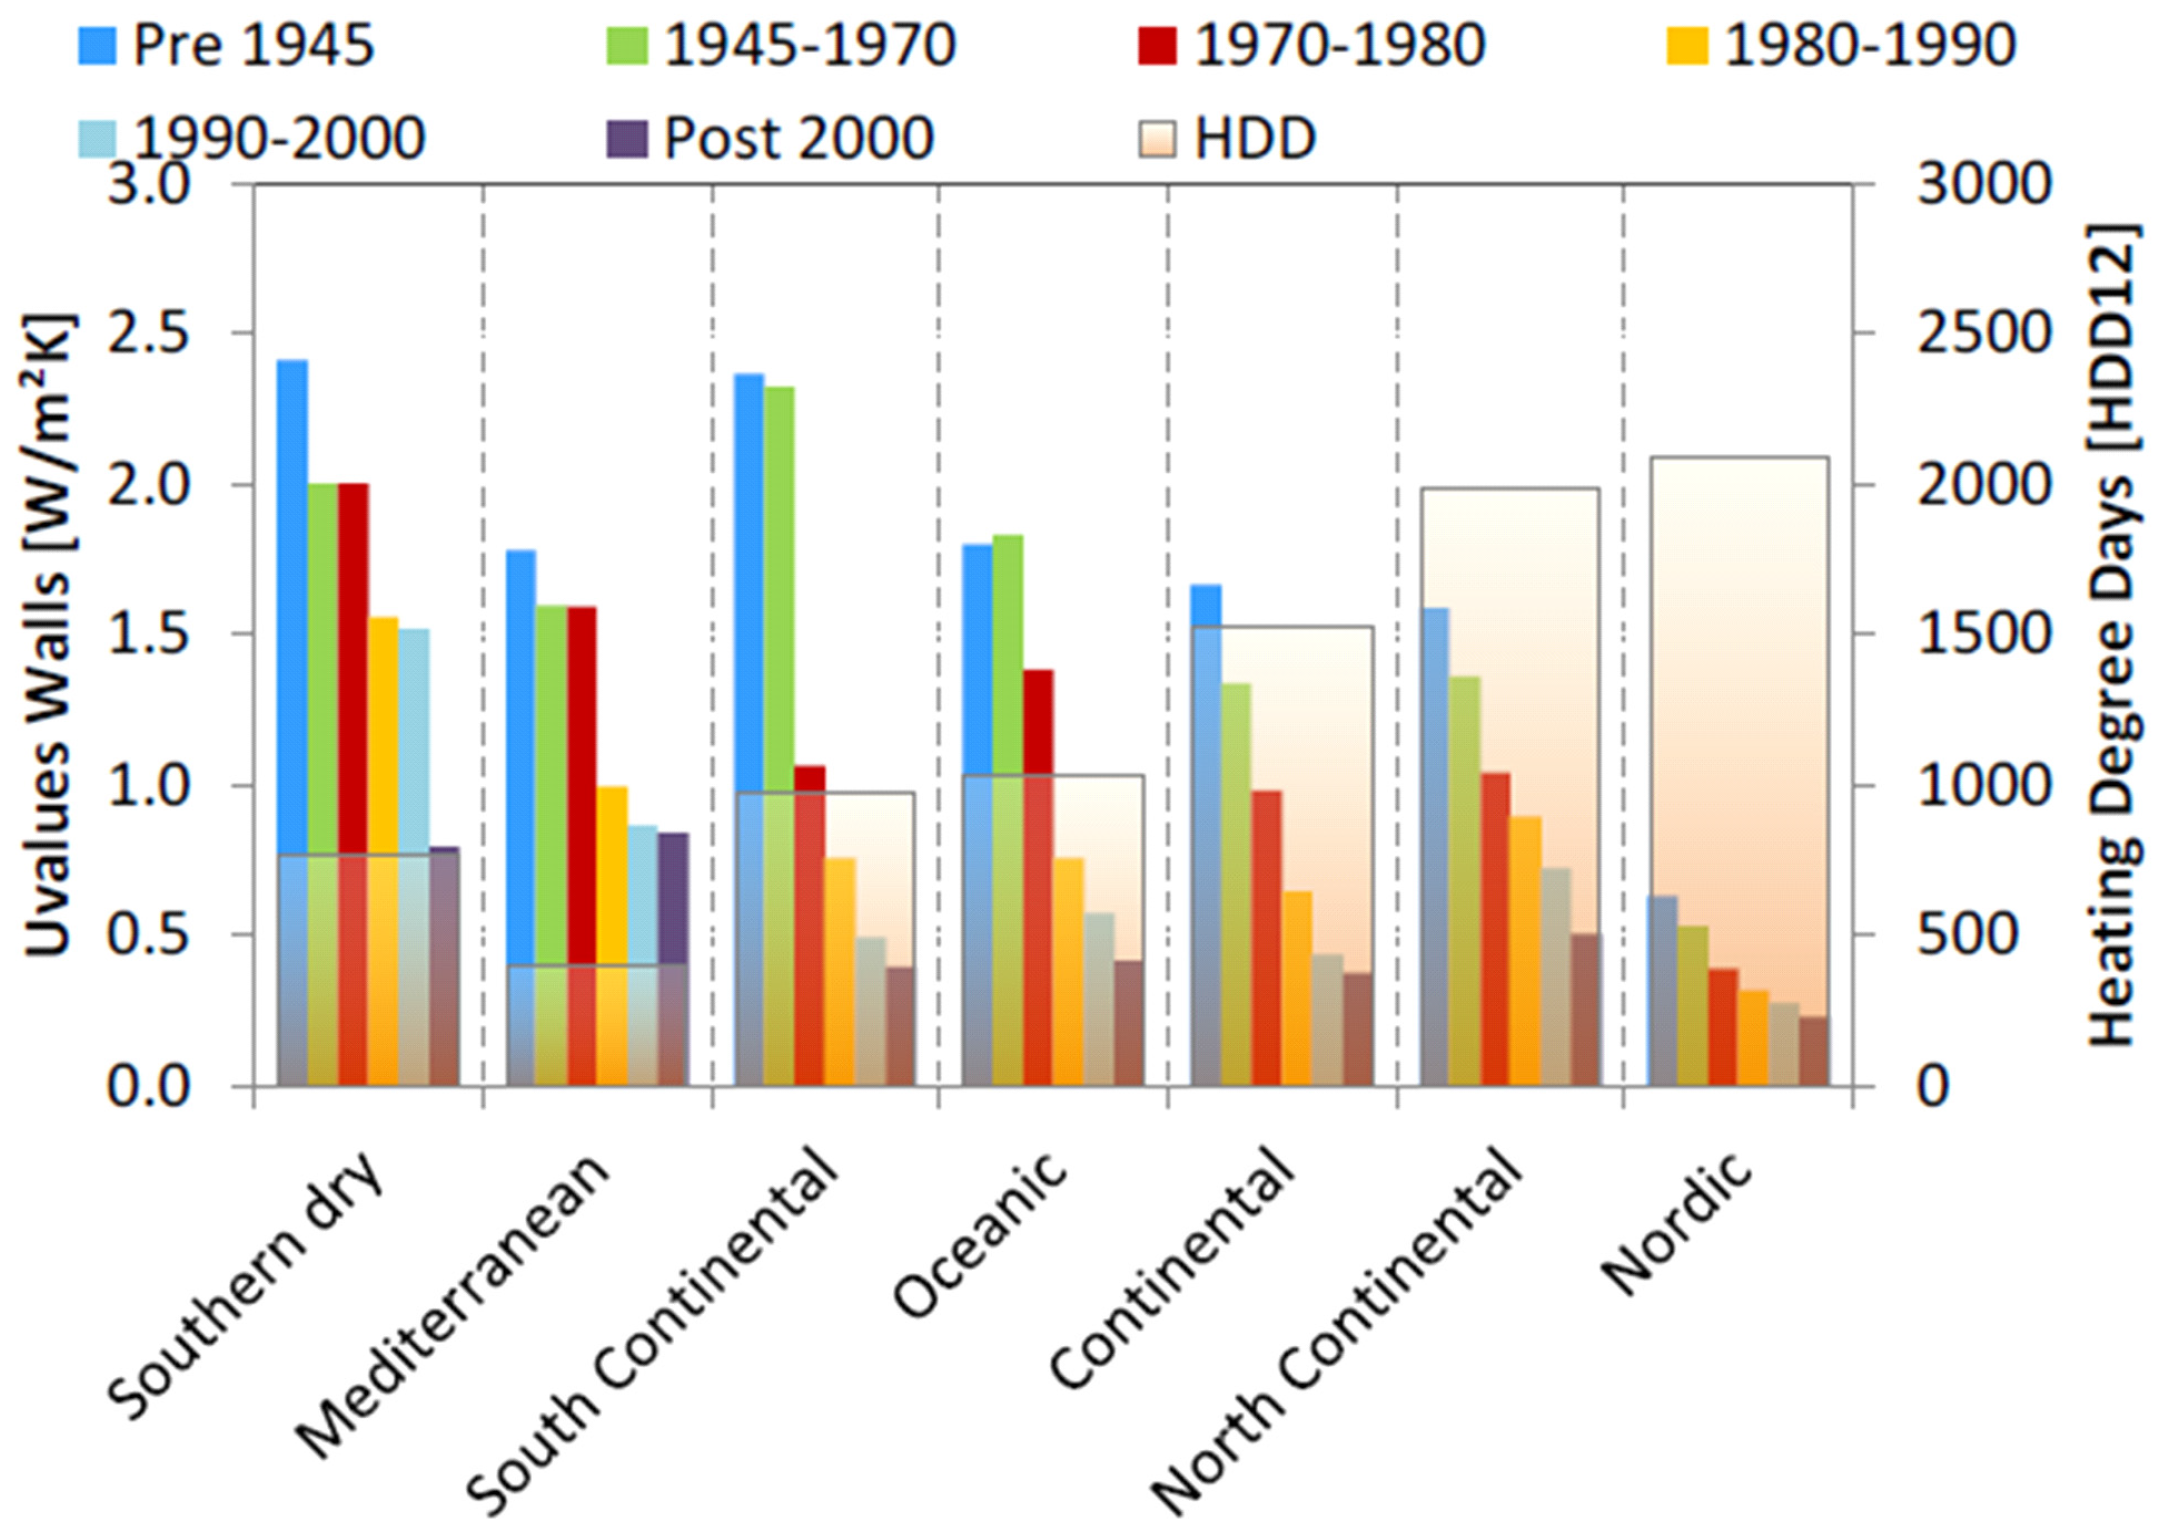
22], highlighted that the thermal envelope features of existing buildings change according to the rigidity of the climate. In particular, the HDD strongly affect the envelope thermal transmittance: buildings located in cold winters (high value of HDD) present reduced envelope “U-value” in both opaque and transparent parts, as shown in
Figure 5.
On the contrary, as shown in
Figure 6,
Figure 7 and
Figure 8, the thermal transmittance of the envelope components in nZEBs result in being very similar in different climate zones. In addition, no remarkable variations between new or renovated and residential or non-residential buildings can be highlighted. This result is due to the minimum requirements set by national legislation, which is usually around 0.30 W/(m
2·K).
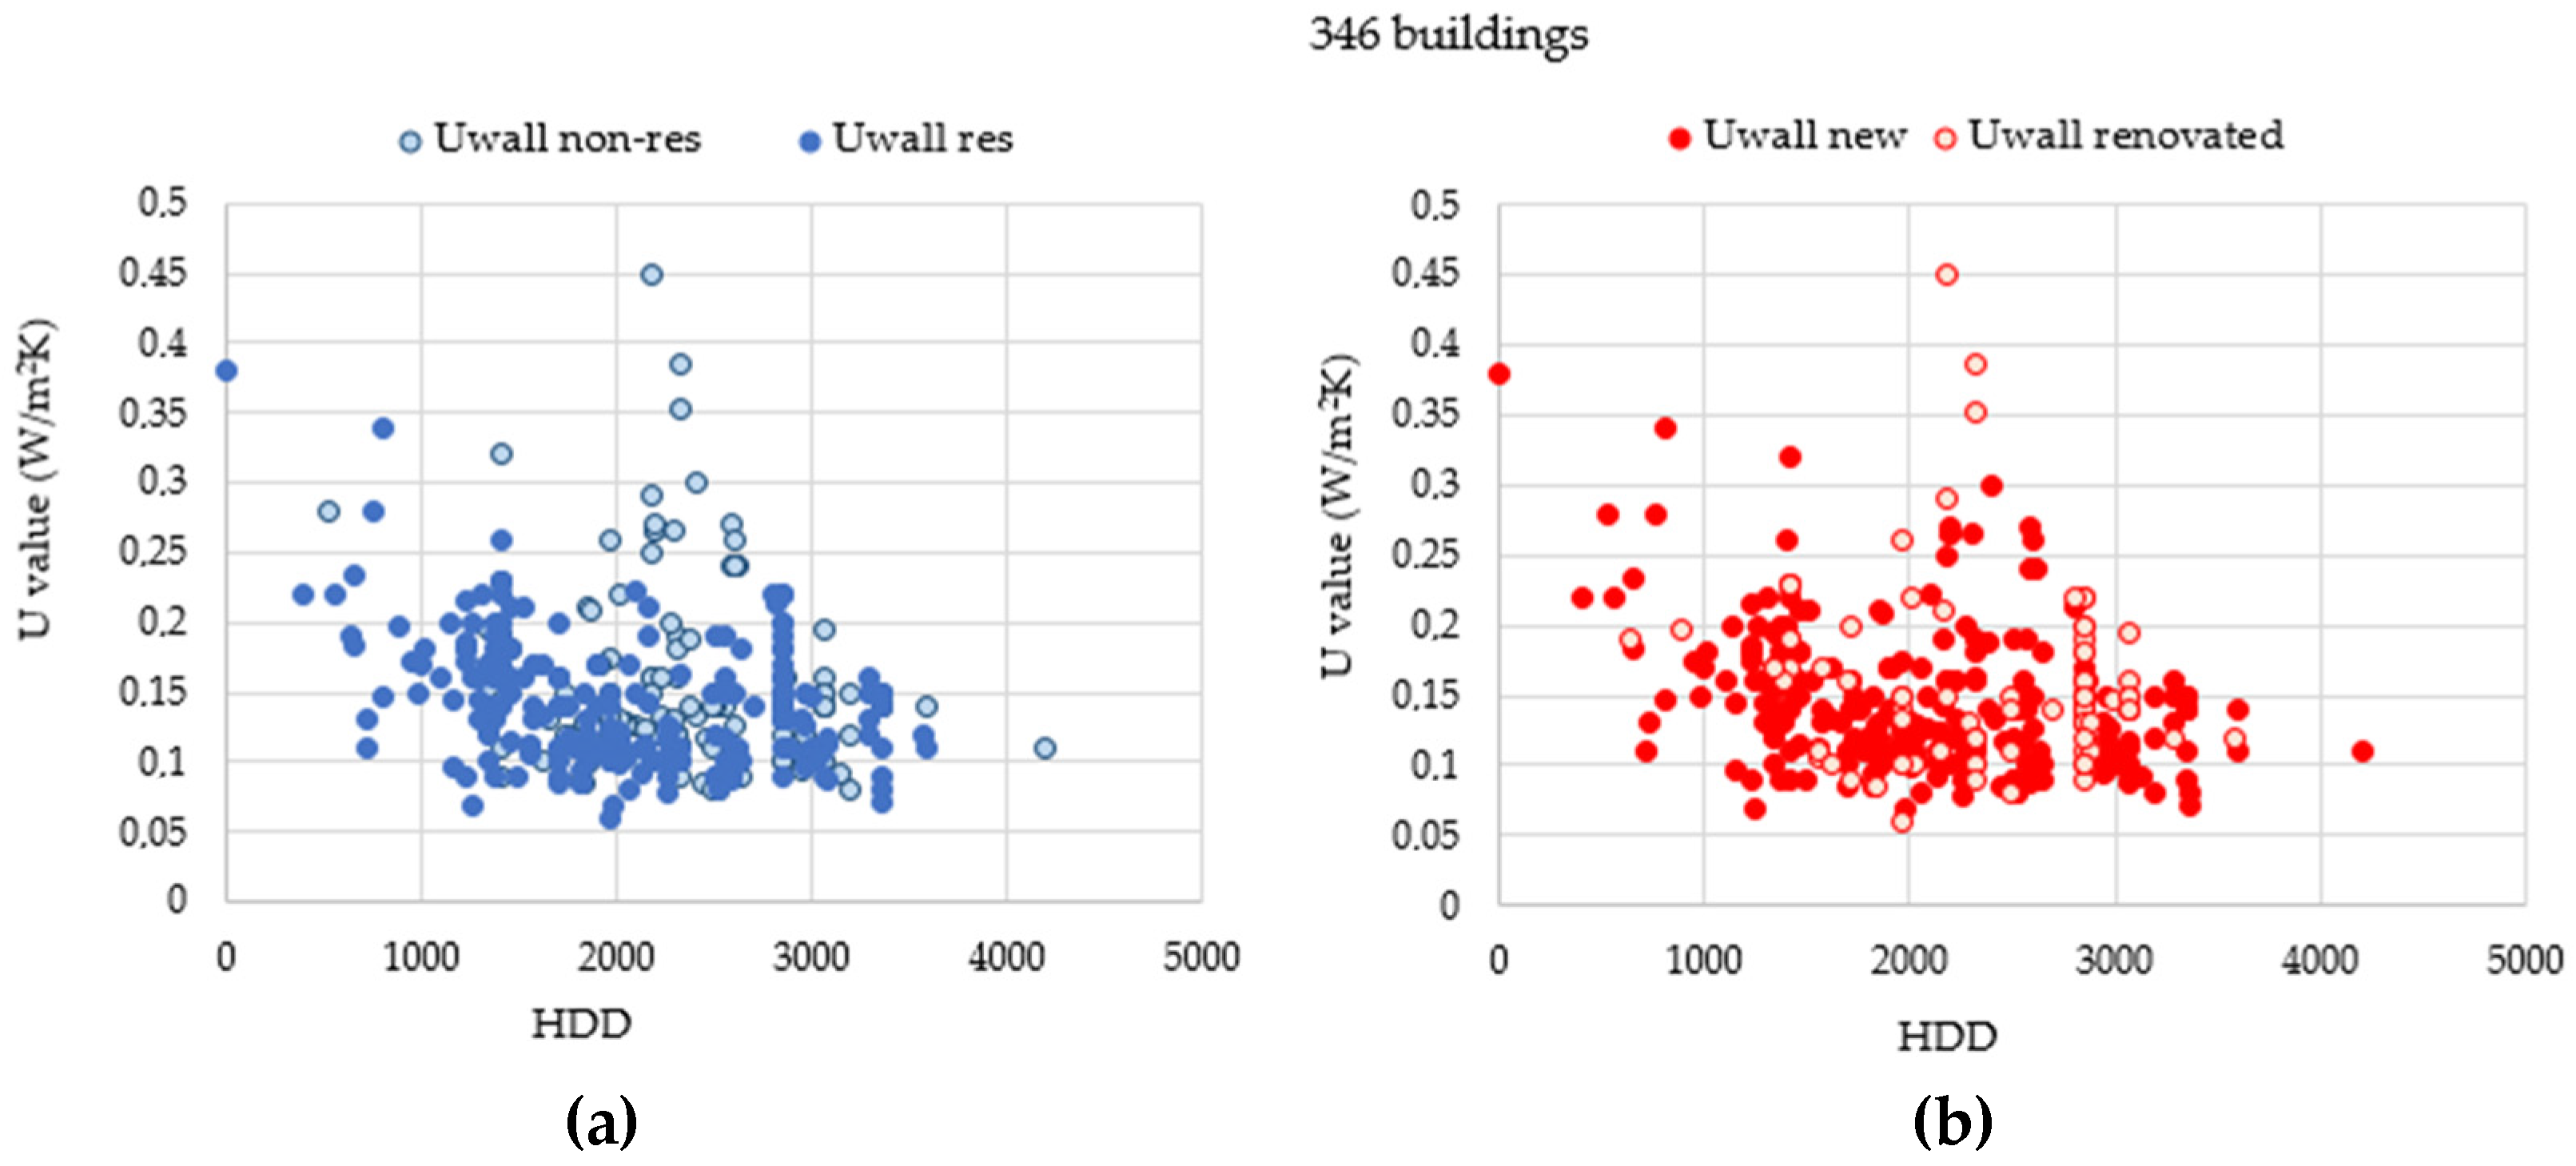
Figure 6 shows the average nZEB thermal transmittance of the external envelope according to HDD:
Figure 6a reports U-values highlighting the use of the building (residential or non-residential), while
Figure 6b highlights the kind of intervention (new or renovated building). As both graphics show, no significant differences can be observed between the type of use and the type of the intervention.
In general, the medium values of wall thermal transmittance are always very low: between 0.12 W/(m2·K) in places with high HDD to 0.20 W/(m2·K) in zones with low HDD. In some cases, the thermal transmittance of external walls are higher than 0.35 W/(m2·K), most of all in buildings located in ‘warm climates’ (HDD < 1000), where the minimum requirements for U-values are less restrictive. Higher wall thermal transmittance values have been observed in renovated historic buildings or in buildings with a particular interest located in the three climate zones, where the envelope performance improvements, (i.e., installation of insulating materials), are limited due to the conservation constraints.
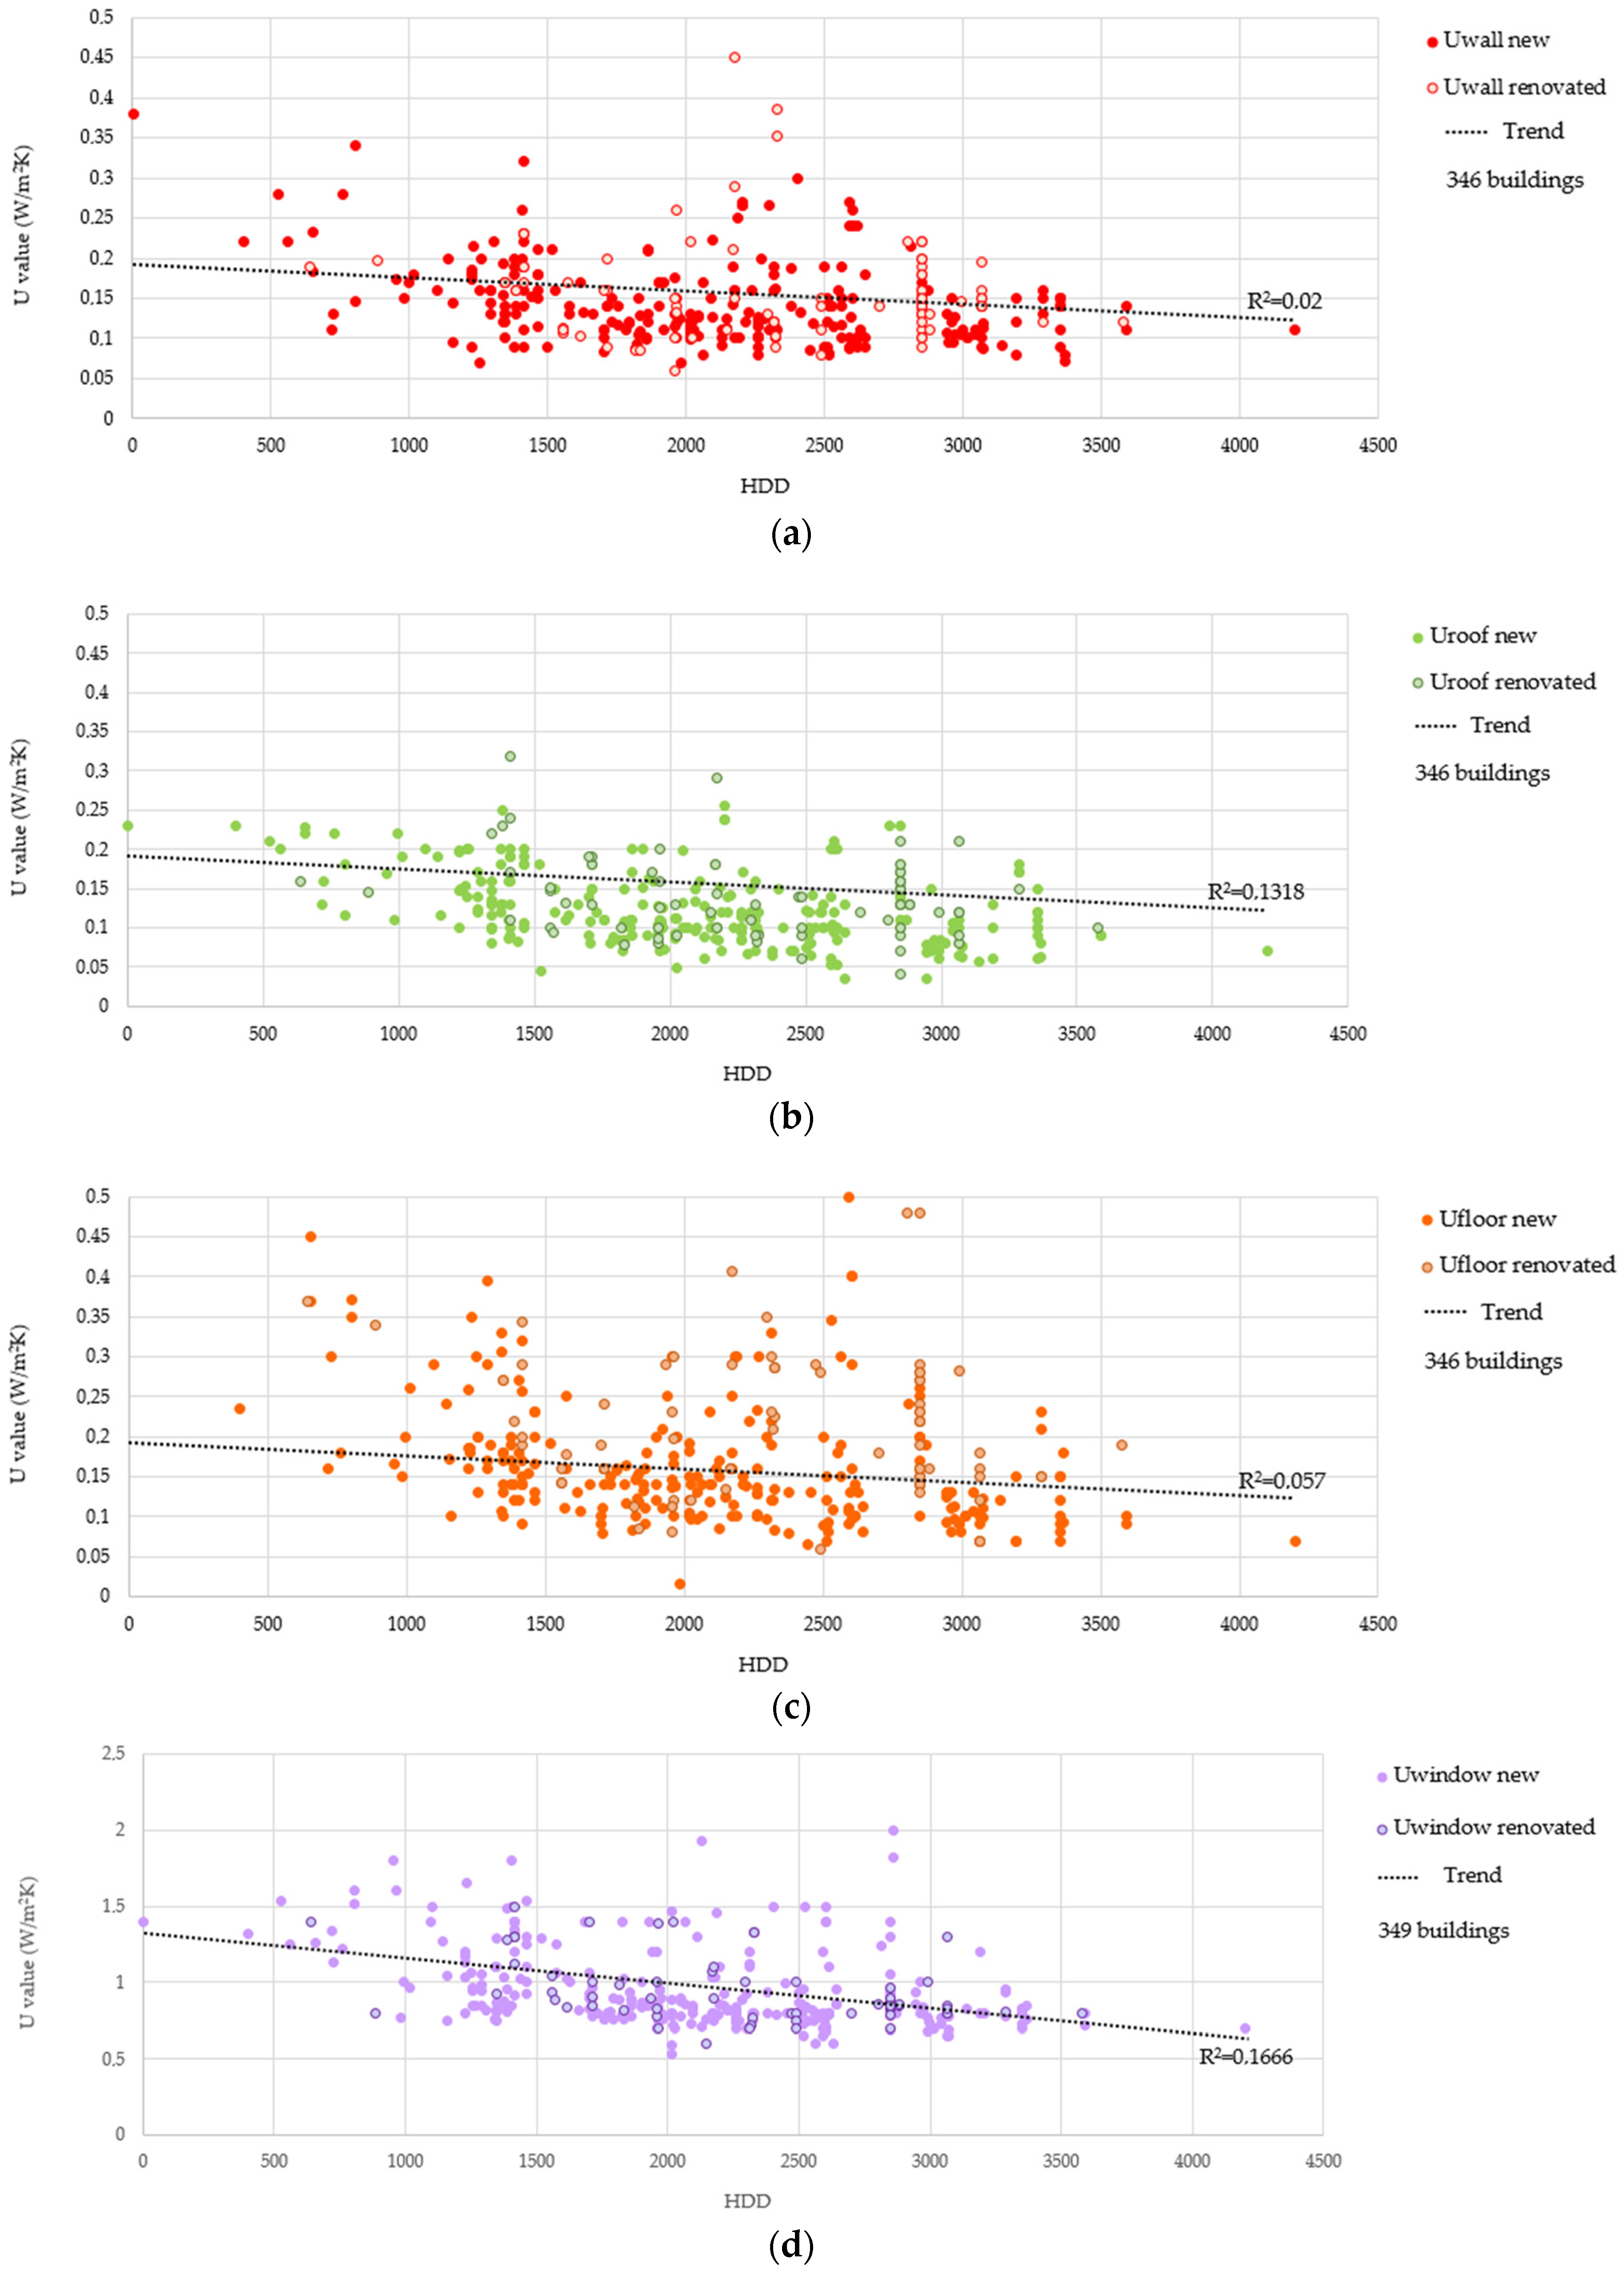
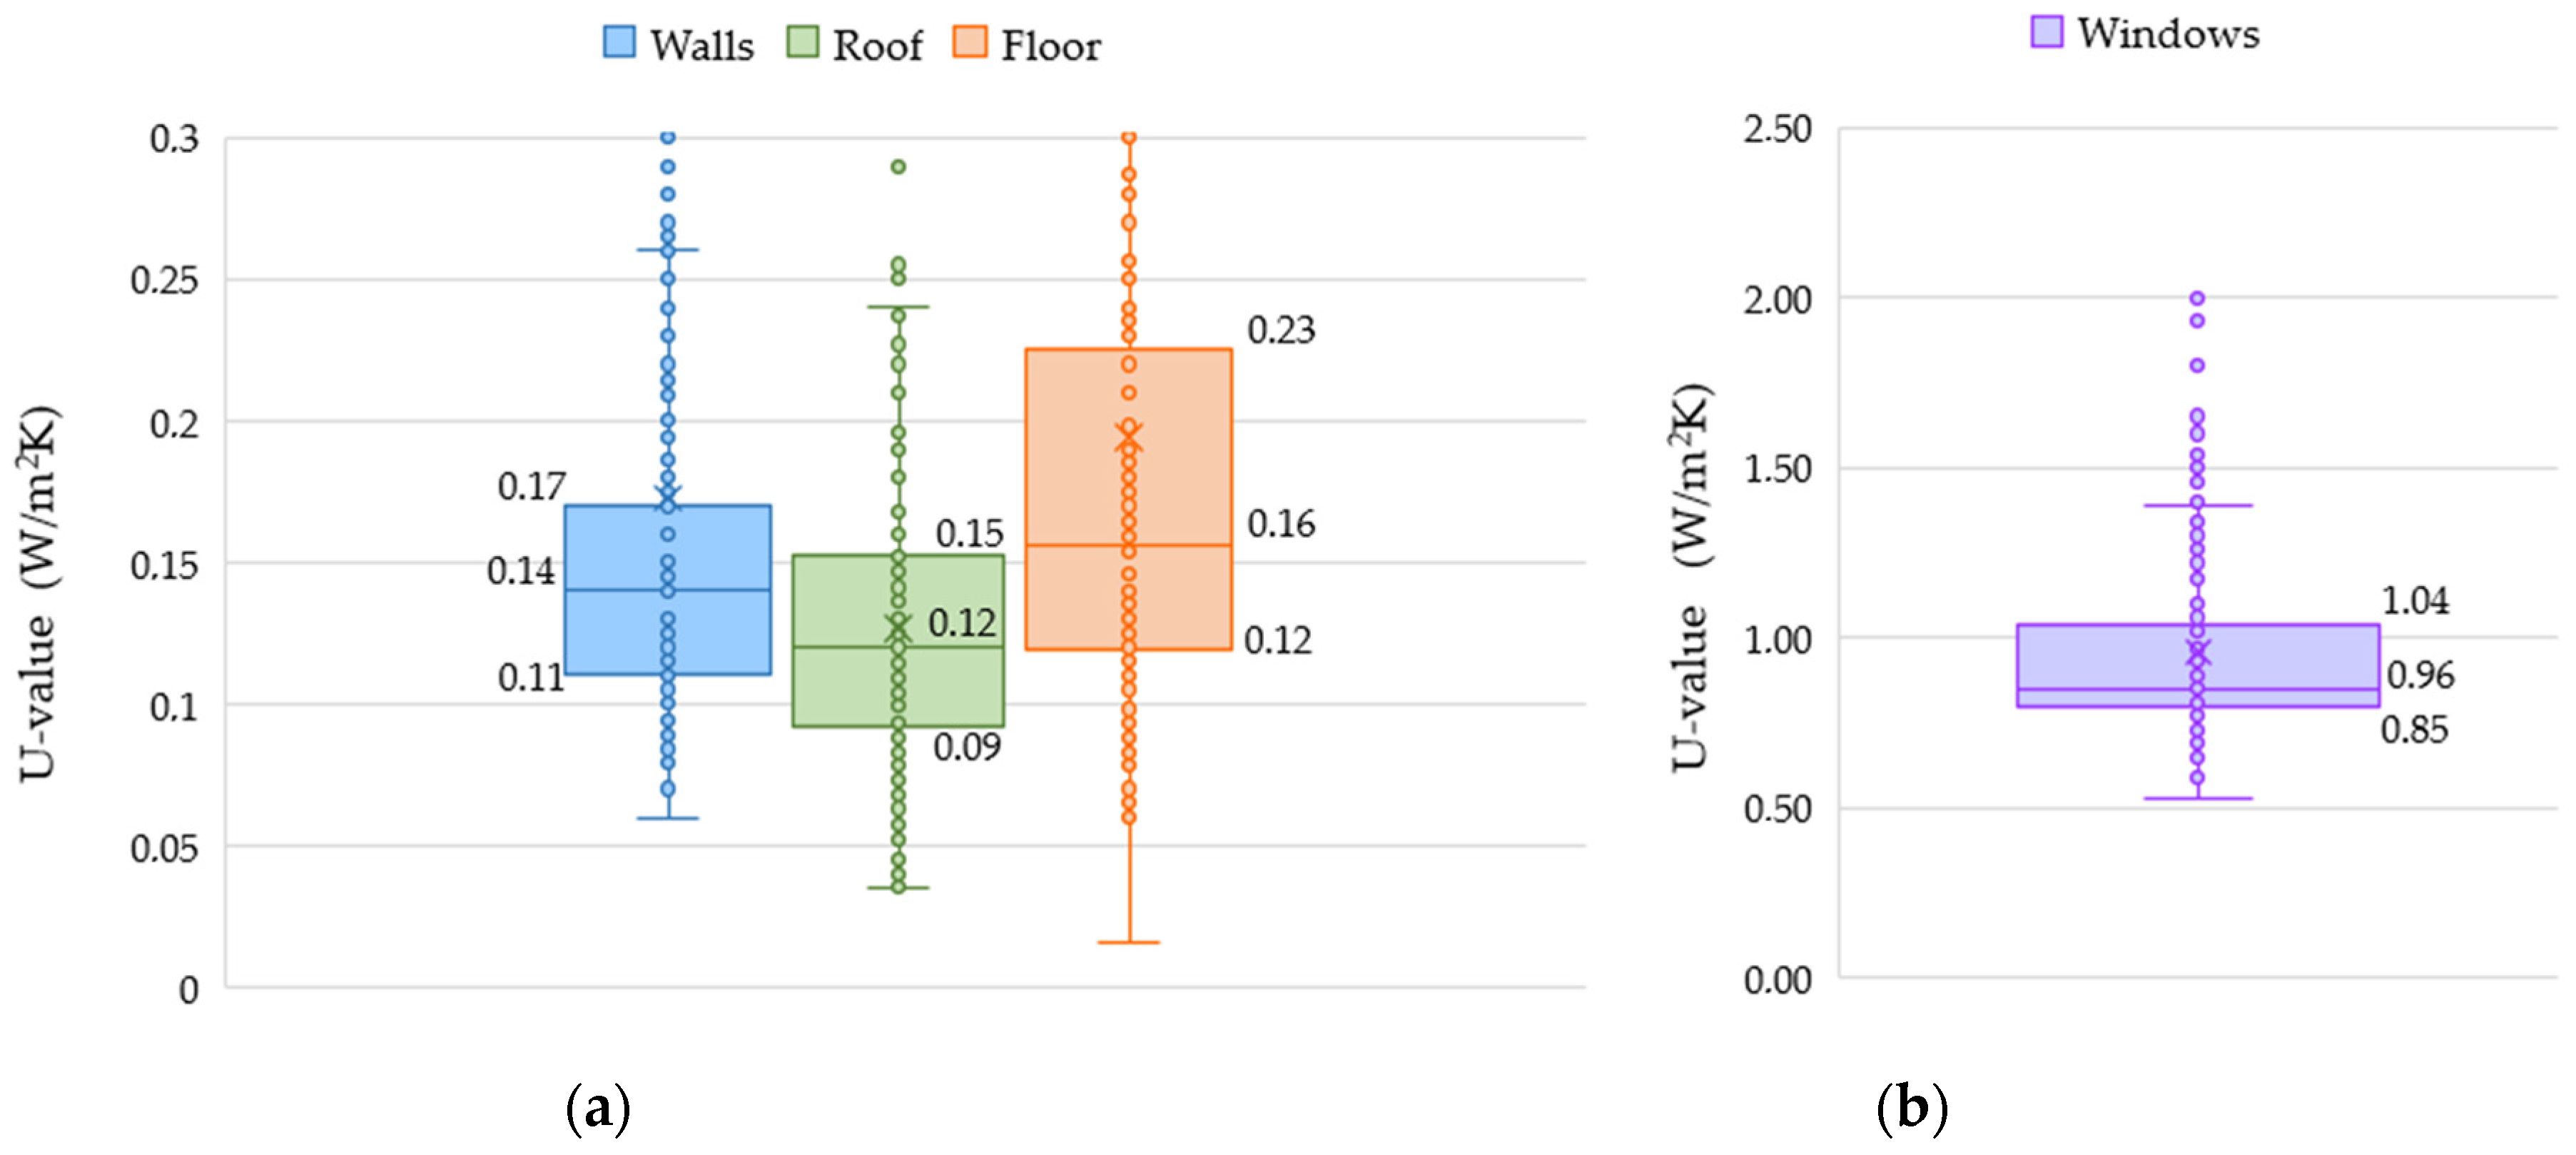
A similar analysis was carried out for all the building components (i.e., wall, roof, floor, and windows), as shown in
Figure 7.
The breakdown for the building elements confirms the general trend identified for the average envelope U-value; in fact, the performances of the building components present a weak correlation with the external climate conditions, as highlights by coefficient of determination (R
2). The box plots in
Figure 8 show the interquartile ranges (central rectangle) that include the 50% of the “U-values” of each building components. The interquartile ranges of opaque envelope (walls, roofs, and floors) result in being very compact, with median values ranging from 0.12 W/(m
2·K) to 0.16 W/(m
2·K):
Walls between 0.11 W/(m2·K) and 0.17 W/(m2·K) (median UW-value at 0.14 W/(m2·K));
Roofs between 0.09 W/(m2·K) and 0.15 W/(m2·K) (median UR-value at 0.12 W/(m2·K));
Floors between 0.12 W/(m2·K) and 0.23 W/(m2·K) (median UF-value at 0.16 W/(m2·K));
Windows between 0.85 W/(m2·K) and 1.04 W/(m2·K) (median UWin-value at 0.96 W/(m2·K)).
This analysis confirms that he thermal transmittance of the nZEBs’ components is homogeneous across the three climatic zones.
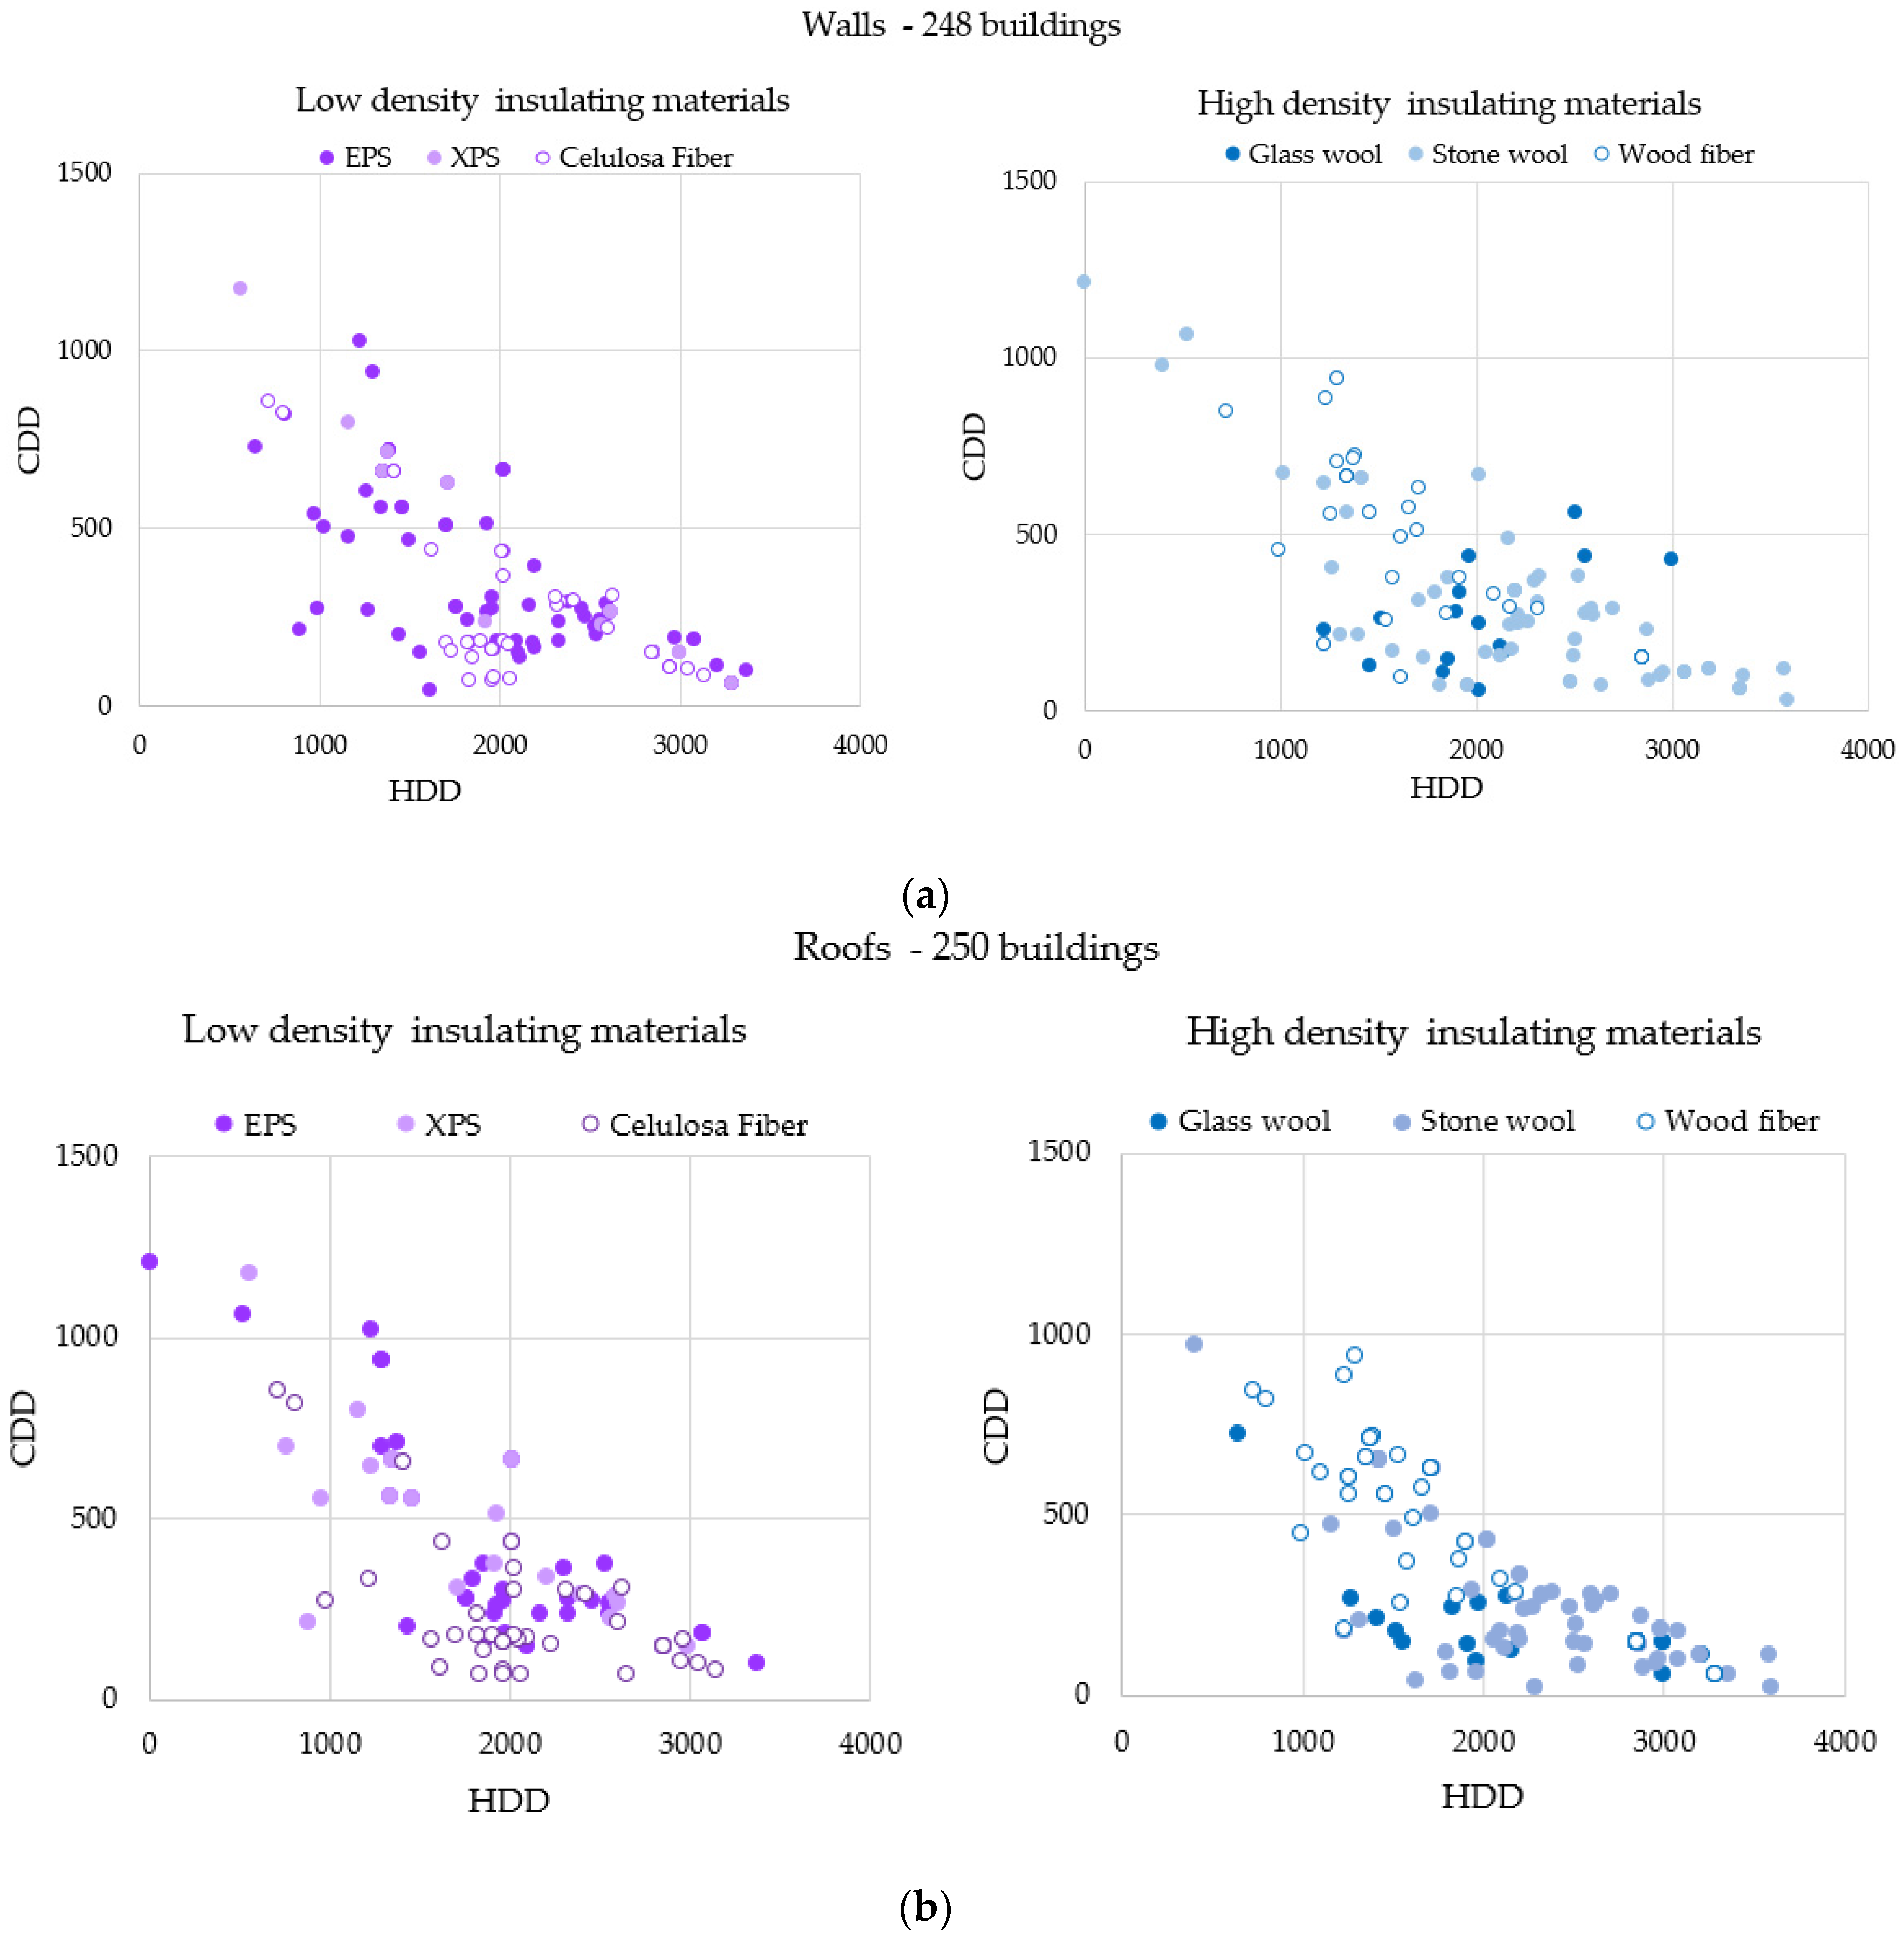
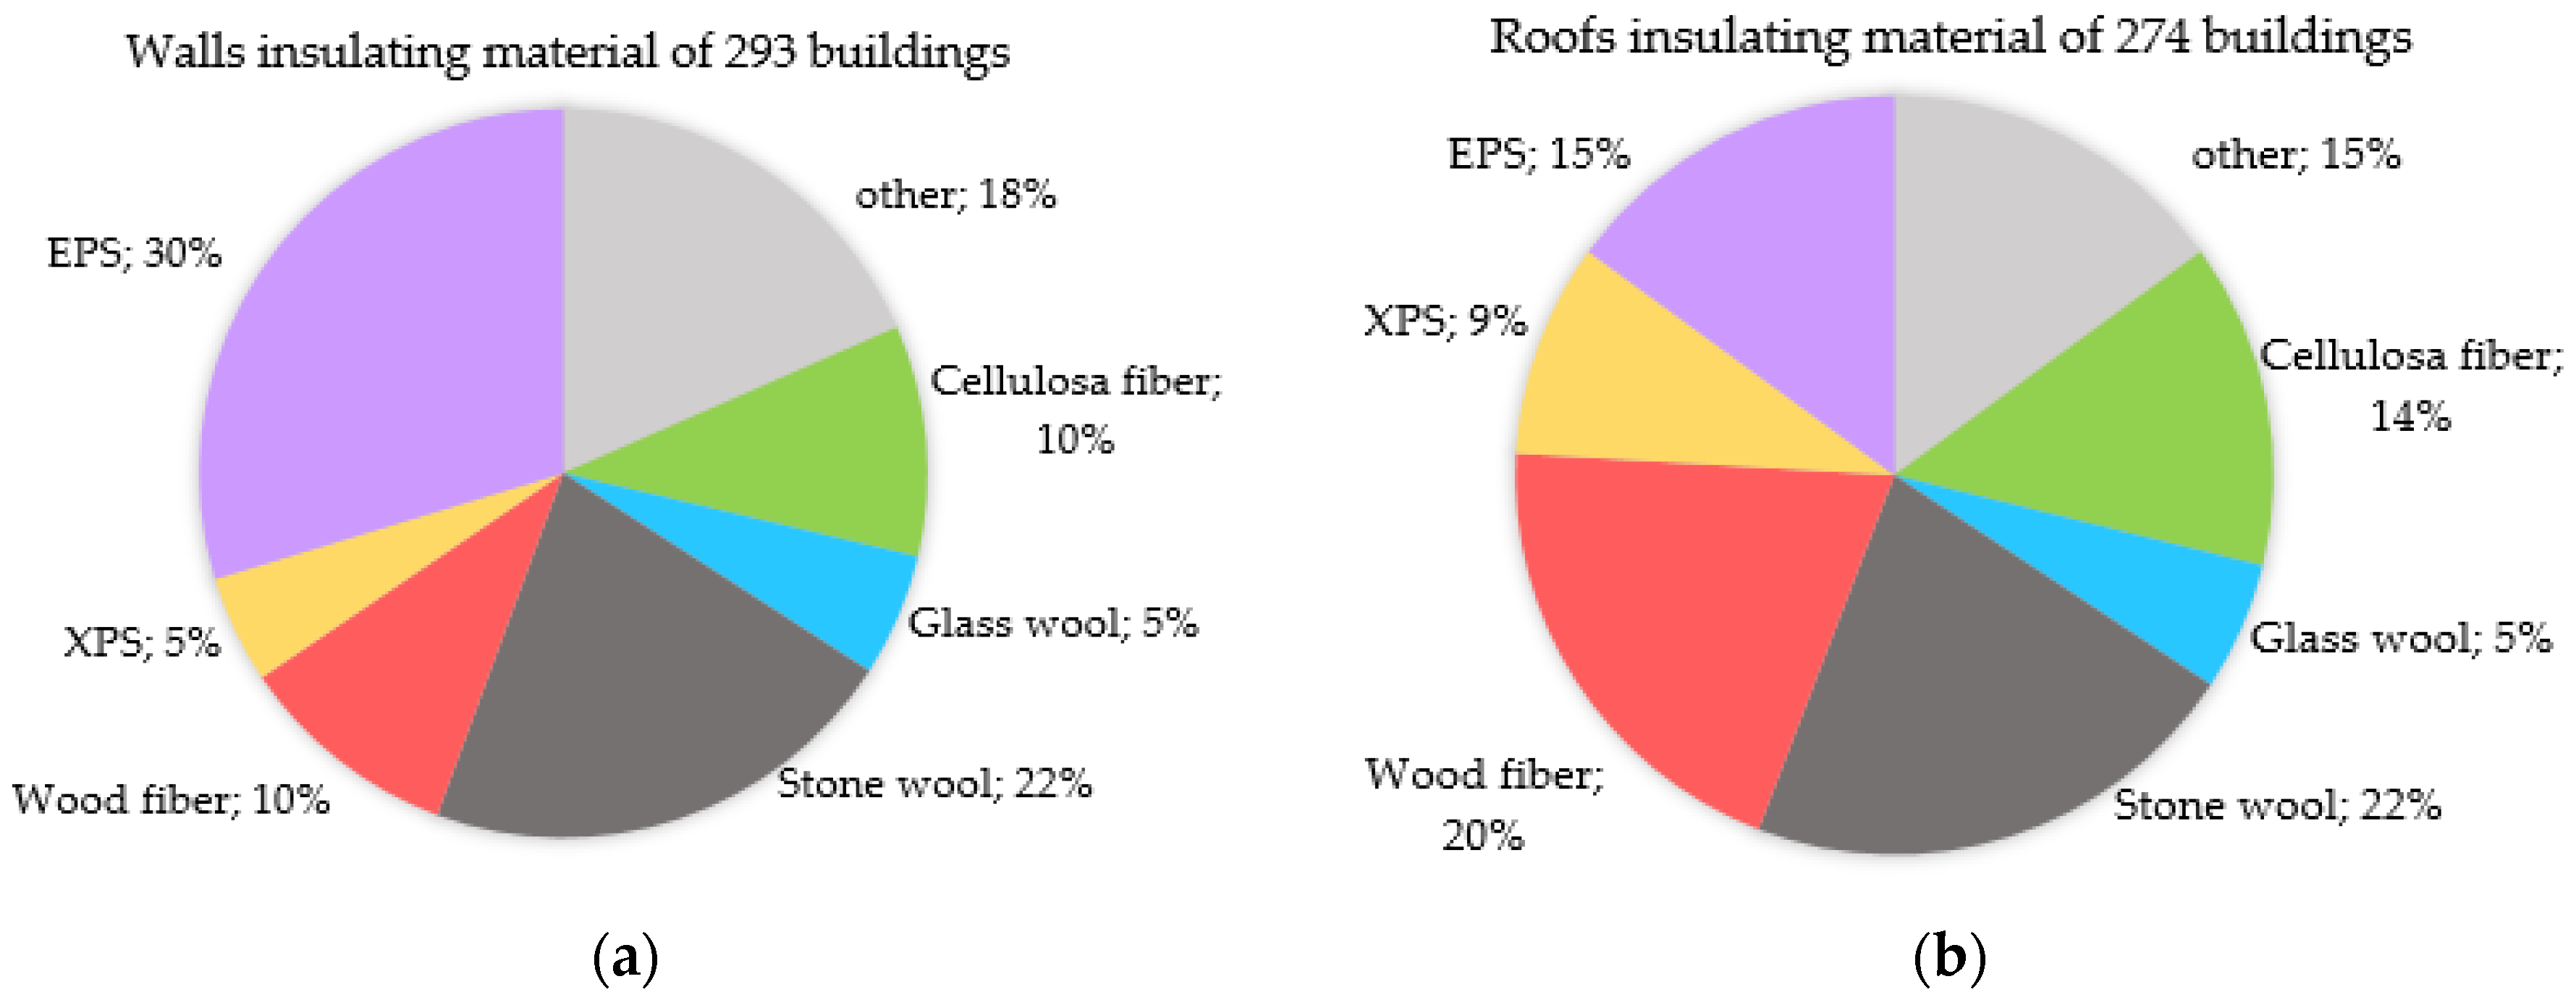
Figure 9 reports the share of insulating materials of walls and roofs. It is remarkable that “EPS” is the most common material used in walls, while “stone wool” is the preferred option for roofs.
It can be noticed that the “EPS” is used in 30% of the building for the wall insulation walls and only for the 15% for the roofs. On the contrary, the use of “wood fiber” for roof insulation increases around 10% in comparison to the wall application.
In this regard, insulating materials with higher thermal capacity offer better performance during the summer time, affecting positively the periodic thermal transmittance
Ymn (W/(m
2·K)) and thermal time shift (h) of the building envelope components. Although no information about these two parameters have been collected for the nZEB sample, we investigated which materials are used in different climatic conditions, according to the mass (kg) and density (kg/m
3) of the insulating materials.
Figure 10 shows the use of low and high density insulating materials in walls and roofs according to the HDD and CDD.
From a technical point of view, we expected a higher use of insulating materials with high thermal mass in warm climates [
23]. Nevertheless, the insulation adopted in both cold and warm zones results in being quite homogeneous in walls and roofs, and no significant influences of the climate conditions on the insulation density can be observed. It is important to point out that the building envelopes are composed by various layers of different materials that play together a relevant role, and, in most of the cases, the higher contribution to the thermal inertia comes from massive layers (e.g., bricks, stone, etc.). Therefore, the choice of an insulating material seems to be more influenced by other factors than by their performance in the cooling period.
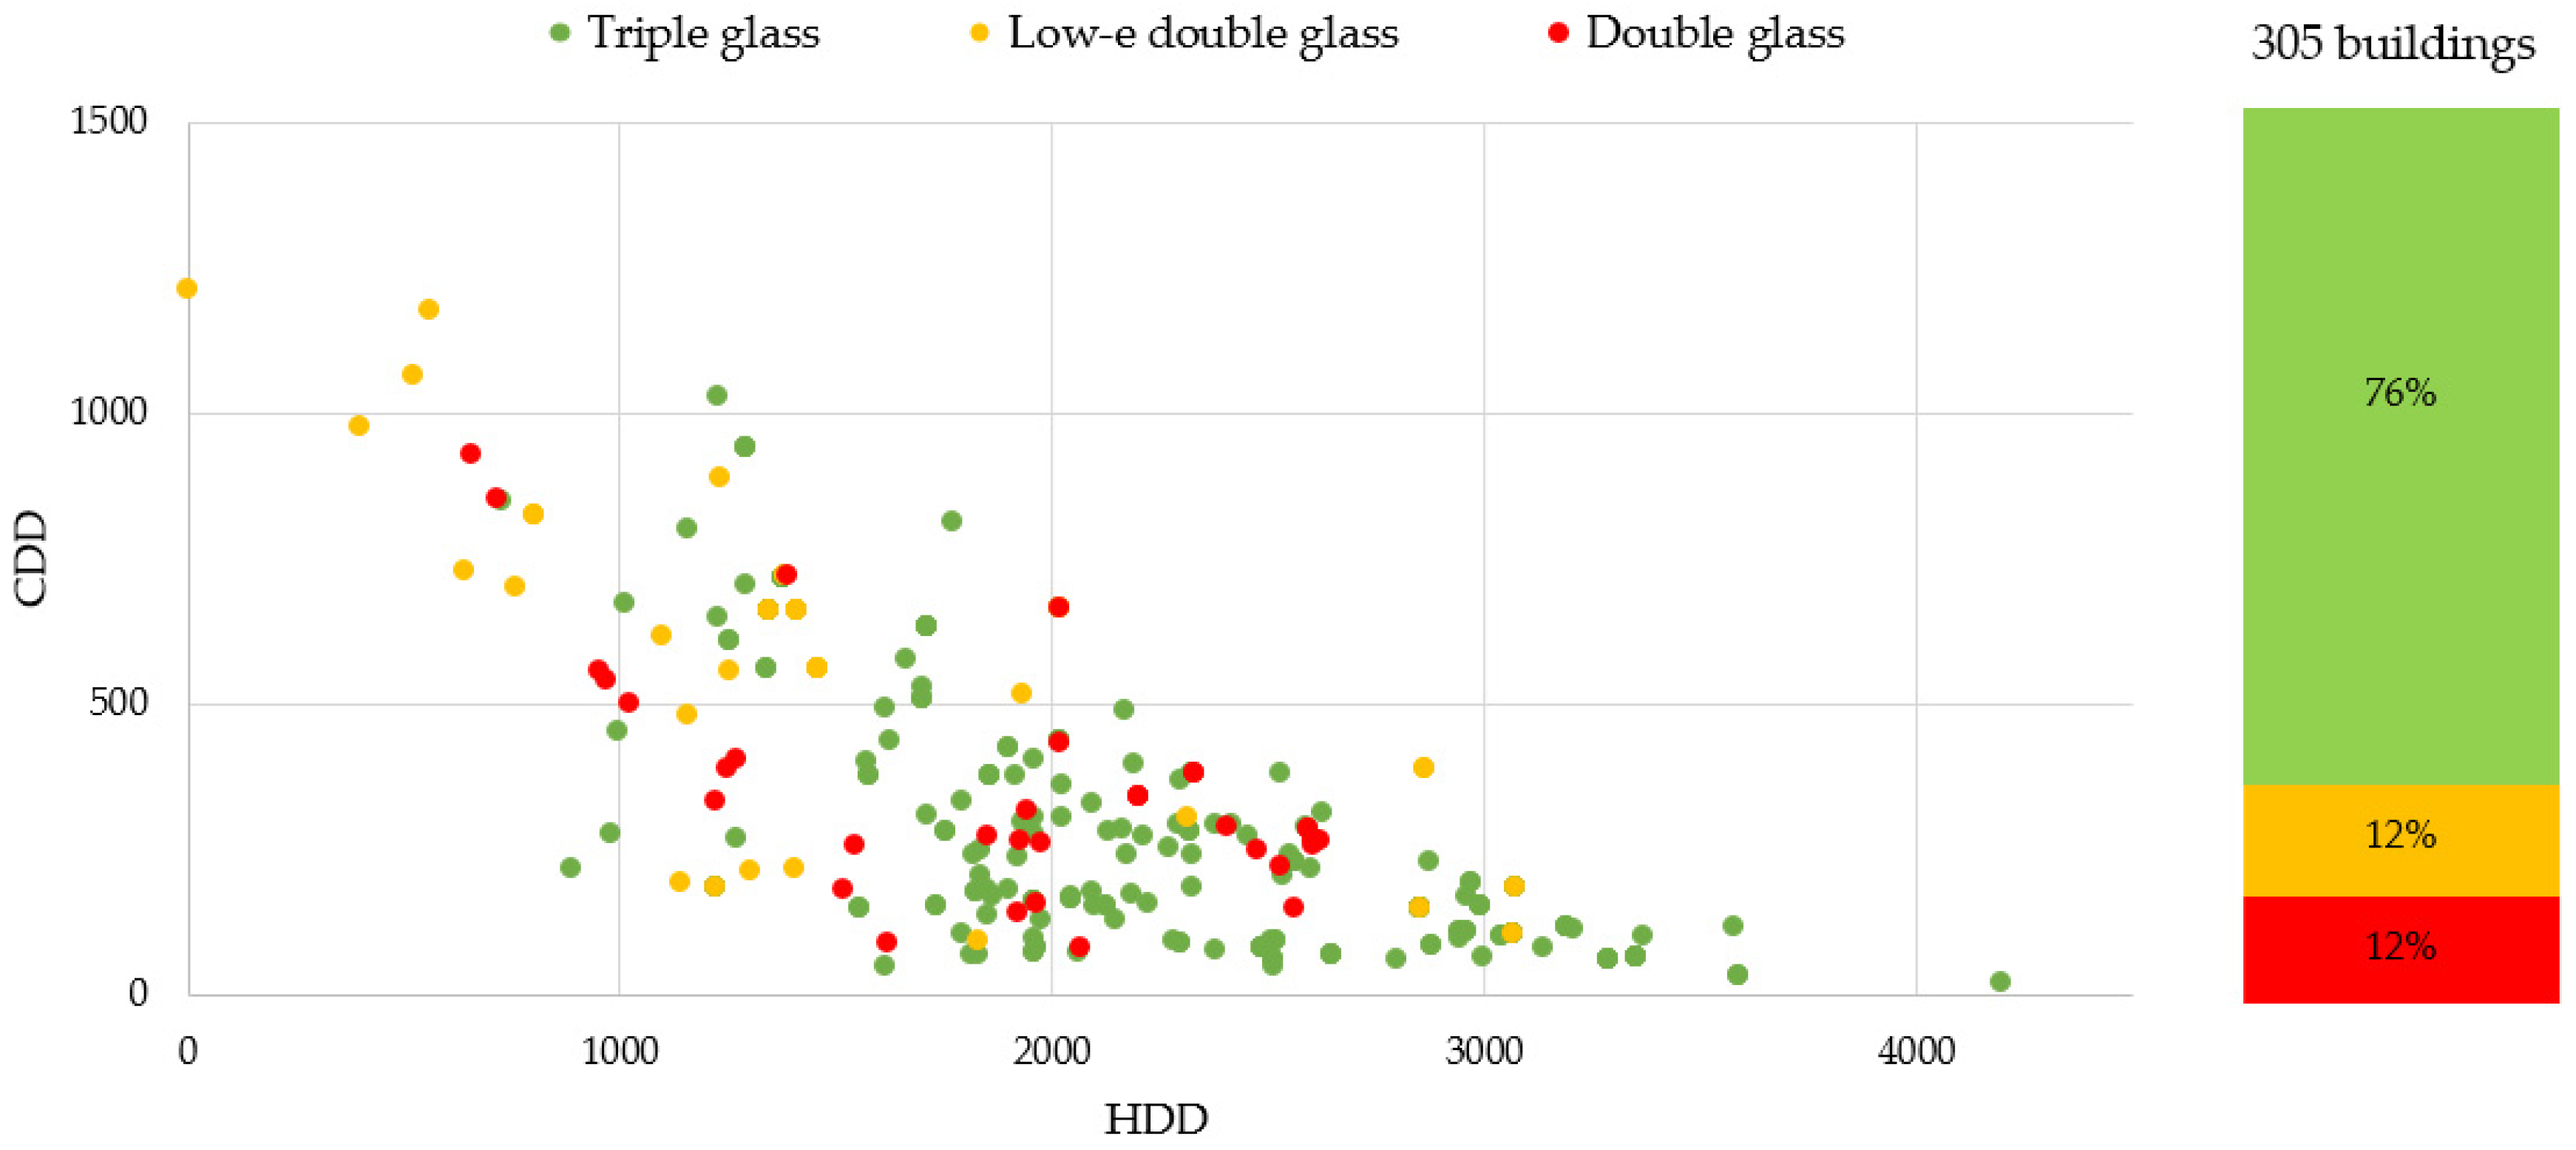
Considering the characteristics of the windows, despite the expectations, we observed that “triple glazing” systems are also applied on buildings located in cooling dominated climates, as shown in
Figure 11.
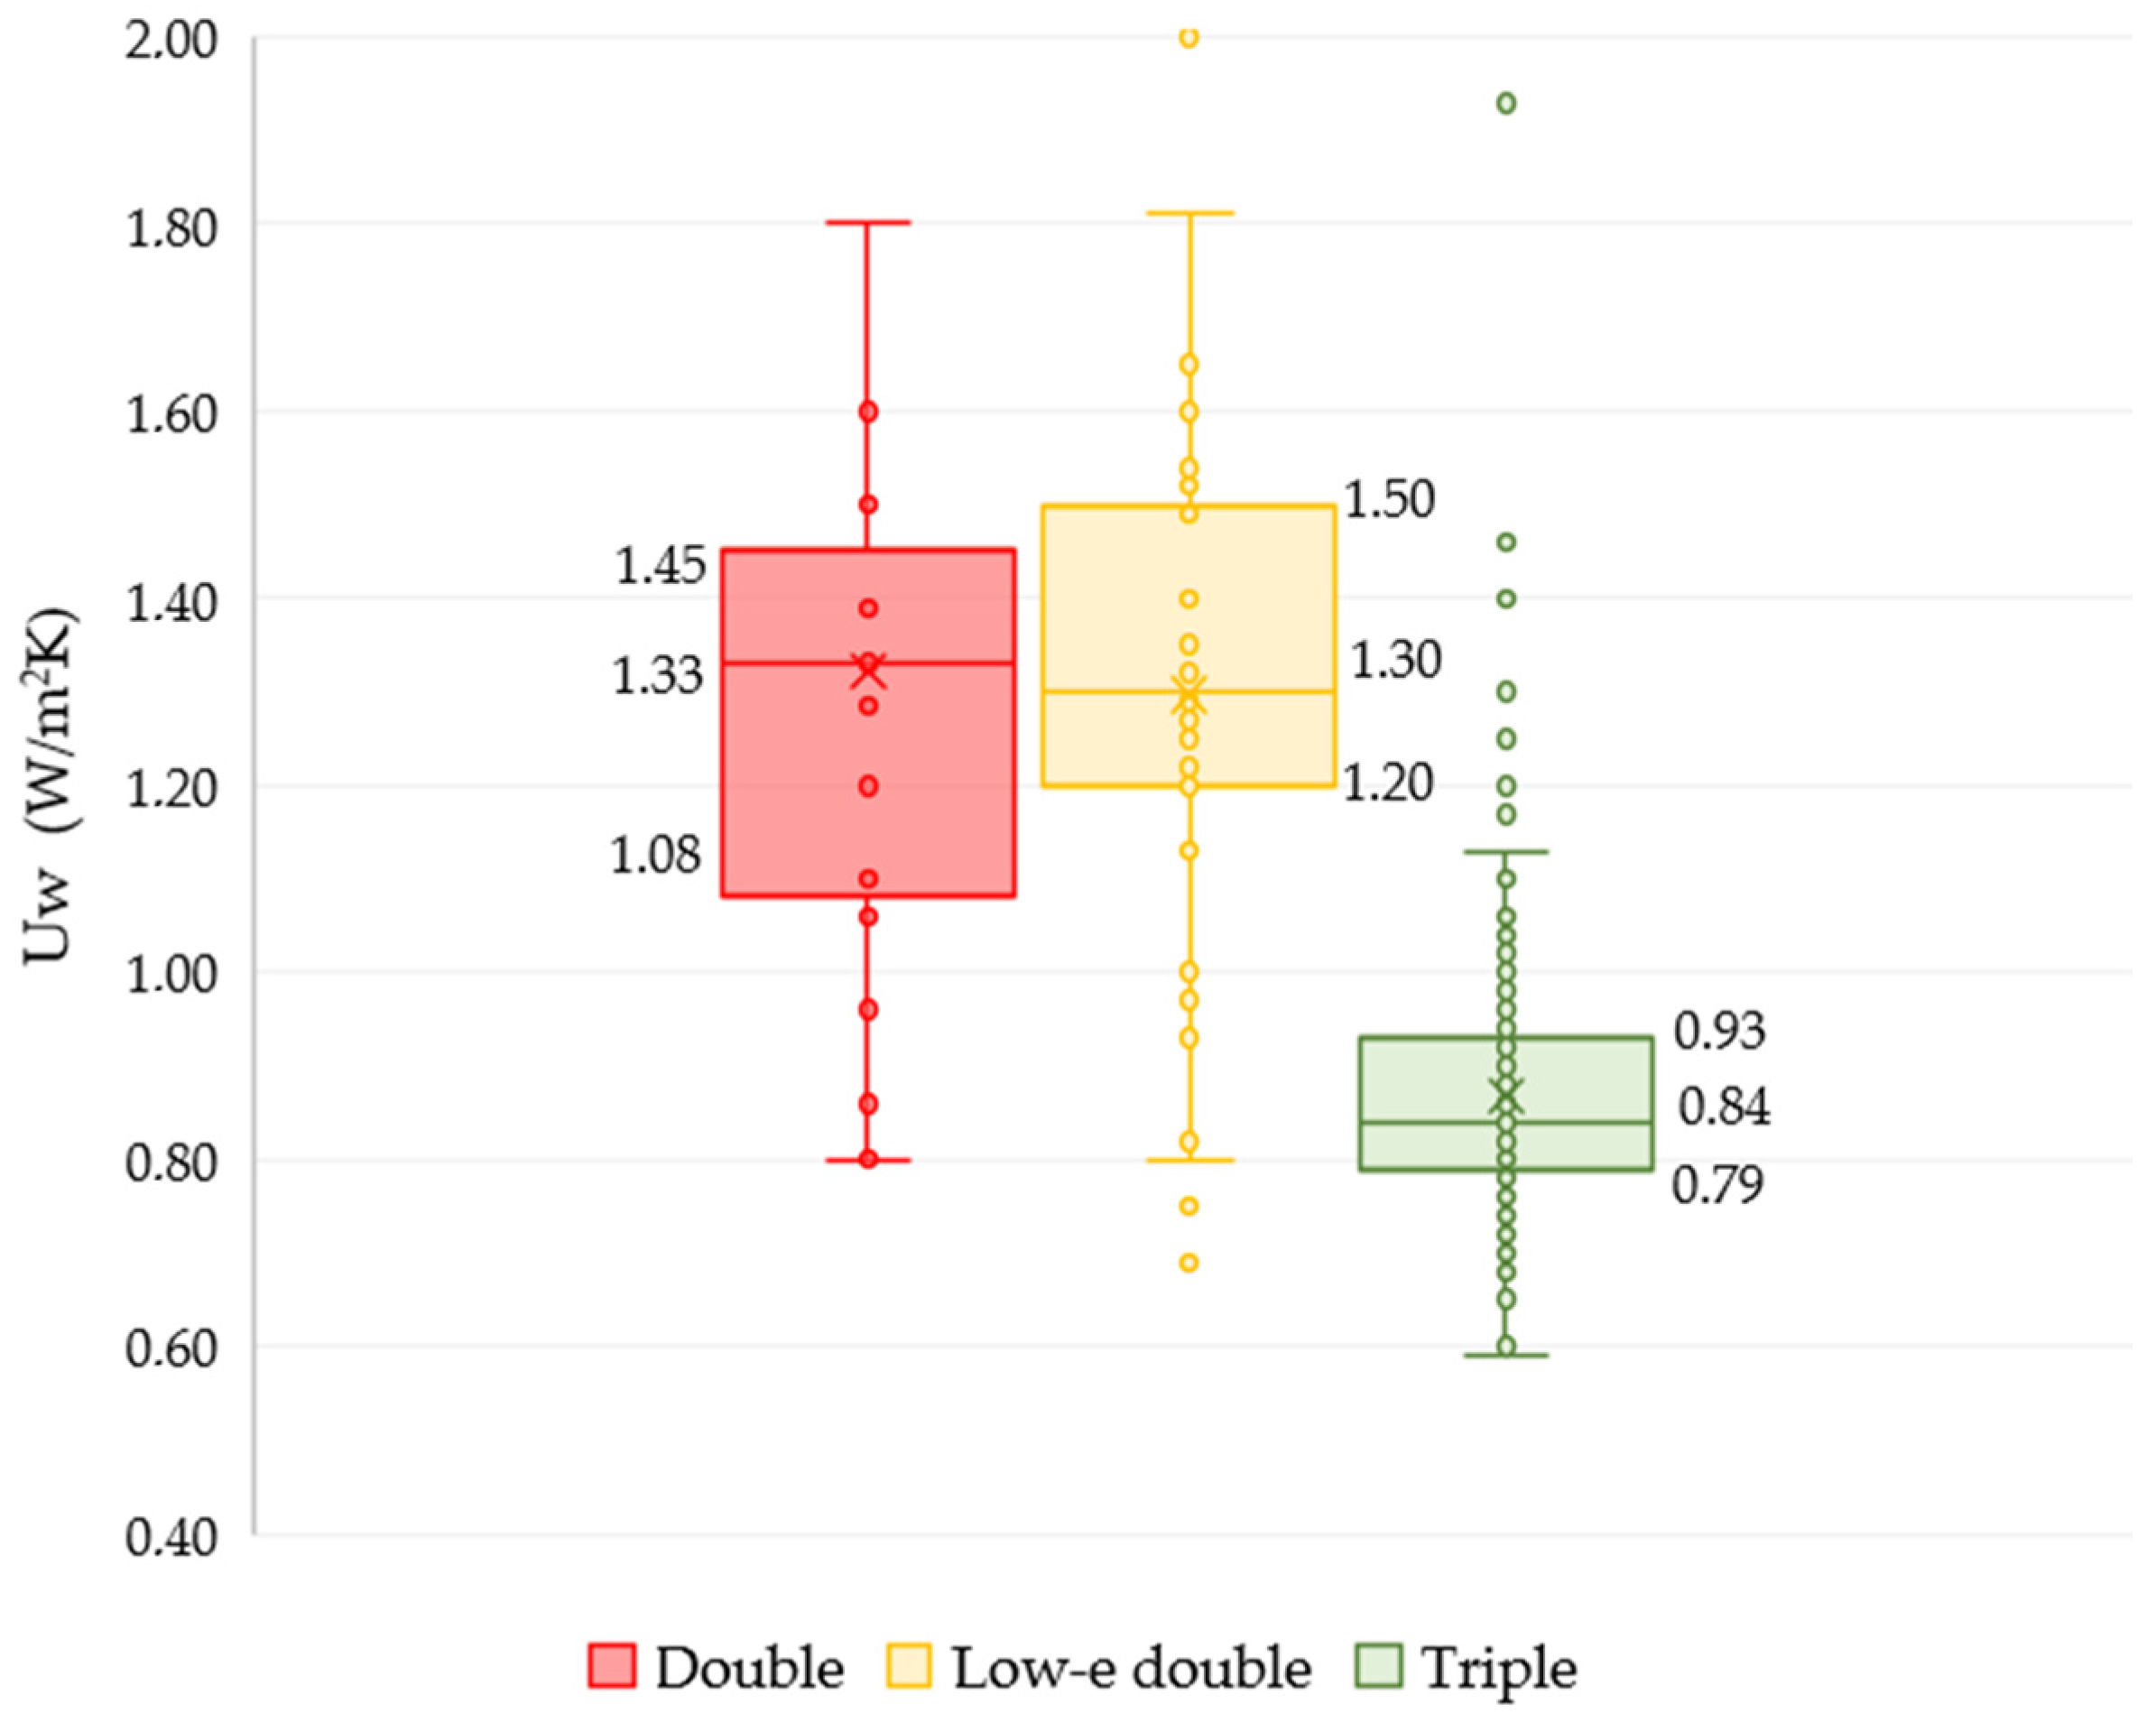
Due to the lack of more specific information concerning the double glass coating (e.g., low emission, selective…), it is difficult to add further considerations. In fact, these glazing systems have similar thermal transmittance, but different windows’ proprieties (e.g., glass emissivity) that can influence the choice of one or other glass according to the building context (orientation, dimension of the windows, building use, etc.). In addition, the lack of reliability of the specific data hinders a more detailed analysis. As it can be seen in
Figure 12, the thermal transmittances of triple glass windows are clearly lower in comparison to double and low-e glazing typologies. However, in the case of low emission double glasses, the median of the thermal transmittance is just slightly lower than the median in the simple double glass. For this reason, it can be deduced that, during the data collection, some double-glazing with low emissivity properties were wrongly identified as a simple double glass.
4.3. Mechanical Ventilation
The use of mechanical ventilation in buildings ensure air exchange at a certain rate. It reduces the indoor carbon dioxide concertation, moisture, smoke or other possible contaminants. In addition, the air-movement improves the comfort of the occupants.
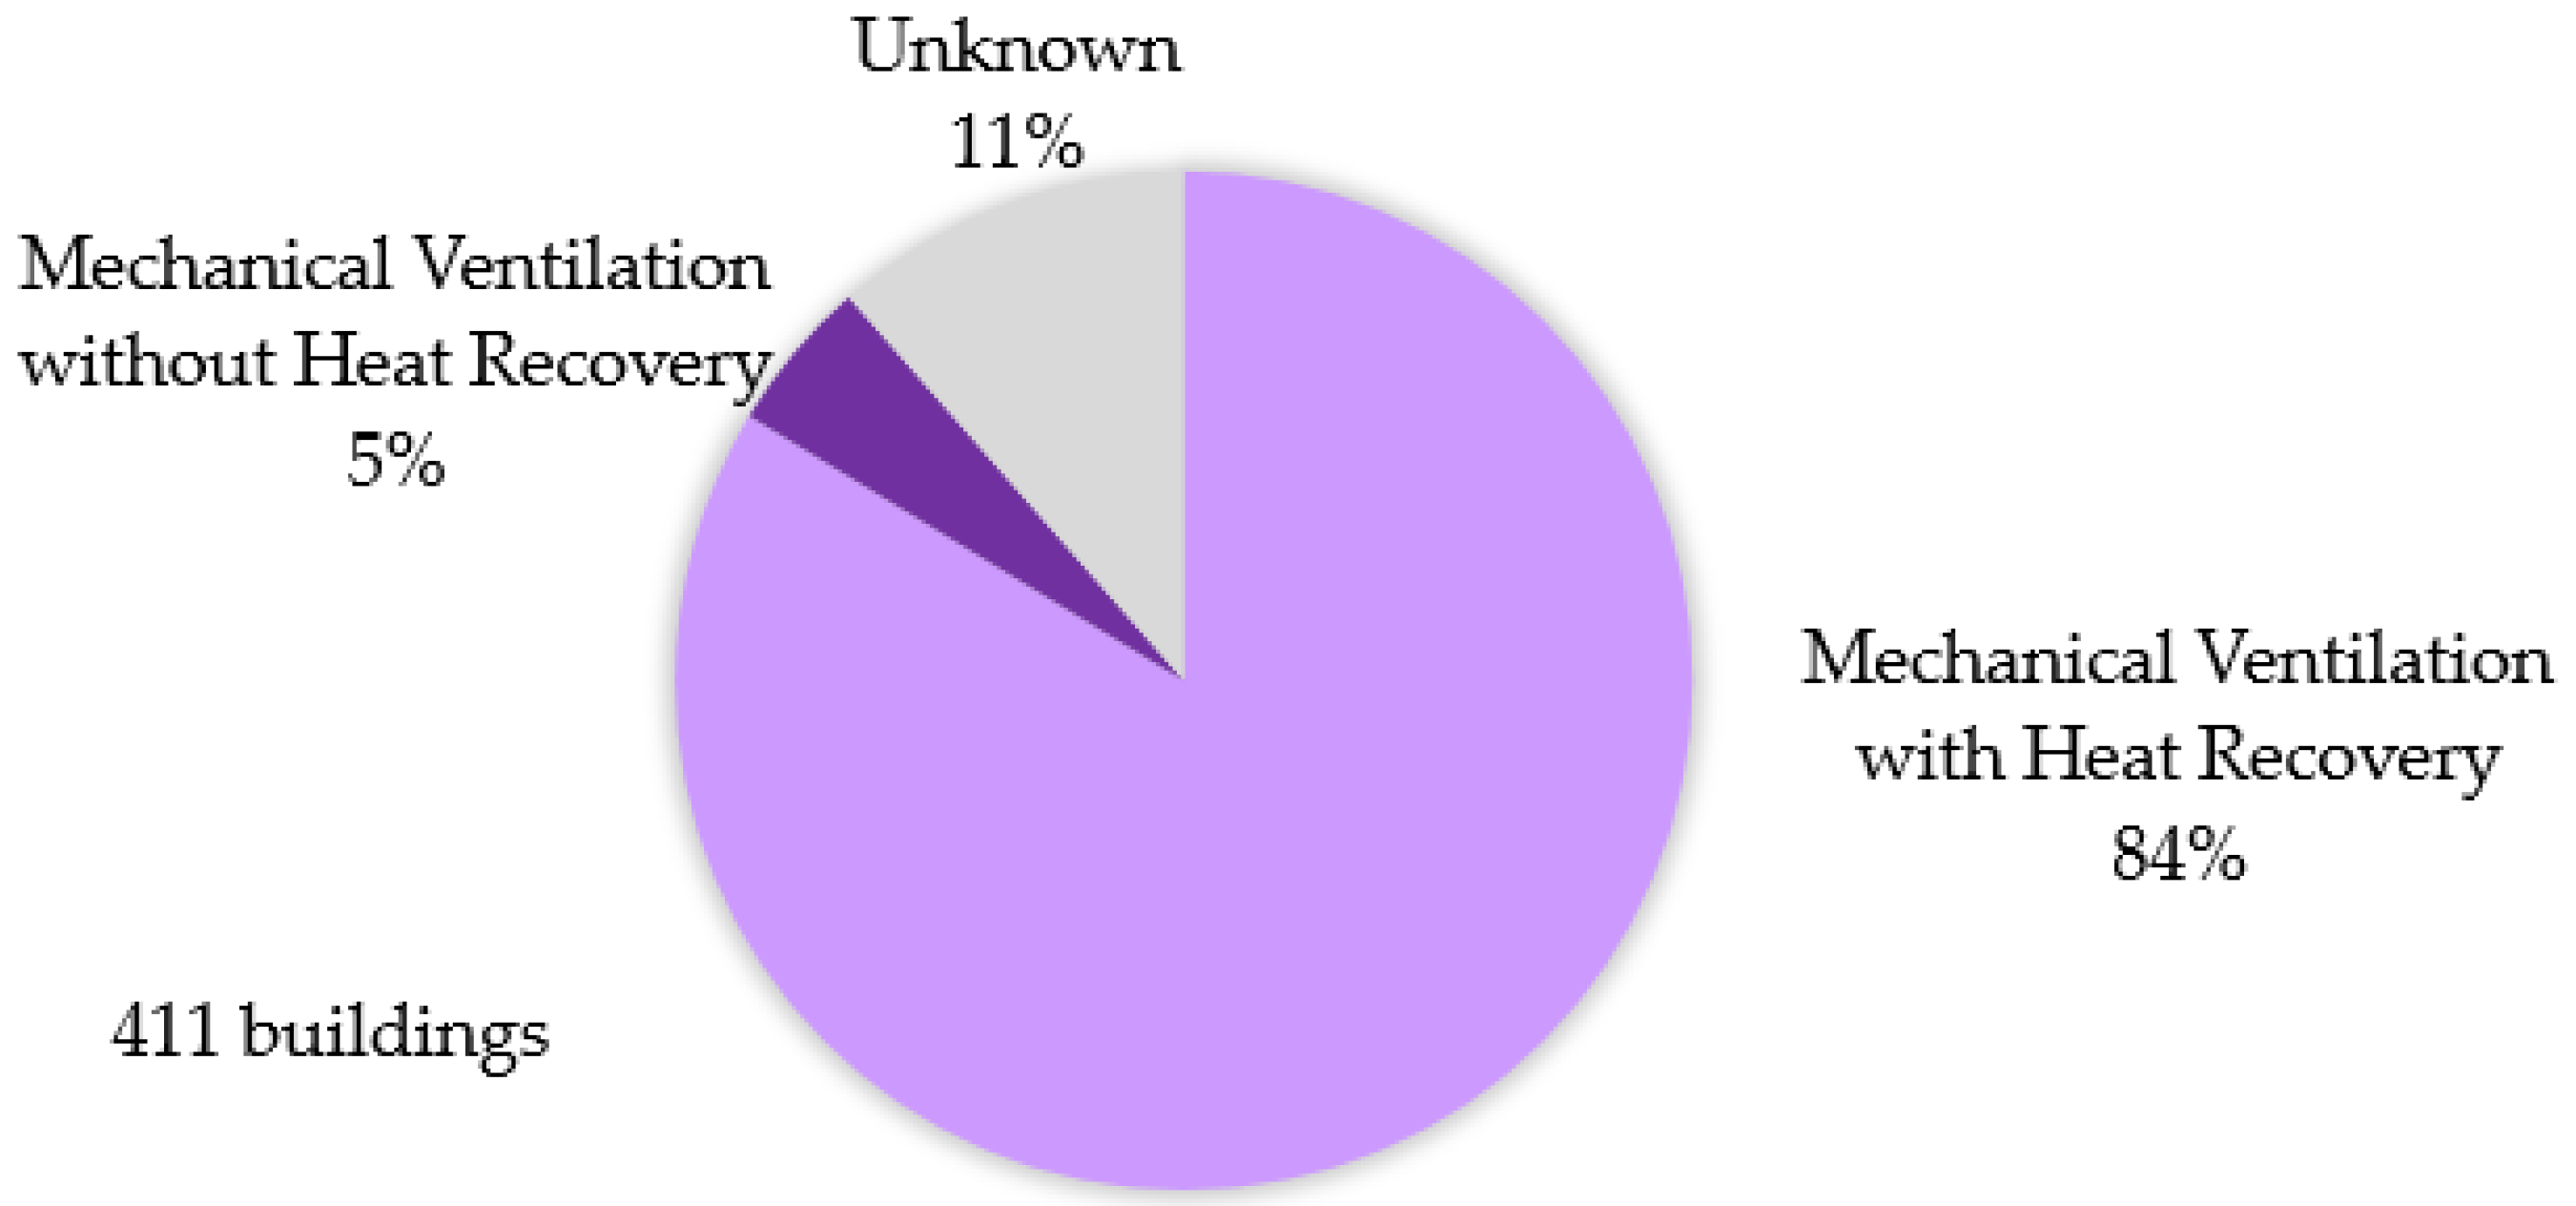
From the results of the analysis, it can be noticed that mechanical ventilation is a recurrent technical solution in new and renovated nZEBs (share of 89%), as shown in
Figure 13. This technology is used without any relevant difference in warm, mild and cold climates. Only in 11% of the selected nZEBs, the data information was not declared or not defined during the data collection, for this reason in these cases the results are defined as “unknown”.
In order to reduce the increasing heating and cooling demands due to the replacement of the indoor air with the outside air, most of the mechanical ventilation systems include heat recovery. These systems permit recovering heat or cold from the outgoing air to pre-heat or pre-cool the incoming fresh air. The high efficiencies of the heat recovery systems (over 80%), as declared in data collected, make their use very frequent in ventilation systems in new and renovated buildings, and they are commonly used (84%), as the
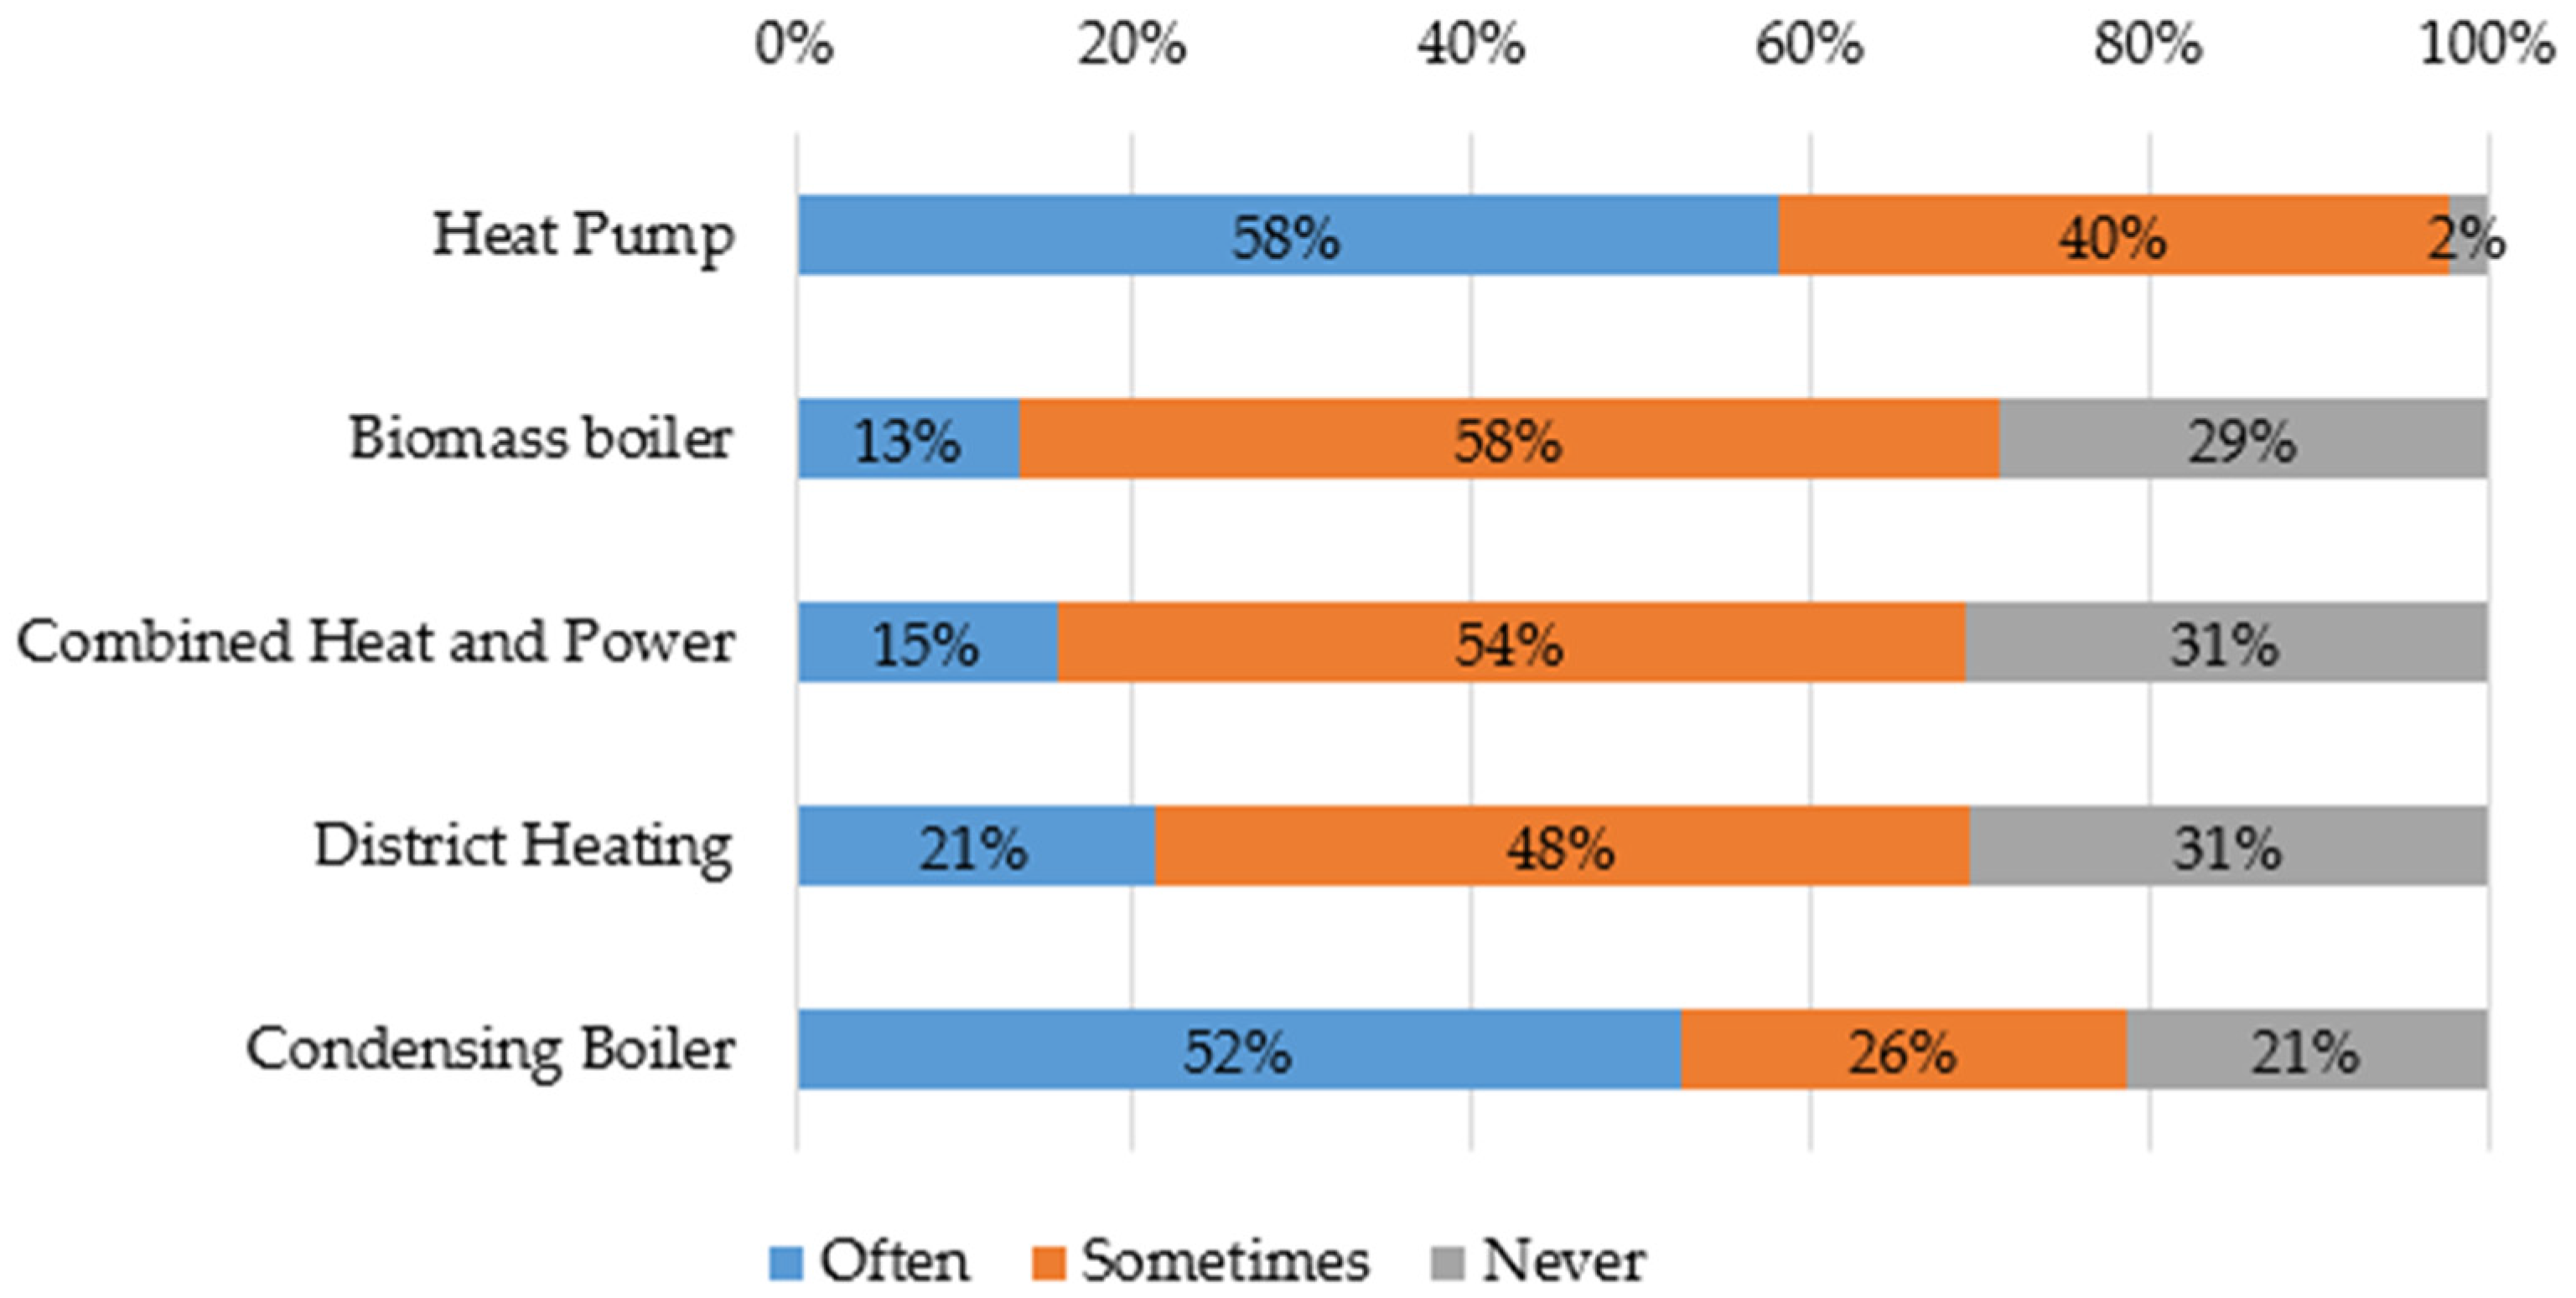
Figure 13. This is also in line with the results of the survey carried out within EU IEE ZEBRA2020 project to building professionals, in which 92% of the respondents adopt “sometimes” or “often” heat recovery systems in ventilation when constructing high-energy efficient buildings [
2].
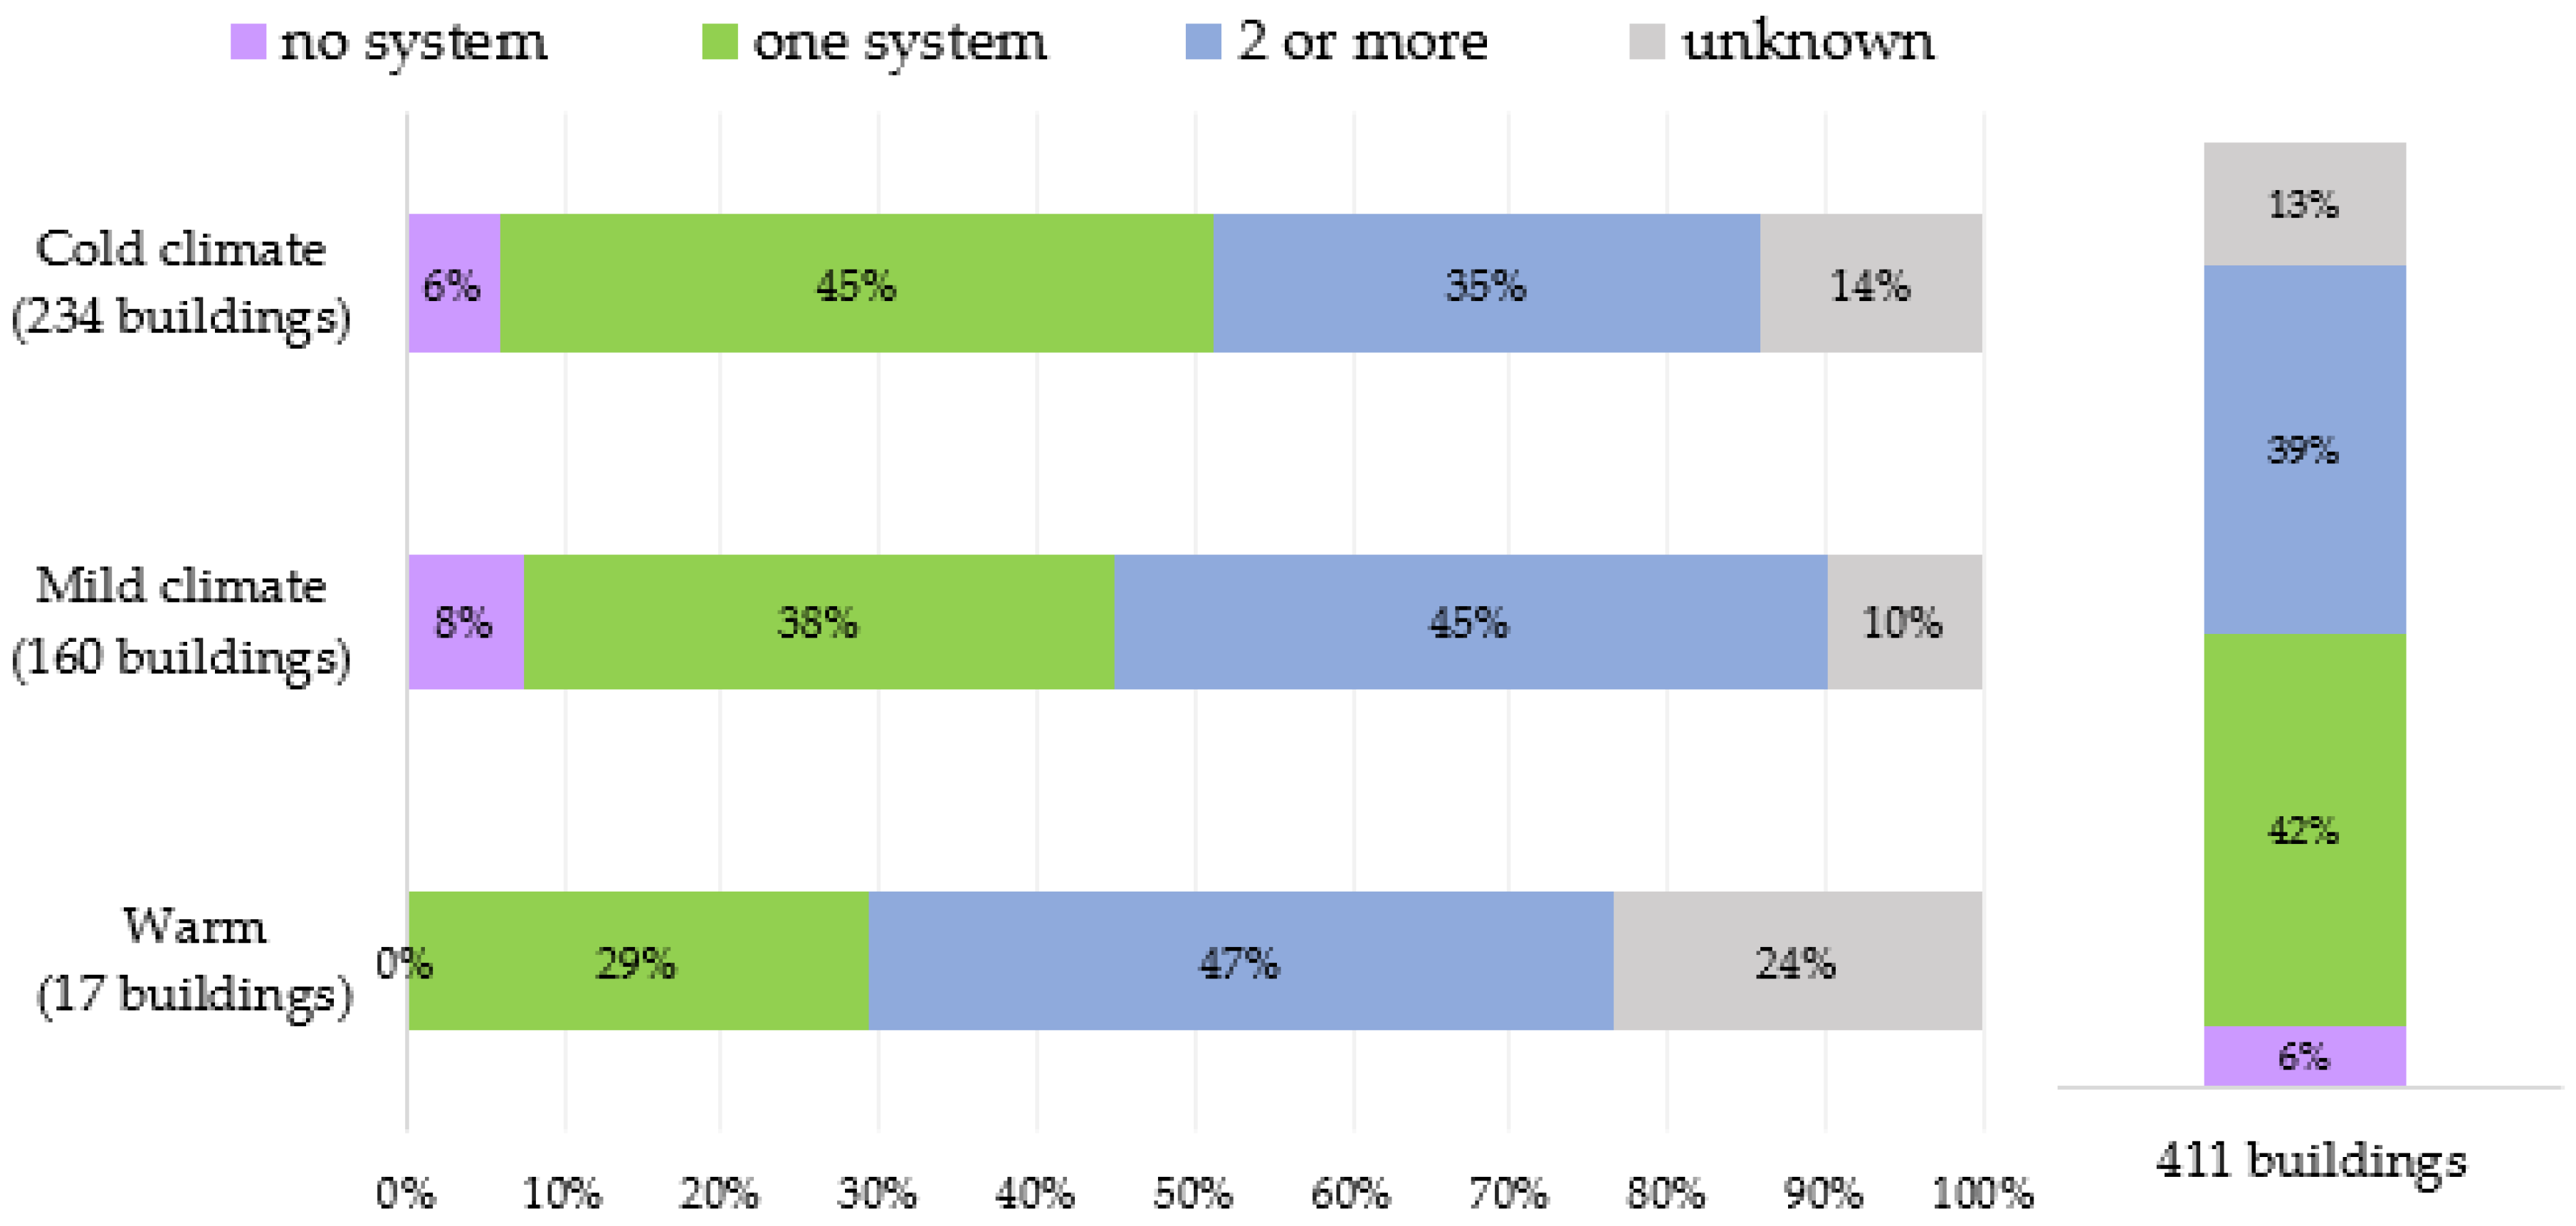
4.4. Heating System
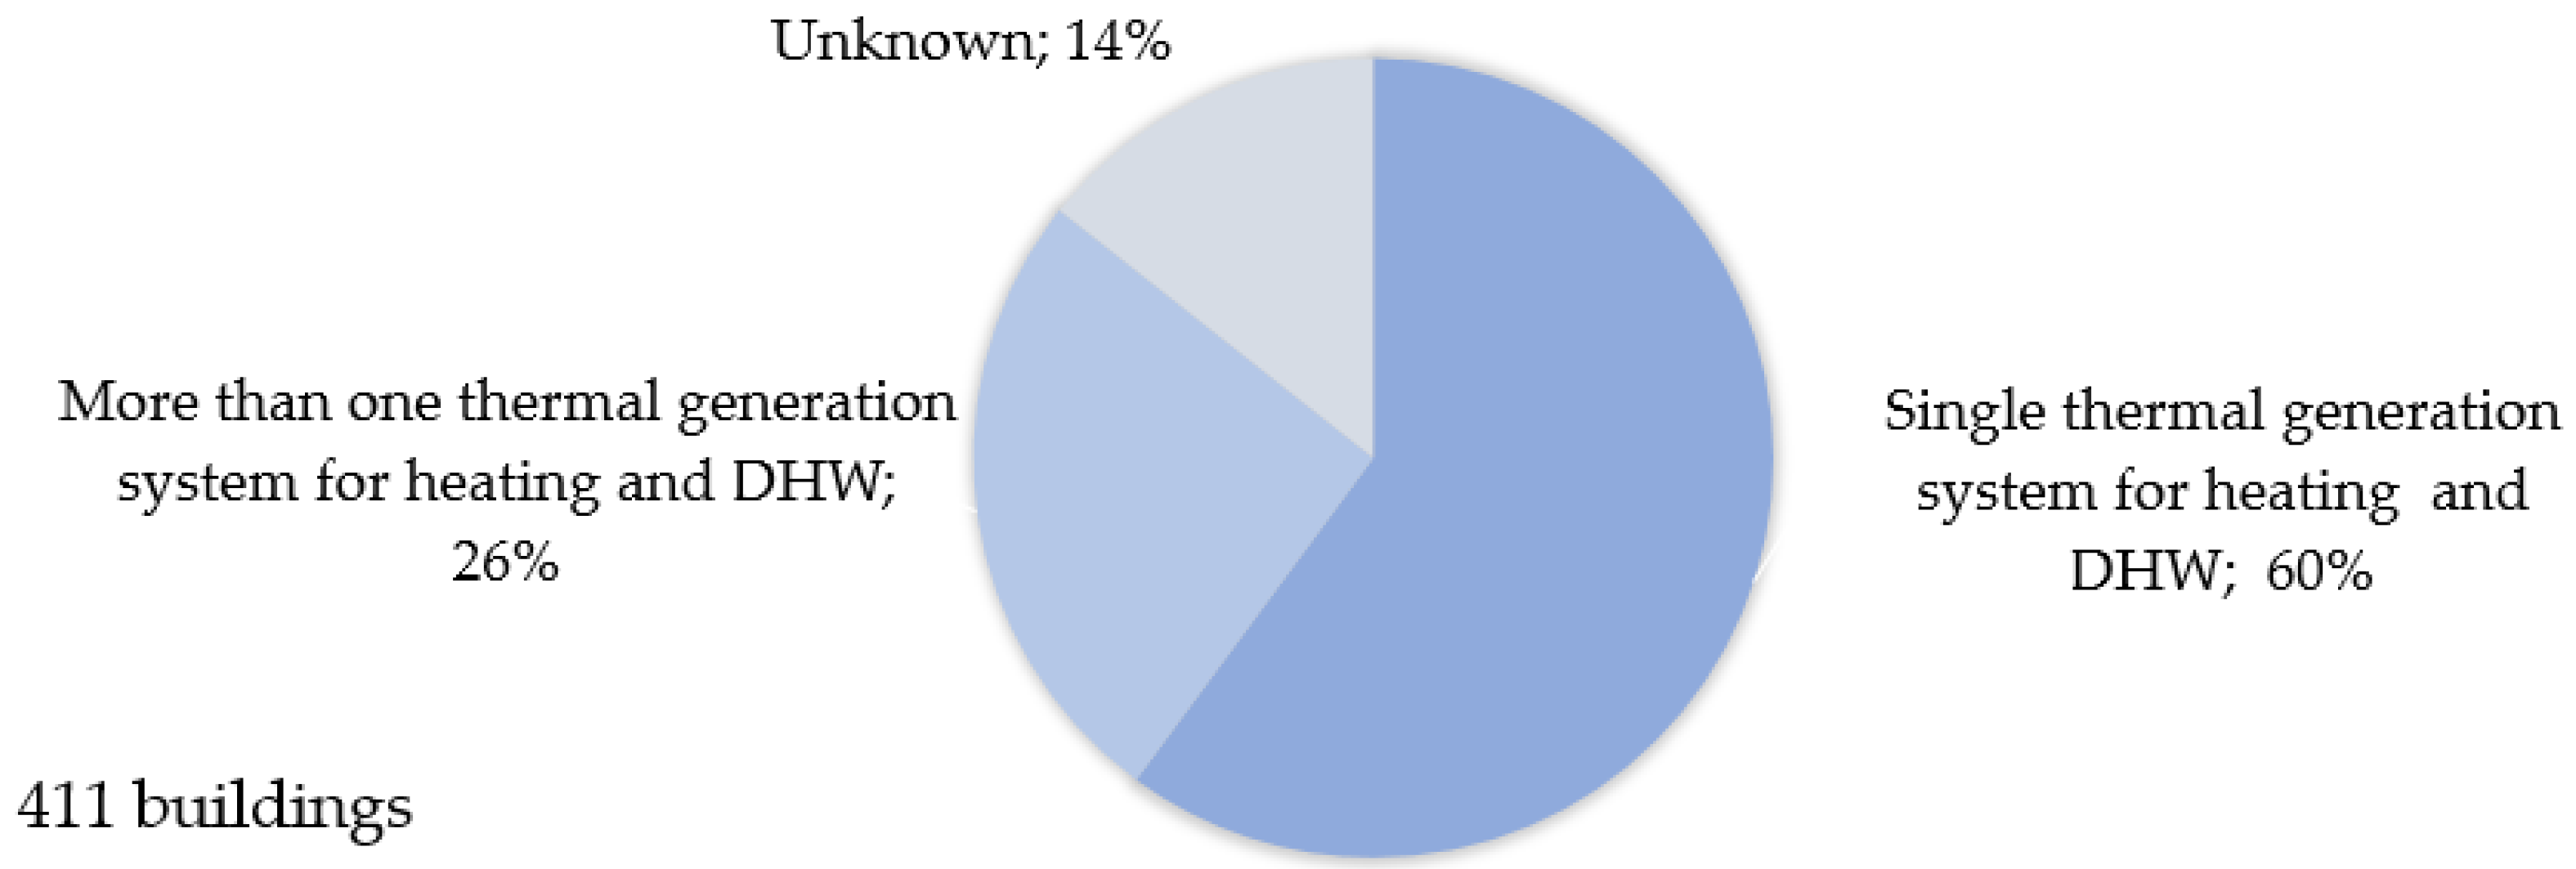
Concerning the different boiler configurations (i.e., combined and separate generation of heating and DHW), around 60% of analyzed nZEBs use one single system for both needs (heating + DHW). On the other hand, 26% use separated thermal systems for heating and DHW, and, for the rest of the sample (14%), there is no information about the used systems (i.e., unknown), as shown in
Figure 14.
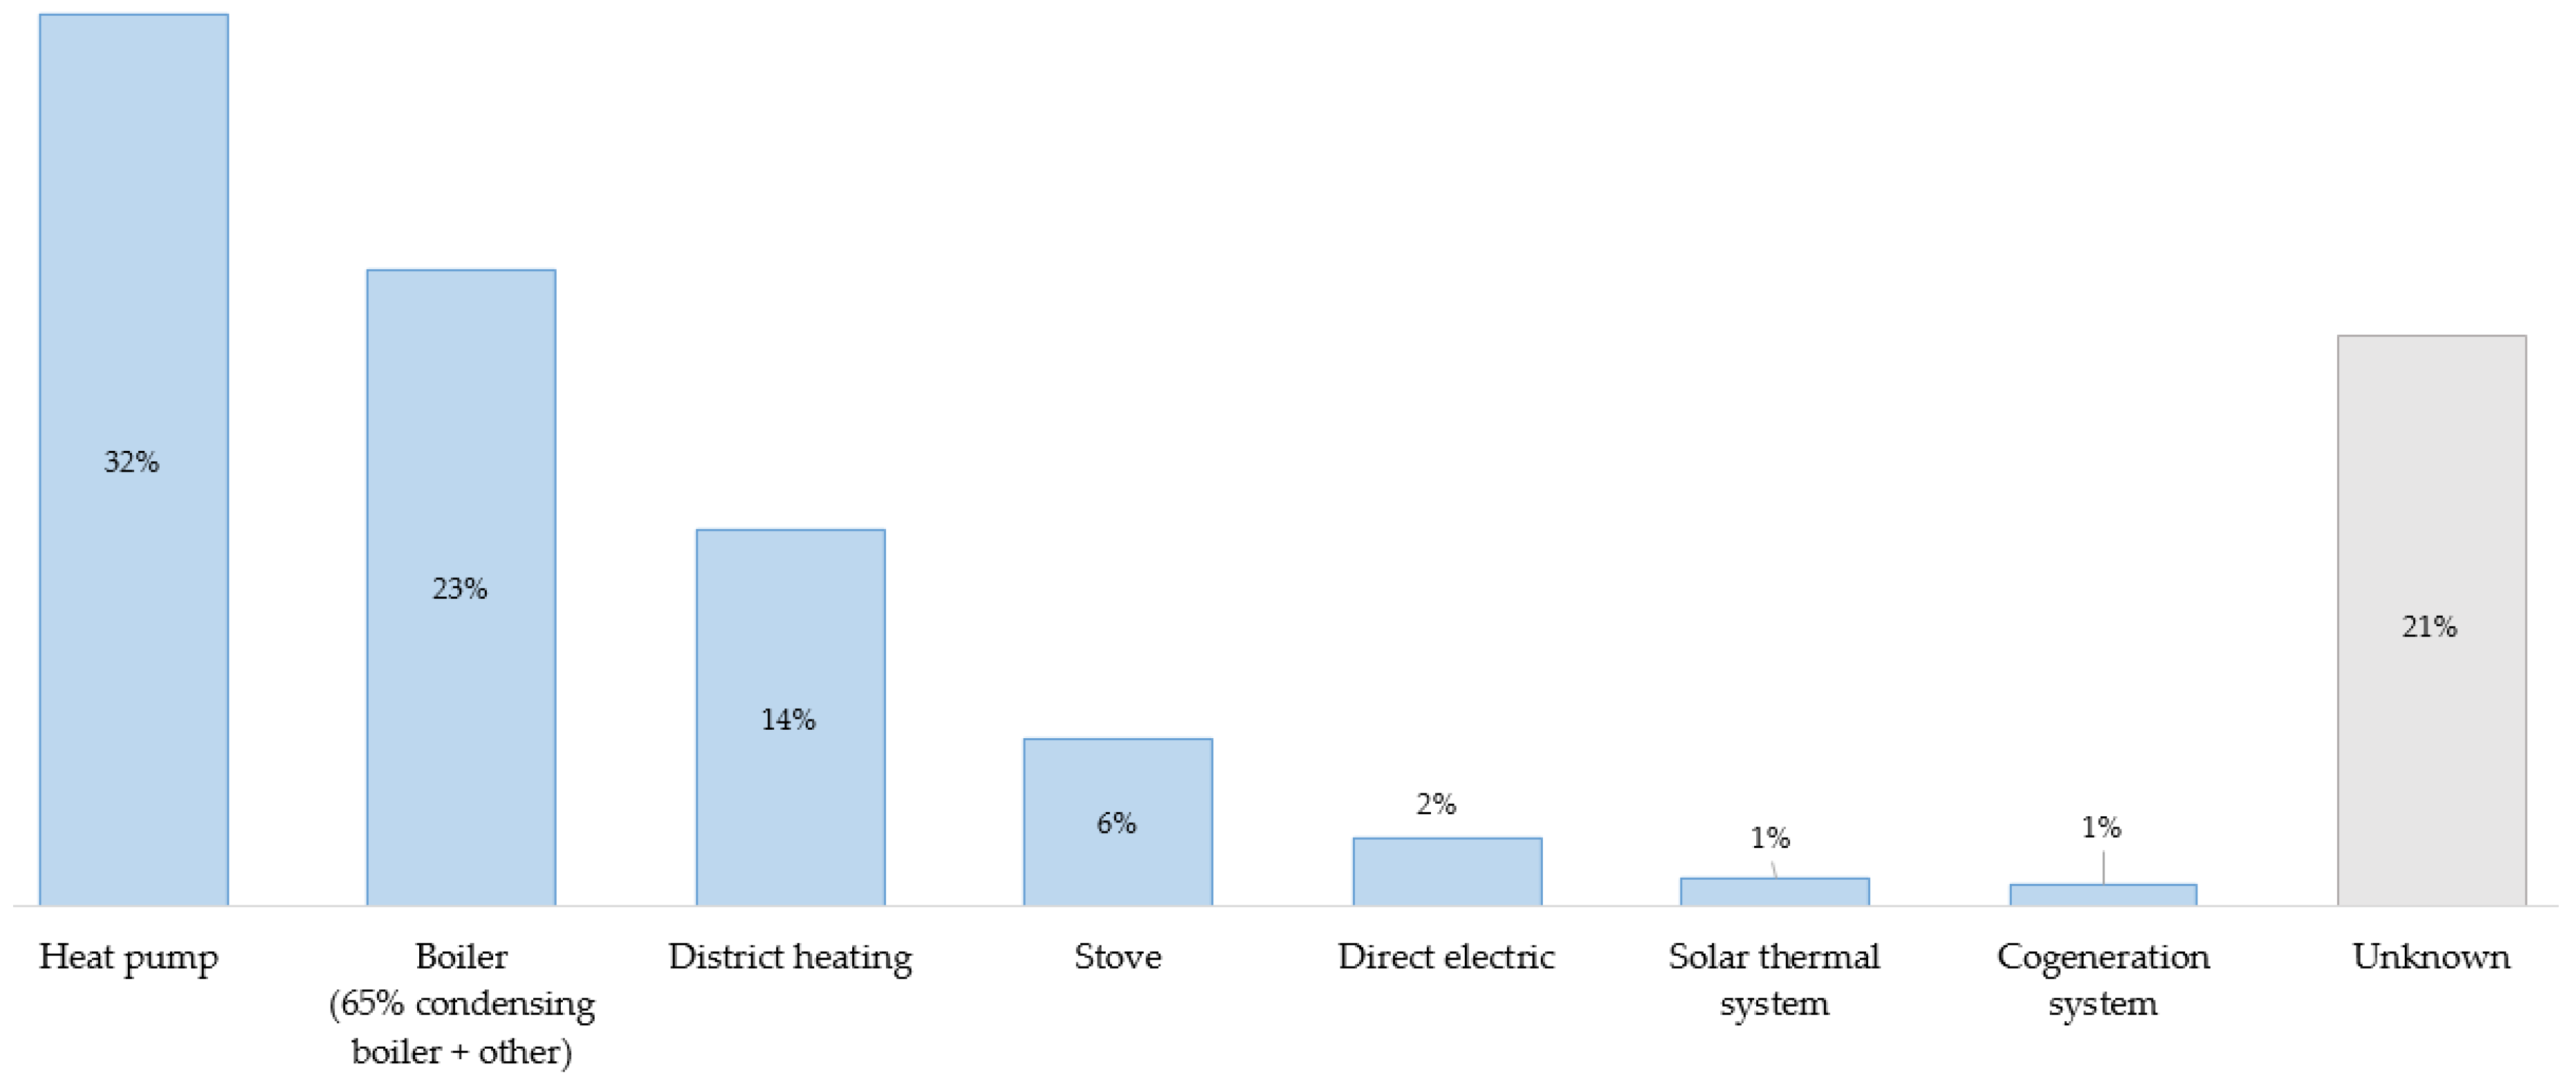
The most commonly used system to produce heating and DHW is the “heat pump”, with a presence of 32%, followed by “boiler” (23%) and “district heating” (14%), as shown in
Figure 15.
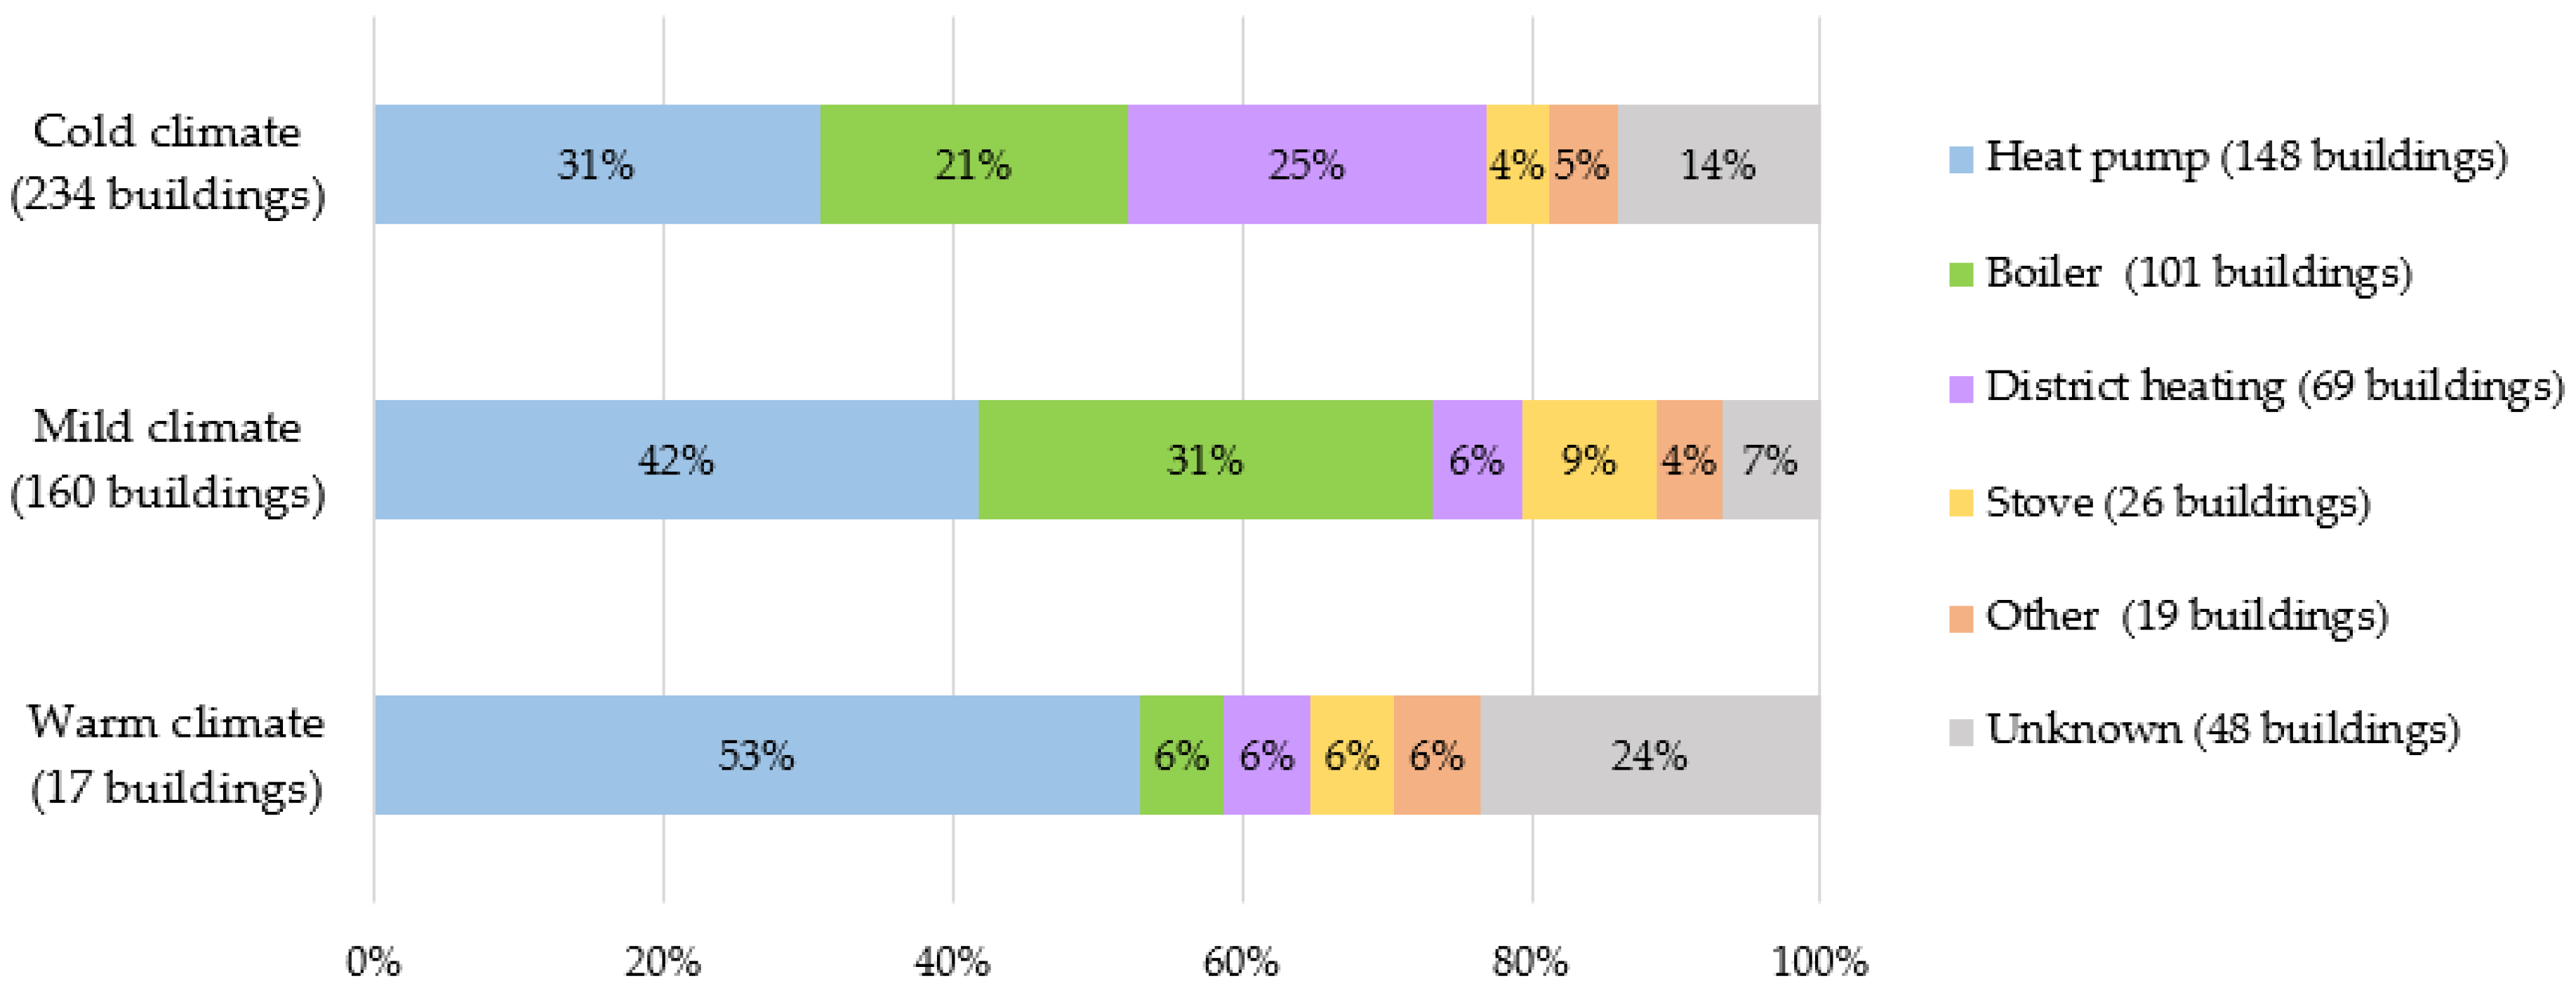
Figure 16 shows the share of the most used heating systems according to the climatic zone. The reduced number of buildings in the sample could affect the representativeness of the technologies used for the warm climates. Nevertheless,
Figure 16 reports the share of heating systems of the three climatic zones. The “heat pump” is the most used technology, with a lower penetration in a cold climatic zone (31%). This technology is widely adopted in warm-mild climates (42%), since it allow for achieving high performance levels with mild external temperature, and it is commonly used to also satisfy the cooling needs in summer periods.
The survey implemented within EU IEE ZEBRA2020 project to building professionals confirmed that “heat pumps” and “condensing boilers” are the most used heating systems, as shown in
Figure 17.
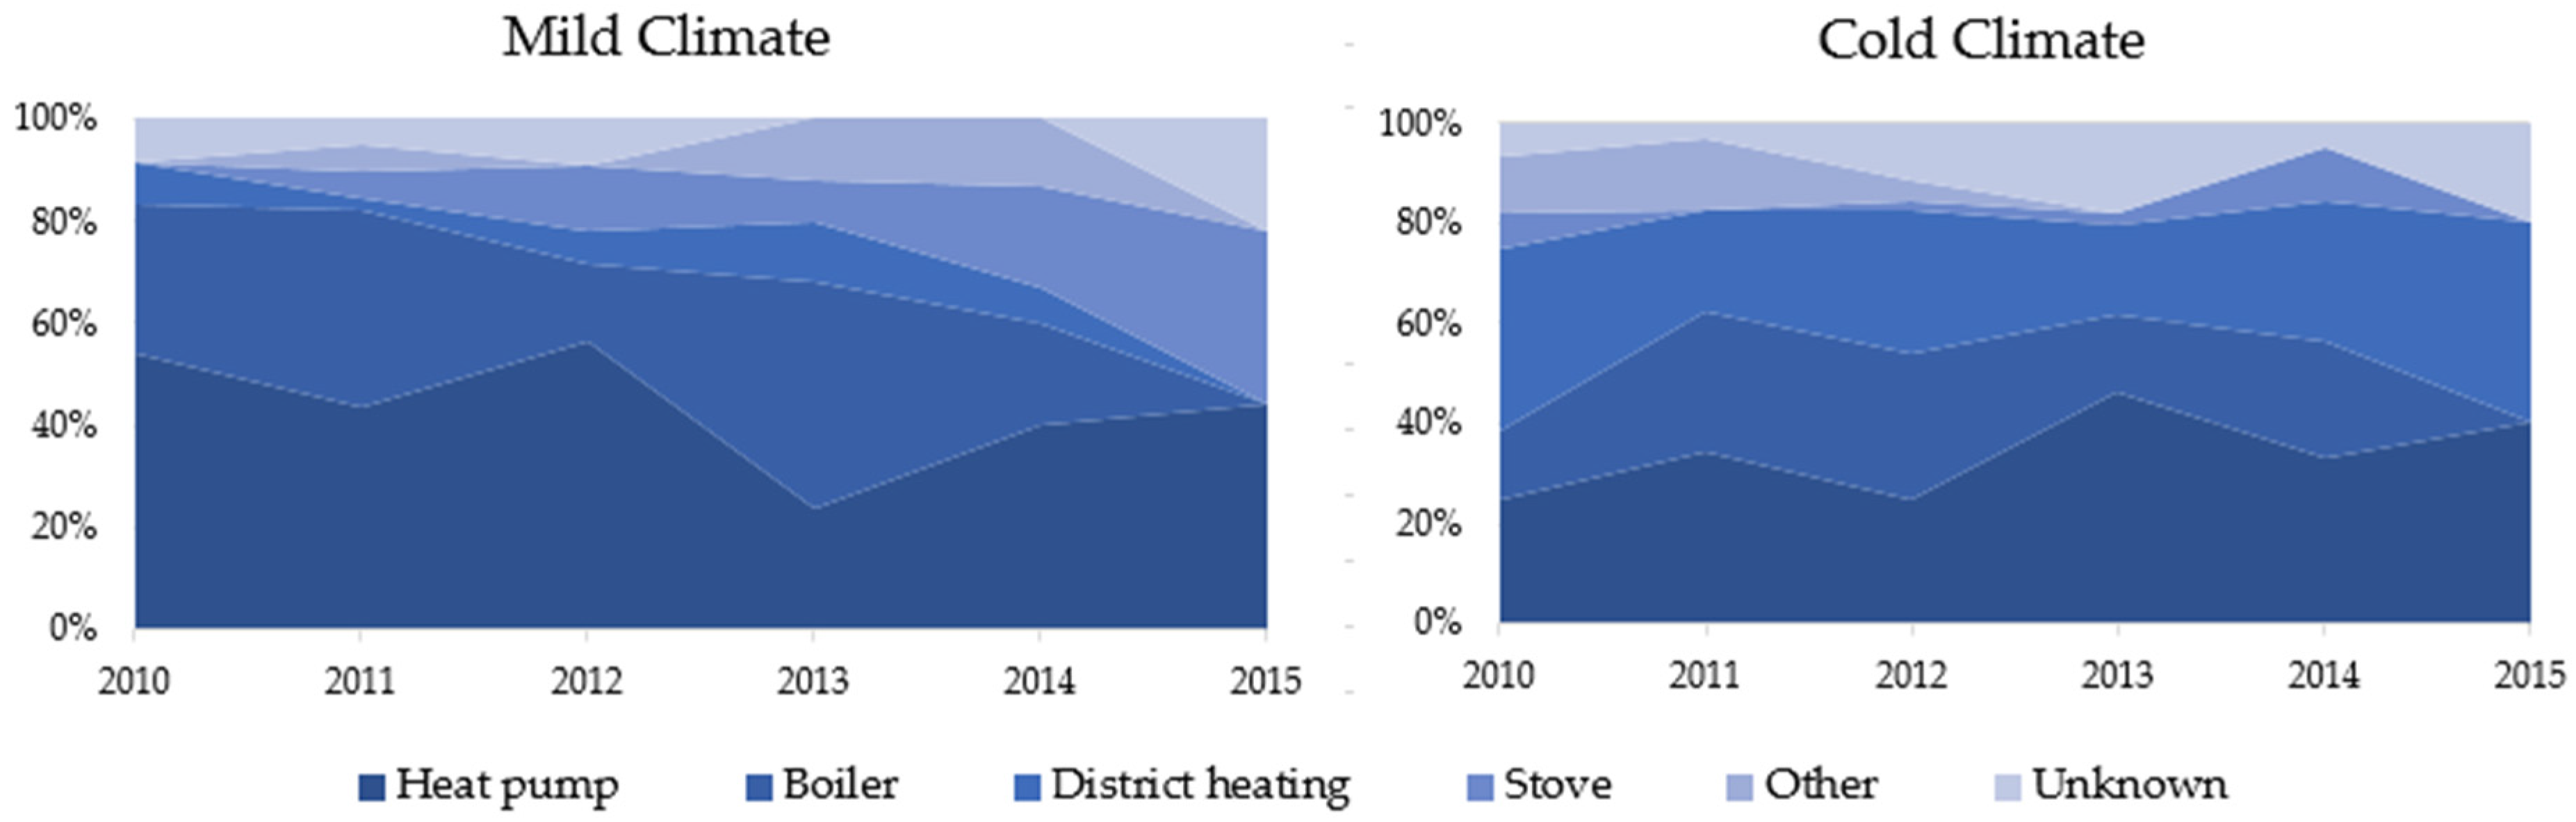
By analyzing the technology adopted during the last years, the trends for the heating systems in different climates highlight a constant use of heat pump systems in mild climates, and a reduction of a boiler system with an increment of stove systems (
Figure 18). In addition, it can be noticed that “district heating” is very common in cold climates (normally in North and East Europe), probably because of the longer period, thus investing in this type of infrastructure is more profitable [
24,
25]. Nevertheless, political reasons and national strategies could be also behind the high use of district heating in these countries.
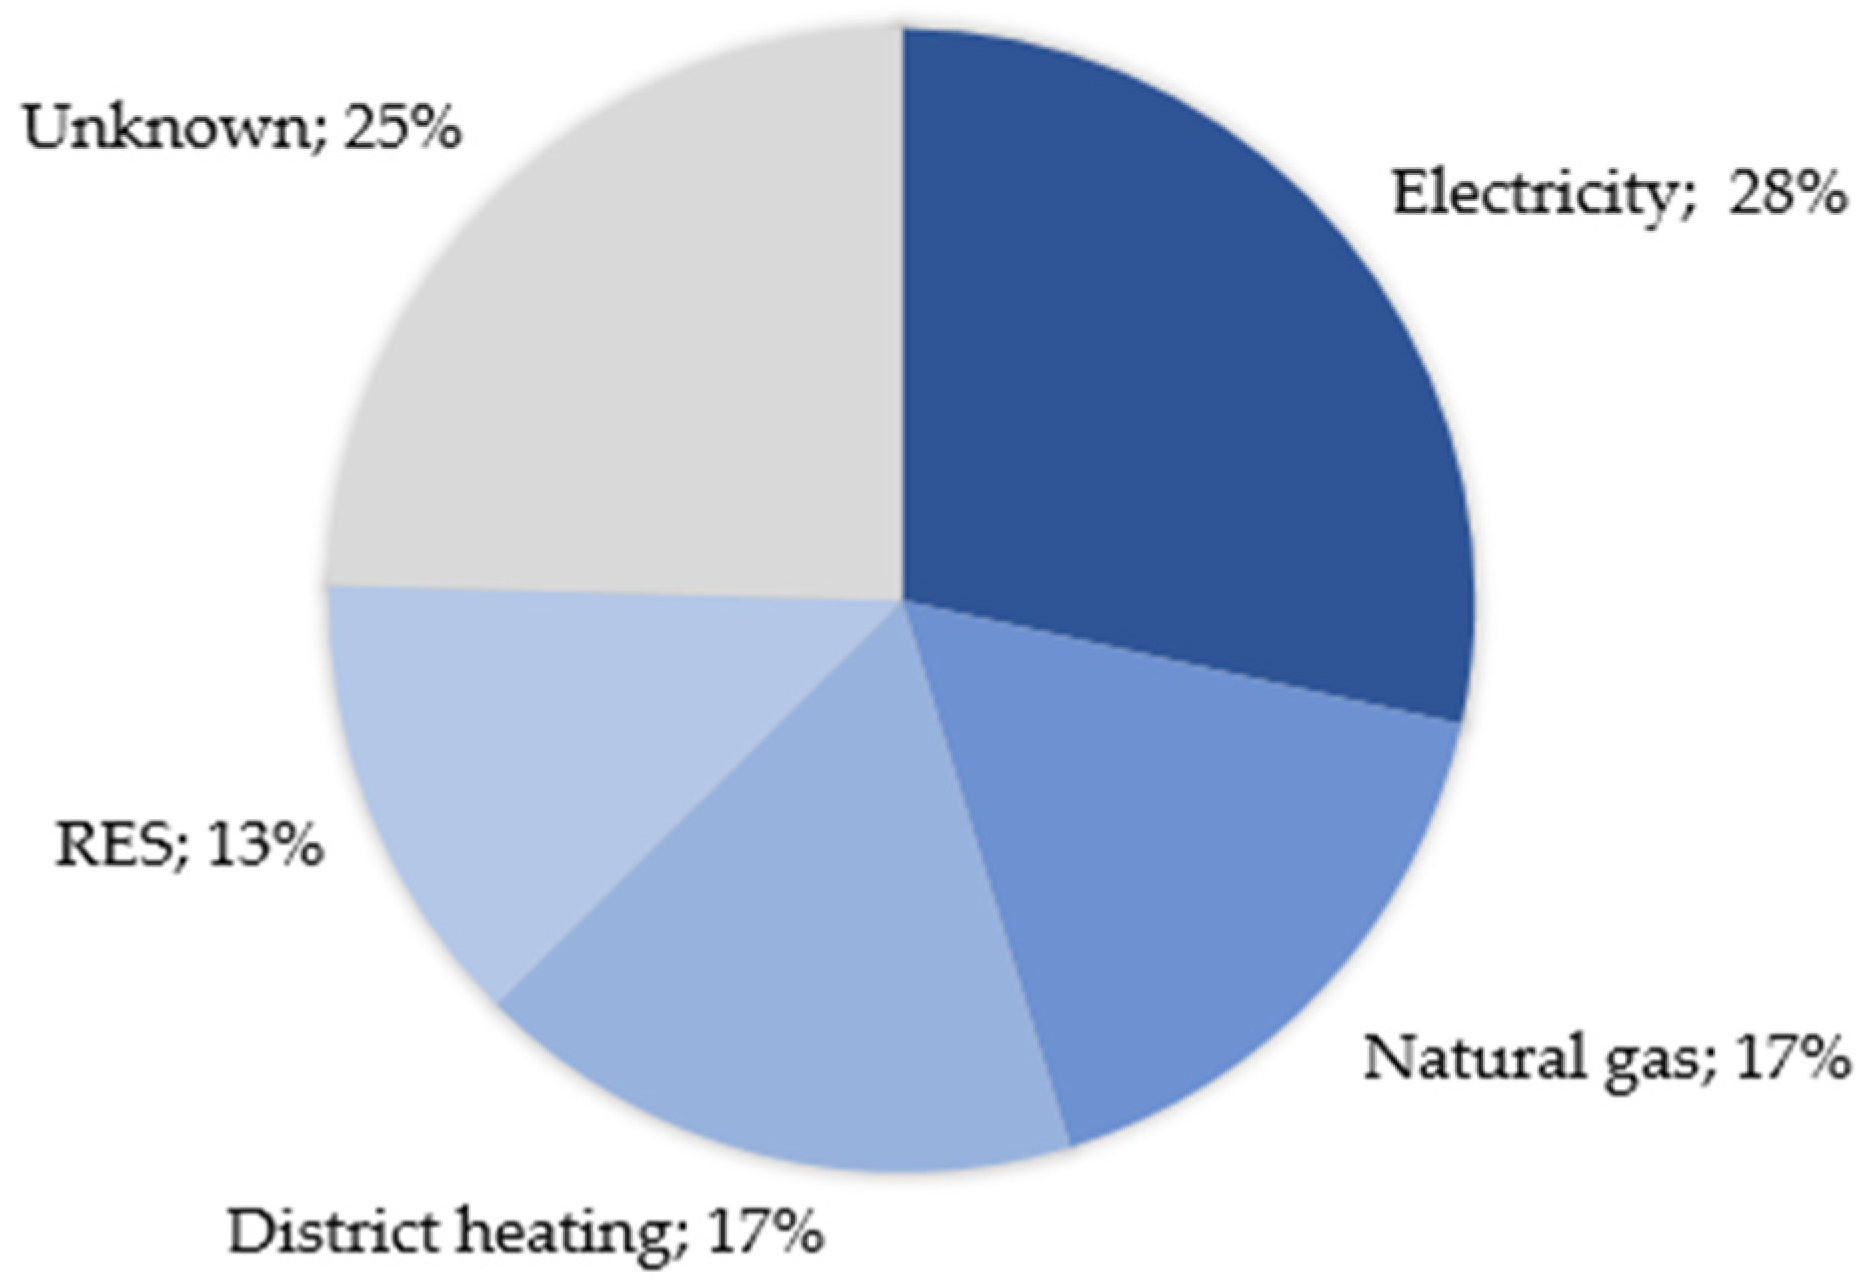
The energy carriers used by thermal systems in the collected buildings can be gathered in four groups: “natural gas”, “district heating”, “electricity” and “RES” (e.g., firewood, wood pellets, wood chips, solar thermal…), as shown in
Figure 19.
Electricity is the most used source for thermal systems (share of 28%) such as air, water, soil heat pumps and direct electric technologies.
4.5. Cooling System
As previously said, the cooling needs to depend on several aspects like external climate conditions, use of the building (use profile, internal gains, etc.), building construction features (such as window-to-wall ratio, etc.) and shading system, among others.
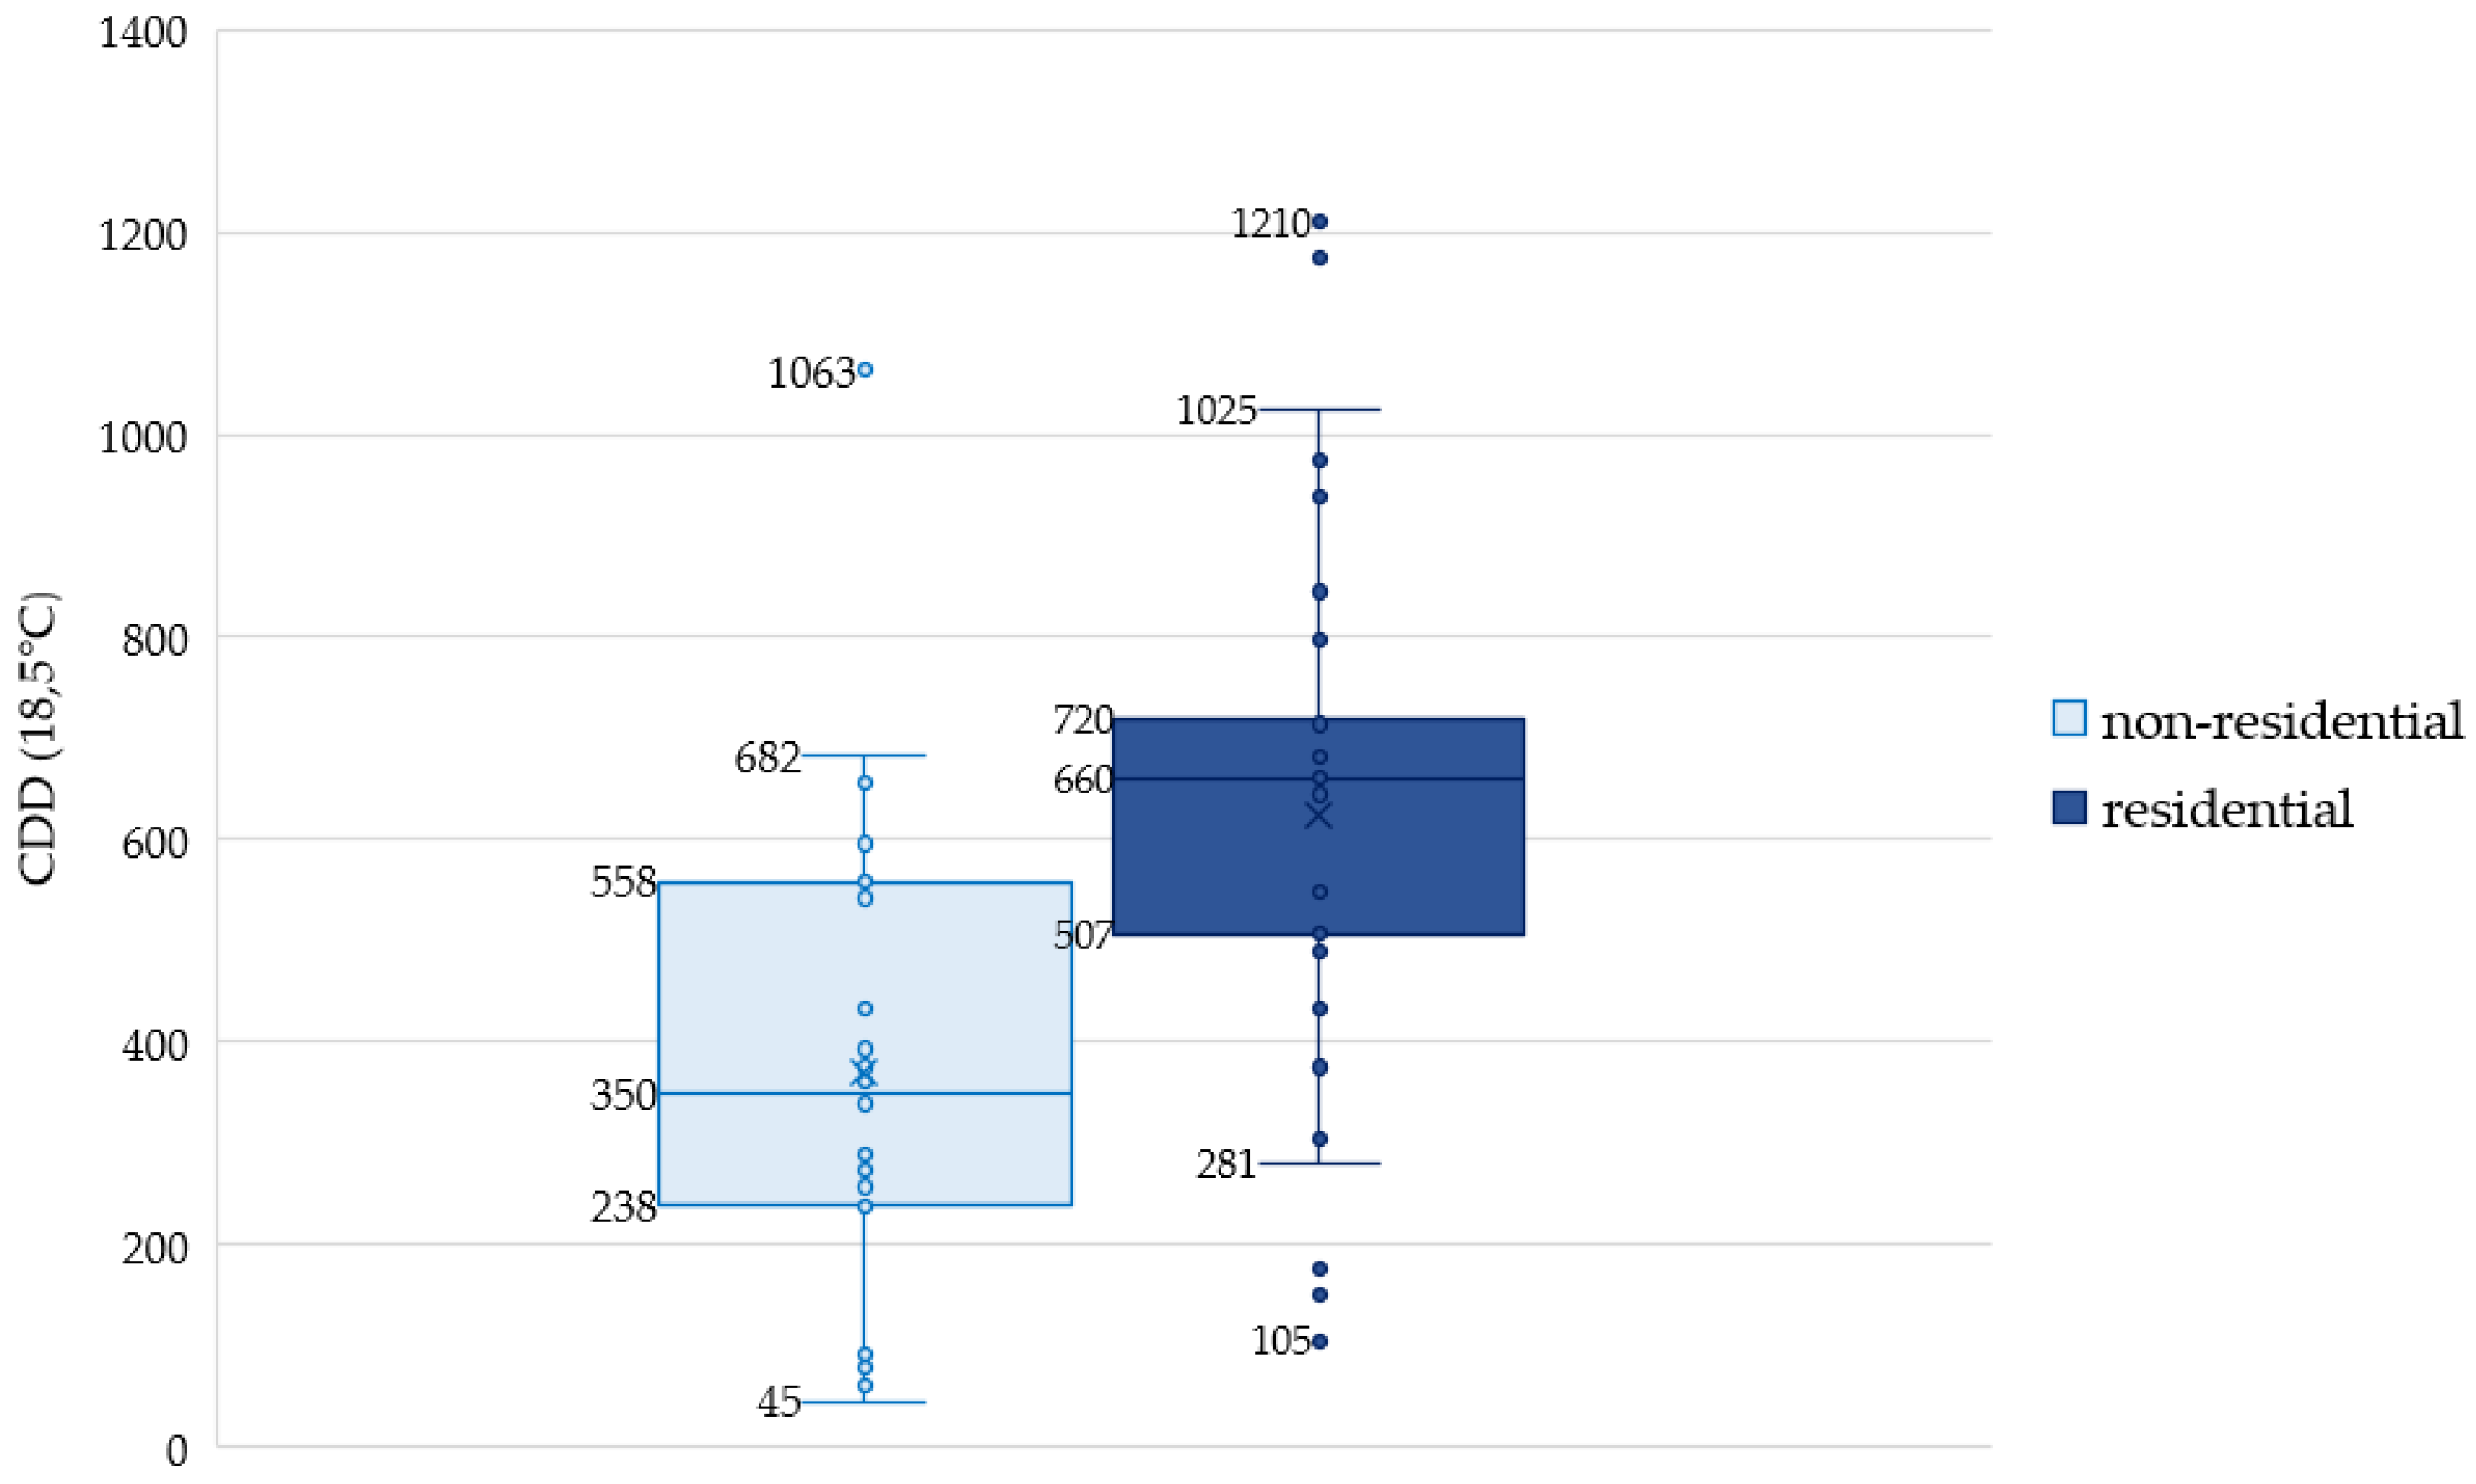
In addition, 25% of the selected nZEBs use a cooling system, divided between residential (46.5%) and non-residential (53.5%). The box plot diagrams in
Figure 20 shows the CDD values of the locations where the cooling system is installed both for residential and non-residential buildings in the sample.
The results showed in
Figure 20 highlights that, in most of the cases (75%—first quartile), a cooling system in new nZEB is installed if the CDD are higher than 238 for non-residential buildings and for CDD higher than 507 for residential buildings.
This difference confirms that the cooling energy consumption in non-residential buildings is higher than in residential ones [
26]. In fact, non-residential buildings have higher internal loads due to the considerable use of appliances and lighting [
27], and they are mainly occupied during daytime hours, i.e., when the radiation and temperatures are higher. Missed information, like wall-window ratio (WWR) or orientation, reduce the possibility to go deeply in the nZEB features’ analysis of their influence.
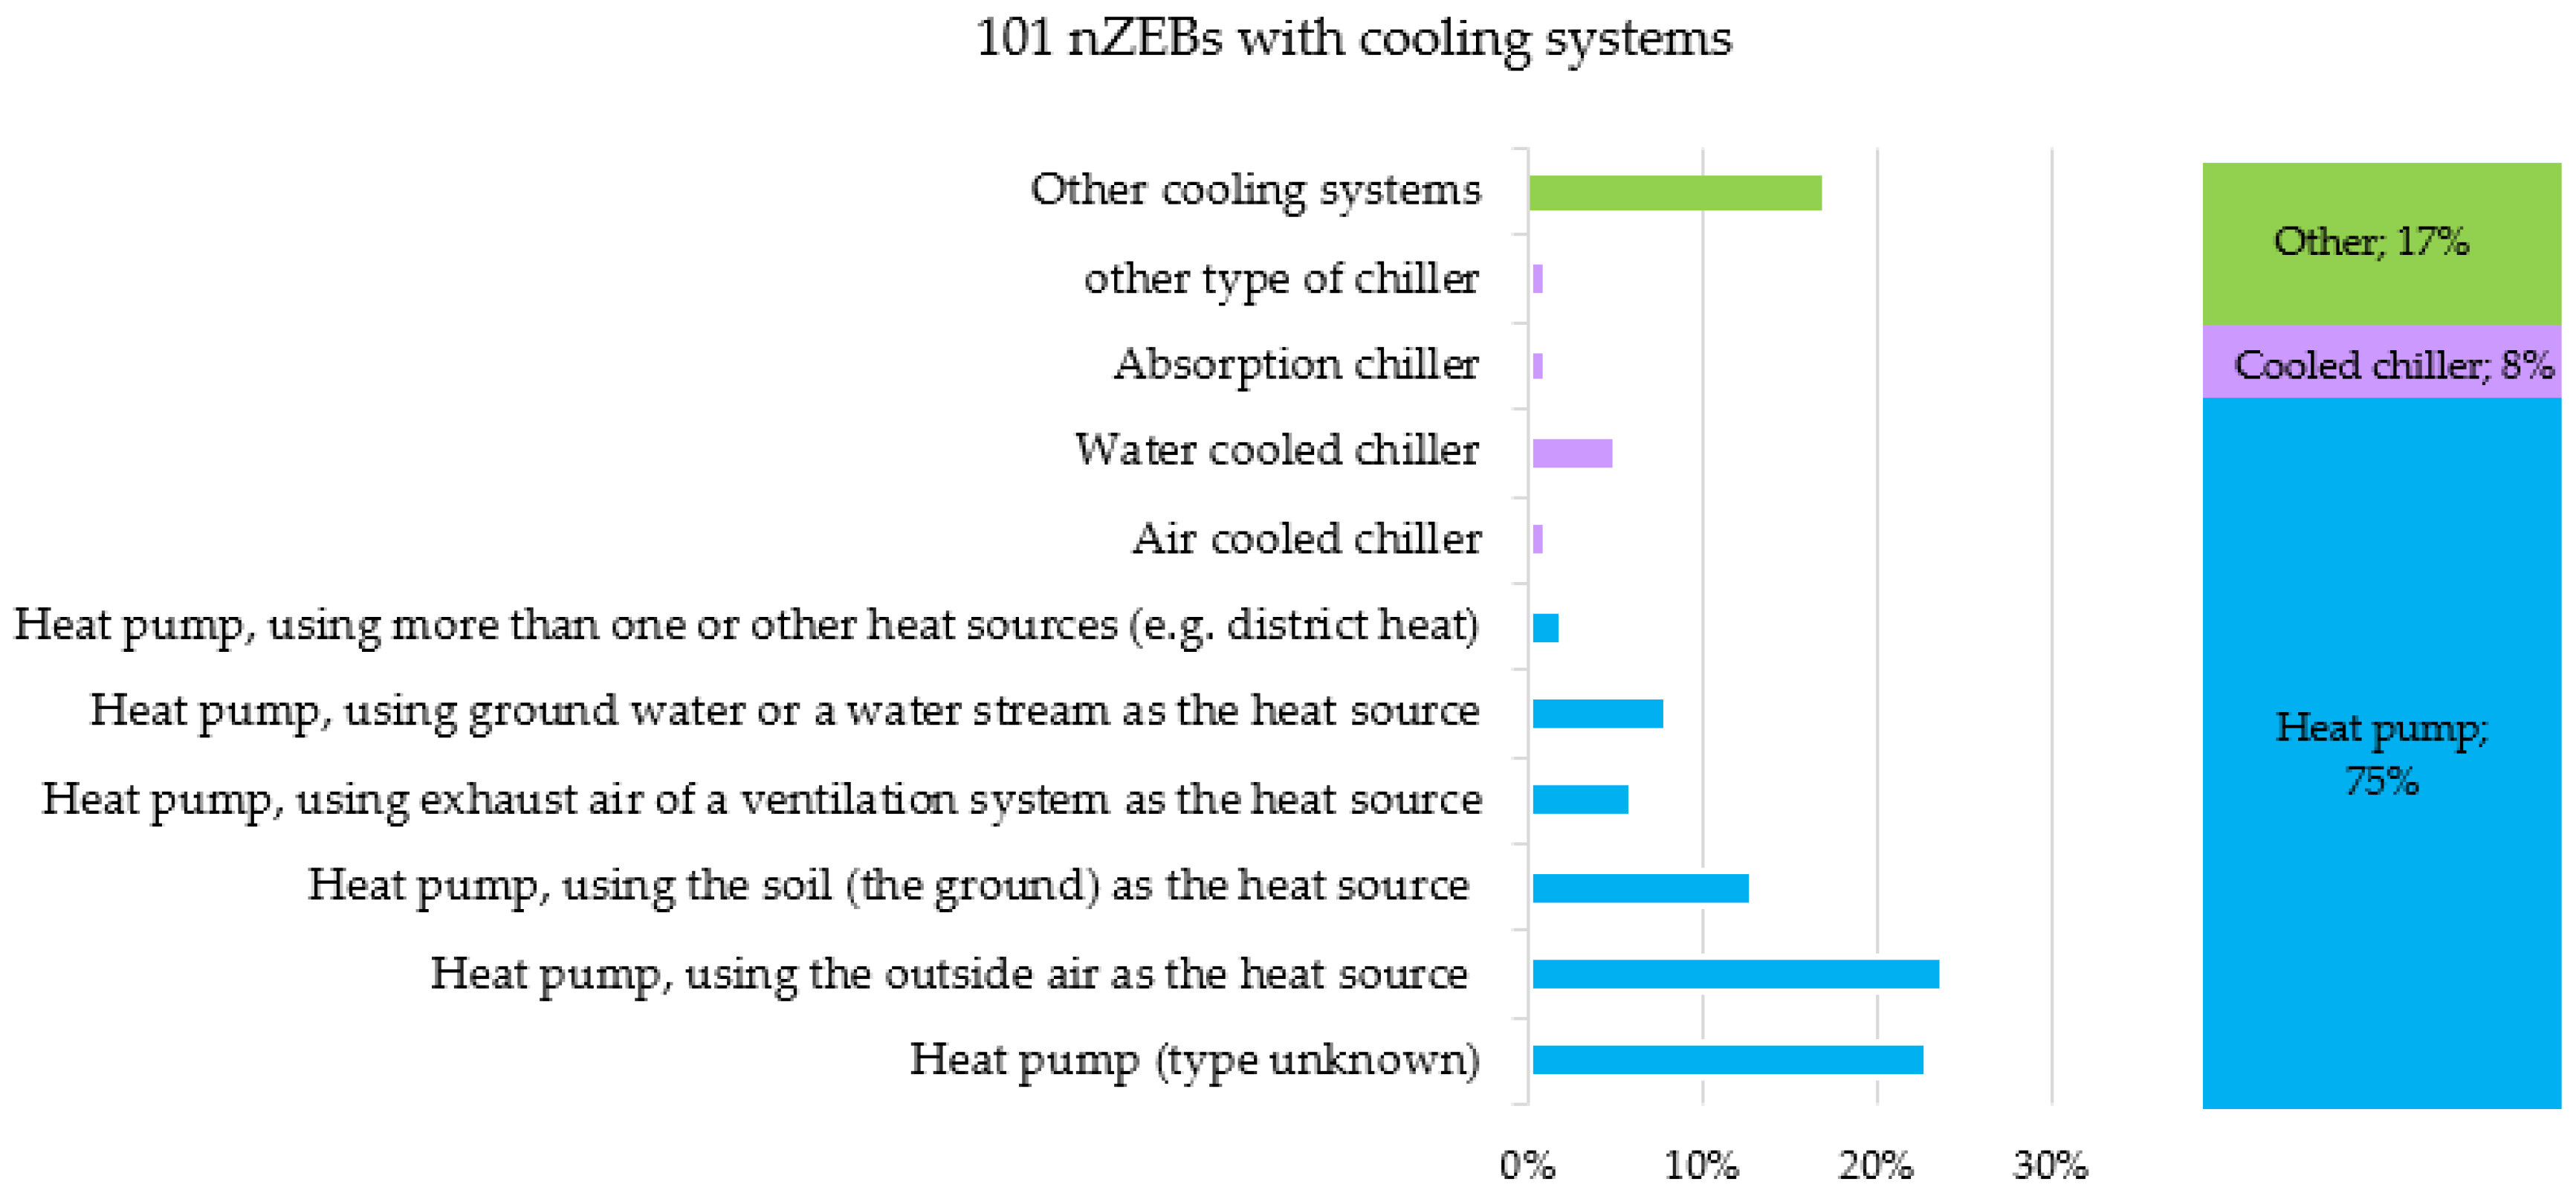
The most used cooling systems are “heat pumps” with a share of 75% and in particular the “heat pumps using the outside air as heat source” (share of 13%), as shown in
Figure 21. The advantages originated from this kind of technology, such as the satisfaction of the heating and cooling demands, the low energy costs and the environmental friendliness of this system (for the reduced carbon emissions), foster their implementation in nZEBs.
4.6. Passive Solutions
Passive solutions in buildings are climate-based design measures used to reduce the energy demand of the building by exploiting the natural resources available in the context (e.g., daylighting, natural ventilation, night cooling, etc.).
The use of these strategies result in being very important in high-energy efficient buildings, as their implementation can produce an important decrease of the energy demand. This potential reduction depends on the set of passive solutions applied and on the climate context. In cold climates, highly insulated and airtight buildings have to face high overheating risk [
28], which can be significantly reduced by means of natural ventilation [
29]. In warm climates, a reduction of internal and solar loads implies energy savings due to a reduction in the utilization of air conditioning.
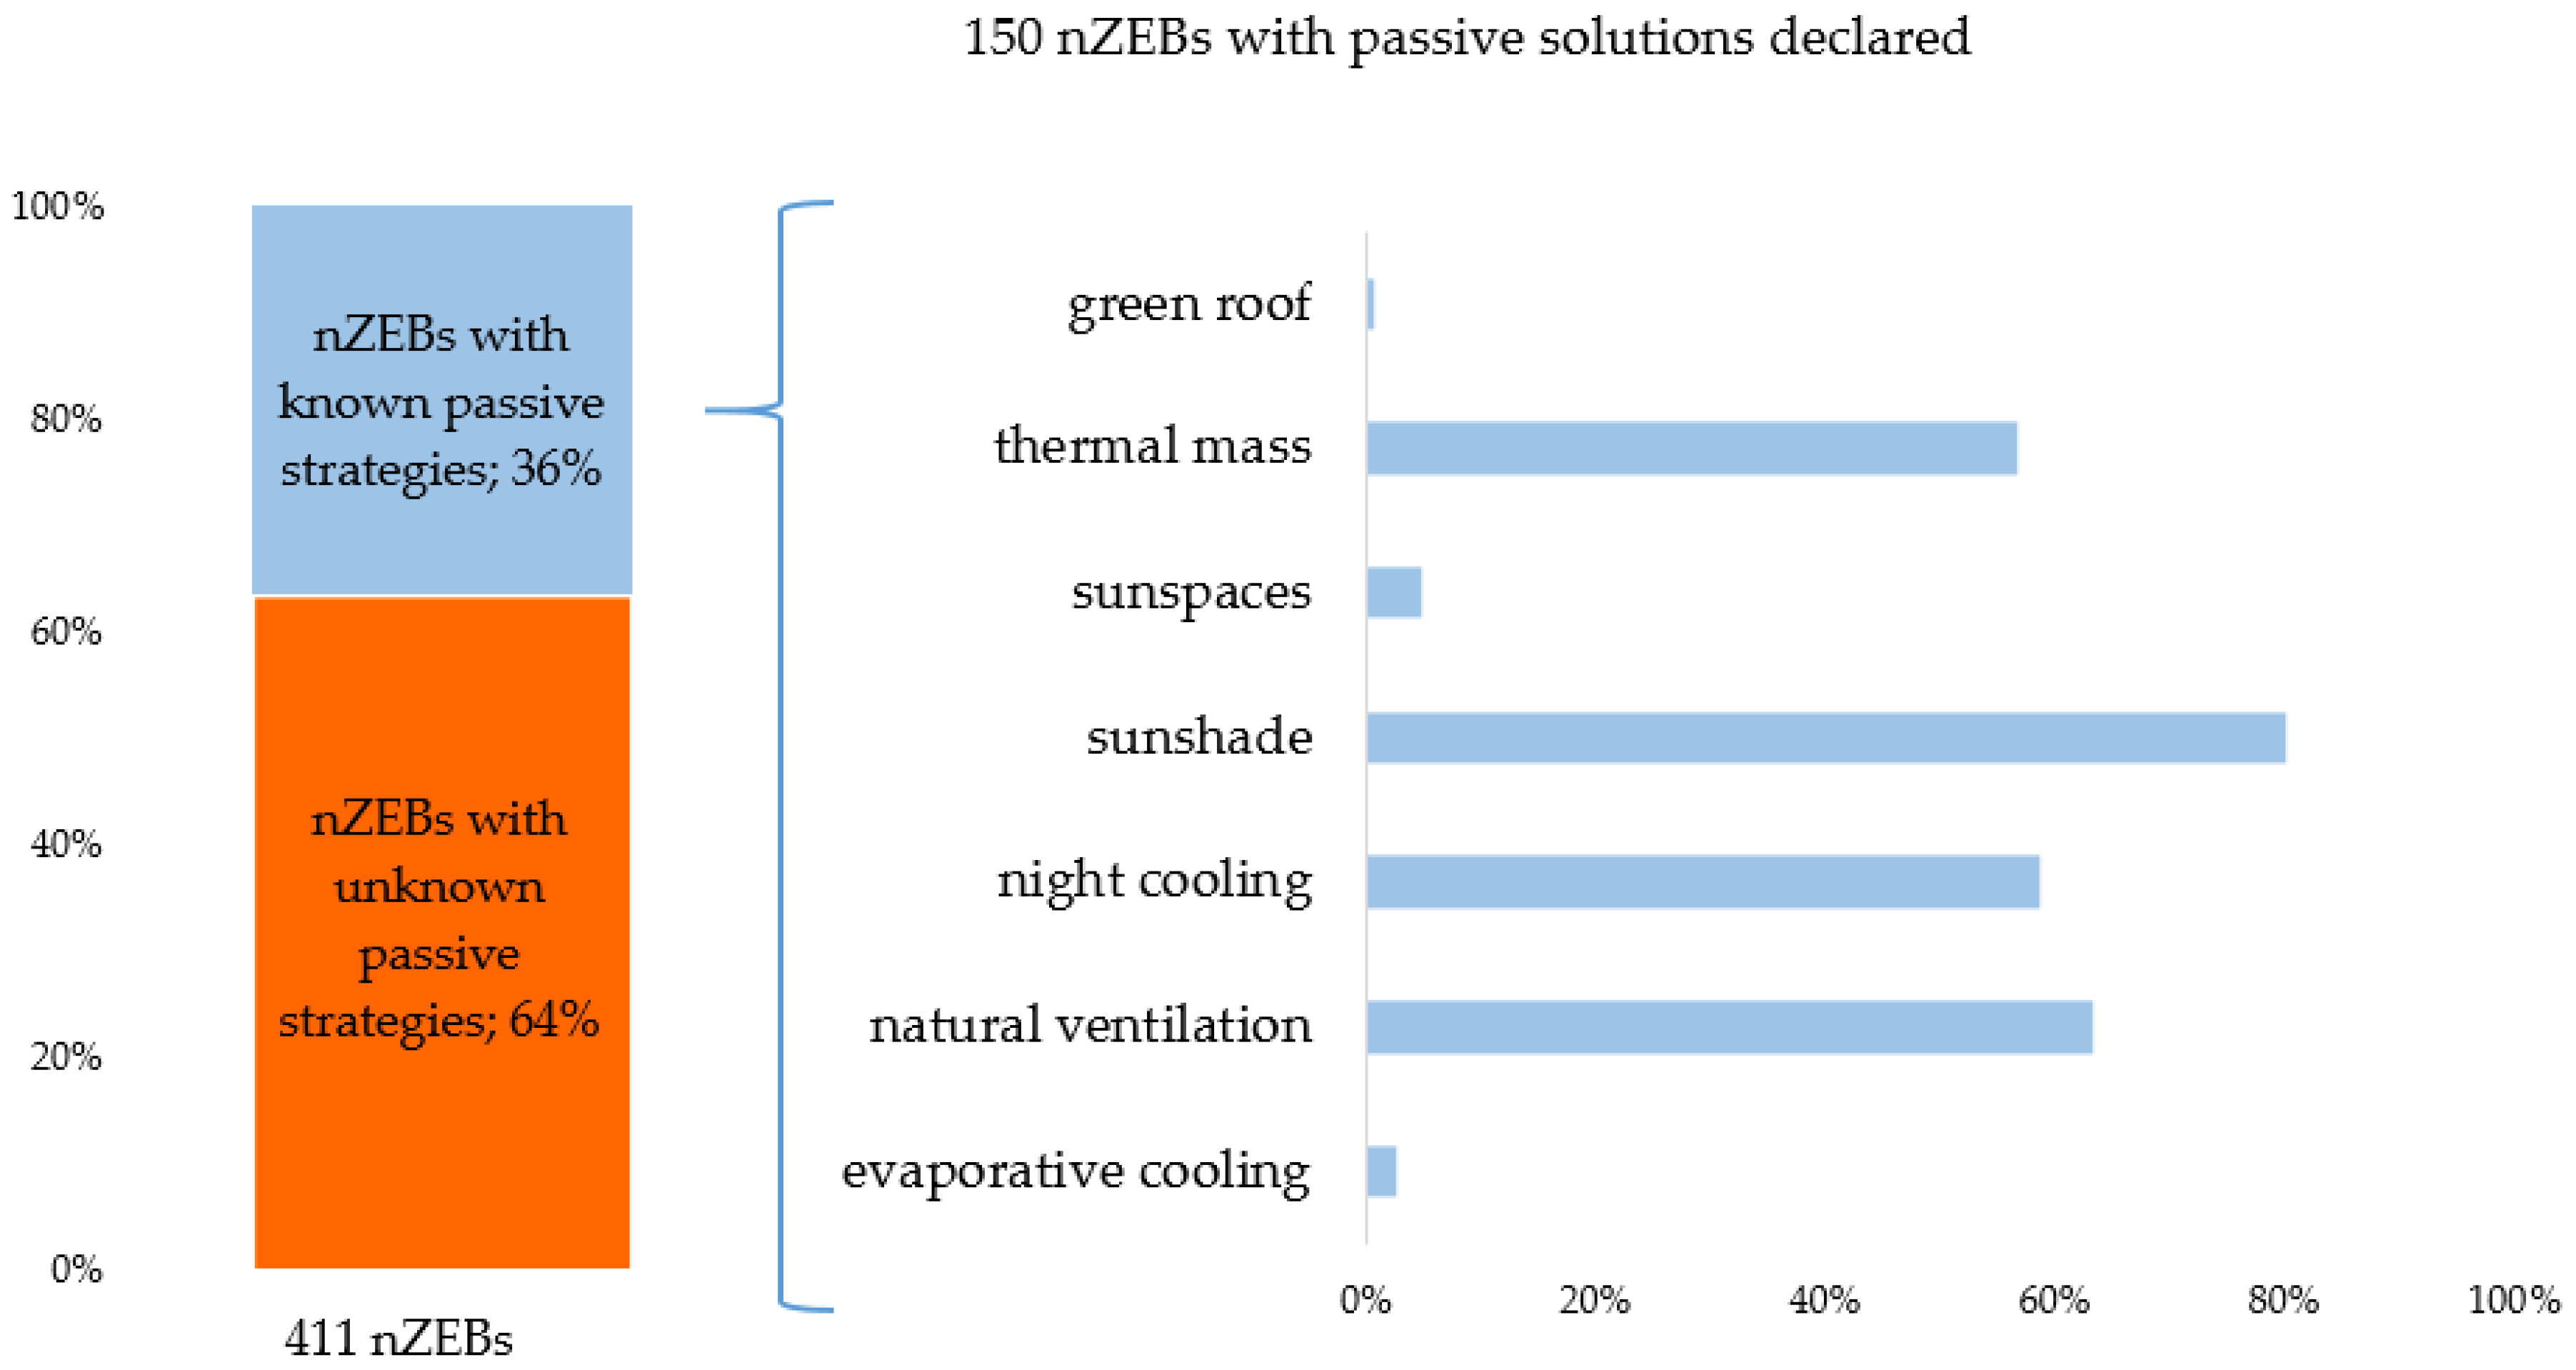
In this regard, the lack of information concerning the usage of passive strategies in the collected nZEBs is a weak point of this investigation. From one side, the missing data depend on the lack of answers due to the open questions used to outline the passive solutions. On the other side, some passive strategies are mandatory in some countries, such as shading systems or green roofs, and, hence, they could not be identified as additional passive solutions in the data sources. Although the high importance for the reduction of the energy demand, only 36% of the collected buildings (150 nZBEs) declared the use of passive strategies, as shown in
Figure 22.
Nevertheless, we can also deduce significant results from the reduced sample: in particular, the most mentioned passive strategies are the sunshade (80%), natural ventilation (63%), night cooling (59%) and thermal mass (57%).
4.7. Renewable Energy
In this part, the RE production systems were analyzed. In particular, the focus of the investigation was on Solar Thermal (ST) and Photovoltaic (PV) Systems installed.
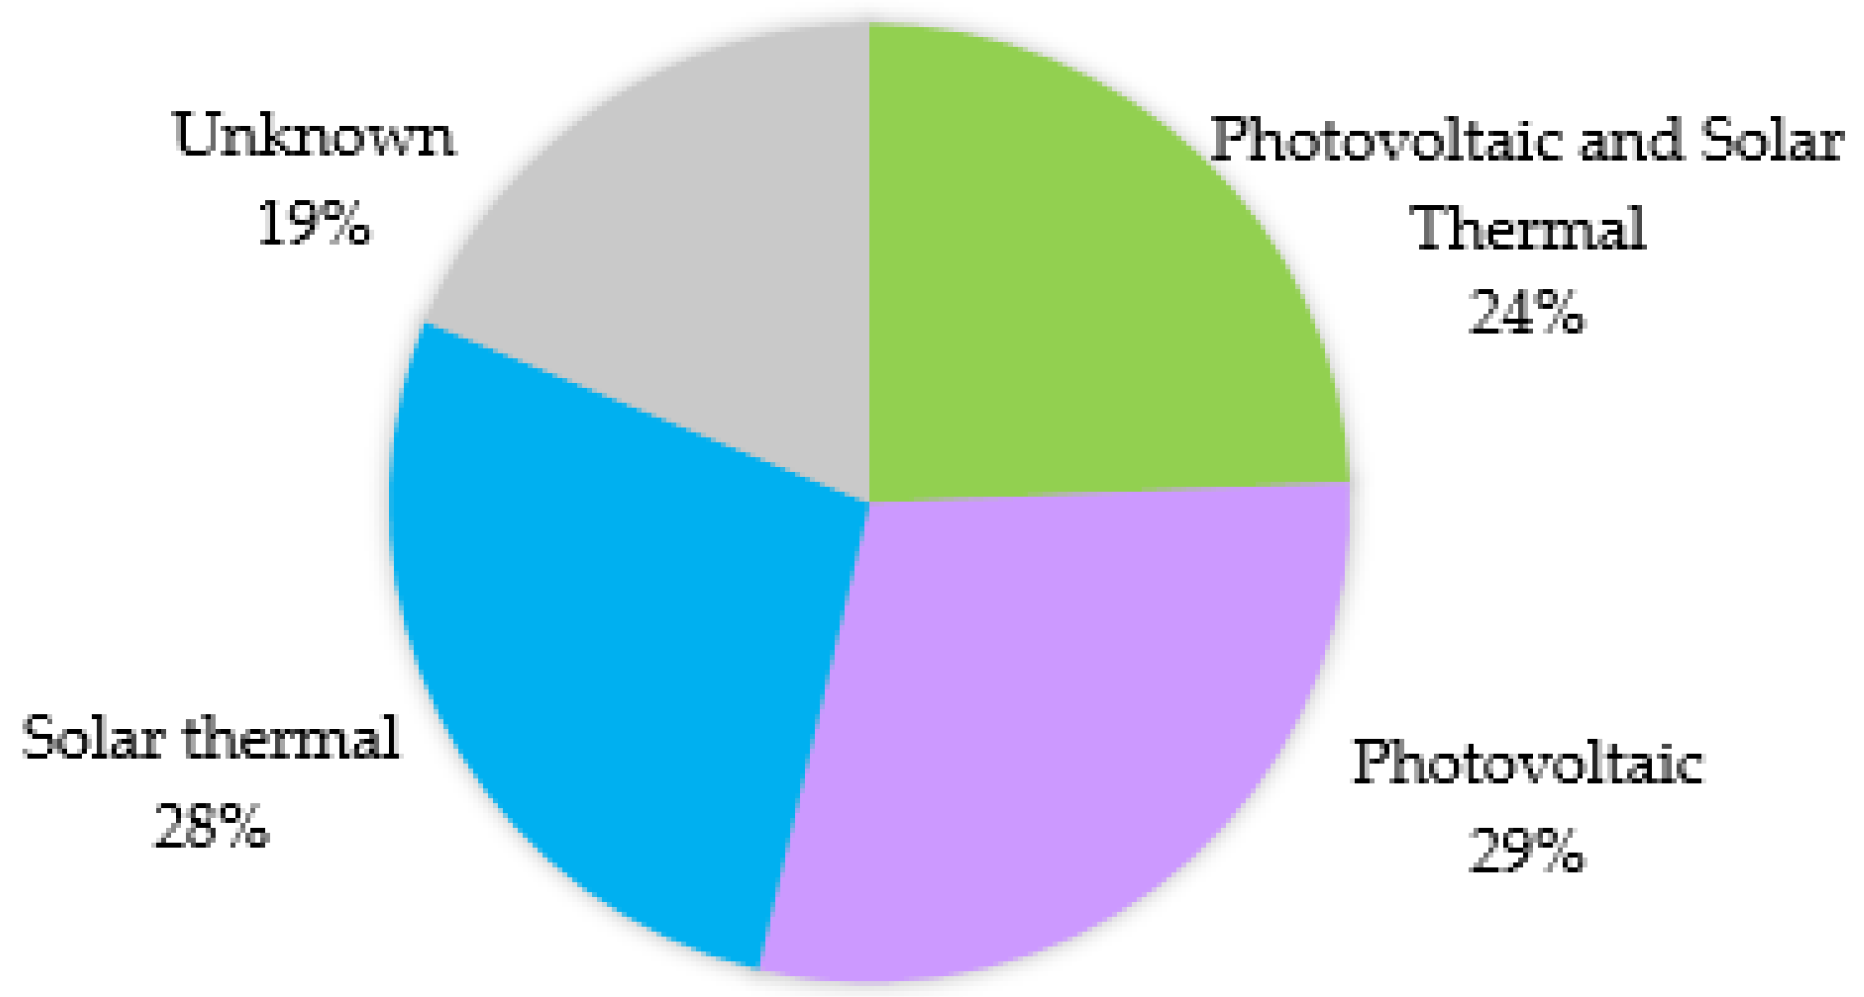
It is apparent that the integration of renewables is crucial in an nZEB; in fact, it occurs in 81% of the cases in the sample, since most of the national definitions require a minimum amount of energy produced from RES according to the indications of the EPBD. In particular, the installation of PV accounts for 29% of the sample, and ST systems is around 28%, as shown in
Figure 23. Finally, the 24% of nZEBs collected uses both systems (PV and ST systems), while, in 19% of the cases, the detailed information is missed.
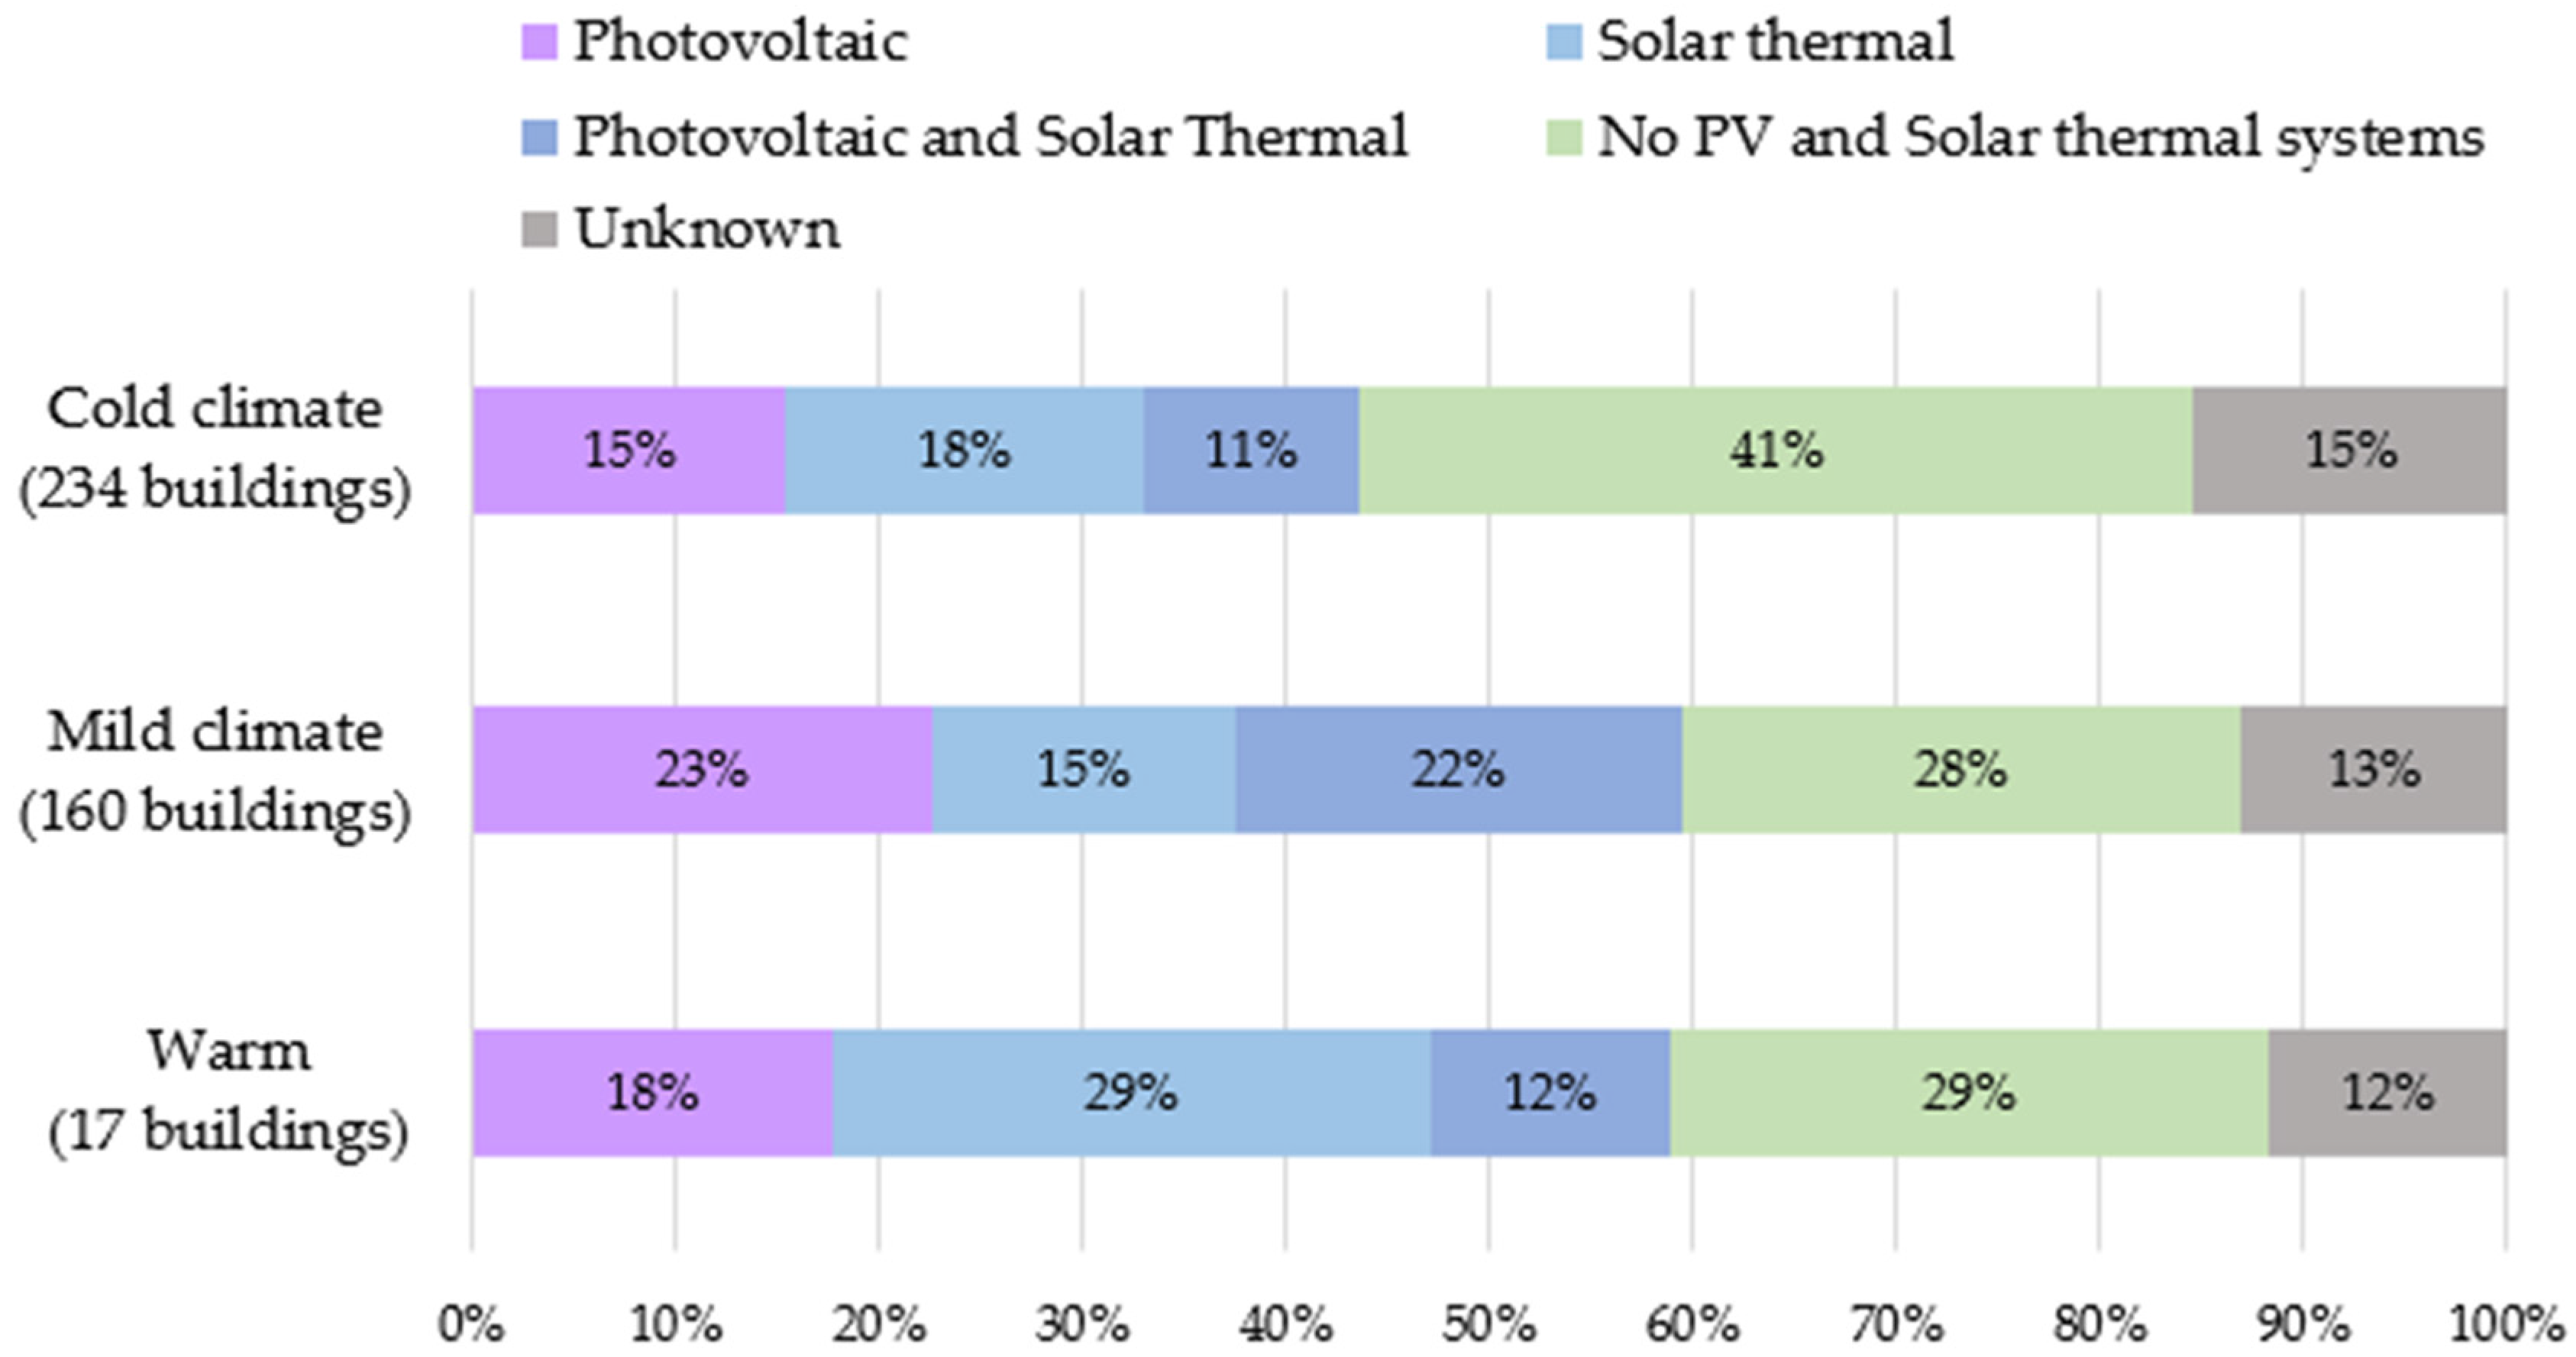
Figure 24 presents the share of different technologies for RES exploitation in the three defined climatic zones. It is possible to underline a reduced integration of PV and ST in nZEBs located in cold climates zone than in mild climates (44% vs. 60%), mainly due to less sunlight availability in higher latitudes. In particular, while the cold climate zone does not present a significant wide diffusion of a specific technology, the mild climate zone shows a high share of photovoltaic system installed (45% considering plants coupled with ST). Finally, in the warm climate zone, although the number of buildings in the sample reduced and the representativeness of the sample is lower, a higher share of nZEBs with ST is observed (41% considering plants coupled with PV).
Figure 25 shows the share of buildings with one or more renewable energy systems installed, also including the heat pumps in the considered technologies.
It is important also to point out that, for cold climates, six percent of the buildings (26 buildings) declared no renewable energy system (heat pumps, PV or ST) installed. This share results in being very low in relation to the previous outcome of
Figure 24, where 41% of cases declared no PV or ST systems installed. This information further highlights the large use of heat pumps in cold climates. Similar considerations are valuable also for mild and warm climates. The thermal system used in all these buildings for heating and DHW are traditional or condensing boiler fuelled mainly by natural gas (96%) and direct electric technologies (4%), without any photovoltaic, thermal panels, heat pumps or other bio-fuel system installed. Furthermore, these buildings are located in mild-cold climates where heating during the winter is necessary. The lack of use of renewable energy systems in some nZEBs is mainly due to the construction period of these buildings, since, in some cases, they were built before the EPBD implementation at the national level, and due to the lack of information during the data collection.
5. Conclusions
This paper aims to identify the main technologies adopted across Europe in the construction as well as in the renovation of buildings towards the target nZEBs. In particular, we evaluated to which extent the adoption of the technologies is influenced by the climate conditions.
The analysis was based on a sample of 411 representative European high energy performance buildings (new and renovated, residential and non-residential) mainly located in mild-cold climates, whose features have been collected within the EU IEE ZEBRA2020 project.
As a general outcome, we can deduce that the climate conditions do not represent the main parameter affecting the definition of the technology package to achieve the nZEB target. Nevertheless, we can highlight that the availability of natural sources in the zones (i.e., solar irradiation) affects the use of renewable technologies. In fact, we observed a reduced share of PV and ST in cold climates and an increased share in mild and warm climates, due to the higher irradiation and production potential that enhance the cost-effectiveness of the technologies.
This result was confirmed by the survey to building professionals carried out within EU IEE ZEBRA2020 project [
2]. In fact, only 3.5% of the respondents selected “the adaptability to climatic context” as an important criteria for adopting a specific technology, while the “investment costs” (27%), “energy performance” (16%) and “operational cost” (14%) were the preferred ones.
The heating demand analysis shows that energy efficiency technological solutions are selected independently to the climate condition. The heating demand values of the buildings are similar in all climates, as well as the thermal transmittance of the envelope components (both transparent and opaque). This is mainly influenced by the similar national envelope minimum requirements defined across Europe. Moreover, the HDD and CDD do not even influence so strongly the choice of the insulating materials and their associated properties (high or low thermal inertia).
Concerning the active solutions, the recurrent technologies are the mechanical ventilation, with a share of 89% in the sample and a high penetration of heat recovery systems (able to supply heating, DHW and cooling demand). In cold climate zones, the district heating systems is widely used, accounting for 25%.
Within the analyzed sample, the cooling system is installed in 25% of the buildings, and we identified the thresholds for the installation of such systems around 240 CDD for non-residential buildings, and 510 CDD for residential ones.
As a general remark, it is important to point out that the building data collection was carried out from EPCs, building databases and reports on energy efficiency buildings. The size of the analyzed buildings sample is relatively small (411 buildings) due to the reduced amount of available data, and the lack of existing nZEB information; moreover, it has different levels of accuracy as a result of the heterogeneous collection process (EPCs, building databases and reports on energy efficiency buildings). In some cases, the limited level of detail of the data reduced the possibilities to investigate deeply the technology market penetration and its relation to the climate conditions.
Moreover, one of the most critical issues across Europe is the heterogeneous calculation approach for the energy performance indicators. The EPBD introduced the general nZEB concept to the European Member States, while national and regional regulations defined tailored calculation methods and targets in terms of both primary energy and share of renewable energy. This means that performance indicators are evaluated with different calculation methods, boundary conditions (i.e., base internal temperature), and conversion factors. At the European level, more efforts should be made to harmonize the calculation methods and the boundary conditions, and to make building energy consumption data available. Moreover, an open accessible European EPC cadaster, also including construction costs and actual energy consumption data, would represent a strategic tool to define the nZEB learning curve, assess the relative rate of penetration in the building stock, and give meaningful information to manage decision process of relevant stakeholders (developers, designers, builders, and manufacturers).
Further analysis should be performed increasing the number of case studies, especially in warm climates, and investing more efforts during the data collection phase, raising the detail level and taking into account the local specificities, as well as the minimum requirements provided by law and incentives as the main drivers for the technologies. Future studies should include the analysis of the costs and the influence on the adoption of the technologies, also considering that the nZEB requirements should be set according to cost-optimal levels and Life Cycle Assessment (LCA) as requested in the EPBD recast.
Nevertheless, this work is a pioneering study on European nZEB stock and the results of the analysis present an overview of the main technologies adopted in new and renovated nZEBs in Europe, and represent an important step for the definition of design guidelines with the most effective solutions. Furthermore, the identification of the most used technology solutions in relation to the climate condition should be used from building manufactories in order to identify the building market needs and address the efforts.


