
Mapping the Dynamics of Contemporary PRRSV-2 Evolution and Its Emergence and Spreading Hotspots in the U.S. Using Phylogeography

 ,
, 
 , , and
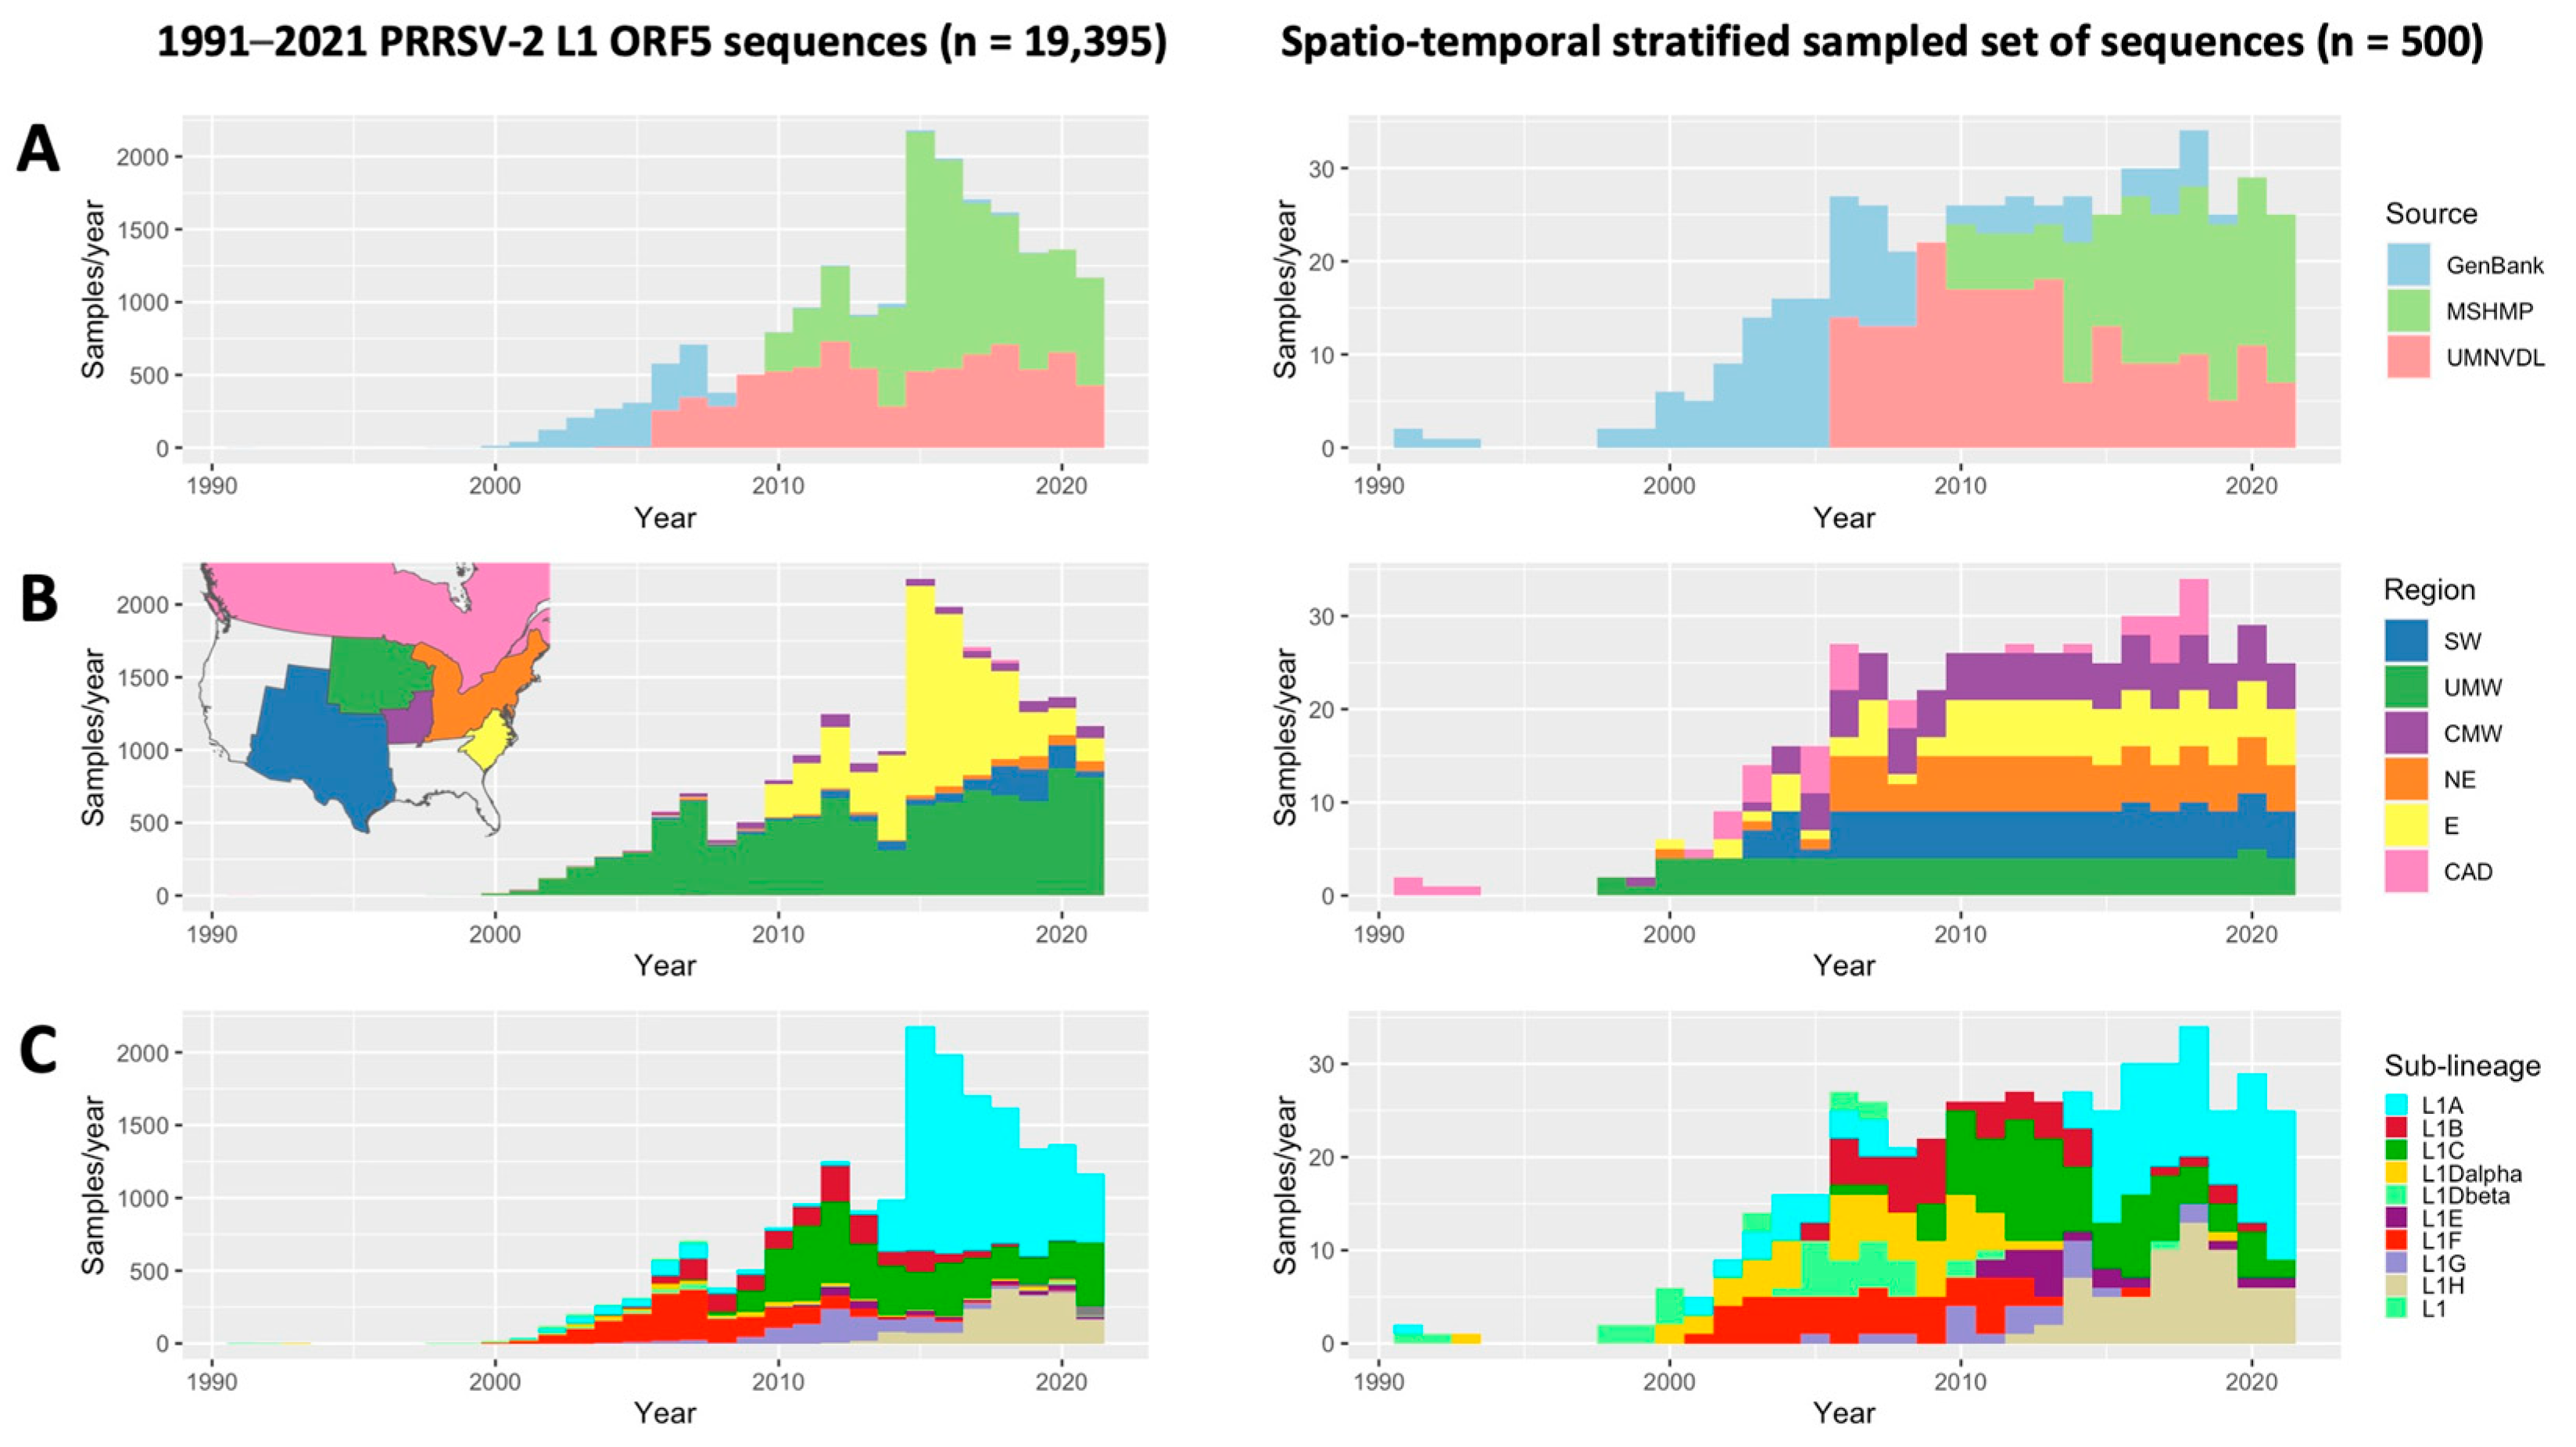
Abstract
:1. Introduction
2. Materials and Methods
2.1. Data Sources
2.2. Subsampling
2.3. Phylogeographic Analyses
2.4. Selective Pressure Analysis
3. Results
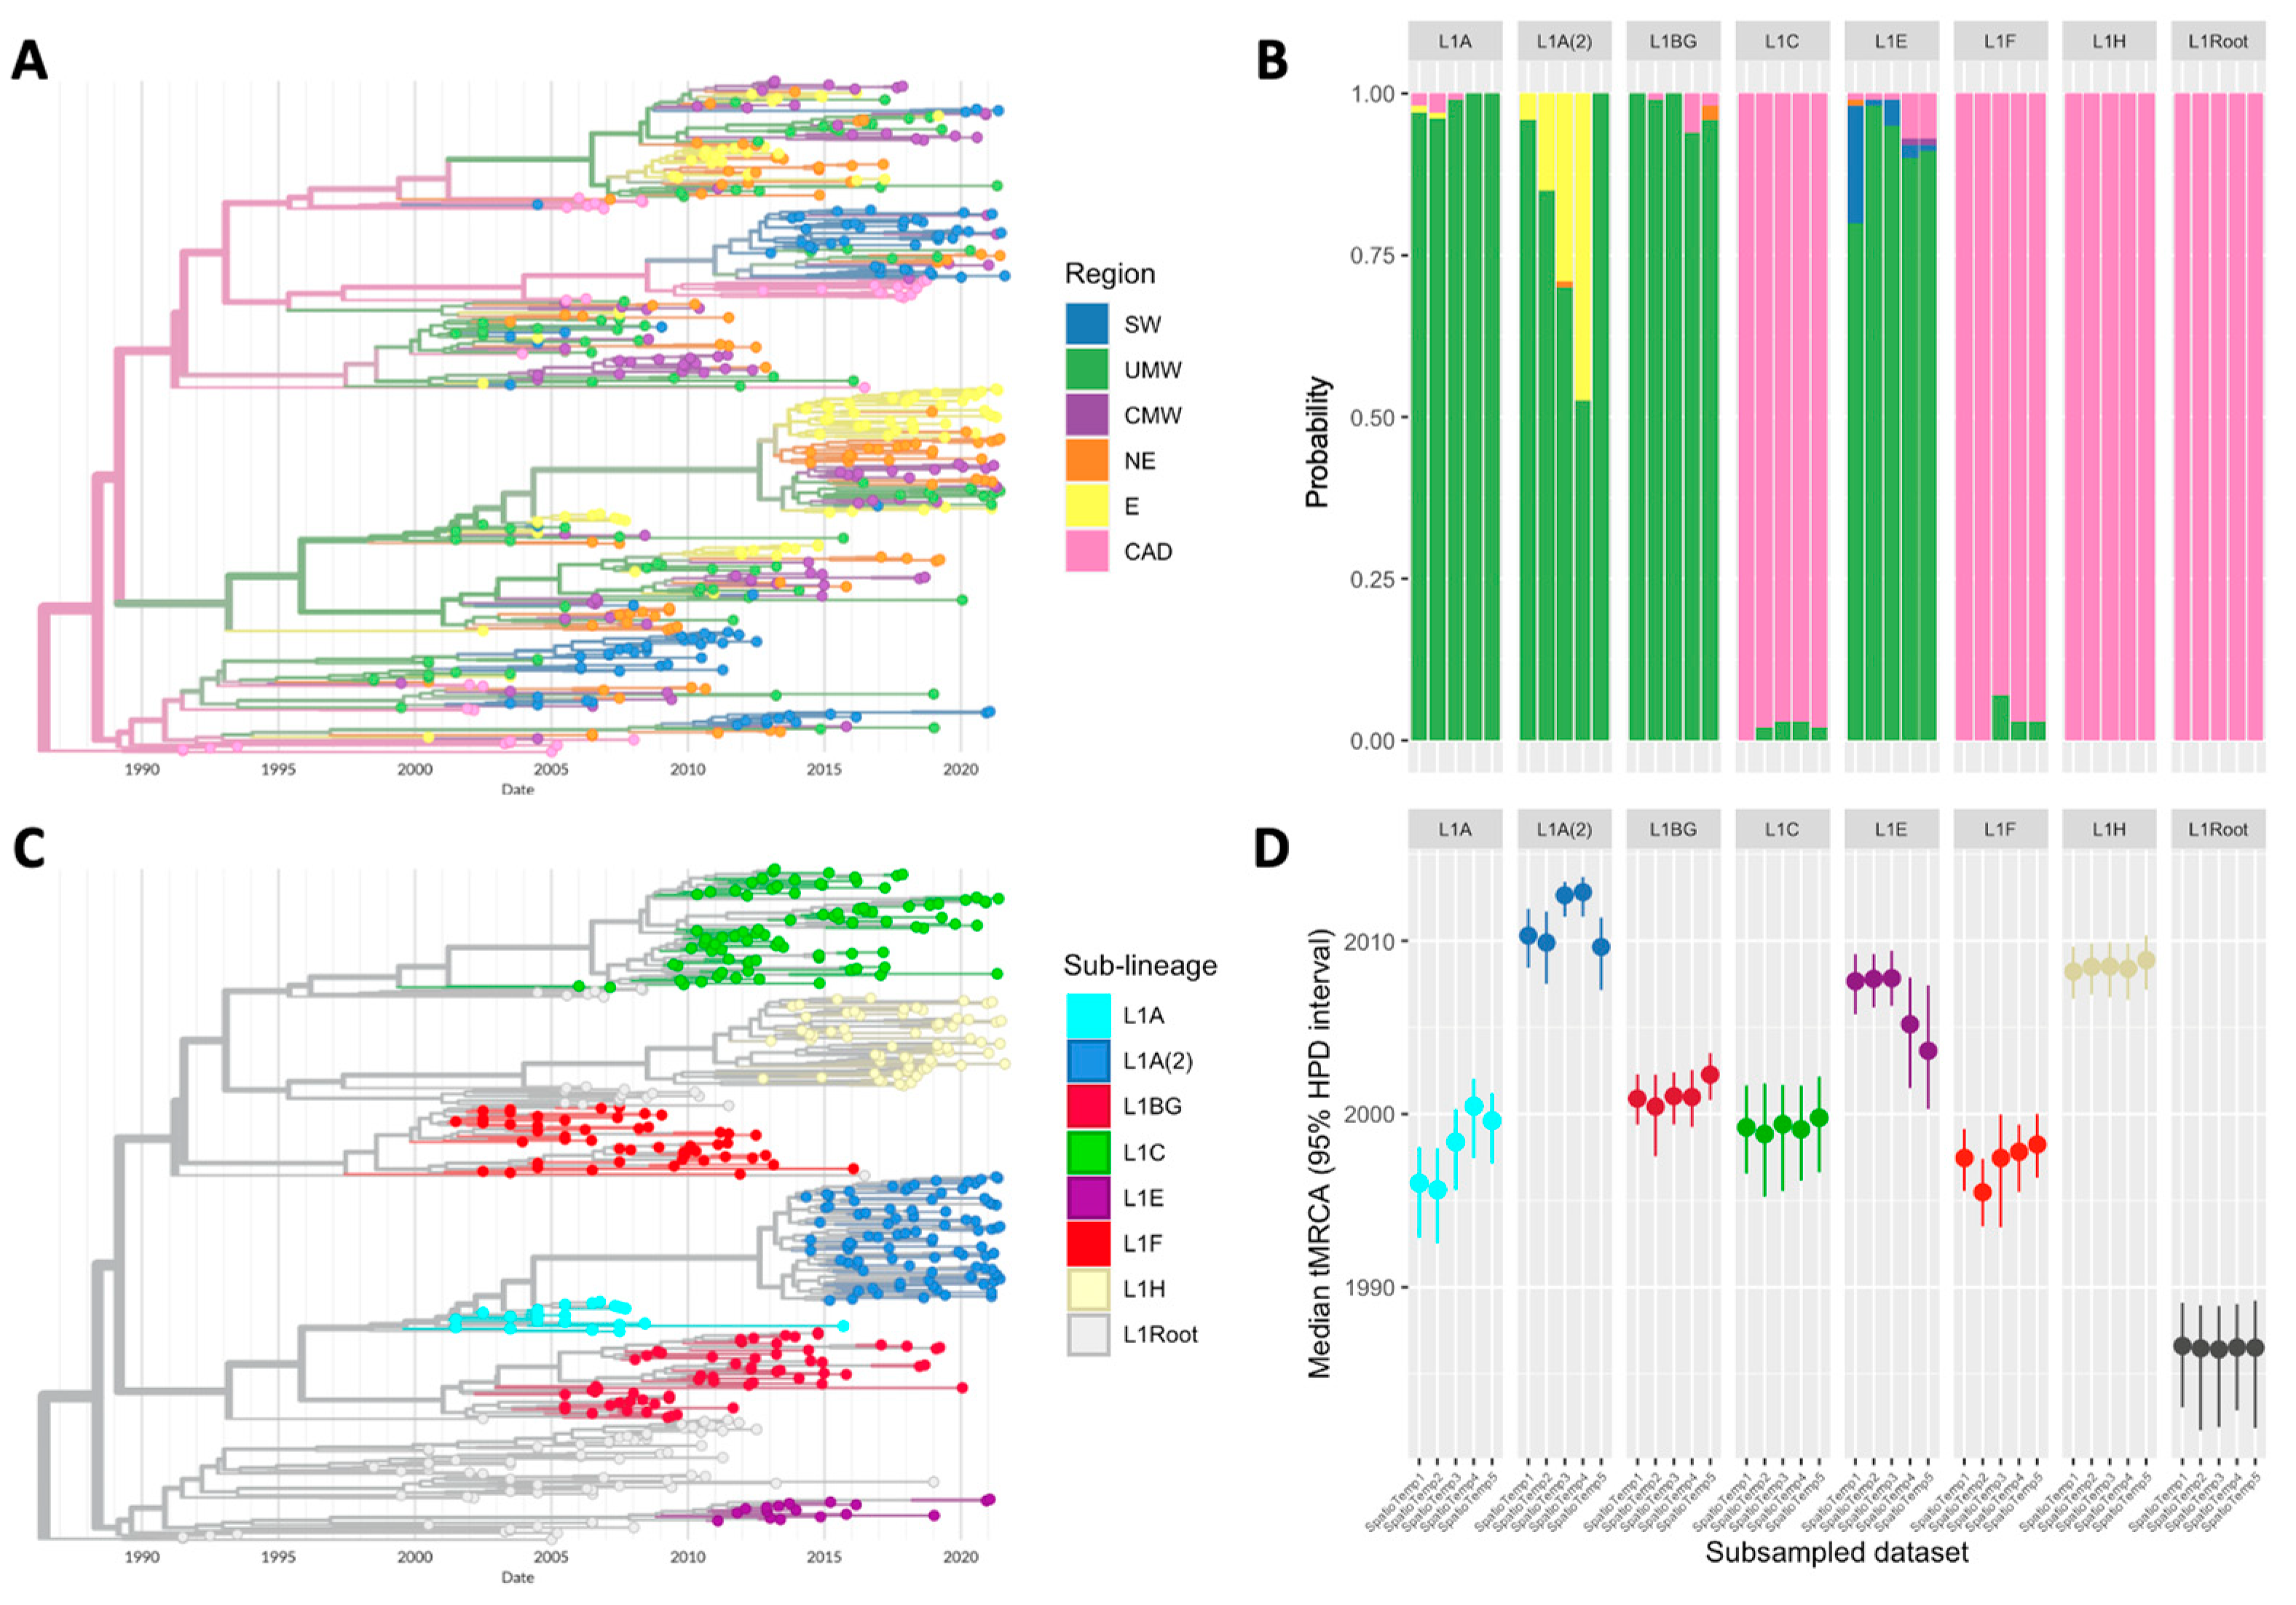
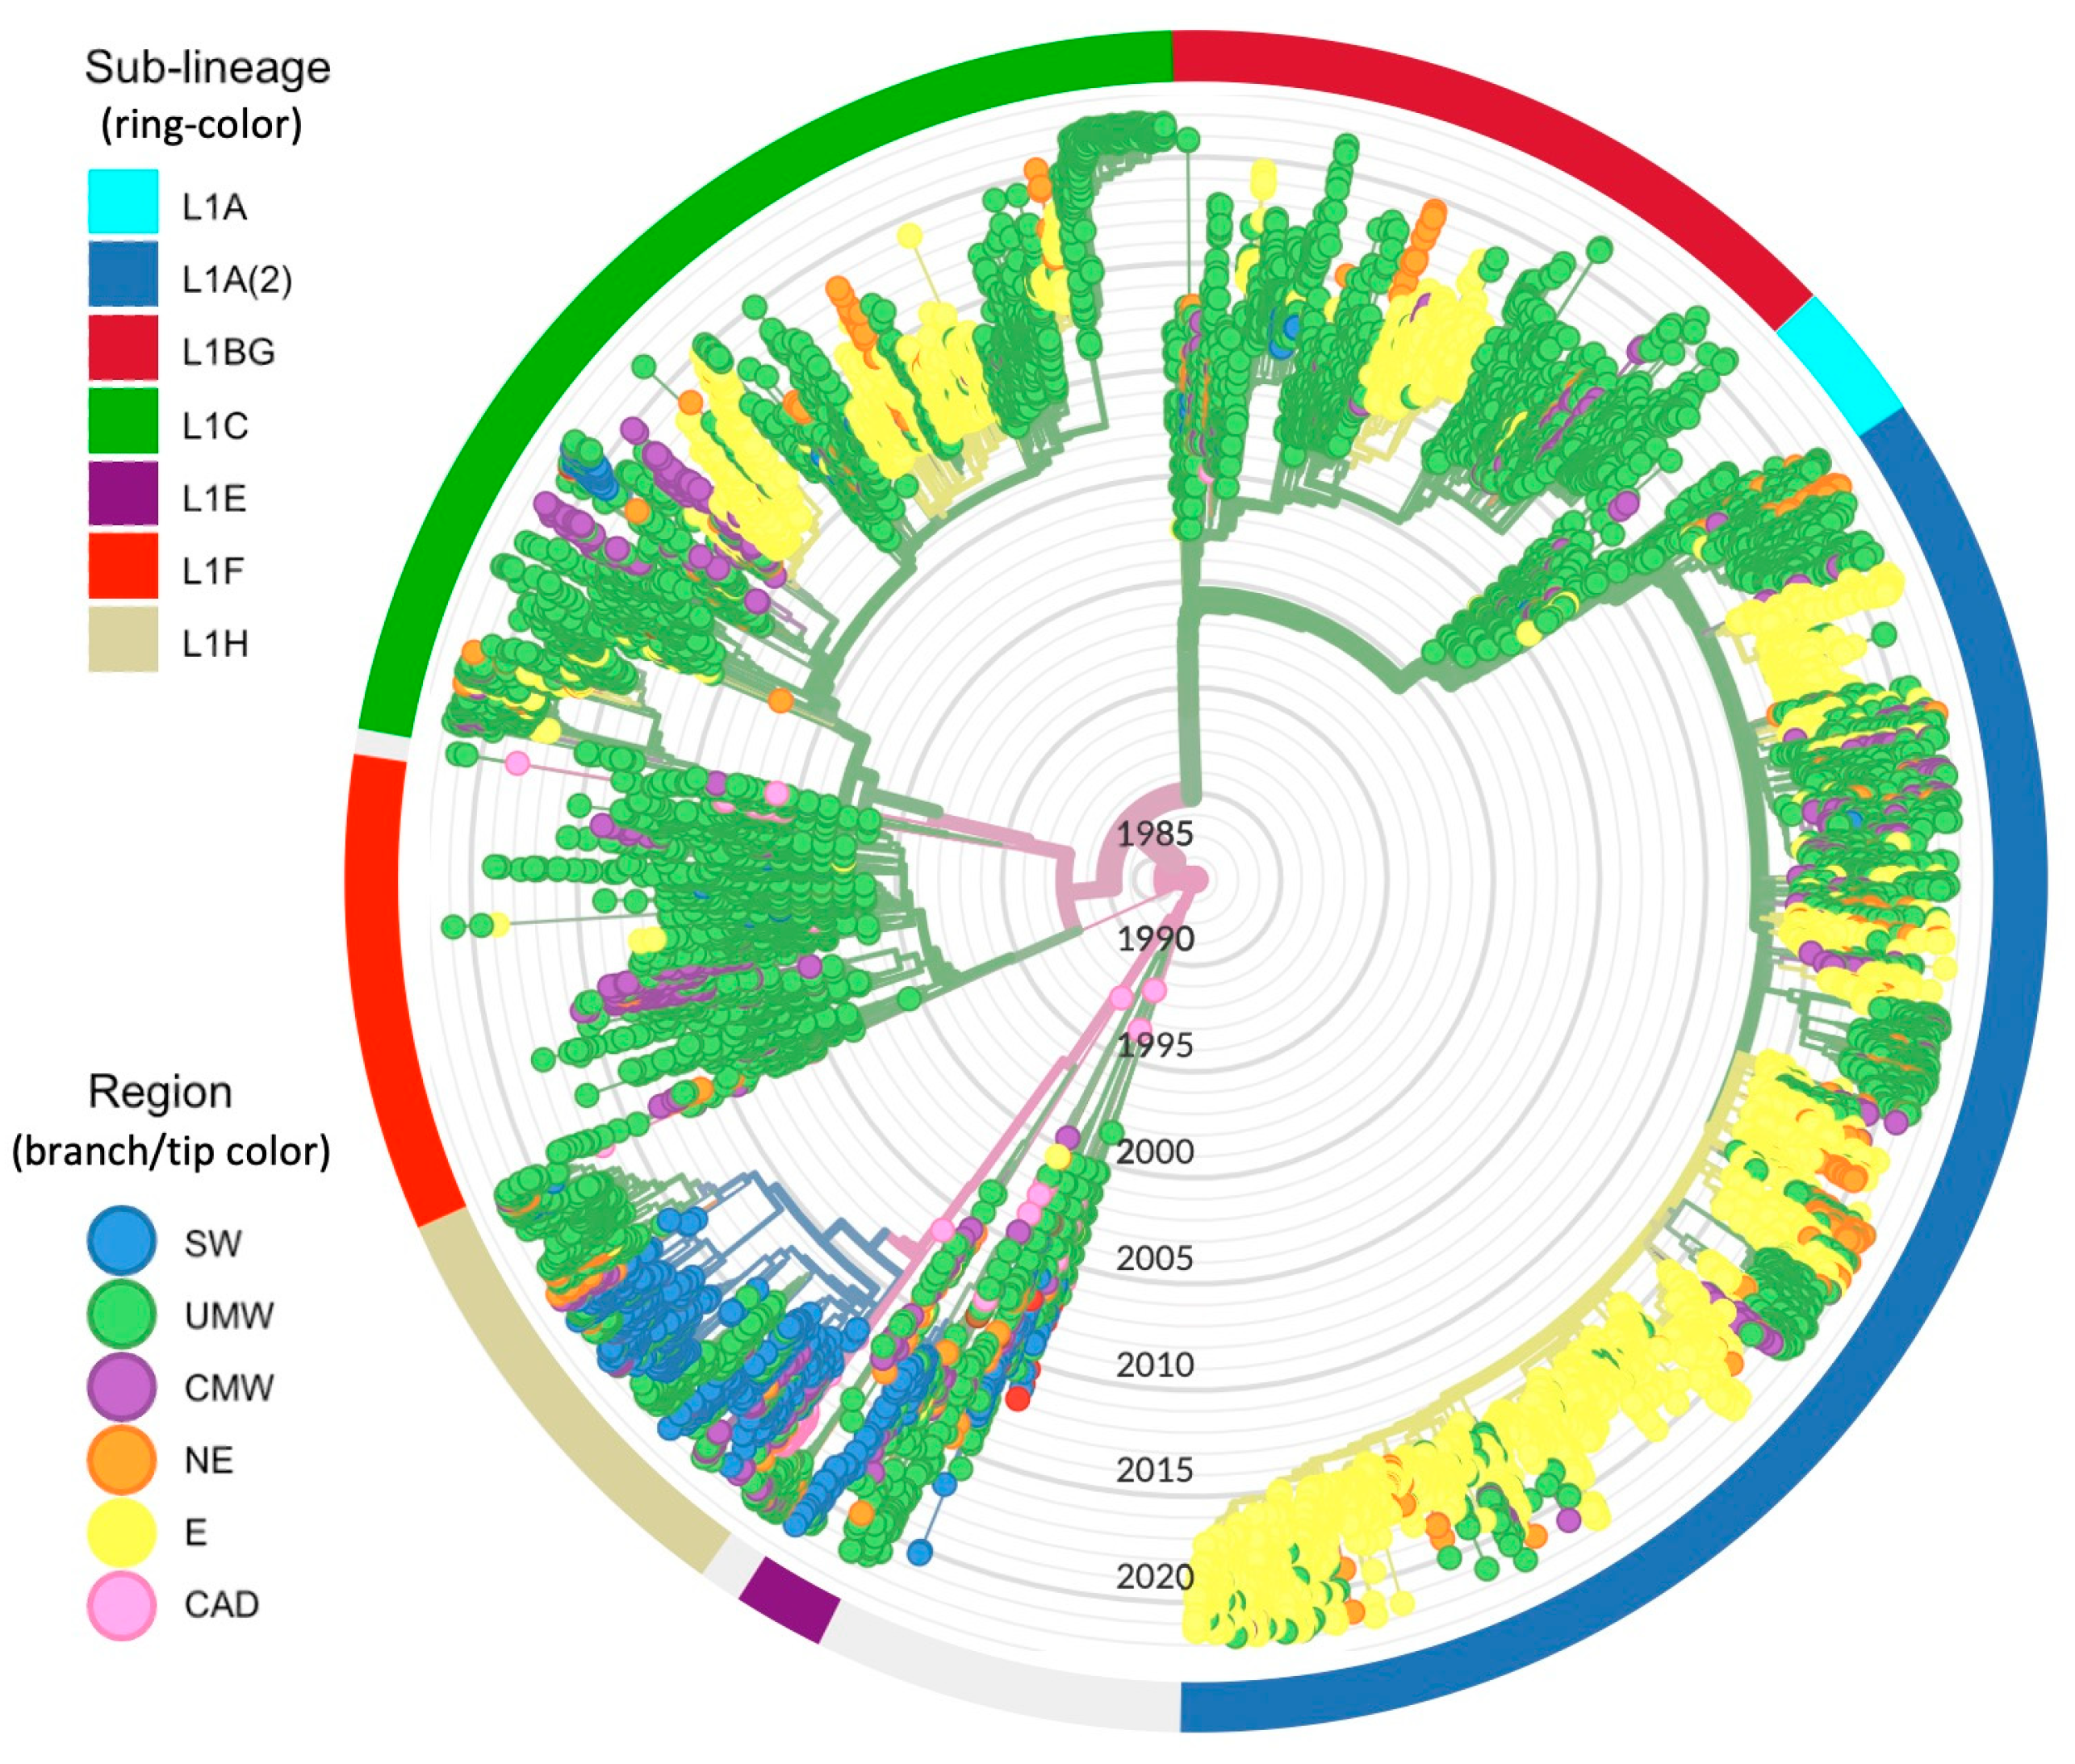
3.1. Origin of PRRSV-2 L1 and Its Sub-Lineages
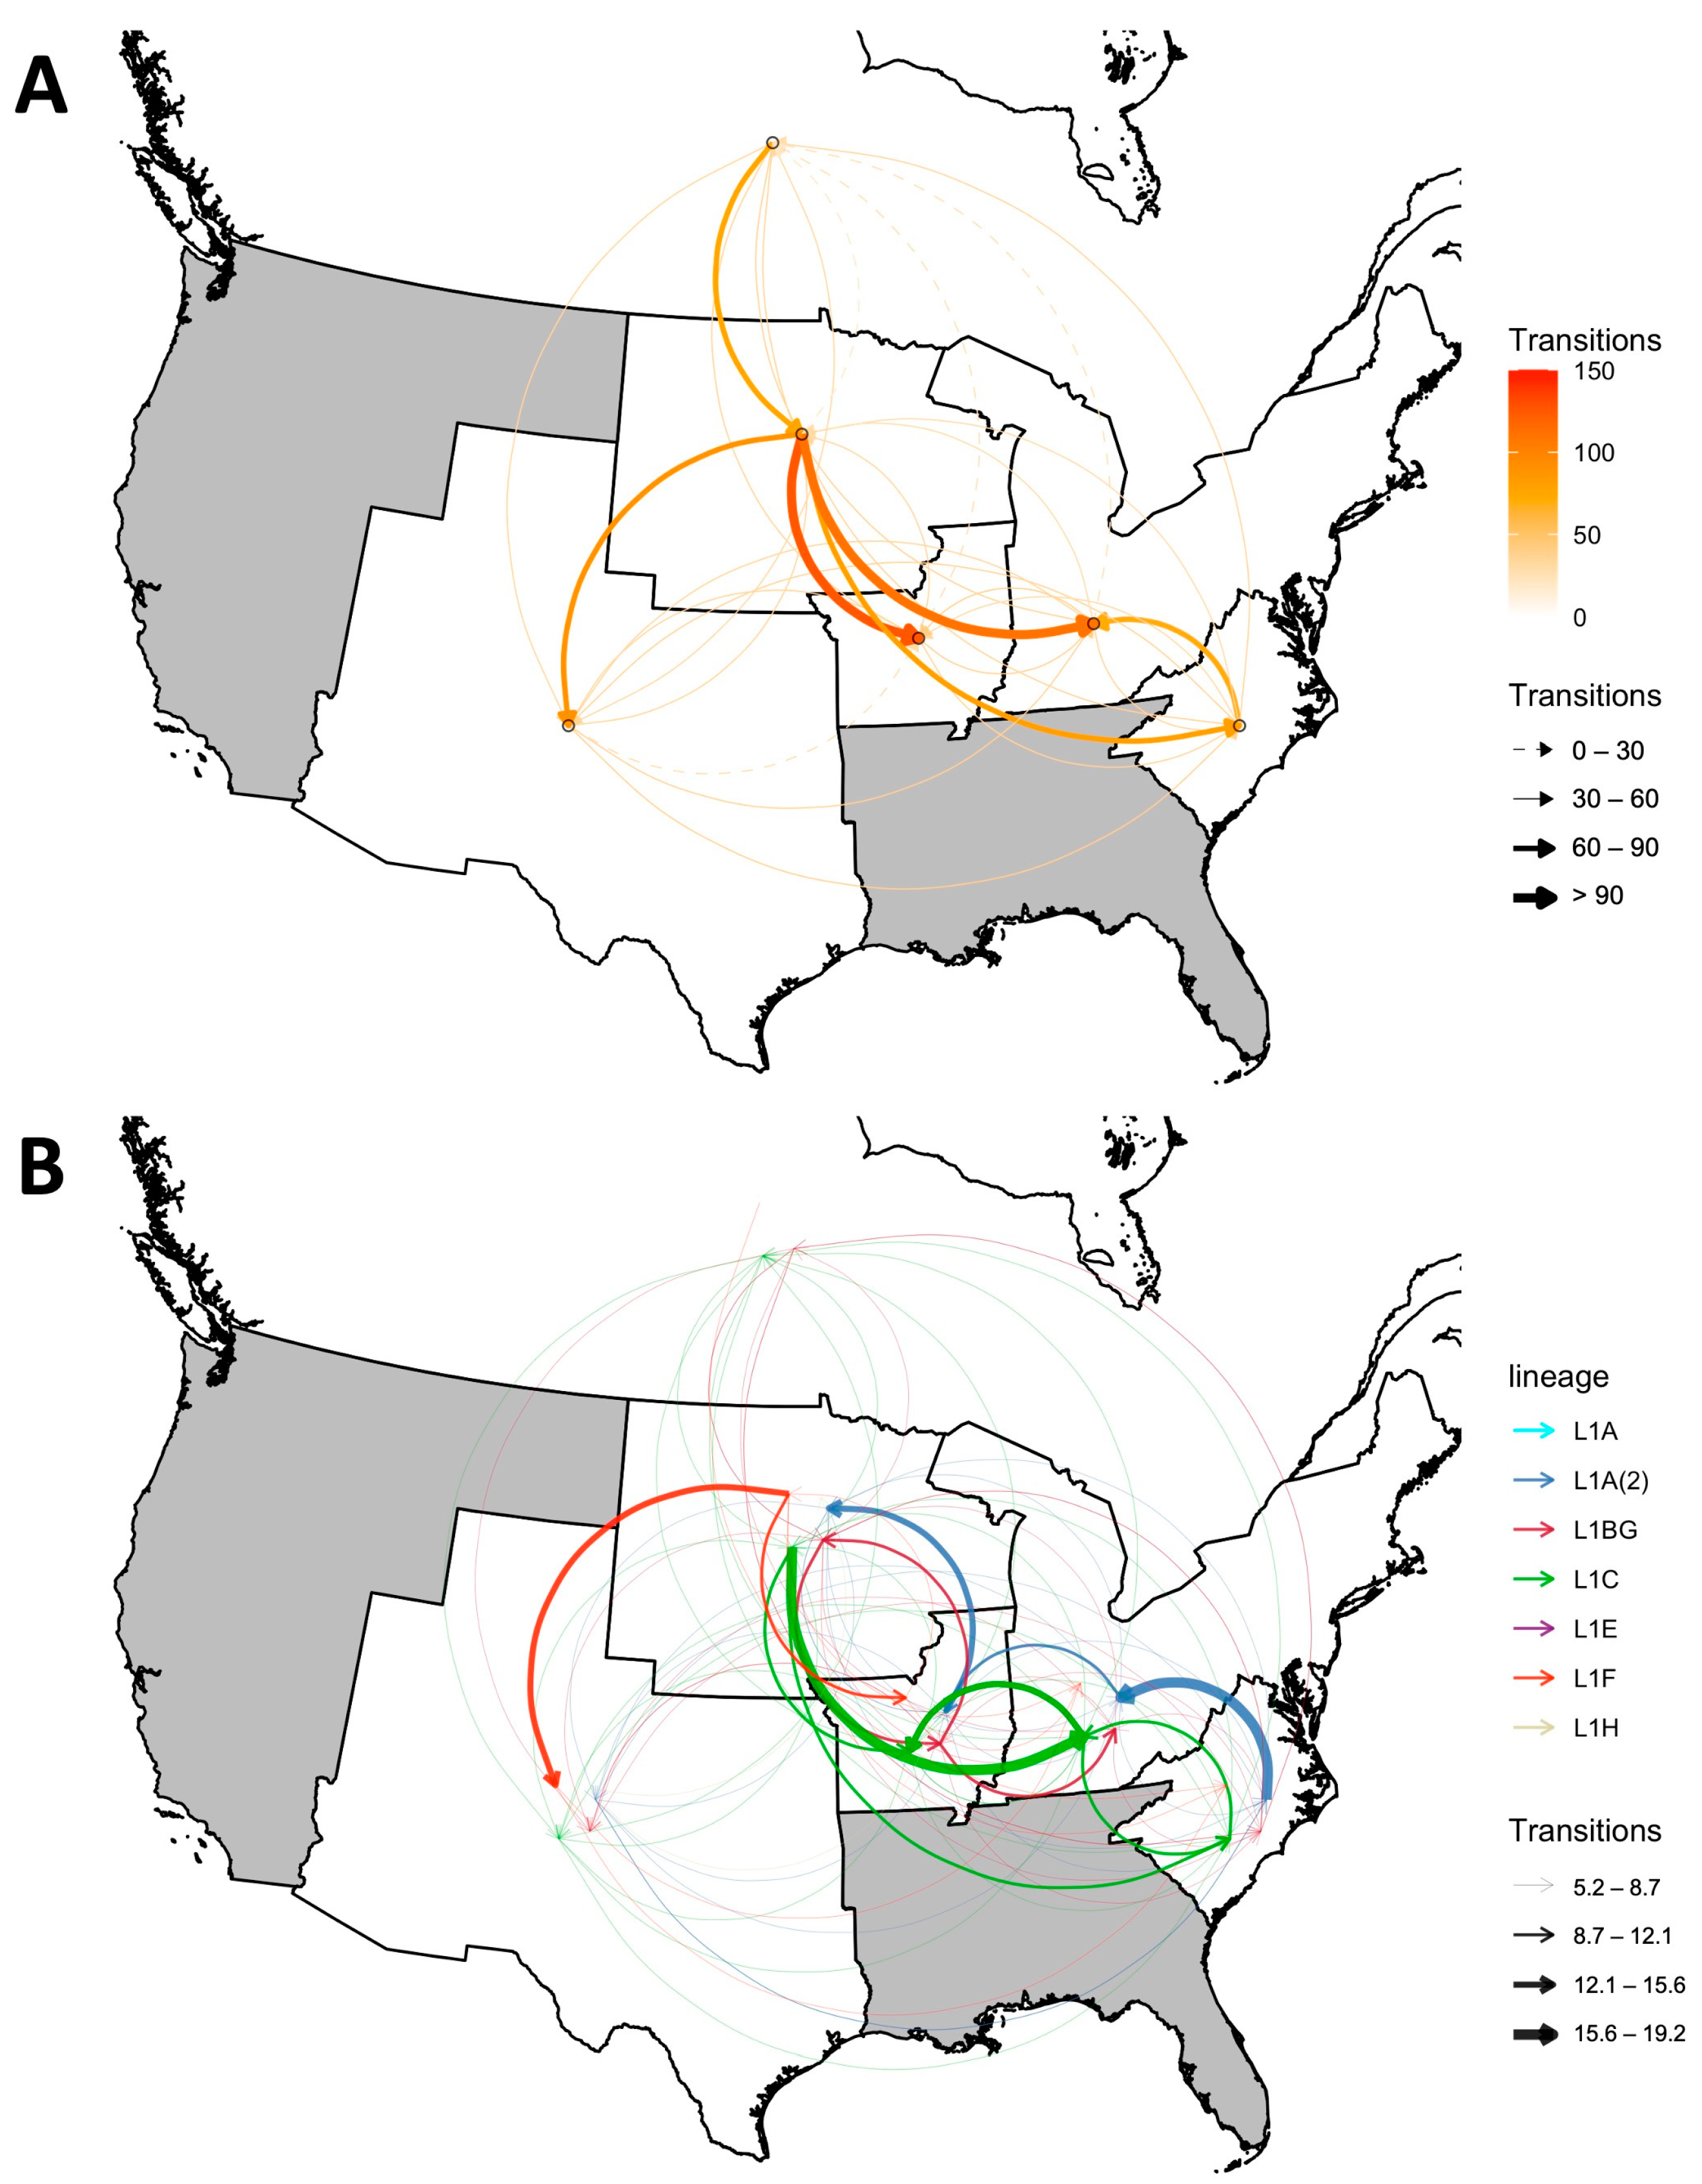
3.2. Inter-Regional Spread and Spreading Hotspots
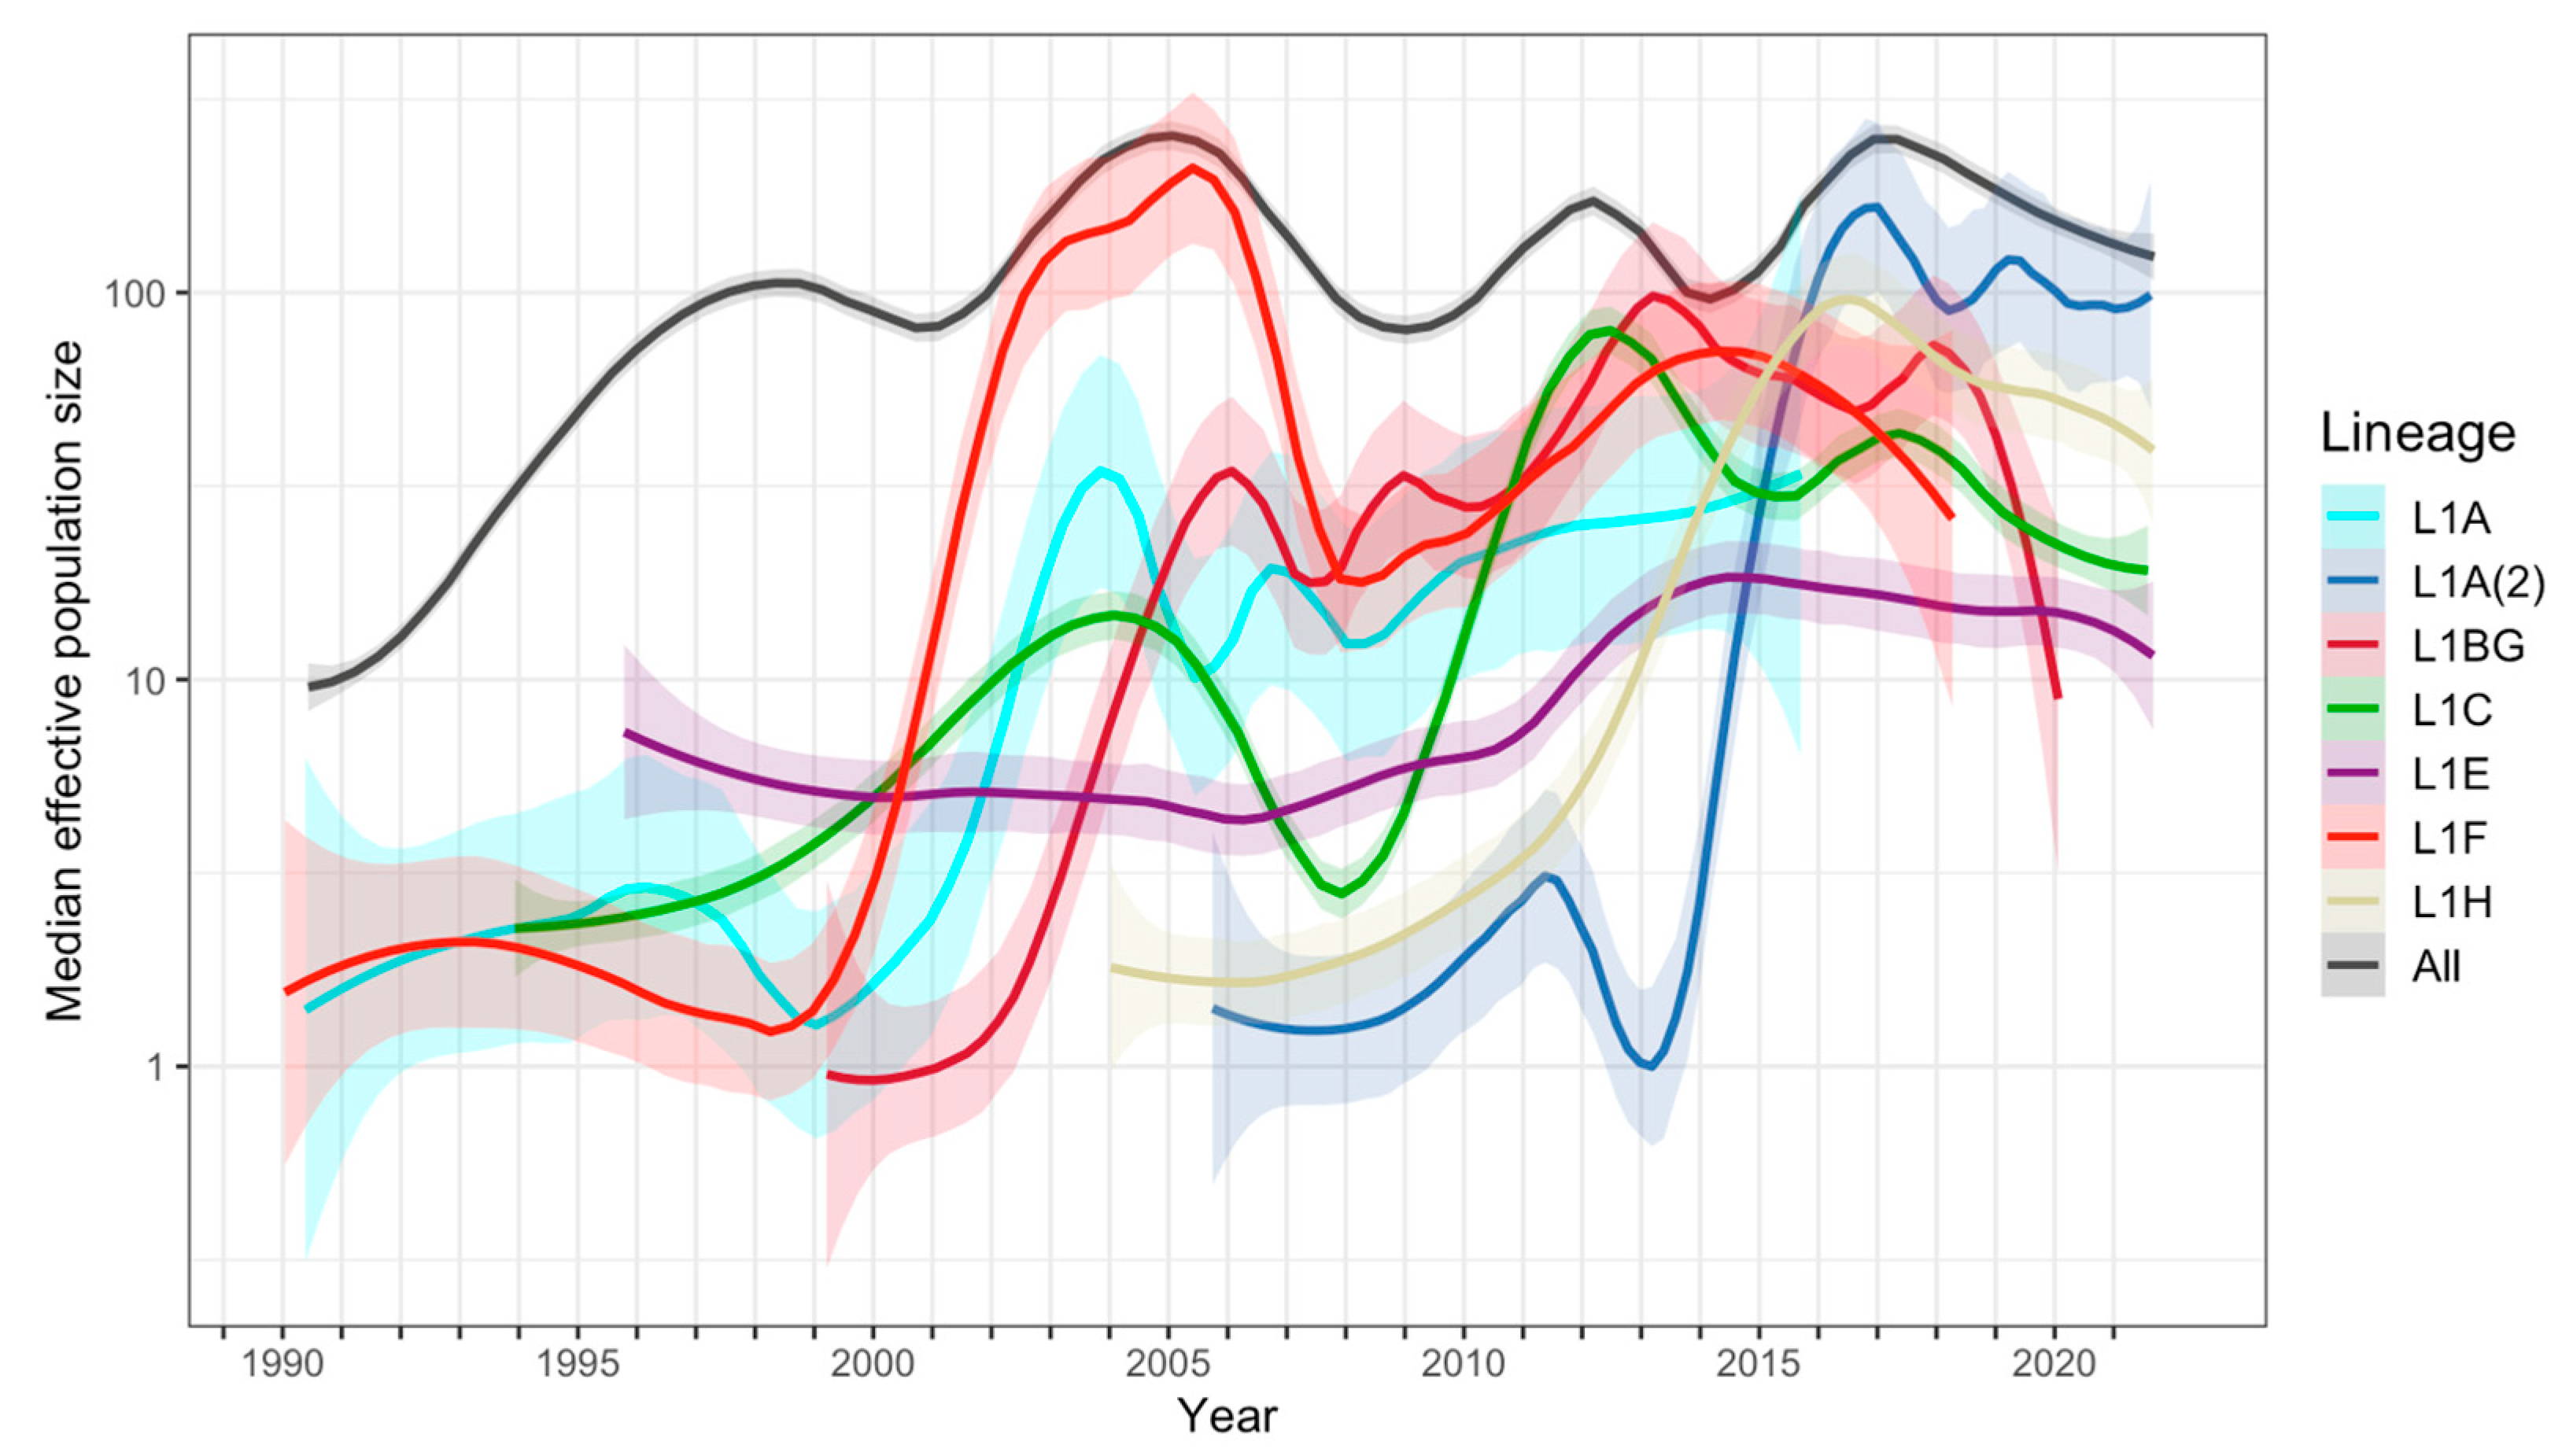
3.3. Population Dynamics, Mutation, and Selection Pressure
4. Discussion
5. Conclusions
Supplementary Materials
Author Contributions
Funding
Institutional Review Board Statement
Informed Consent Statement
Data Availability Statement
Acknowledgments
Conflicts of Interest
References
- Lunney, J.K.; Benfield, D.A.; Rowland, R.R.R. Porcine reproductive and respiratory syndrome virus: An update on an emerging and re-emerging viral disease of swine. Virus Res. 2010, 154, 1–6. [Google Scholar] [CrossRef] [PubMed]
- Shi, M.; Lam, T.T.Y.; Hon, C.C.; Hui, R.K.H.; Faaberg, K.S.; Wennblom, T.; Murtaugh, M.P.; Stadejek, T.; Leung, F.C.C. Molecular epidemiology of PRRSV: A phylogenetic perspective. Virus Res. 2010, 154, 7–17. [Google Scholar] [CrossRef] [PubMed]
- Paploski, I.A.D.; Corzo, C.; Rovira, A.; Murtaugh, M.P.; Sanhueza, J.M.; Vilalta, C.; Schroeder, D.C.; VanderWaal, K. Temporal Dynamics of Co-circulating Lineages of Porcine Reproductive and Respiratory Syndrome Virus. Front. Microbiol. 2019, 10, 2486. [Google Scholar] [CrossRef]
- Walker, P.J.; Siddell, S.G.; Lefkowitz, E.J.; Mushegian, A.R.; Adriaenssens, E.M.; Alfenas-Zerbini, P.; Davison, A.J.; Dempsey, D.M.; Dutilh, B.E.; García, M.L.; et al. Changes to virus taxonomy and to the International Code of Virus Classification and Nomenclature ratified by the International Committee on Taxonomy of Viruses. Arch. Virol. 2021, 166, 2633–2648. [Google Scholar] [CrossRef]
- Calzada-Nova, G.; Schnitzlein, W.M.; Husmann, R.J.; Zuckermann, F.A. North American Porcine Reproductive and Respiratory Syndrome Viruses Inhibit Type I Interferon Production by Plasmacytoid Dendritic Cells. J. Virol. 2011, 85, 2703–2713. [Google Scholar] [CrossRef]
- Rahe, M.C.; Murtaugh, M.P. Mechanisms of adaptive immunity to porcine reproductive and respiratory syndrome virus. Viruses 2017, 9, 148. [Google Scholar] [CrossRef] [PubMed]
- Costers, S.; Lefebvre, D.J.; Delputte, P.L.; Nauwynck, H.J. Porcine reproductive and respiratory syndrome virus modulates apoptosis during replication in alveolar macrophages. Arch. Virol. 2008, 153, 1453–1465. [Google Scholar] [CrossRef] [PubMed]
- Malgarin, C.M.; Moser, F.; Pasternak, J.A.; Hamonic, G.; Detmer, S.E.; MacPhee, D.J.; Harding, J.C.S. Fetal hypoxia and apoptosis following maternal porcine reproductive and respiratory syndrome virus (PRRSV) infection. BMC Veter. Res. 2021, 17, 182. [Google Scholar] [CrossRef]
- Thanawongnuwech, R.; Thacker, B.; Halbur, P.; Thacker, E.L. Increased production of proinflammatory cytokines following infection with porcine reproductive and respiratory syndrome virus and Mycoplasma hyopneumoniae. Clin. Diagn. Lab. Immunol. 2004, 11, 901–908. [Google Scholar]
- Li, J.; Wang, S.; Li, C.; Wang, C.; Liu, Y.; Wang, G.; He, X.; Hu, L.; Liu, Y.; Cui, M.; et al. Secondary Haemophilus parasuis infection enhances highly pathogenic porcine reproductive and respiratory syndrome virus (HP-PRRSV) infection-mediated inflammatory responses. Veter. Microbiol. 2017, 204, 35–42. [Google Scholar] [CrossRef]
- Alex Pasternak, J.; MacPhee, D.J.; Harding, J.C.S. Fetal cytokine response to porcine reproductive and respiratory syndrome virus-2 infection. Cytokine 2020, 126, 154883. [Google Scholar] [CrossRef] [PubMed]
- The OIE AD HOC Group on Porcine Reproductive Respiratory Syndrome. PRRS: The Disease, Its Diagnosis, Prevention and Control. Available online: https://www.oie.int/fileadmin/Home/eng/Our_scientific_expertise/docs/pdf/PRRS_guide_web_bulletin.pdf (accessed on 15 October 2021).
- Valdes-Donoso, P.; Alvarez, J.; Jarvis, L.S.; Morrison, R.B.; Perez, A.M. Production losses from an endemic animal disease: Porcine reproductive and respiratory syndrome (PRRS) in selected Midwest US Sow Farms. Front. Veter. Sci. 2018, 5, 102. [Google Scholar] [CrossRef] [PubMed]
- Neumann, E.J.; Kliebenstein, J.B.; Johnson, C.D.; Mabry, J.W.; Bush, E.J.; Seitzinger, A.H.; Green, A.L.; Zimmerman, J.J. Assessment of the economic impact of porcine reproductive and respiratory syndrome on swine production in the United States. J. Am. Veter. Med. Assoc. 2005, 227, 385–392. [Google Scholar] [CrossRef] [PubMed]
- Holtkamp, D.J.; Kliebenstein, J.B.; Neumann, E.J.; Zimmerman, J.J.; Rotto, H.F.; Yoder, T.K.; Wang, C.; Yeske, P.E.; Mowrer, C.L.; Haley, C.A. Assessment of the economic impact of porcine reproductive and respiratory syndrome virus on United States pork producers. J. Swine Health Prod. 2013, 21, 72–84. [Google Scholar]
- Keffaber, K.K. Reproduction failure of unknown etiology. Am. Assoc. Swine Pr. Newsl. 1989, 1, 1–9. [Google Scholar]
- The Morrison Swine Health Monitoring Project. PRRS CUMULATIVE INCIDENCE. Available online: https://vetmed.umn.edu/centers-programs/swine-program/outreach-leman-mshmp/mshmp/mshmp-prrs-figures (accessed on 21 September 2022).
- Paploski, I.A.D.; Pamornchainavakul, N.; Makau, D.N.; Rovira, A.; Corzo, C.A.; Schroeder, D.C.; Cheeran, M.C.J.; Doeschl-Wilson, A.; Kao, R.R.; Lycett, S.; et al. Phylogenetic structure and sequential dominance of sub-lineages of prrsv type-2 lineage 1 in the United States. Vaccines 2021, 9, 608. [Google Scholar] [CrossRef]
- Lee, K.; Polson, D.; Lowe, E.; Main, R.; Holtkamp, D.; Martínez-López, B. Unraveling the contact patterns and network structure of pig shipments in the United States and its association with porcine reproductive and respiratory syndrome virus (PRRSV) outbreaks. Prev. Veter. Med. 2017, 138, 113–123. [Google Scholar] [CrossRef]
- Pileri, E.; Mateu, E. Review on the transmission porcine reproductive and respiratory syndrome virus between pigs and farms and impact on vaccination. Veter. Res. 2016, 47, 108. [Google Scholar] [CrossRef] [PubMed]
- VanderWaal, K.; Paploski, I.A.D.; Makau, D.N.; Corzo, C.A. Contrasting animal movement and spatial connectivity networks in shaping transmission pathways of a genetically diverse virus. Prev. Veter. Med. 2020, 178, 104977. [Google Scholar] [CrossRef]
- Makau, D.N.; Paploski, I.A.D.; Corzo, C.A.; VanderWaal, K. Dynamic network connectivity influences the spread of a sub-lineage of porcine reproductive and respiratory syndrome virus. Transbound. Emerg. Dis. 2022, 69, 524–537. [Google Scholar] [CrossRef]
- Wesley, R.D.; Mengeling, W.L.; Lager, K.M.; Clouser, D.F.; Landgraf, J.G.; Frey, M.L. Differentiation of a porcine reproductive and respiratory syndrome virus vaccine strain from North American field strains by restriction fragment length polymorphism analysis of ORF 5. J. Veter. Diagnostic Investig. 1998, 10, 140–144. [Google Scholar] [CrossRef]
- Wissink, E.H.J.; van Wijk, H.A.R.; Kroese, M.V.; Weiland, E.; Meulenberg, J.J.M.; Rottier, P.J.M.; van Rijn, P.A. The major envelope protein, GP5, of a European porcine reproductive and respiratory syndrome virus contains a neutralization epitope in its N-terminal ectodomain. J. Gen. Virol. 2003, 84, 1535–1543. [Google Scholar] [CrossRef]
- Kim, W.I.; Kim, J.J.; Cha, S.H.; Wu, W.H.; Cooper, V.; Evans, R.; Choi, E.J.; Yoon, K.J. Significance of genetic variation of PRRSV ORF5 in virus neutralization and molecular determinants corresponding to cross neutralization among PRRS viruses. Veter. Microbiol. 2013, 162, 10–22. [Google Scholar] [CrossRef] [PubMed]
- Shi, M.; Lam, T.T.-Y.; Hon, C.-C.; Murtaugh, M.P.; Davies, P.R.; Hui, R.K.-H.; Li, J.; Wong, L.T.-W.; Yip, C.-W.; Jiang, J.-W.; et al. Phylogeny-Based Evolutionary, Demographical, and Geographical Dissection of North American Type 2 Porcine Reproductive and Respiratory Syndrome Viruses. J. Virol. 2010, 84, 8700–8711. [Google Scholar] [CrossRef]
- Giovani Trevisan; Daniel Linhares Swine Disease Detection Dashboards. Available online: https://fieldepi.research.cvm.iastate.edu/domestic-swine-disease-monitoring-program/ (accessed on 20 September 2022).
- Shi, M.; Lemey, P.; Singh Brar, M.; Suchard, M.A.; Murtaugh, M.P.; Carman, S.; D’Allaire, S.; Delisle, B.; Lambert, M.È.; Gagnon, C.A.; et al. The spread of type 2 porcine reproductive and respiratory syndrome virus (prrsv) in North America: A phylogeographic approach. Virology 2013, 447, 146–154. [Google Scholar] [CrossRef] [PubMed]
- MSHMP History|College of Veterinary Medicine—University of Minnesota. Available online: https://vetmed.umn.edu/centers-programs/swine-program/outreach-leman-mshmp/mshmp-history (accessed on 28 January 2021).
- Economic Research Service, USDA. Hogs: Annual and Cumulative Year-to-Date U.S. Trade (Head). 2022. Available online: https://www.ers.usda.gov/webdocs/DataFiles/81475/Hog_YearlyFull.xlsx?v=7597.1 (accessed on 30 September 2022).
- Kazutaka, K.; Misakwa, K.; Kei-ichi, K.; Miyata, T. MAFFT: A novel method for rapid multiple sequence alignment based on fast Fourier transform. Nucleic Acids Res. 2002, 30, 3059–3066. [Google Scholar]
- Price, M.N.; Dehal, P.S.; Arkin, A.P. FastTree 2—Approximately maximum-likelihood trees for large alignments. PLoS ONE 2010, 5, e9490. [Google Scholar] [CrossRef]
- Libin, P.J.K.; Deforche, K.; Abecasis, A.B.; Theys, K. VIRULIGN: Fast codon-correct alignment and annotation of viral genomes. Bioinformatics 2019, 35, 1763–1765. [Google Scholar] [CrossRef]
- Martin, D.P.; Varsani, A.; Roumagnac, P.; Botha, G.; Maslamoney, S.; Schwab, T.; Kelz, Z.; Kumar, V.; Murrell, B. RDP5: A computer program for analyzing recombination in, and removing signals of recombination from, nucleotide sequence datasets. Virus Evol. 2021, 7, veaa087. [Google Scholar] [CrossRef]
- Martin, D.; Rybicki, E. RDP: Detection of recombination amongst aligned sequences. Bioinformatics 2000, 16, 562–563. [Google Scholar] [CrossRef]
- Padidam, M.; Sawyer, S.; Fauquet, C.M. Possible emergence of new geminiviruses by frequent recombination. Virology 1999, 265, 218–225. [Google Scholar] [CrossRef] [PubMed]
- Smith, J.M. Analyzing the mosaic structure of genes. J. Mol. Evol. 1992, 34, 126–129. [Google Scholar] [CrossRef] [PubMed]
- Martin, D.P.; Posada, D.; Crandall, K.A.; Williamson, C. A Modified Bootscan Algorithm for Automated Identification of Recombinant Sequences and Recombination Breakpoints. AIDS Res. Hum. Retrovir. 2005, 21, 98–102. [Google Scholar] [CrossRef]
- Gibbs, M.J.; Armstrong, J.S.; Gibbs, A.J. Sister-scanning: A Monte Carlo procedure for assessing signals in rebombinant sequences. Bioinformatics 2000, 16, 573–582. [Google Scholar] [CrossRef]
- Posada, D.; Crandall, K.A. Evaluation of methods for detecting recombination from DNA sequences: Computer simulations. Proc. Natl. Acad. Sci. USA 2001, 98, 13757–13762. [Google Scholar] [CrossRef]
- Lam, H.M.; Ratmann, O.; Boni, M.F. Improved Algorithmic Complexity for the 3SEQ Recombination Detection Algorithm. Mol. Biol. Evol. 2018, 35, 247–251. [Google Scholar] [CrossRef] [PubMed]
- The Swine Health Information Center The Swine Health Information Center’s Rapid Response Program. Available online: https://www.swinehealth.org/rapid-response-to-emerging-disease-program/ (accessed on 22 September 2022).
- National Agricultural Statistics Service. 2017 Census of Agriculture. 2019. Available online: https://www.nass.usda.gov/Publications/AgCensus/2017/Full_Report/Volume_1,_Chapter_1_US/usv1.pdf (accessed on 22 September 2022).
- De Maio, N.; Wu, C.H.; O’Reilly, K.M.; Wilson, D. New Routes to Phylogeography: A Bayesian Structured Coalescent Approximation. PLoS Genet. 2015, 11, e1005421. [Google Scholar] [CrossRef] [PubMed]
- Kalkauskas, A.; Perron, U.; Sun, Y.; Goldman, N.; Baele, G.; Guindon, S.; De Maio, N. Sampling bias and model choice in continuous phylogeography: Getting lost on a random walk. PLoS Comput. Biol. 2021, 17, e1008561. [Google Scholar] [CrossRef]
- Lemey, P.; Rambaut, A.; Drummond, A.J.; Suchard, M.A. Bayesian phylogeography finds its roots. PLoS Comput. Biol. 2009, 5, e1000520. [Google Scholar] [CrossRef]
- Suchard, M.A.; Lemey, P.; Baele, G.; Ayres, D.L.; Drummond, A.J.; Rambaut, A. Bayesian phylogenetic and phylodynamic data integration using BEAST 1.10. Virus Evol. 2018, 4, vey016. [Google Scholar] [CrossRef]
- Drummond, A.J.; Ho, S.Y.W.; Phillips, M.J.; Rambaut, A. Relaxed phylogenetics and dating with confidence. PLoS Biol. 2006, 4, e88. [Google Scholar] [CrossRef] [PubMed]
- Gill, M.S.; Lemey, P.; Faria, N.R.; Rambaut, A.; Shapiro, B.; Suchard, M.A. Improving bayesian population dynamics inference: A coalescent-based model for multiple loci. Mol. Biol. Evol. 2013, 30, 713–724. [Google Scholar] [CrossRef]
- Rambaut, A.; Lam, T.T.; Max Carvalho, L.; Pybus, O.G. Exploring the temporal structure of heterochronous sequences using TempEst (formerly Path-O-Gen). Virus Evol. 2016, 2, vew007. [Google Scholar] [CrossRef]
- Trifinopoulos, J.; Nguyen, L.T.; von Haeseler, A.; Minh, B.Q. W-IQ-TREE: A fast online phylogenetic tool for maximum likelihood analysis. Nucleic Acids Res. 2016, 44, W232–W235. [Google Scholar] [CrossRef] [PubMed]
- Drummond, A.J.; Rambaut, A. BEAST: Bayesian evolutionary analysis by sampling trees. BMC Evol. Biol. 2007, 7, 214. [Google Scholar] [CrossRef]
- Hadfield, J.; Megill, C.; Bell, S.M.; Huddleston, J.; Potter, B.; Callender, C.; Sagulenko, P.; Bedford, T.; Neher, R.A. NextStrain: Real-time tracking of pathogen evolution. Bioinformatics 2018, 34, 4121–4123. [Google Scholar] [CrossRef]
- Ginestet, C. ggplot2: Elegant Graphics for Data Analysis. J. R. Stat. Soc. Ser. A Stat. Soc. 2011, 174, 245–246. [Google Scholar] [CrossRef]
- R Core Team R: A Language and Environment for Statistical Computing. R Foundation for Statistical Computing. 2019. Available online: https://www.r-project.org/ (accessed on 25 October 2022).
- Sagulenko, P.; Puller, V.; Neher, R.A. TreeTime: Maximum-likelihood phylodynamic analysis. Virus Evol. 2018, 4, vex042. [Google Scholar] [CrossRef]
- Müller, N.F.; Rasmussen, D.A.; Stadler, T. The structured coalescent and its approximations. Mol. Biol. Evol. 2017, 34, 2970–2981. [Google Scholar] [CrossRef]
- Müller, N.F.; Rasmussen, D.; Stadler, T. MASCOT: Parameter and state inference under the marginal structured coalescent approximation. Bioinformatics 2018, 34, 3843–3848. [Google Scholar] [CrossRef] [PubMed]
- Bouckaert, R.; Vaughan, T.G.; Barido-Sottani, J.; Duchêne, S.; Fourment, M.; Gavryushkina, A.; Heled, J.; Jones, G.; Kühnert, D.; De Maio, N.; et al. BEAST 2.5: An advanced software platform for Bayesian evolutionary analysis. PLoS Comput. Biol. 2019, 15, e1006650. [Google Scholar] [CrossRef] [PubMed]
- Yang, Z.; Nielsent, R. Codon-substitution models for detecting molecular adaptation at individual sites along specific lineages. Mol. Biol. Evol. 2002, 19, 908–917. [Google Scholar] [CrossRef] [PubMed]
- Smith, M.D.; Wertheim, J.O.; Weaver, S.; Murrell, B.; Scheffler, K.; Kosakovsky Pond, S.L. Less is more: An adaptive branch-site random effects model for efficient detection of episodic diversifying selection. Mol. Biol. Evol. 2015, 32, 1342–1353. [Google Scholar] [CrossRef] [PubMed]
- Liu, P.; Song, Y.; Colijn, C.; MacPherson, A. The impact of sampling bias on viral phylogeographic reconstruction. PLOS Glob. Public Health 2022, 2, e0000577. [Google Scholar] [CrossRef]
- Han, J.; Wang, Y.; Faaberg, K.S. Complete genome analysis of RFLP 184 isolates of porcine reproductive and respiratory syndrome virus. Virus Res. 2006, 122, 175–182. [Google Scholar] [CrossRef] [PubMed]
- Meulenberg, J.J.M.; Hulst, M.M.; De Meijer, E.J.; Moonen, P.L.J.M.; Den Besten, A.; De Kluyver, E.P.; Wensvoort, G.; Moormann, R.J.M. Lelystad virus, the causative agent of porcine epidemic abortion and respiratory syndrome (PEARS), is related to LDV and EAV. Virology 1993, 192, 62–72. [Google Scholar] [CrossRef]
- Meng, X.J.; Paul, P.S.; Halbur, P.G.; Morozov, I. Sequence comparison of open reading frames 2 to 5 of low and high virulence United States isolates of porcine reproductive and respiratory syndrome virus. J. Gen. Virol. 1995, 76, 3181–3188. [Google Scholar] [CrossRef]
- Kapur, V.; Elam, M.R.; Pawlovich, T.M.; Murtaugh, M.P. Genetic variation in porcine reproductive and respiratory syndrome virus isolates in the midwestern United States. J. Gen. Virol. 1996, 77, 1271–1276. [Google Scholar] [CrossRef]
- Andreyev, V.G.; Wesley, R.D.; Mengeling, W.L.; Vorwald, A.C.; Lager, K.M. Genetic variation and phylogenetic relationships of 22 porcine reproductive and respiratory syndrome virus (PRRSV) field strains based on sequence analysis of open reading frame 5. Arch. Virol. 1997, 142, 993–1001. [Google Scholar] [CrossRef]
- Mardassi, H.; Mounir, S.; Dea, S. Molecular analysis of the ORFs 3 to 7 of porcine reproductive and respiratory syndrome virus, Québec reference strain. Arch. Virol. 1995, 140, 1405–1418. [Google Scholar] [CrossRef]
- Rodriguez, M.J.; Sarraseca, J.; Garcia, J.; Sanz, A.; Plana-Durán, J.; Casal, J.I. Epitope mapping of the nucleocapsid protein of European and North American isolates of porcine reproductive and respiratory syndrome virus. J. Gen. Virol. 1997, 78, 2269–2278. [Google Scholar] [CrossRef]
- Pirzadeh, B.; Gagnon, C.A.; Dea, S. Genomic and Antigenic Variations of Porcine Reproductive and Respiratory Syndrome Virus Major Envelope GP5 Glycoprotein. Can. J. Veter. Res. 1998, 62, 170–177. [Google Scholar]
- Gagnon, C.A.; Dea, S. Differentiation between Porcine Reproductive and Respiratory Syndrome Virus Isolates by Restriction Fragment Length Polymorphism of Their ORFs 6 and 7 Genes. Can. J. Veter. Res. 1998, 62, 110–116. [Google Scholar]
- Pearl, J. Reverend Bayes on Inference Engines: A Distributed Hierarchical Approach. Cogn. Syst. Lab. Sch. Eng. Appl. Sci. 2022, 129–138. [Google Scholar] [CrossRef]
- Haley, M.M. Market Integration in the North American Hog Industries; USDA, Economic Research Service: Washington, DC, USA, 2004. [Google Scholar]
- Brisson, Y. The changing face of the Canada hog industry. Stat. Canada 2014, 96-325-X. [Google Scholar]
- Whiting, T.L. Special welfare concerns in countries dependent on live animal trade: The real foreign animal disease emergency for Canada. J. Appl. Anim. Welf. Sci. 2008, 11, 149–164. [Google Scholar] [CrossRef] [PubMed]
- Shields, D.A.; Mathews, K.H. Interstate Livestock Movements; USDA, Economic Research Service: Washington, DC, USA, 2003. [Google Scholar]
- Cabezas, A.H.; Sanderson, M.W.; Lockhart, C.Y.; Riley, K.A.; Hanthorn, C.J. Spatial and network analysis of U.S. livestock movements based on Interstate Certificates of Veterinary Inspection. Prev. Veter. Med. 2021, 193, 105391. [Google Scholar] [CrossRef]
- Nelson, M.I.; Culhane, M.R.; Trovão, N.S.; Patnayak, D.P.; Halpin, R.A.; Lin, X.; Shilts, M.H.; Das, S.R.; Detmer, S.E. The emergence and evolution of influenza A (H1α) viruses in swine in Canada and the United States. J. Gen. Virol. 2017, 98, 2663–2675. [Google Scholar] [CrossRef]
- Scotch, M.; Mei, C. Phylogeography of swine influenza H3N2 in the United States: Translational public health for zoonotic disease surveillance. Infect. Genet. Evol. 2013, 13, 224–229. [Google Scholar] [CrossRef] [PubMed]
- Johnson, W.; Roof, M.; Vaughn, E.; Christopher-Hennings, J.; Johnson, C.R.; Murtaugh, M.P. Pathogenic and humoral immune responses to porcine reproductive and respiratory syndrome virus (PRRSV) are related to viral load in acute infection. Veter. Immunol. Immunopathol. 2004, 102, 233–247. [Google Scholar] [CrossRef]
- Yeske, P.; Murtaugh, M. Epidemiology of a new PRRS virus isolate and Outbreak. In Proceedings of the Allen D Leman Swine Conference; Smith, T., Ed.; University of Minnesota: St. Paul, MN, USA, 2008; pp. 11–15. Available online: https://conservancy.umn.edu/bitstream/handle/11299/140078/Yeske.pdf?sequence=1&isAllowed=y (accessed on 25 October 2022).
- Brockmeier, S.L.; Loving, C.L.; Vorwald, A.C.; Kehrli, M.E.; Baker, R.B.; Nicholson, T.L.; Lager, K.M.; Miller, L.C.; Faaberg, K.S. Genomic sequence and virulence comparison of four Type 2 porcine reproductive and respiratory syndrome virus strains. Virus Res. 2012, 169, 212–221. [Google Scholar] [CrossRef]
- Alkhamis, M.A.; Perez, A.M.; Murtaugh, M.P.; Wang, X.; Morrison, R.B. Applications of Bayesian phylodynamic methods in a recent U.S. porcine reproductive and respiratory syndrome virus outbreak. Front. Microbiol. 2016, 7, 67. [Google Scholar] [CrossRef] [PubMed]
- van Geelen, A.G.M.; Anderson, T.K.; Lager, K.M.; Das, P.B.; Otis, N.J.; Montiel, N.A.; Miller, L.C.; Kulshreshtha, V.; Buckley, A.C.; Brockmeier, S.L.; et al. Porcine reproductive and respiratory disease virus: Evolution and recombination yields distinct ORF5 RFLP 1-7-4 viruses with individual pathogenicity. Virology 2018, 513, 168–179. Available online: https://www.sciencedirect.com/science/article/pii/S0042682217303458 (accessed on 25 October 2022). [CrossRef] [PubMed]
- Morrison, R.B. PRRS RFLP 1-7-4 Summary. p. 1. Available online: https://www.vetmed.umn.edu/sites/vetmed.umn.edu/files/shmp_2014.43_prrs_rflp_1-7-4-science_page.pdf (accessed on 25 October 2022).
- Kikuti, M.; Paploski, I.A.D.; Pamornchainavakul, N.; Picasso-Risso, C.; Schwartz, M.; Yeske, P.; Leuwerke, B.; Bruner, L.; Murray, D.; Roggow, B.D.; et al. Emergence of a New Lineage 1C Variant of Porcine Reproductive and Respiratory Syndrome Virus 2 in the United States. Front. Veter. Sci. 2021, 8, 752938. [Google Scholar] [CrossRef] [PubMed]
- Key, N.; McBride, W.D. The Changing Economics of U.S. Hog Production. SSRN Electron. J. 2011. [Google Scholar] [CrossRef]
- Sellman, S.; Beck-Johnson, L.M.; Hallman, C.; Miller, R.S.; Owers Bonner, K.A.; Portacci, K.; Webb, C.T.; Lindström, T. Modeling nation-wide U.S. swine movement networks at the resolution of the individual premises. Epidemics 2022, 41, 100636. Available online: https://www.sciencedirect.com/science/article/pii/S1755436522000767 (accessed on 25 October 2022). [CrossRef] [PubMed]
- Harris, D.L. Multiple site production. In Proceedings of the Southeast Swine Practitioner Conference, Raleigh, NC, USA, 7–10 June 1992; pp. 1–19. [Google Scholar]
- Tokach, M.D.; Goodband, B.D.; O’Quinn, T.G. Performance-enhancing technologies in swine production. Anim. Front. 2016, 6, 15–21. [Google Scholar] [CrossRef]
- Ramirez, A.; Whitney, D.; Bickett-Weddle, D. Swine Industry Manual. FAD PReP: Foreign Animal Disease Preparedness & Response Plan/National Animal Health Emergency Management System. United States Dep. Agric. Anim. Plant Health Insp. Serv. 2011. [Google Scholar]
- Blair, B.; Lowe, J. Describing the cull sow market network in the US: A pilot project. Prev. Veter. Med. 2019, 162, 107–109. [Google Scholar] [CrossRef]
- Faria, N.R.; Suchard, M.A.; Rambaut, A.; Streicker, D.G.; Lemey, P. Simultaneously reconstructing viral crossspecies transmission history and identifying the underlying constraints. Philos. Trans. R. Soc. B Biol. Sci. 2013, 368, 20120196. [Google Scholar] [CrossRef]
- Lemey, P.; Rambaut, A.; Bedford, T.; Faria, N.; Bielejec, F.; Baele, G.; Russell, C.A.; Smith, D.J.; Pybus, O.G.; Brockmann, D.; et al. Unifying Viral Genetics and Human Transportation Data to Predict the Global Transmission Dynamics of Human Influenza H3N2. PLoS Pathog. 2014, 10, e1003932. [Google Scholar] [CrossRef]
- Spielman, S.J.; Weaver, S.; Shank, S.D.; Magalis, B.R.; Li, M.; Kosakovsky Pond, S.L. Evolution of viral genomes: Interplay between selection, recombination, and other forces. Methods Mol. Biol. 2019, 1910, 427–468. [Google Scholar] [PubMed]
- Benfield, C.T.O.; Hill, S.; Shatar, M.; Shiilegdamba, E.; Damdinjav, B.; Fine, A.; Willett, B.; Kock, R.; Bataille, A. Molecular epidemiology of peste des petits ruminants virus emergence in critically endangered Mongolian saiga antelope and other wild ungulates. Virus Evol. 2021, 7, veab062. [Google Scholar] [CrossRef]
- Caraballo, D.A.; Lema, C.; Novaro, L.; Gury-Dohmen, F.; Russo, S.; Beltrán, F.J.; Palacios, G.; Cisterna, D.M. A novel terrestrial rabies virus lineage occurring in south america: Origin, diversification, and evidence of contact between wild and domestic cycles. Viruses 2021, 13, 2484. [Google Scholar] [CrossRef] [PubMed]
- MacLean, O.A.; Lytras, S.; Weaver, S.; Singer, J.B.; Boni, M.F.; Lemey, P.; Kosakovsky Pond, S.L.; Robertson, D.L. Natural selection in the evolution of SARS-CoV-2 in bats created a generalist virus and highly capable human pathogen. PLoS Biol. 2021, 19, e3001115. [Google Scholar] [CrossRef] [PubMed]
- Cariou, M.; Picard, L.; Guéguen, L.; Jacquet, S.; Cimarelli, A.; Fregoso, O.I.; Molaro, A.; Navratil, V.; Etienne, L. Distinct evolutionary trajectories of SARS-CoV-2-interacting proteins in bats and primates identify important host determinants of COVID-19. Proc. Natl. Acad. Sci. USA 2022, 119, e2206610119. [Google Scholar] [CrossRef]
- Berry, I.M.; Eyase, F.; Pollett, S.; Konongoi, S.L.; Joyce, M.G.; Figueroa, K.; Ofula, V.; Koka, H.; Koskei, E.; Nyunja, A.; et al. Global Outbreaks and Origins of a Chikungunya Virus Variant Carrying Mutations Which May Increase Fitness for Aedes aegypti: Revelations from the 2016 Mandera, Kenya outbreak. Am. J. Trop. Med. Hyg. 2019, 100, 1249–1257. [Google Scholar] [CrossRef]
- Delisle, B.; Gagnon, C.A.; Lambert, M.-È; D’Allaire, S. Porcine reproductive and respiratory syndrome virus diversity of Eastern Canada swine herds in a large sequence dataset reveals two hypervariable regions under positive selection. Infect. Genet. Evol. 2012, 12, 1111–1119. [Google Scholar] [CrossRef] [PubMed]


Disclaimer/Publisher’s Note: The statements, opinions and data contained in all publications are solely those of the individual author(s) and contributor(s) and not of MDPI and/or the editor(s). MDPI and/or the editor(s) disclaim responsibility for any injury to people or property resulting from any ideas, methods, instructions or products referred to in the content. |
© 2023 by the authors. Licensee MDPI, Basel, Switzerland. This article is an open access article distributed under the terms and conditions of the Creative Commons Attribution (CC BY) license (https://creativecommons.org/licenses/by/4.0/).
Share and Cite
Pamornchainavakul, N.; Paploski, I.A.D.; Makau, D.N.; Kikuti, M.; Rovira, A.; Lycett, S.; Corzo, C.A.; VanderWaal, K. Mapping the Dynamics of Contemporary PRRSV-2 Evolution and Its Emergence and Spreading Hotspots in the U.S. Using Phylogeography. Pathogens 2023, 12, 740. https://doi.org/10.3390/pathogens12050740
Pamornchainavakul N, Paploski IAD, Makau DN, Kikuti M, Rovira A, Lycett S, Corzo CA, VanderWaal K. Mapping the Dynamics of Contemporary PRRSV-2 Evolution and Its Emergence and Spreading Hotspots in the U.S. Using Phylogeography. Pathogens. 2023; 12(5):740. https://doi.org/10.3390/pathogens12050740
Chicago/Turabian StylePamornchainavakul, Nakarin, Igor A. D. Paploski, Dennis N. Makau, Mariana Kikuti, Albert Rovira, Samantha Lycett, Cesar A. Corzo, and Kimberly VanderWaal. 2023. "Mapping the Dynamics of Contemporary PRRSV-2 Evolution and Its Emergence and Spreading Hotspots in the U.S. Using Phylogeography" Pathogens 12, no. 5: 740. https://doi.org/10.3390/pathogens12050740