Multi-Objective Design Optimization of a Shape Memory Alloy Flexural Actuator †


1
Department of Mechanical and Aerospace Engineering, North Carolina State University, Raleigh, NC 27695-7910, USA
2
Flexiv Robotics Ltd., Santa Clara, CA 95054, USA
*
Author to whom correspondence should be addressed.
†
This paper is an extended version of a published conference paper: Haigh, C.D.; Crews, J.H.; Wang, S.; Buckner, G.D. Modeling and Experimental Validation of Shape Memory Alloy Bending Actuators. In Proceedings of the ASME Conference on Smart Materials, Adaptive Structures and Intelligent Systems, Stone Mountain, GA, USA, 19–21 September 2012.
Actuators 2019, 8(1), 13; https://doi.org/10.3390/act8010013
Submission received: 7 January 2019
/
Revised: 31 January 2019
/
Accepted: 10 February 2019
/
Published: 16 February 2019
(This article belongs to the Special Issue Actuators Based on Shape Memory Alloys)
Abstract
:This paper presents a computational model and design optimization strategy for shape memory alloy (SMA) flexural actuators. These actuators consist of curved SMA wires embedded within elastic structures; one potential application is positioning microcatheters inside blood vessels during clinical treatments. Each SMA wire is shape-set to an initial curvature and inserted along the neutral axis of a straight elastic member (cast polydimethylsiloxane, PDMS). The elastic structure preloads the SMA, reducing the equilibrium curvature of the composite actuator. Temperature-induced phase transformations in the SMA are achieved via Joule heating, enabling strain recovery and increased bending (increased curvature) in the actuator. Actuator behavior is modeled using the homogenized energy framework, and the effects of two critical design parameters (initial SMA curvature and flexural rigidity of the elastic sleeve) on activation curvature are investigated. Finally, a multi-objective genetic algorithm is utilized to optimize actuator performance and generate a Pareto frontier, which is subsequently experimentally validated.
1. Introduction
Liver cancer is the second leading cause of cancer-related death worldwide [1]. Surgical resection is the preferred, and most effective, treatment approach for primary and metastatic liver malignancies. Despite the large number of patients affected by these diseases, current treatment options are less than ideal, as 80–90% of patients are not good candidates for surgery [2], 50% of patients with solid tumors have full resistance to chemotherapy [2], and liver tissue is more sensitive to external radiation than the tumor itself [3].
Selective internal radiation therapy (SIRT) is an emerging treatment for liver cancer during which the blood vessels supplying tumors are embolized with radioactive microspheres. These microspheres contain the radioactive isotope yttrium-90 (90Y) which delivers high-energy, low-penetrating radiation that destroys tumor tissue while limiting adverse effects to surrounding healthy liver tissue [4]. Currently, SIRT uses a single-lumen microcatheter (1.0 mm diameter) and a manually operated syringe to deliver the 90Y microspheres into the hepatic artery. Recent studies have documented significant increases in patient survival (29.4 months with SIRT and systemic chemotherapy vs. 12.8 months with chemotherapy alone [5]). Despite the documented advantages of SIRT, the inability to directly target tumor sites has limited its widespread adoption. The tortuous and patient-variable arterial anatomy limits the direct targeting of tumors, causing damage to healthy liver tissue and other organs via ischemia or radiation [6].
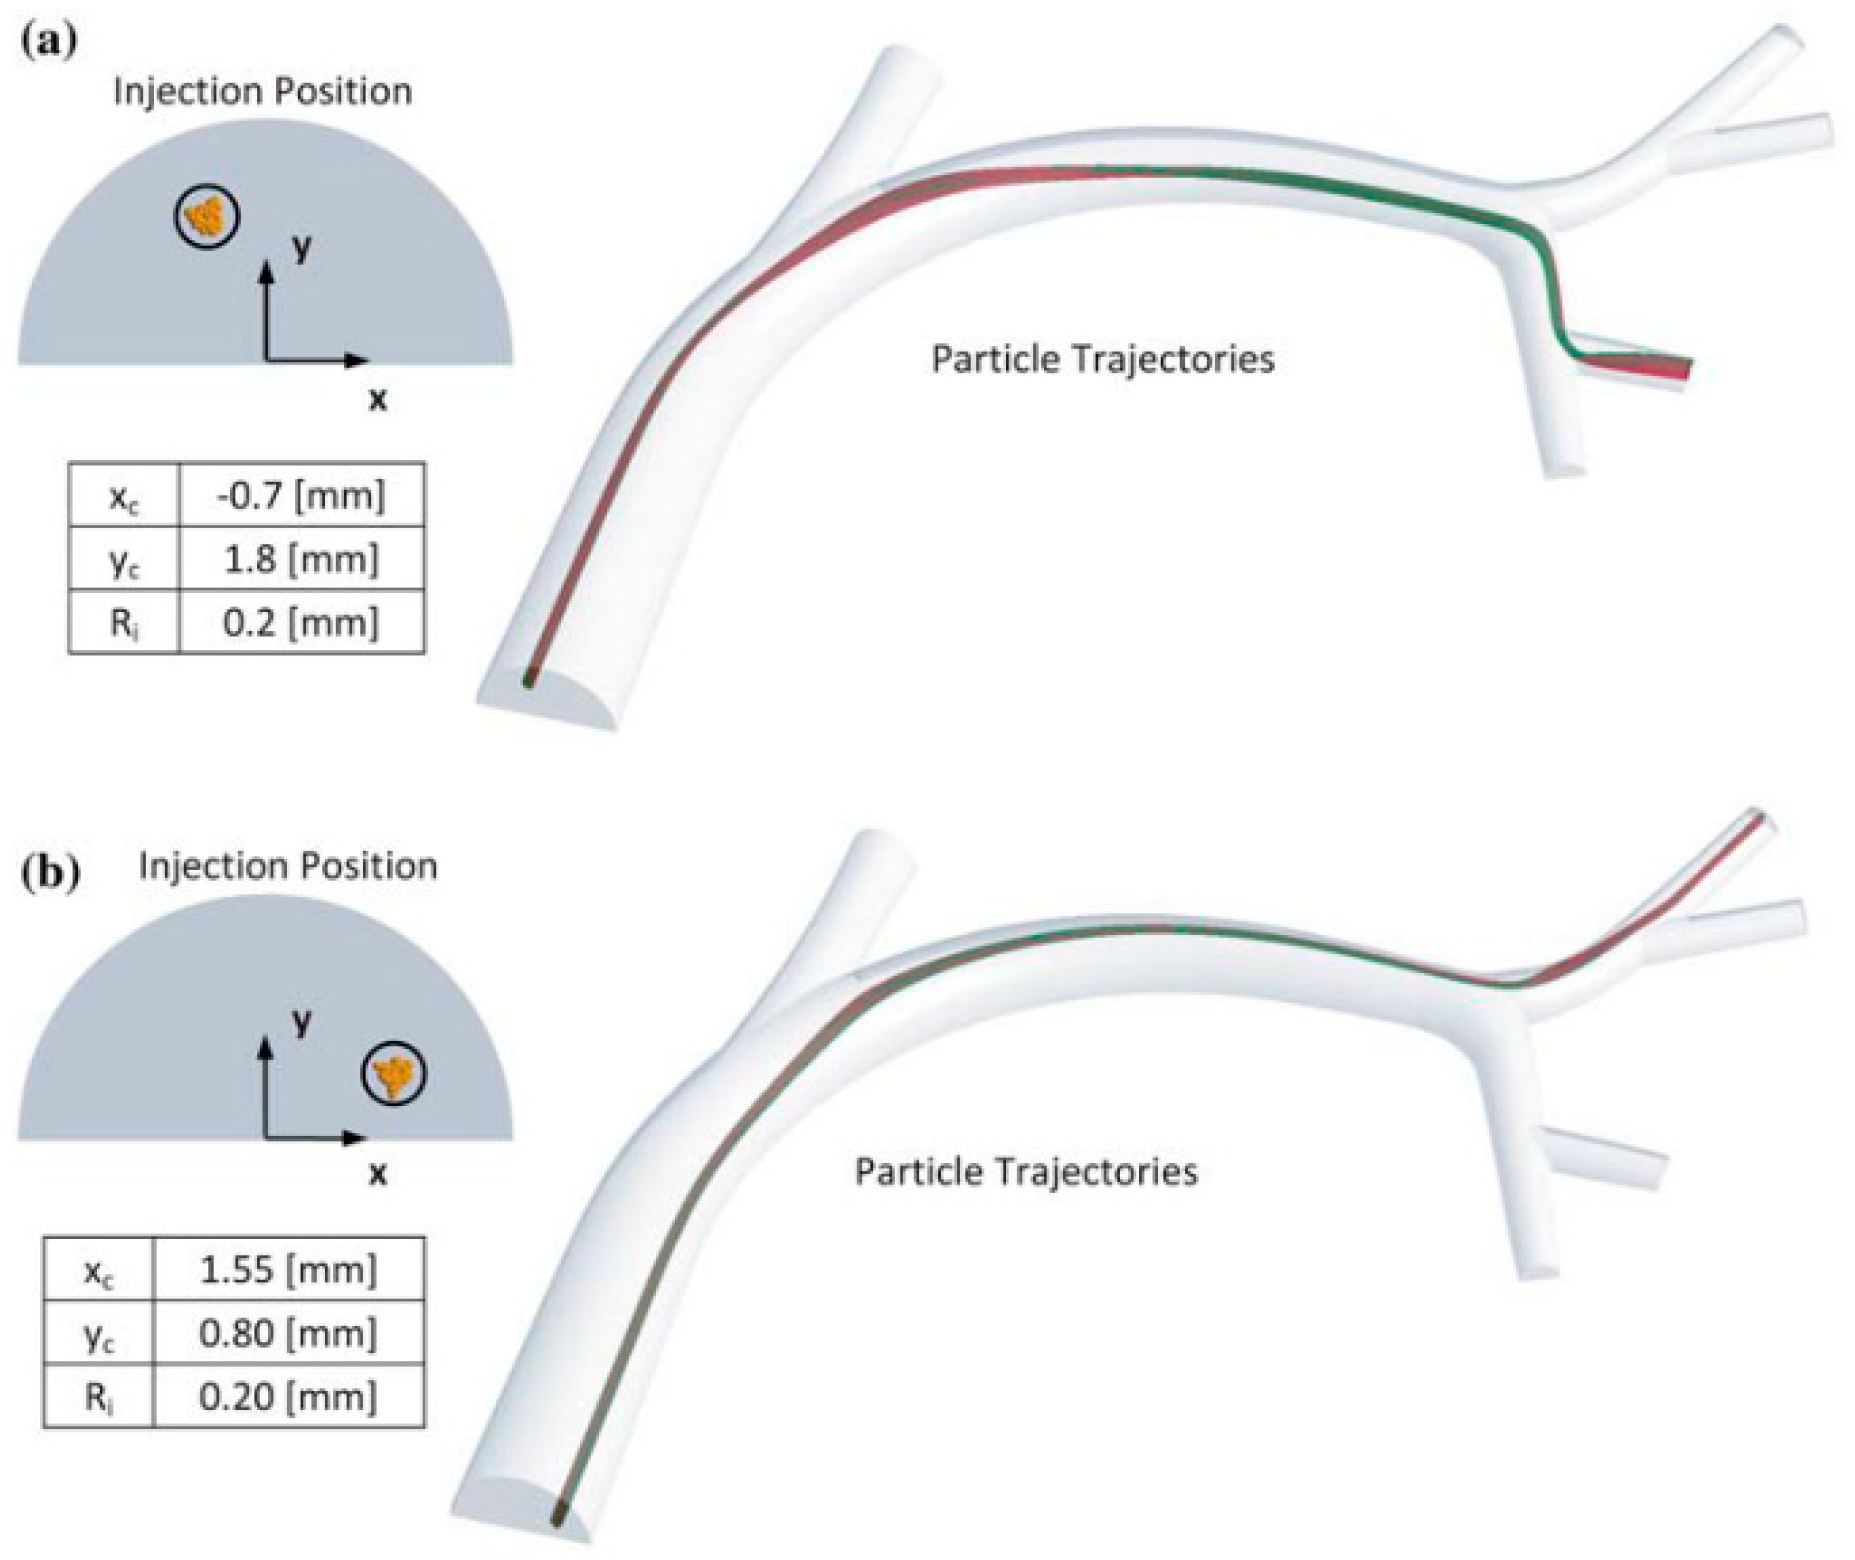
Computational fluid dynamic (CFD) simulations have shown that precise tumor targeting can be achieved by controlling the catheter tip location within the cross-section of the common hepatic artery (CHA) (mean diameter 6.3 ± 0.9 mm) [7], as shown in Figure 1. This finding has been validated experimentally by Richards et al. [6], who concluded that the development of an actuated microcatheter is necessary for direct tumor targeting to be realized. Therefore, to position a microcatheter anywhere within the cross section of the CHA, a miniature actuator needs to be developed that can produce a stroke of at least 7 mm with minimal disruption to the blood flow around the catheter.
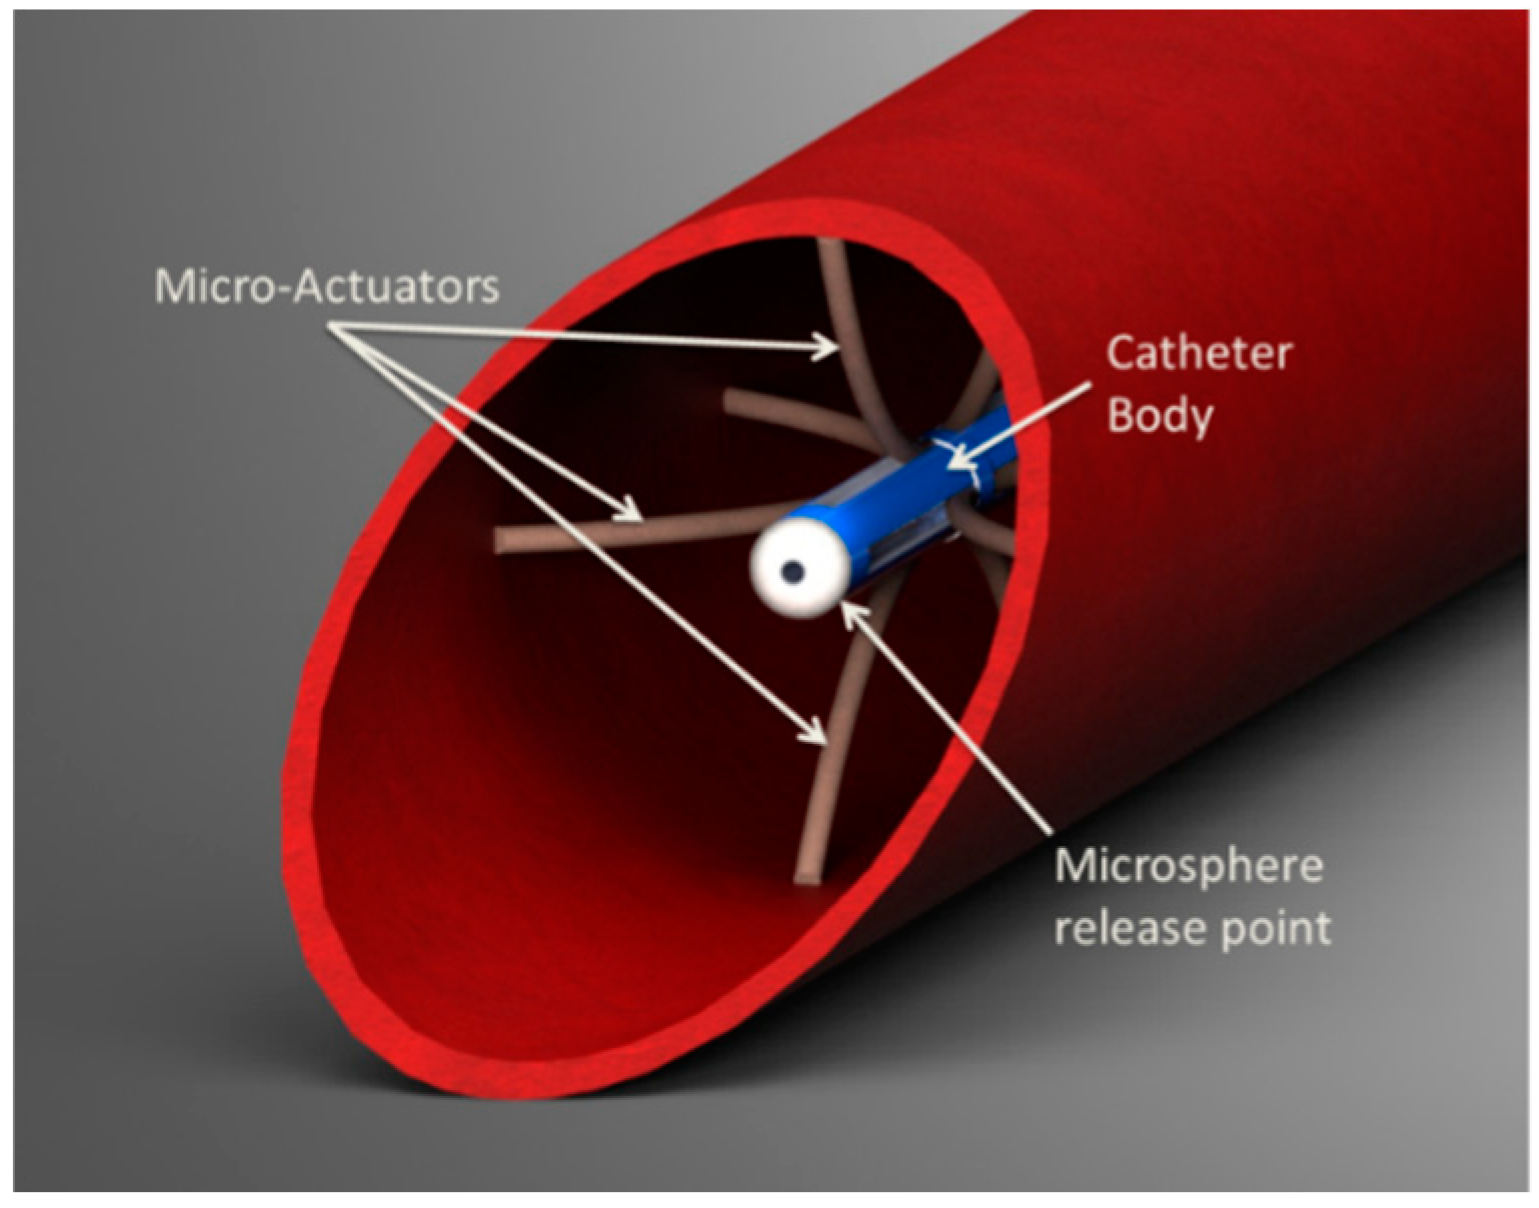
Because shape memory alloys (SMAs) exhibit high energy densities, they are attractive options for microscale actuation [8]. One actuator option consists of shape-set SMA tendons embedded within an elastic structure to generate large bending moments. The elastic structure of this “flexural actuator” produces a stress-induced martensitic phase transformation in the SMA, which can be recovered by Joule heating. While flexural actuators can also be designed by offsetting the SMA from the neutral axis, this offset increases the diameter of the actuator, making it less suitable for size-critical applications. One proposed active catheter concept, shown in Figure 2, uses eight shape-set flexural actuators arranged radially. With this configuration, the microcatheter’s release point within the cross section of the CHA could be precisely regulated while keeping the catheter parallel with the surrounding blood flow.
In this paper, we build on our previous research [9] to present a design optimization strategy for shape-set flexural actuators based on the homogenized energy framework [10,11]. Previous research on flexural actuators has focused on modeling and understanding the influences of flexible beam composition. Lagoudas, et al. successfully modeled a flexible rod with a single embedded off-neutral axis SMA fiber [12]. Wang, et al. presented numerical simulations and an experimental validation of a similar actuator composed of a flexible inner cylindrical beam, a SMA tendon, and an outer elastic cylindrical beam [12]. These designs, however, are difficult to miniaturize because the offset SMA increases the diameter of the actuator and introduces complexity into the manufacturing process.
Baz, et al. modeled shape-set SMA strips embedded on the neutral plane in a fiberglass beam [13]. The model showed good correlation with experimental data, proving that shape-setting SMA is a viable way to control the shape of a flexural actuator. However, the model did not take into account stress non-linearities across the cross-section of the SMA. Ryu, et al. [14] investigated the relationship between composite beam stiffness and bending performance.
The remainder of this paper is organized as follows. The flexural actuator system model is presented first. Next, the experimental setup is presented. The SMA model parameters are then estimated using a single-objective genetic algorithm. A multi-objective genetic algorithm is utilized to optimize actuator design parameters. Finally, modeled and experimental data are compared.
2. System Model
Each flexural actuator design consists of two components: a curved SMA tendon embedded within a straight elastic sleeve. The SMA tendon (diameter a, straight length L, and connection length x as in Figure 3a) is shape-set (or thermally trained) to a particular curvature κ0, where
and R is the radius of the curvature, shown in Figure 3a. The SMA tendon is embedded within a rectangular elastic sleeve (height h, width w, and length L, as in Figure 3b) which produces a strain-induced phase transition to detwinned martensite, resulting in a reduced deactivated equilibrium curvature κd (Figure 3c). As the tendon is heated to temperatures above the austenitic finish temperature Af, the material undergoes a phase transformation to austenite and recovers some of this strain, establishing a larger activated equilibrium curvature κa, such that κd < κa < κ0.
To accurately model the deactivated and activated displacements, the equilibrium curvature must be found for each SMA state. Curvature is related to tip displacement by
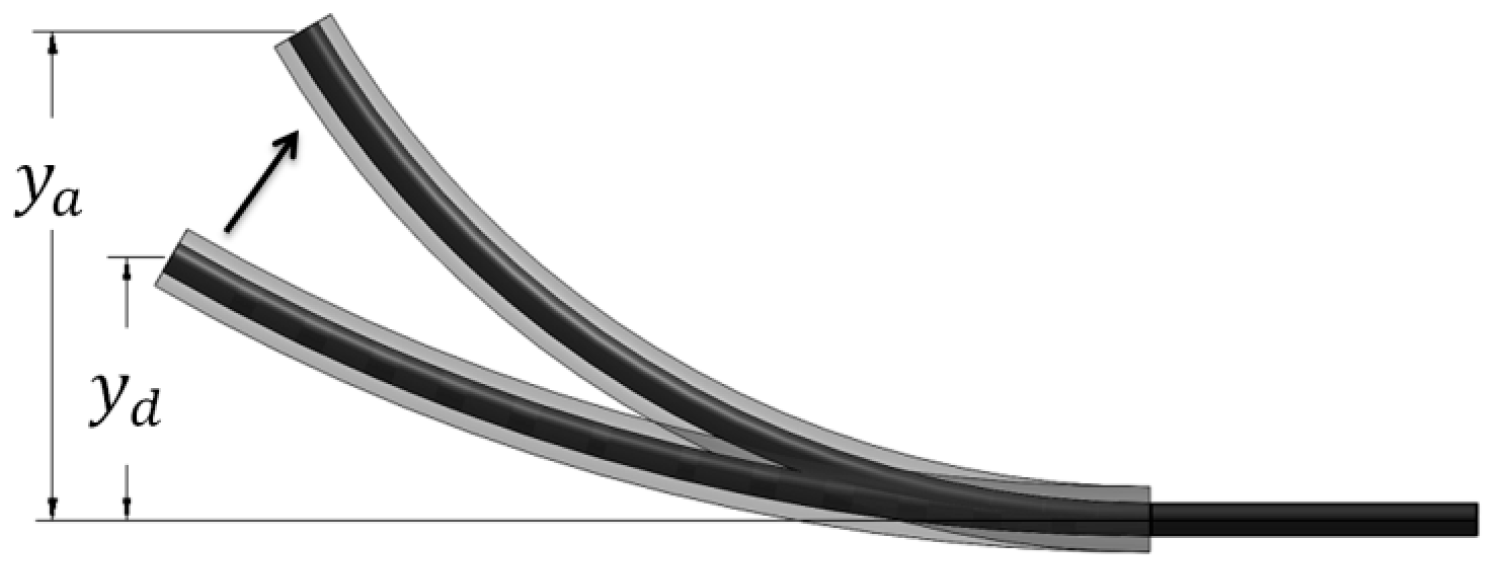
To enable precise catheter navigation and positioning, the deactivated displacement yd must be minimized while the activated displacement ya must be maximized (Figure 4).
2.1. Homogenized Energy Model of SMA Flexural Actuators
The homogenized energy model (HEM) is used to describe the nonlinear hysteretic relationships between stress, strain, and temperature [10]. The HEM is a macroscopic model that incorporates material inhomogeneities and interaction effects. In [10], the macroscopic strain is modeled as a function of applied stress. Here, we invert the relationship to obtain the macroscopic stress
where the local stress
depends on the SMA phase fractions: austenite xA, martensite plus xM+, and martensite minus xM-. The relative stress σR and interaction stress σI are assumed to be manifestations of underlying densities that affect the equilibrium phase fractions. In Equation (4), EA is the austenitic elastic modulus, EM is the martensitic elastic modulus, and εT is the maximum recoverable strain.
2.2. Equilibrium Equations
At equilibrium, the composite actuator’s internal forces and moments must sum to zero. Neglecting gravity and external forces, the actuator’s equilibrium position is solely determined by the moment balance between the SMA tendon and the elastic sleeve (Figure 5a). The elastic moment is given by
where E is the sleeve’s elastic (Young’s) modulus, I is its area moment of inertia, and κ is its curvature. The SMA moment is given by
where dA is the differential area of the tendon cross-section, as shown in Figure 5b. Note that the stress depends non-linearly on strain ε and temperature T.
We assume that strain varies linearly over the cross-sectional area according to
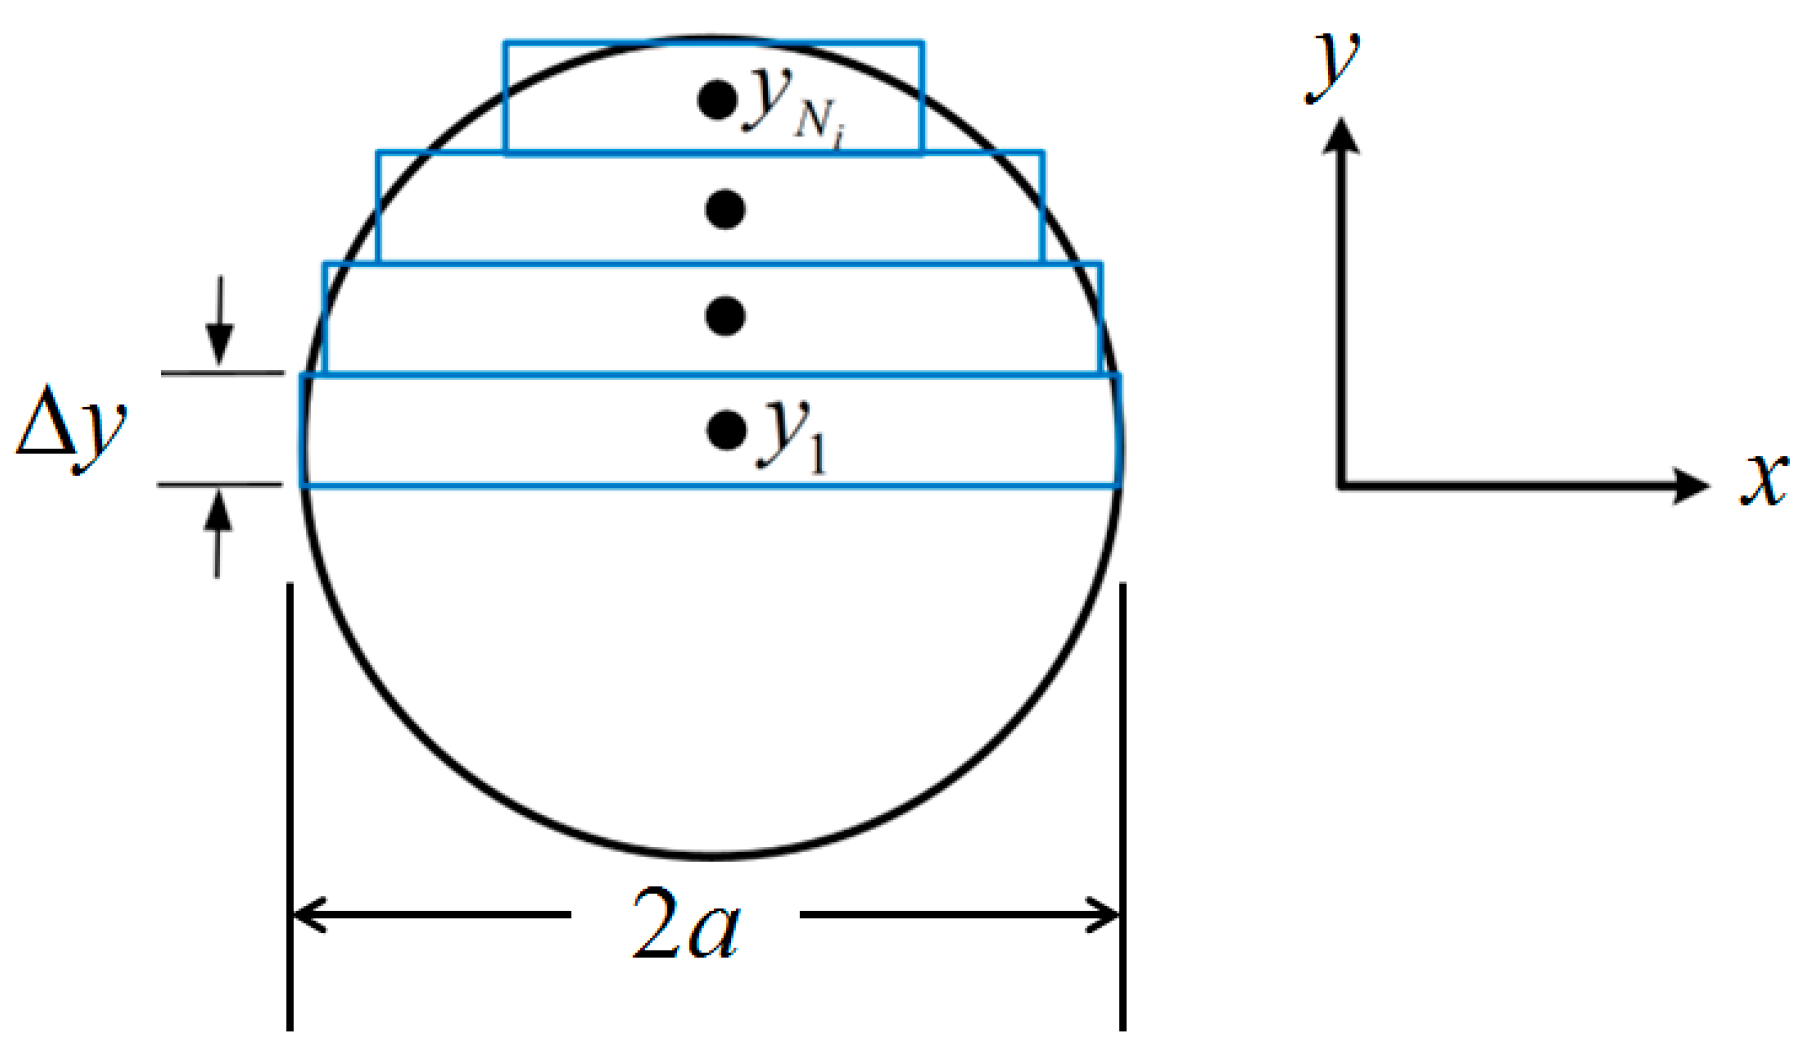
Therefore, at the initial (shape-set) curvature κ0, the SMA has zero strain over its cross-sectional area.The moment integral (6) is discretized using rectangular elements [15], as shown in Figure 6. Assuming the stress distribution is symmetric about the neutral axis, this discretization yields
where a is the SMA tendon radius, yi is the midpoint of the rectangle, and is the width of the rectangle.
The equilibrium deactivated curvature minimizes
where T∞ is the ambient temperature. Equation (9) can be solved using a variety of nonlinear optimization algorithms; here, we employ the golden section search method [16]. After finding the deactivated curvature (and associated equilibrium phase fractions), the equilibrium activated curvature minimizes
where Tss is the SMA’s activated steady-state temperature.
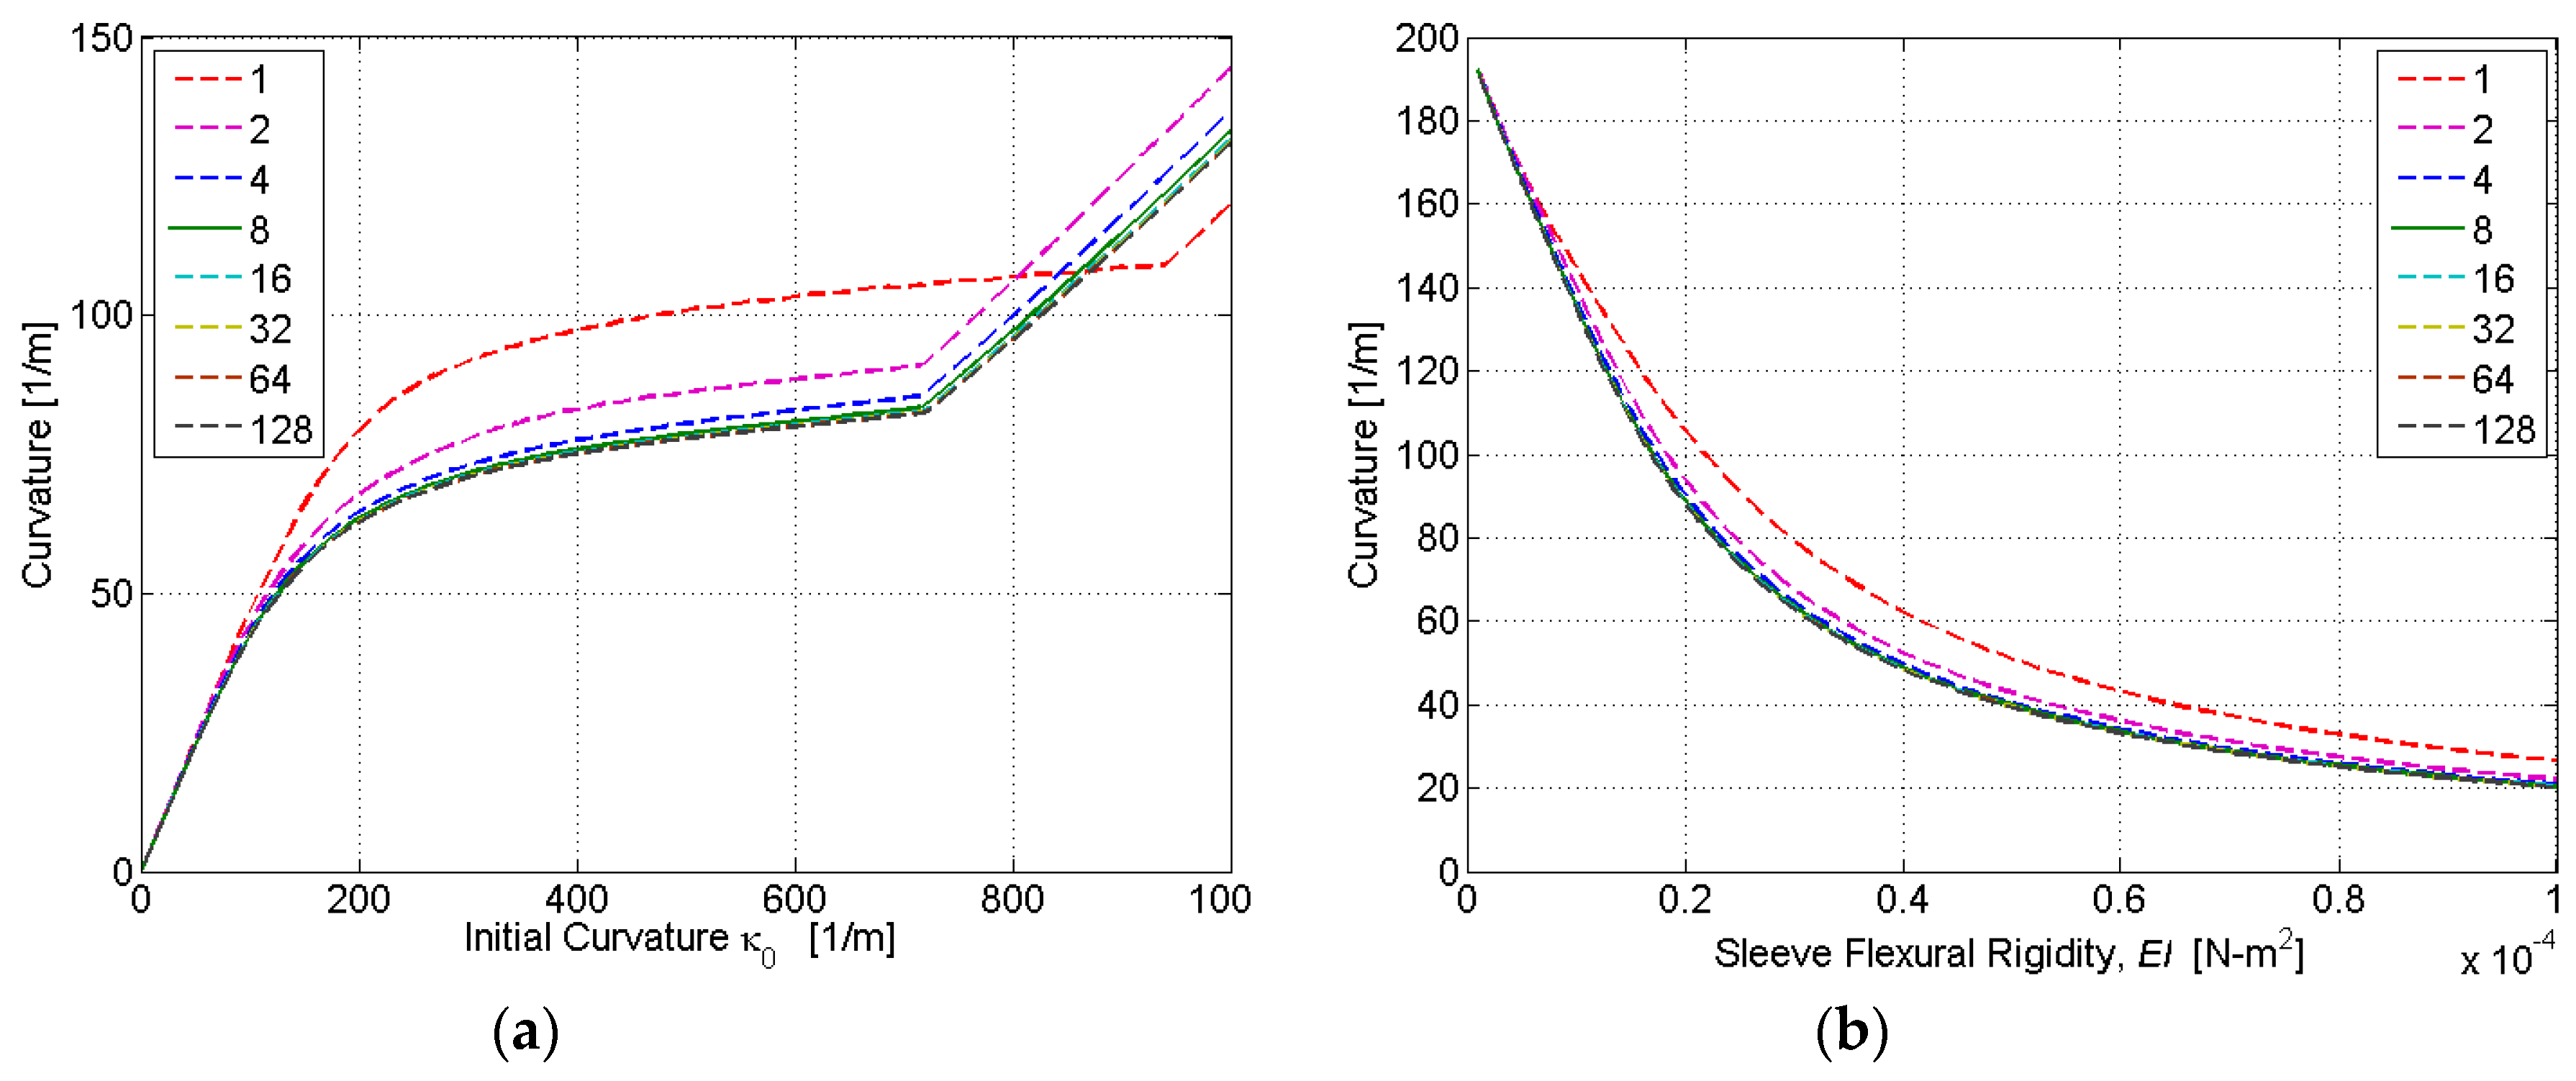
To determine the ideal number of discretization layers, simulations were conducted for a varying initial curvature κ0 and sleeve flexural rigidity EI. The nonlinear relationship between the initial and final curvature in Figure 7 is due to the nonlinear stress–strain characteristics of SMA, which are included in our HEM model. At very low initial strains, the SMA is in its austenite phase, and the stress–strain relationship is relatively linear. This characteristic is evident in Figure 7a for initial curvatures up to approximately 100 m−1. At larger strains, the austenite to martensite transformation causes a plateauing of the stress–strain relationship. This characteristic is evident in Figure 7a for initial curvatures between approximately 100 and 700 m−1. When the phase transformation is complete (to fully detwinned martensite), a linear stress–strain relationship resumes. This characteristic is evident in Figure 7a for initial curvatures above approximately 700 m−1. As shown in Figure 7, the accuracy of computed actuator curvature improves with the number of discretization layers (N). However, because computational time is directly proportional to N, there exists a tradeoff between model accuracy and computational time. Based on the simulation results, N = 8 was found to adequately balance this tradeoff, as it produced curvature estimates within 2% of the full-order model (N = 128) with only 6.25% of the computational burden.
3. Experimental Setup
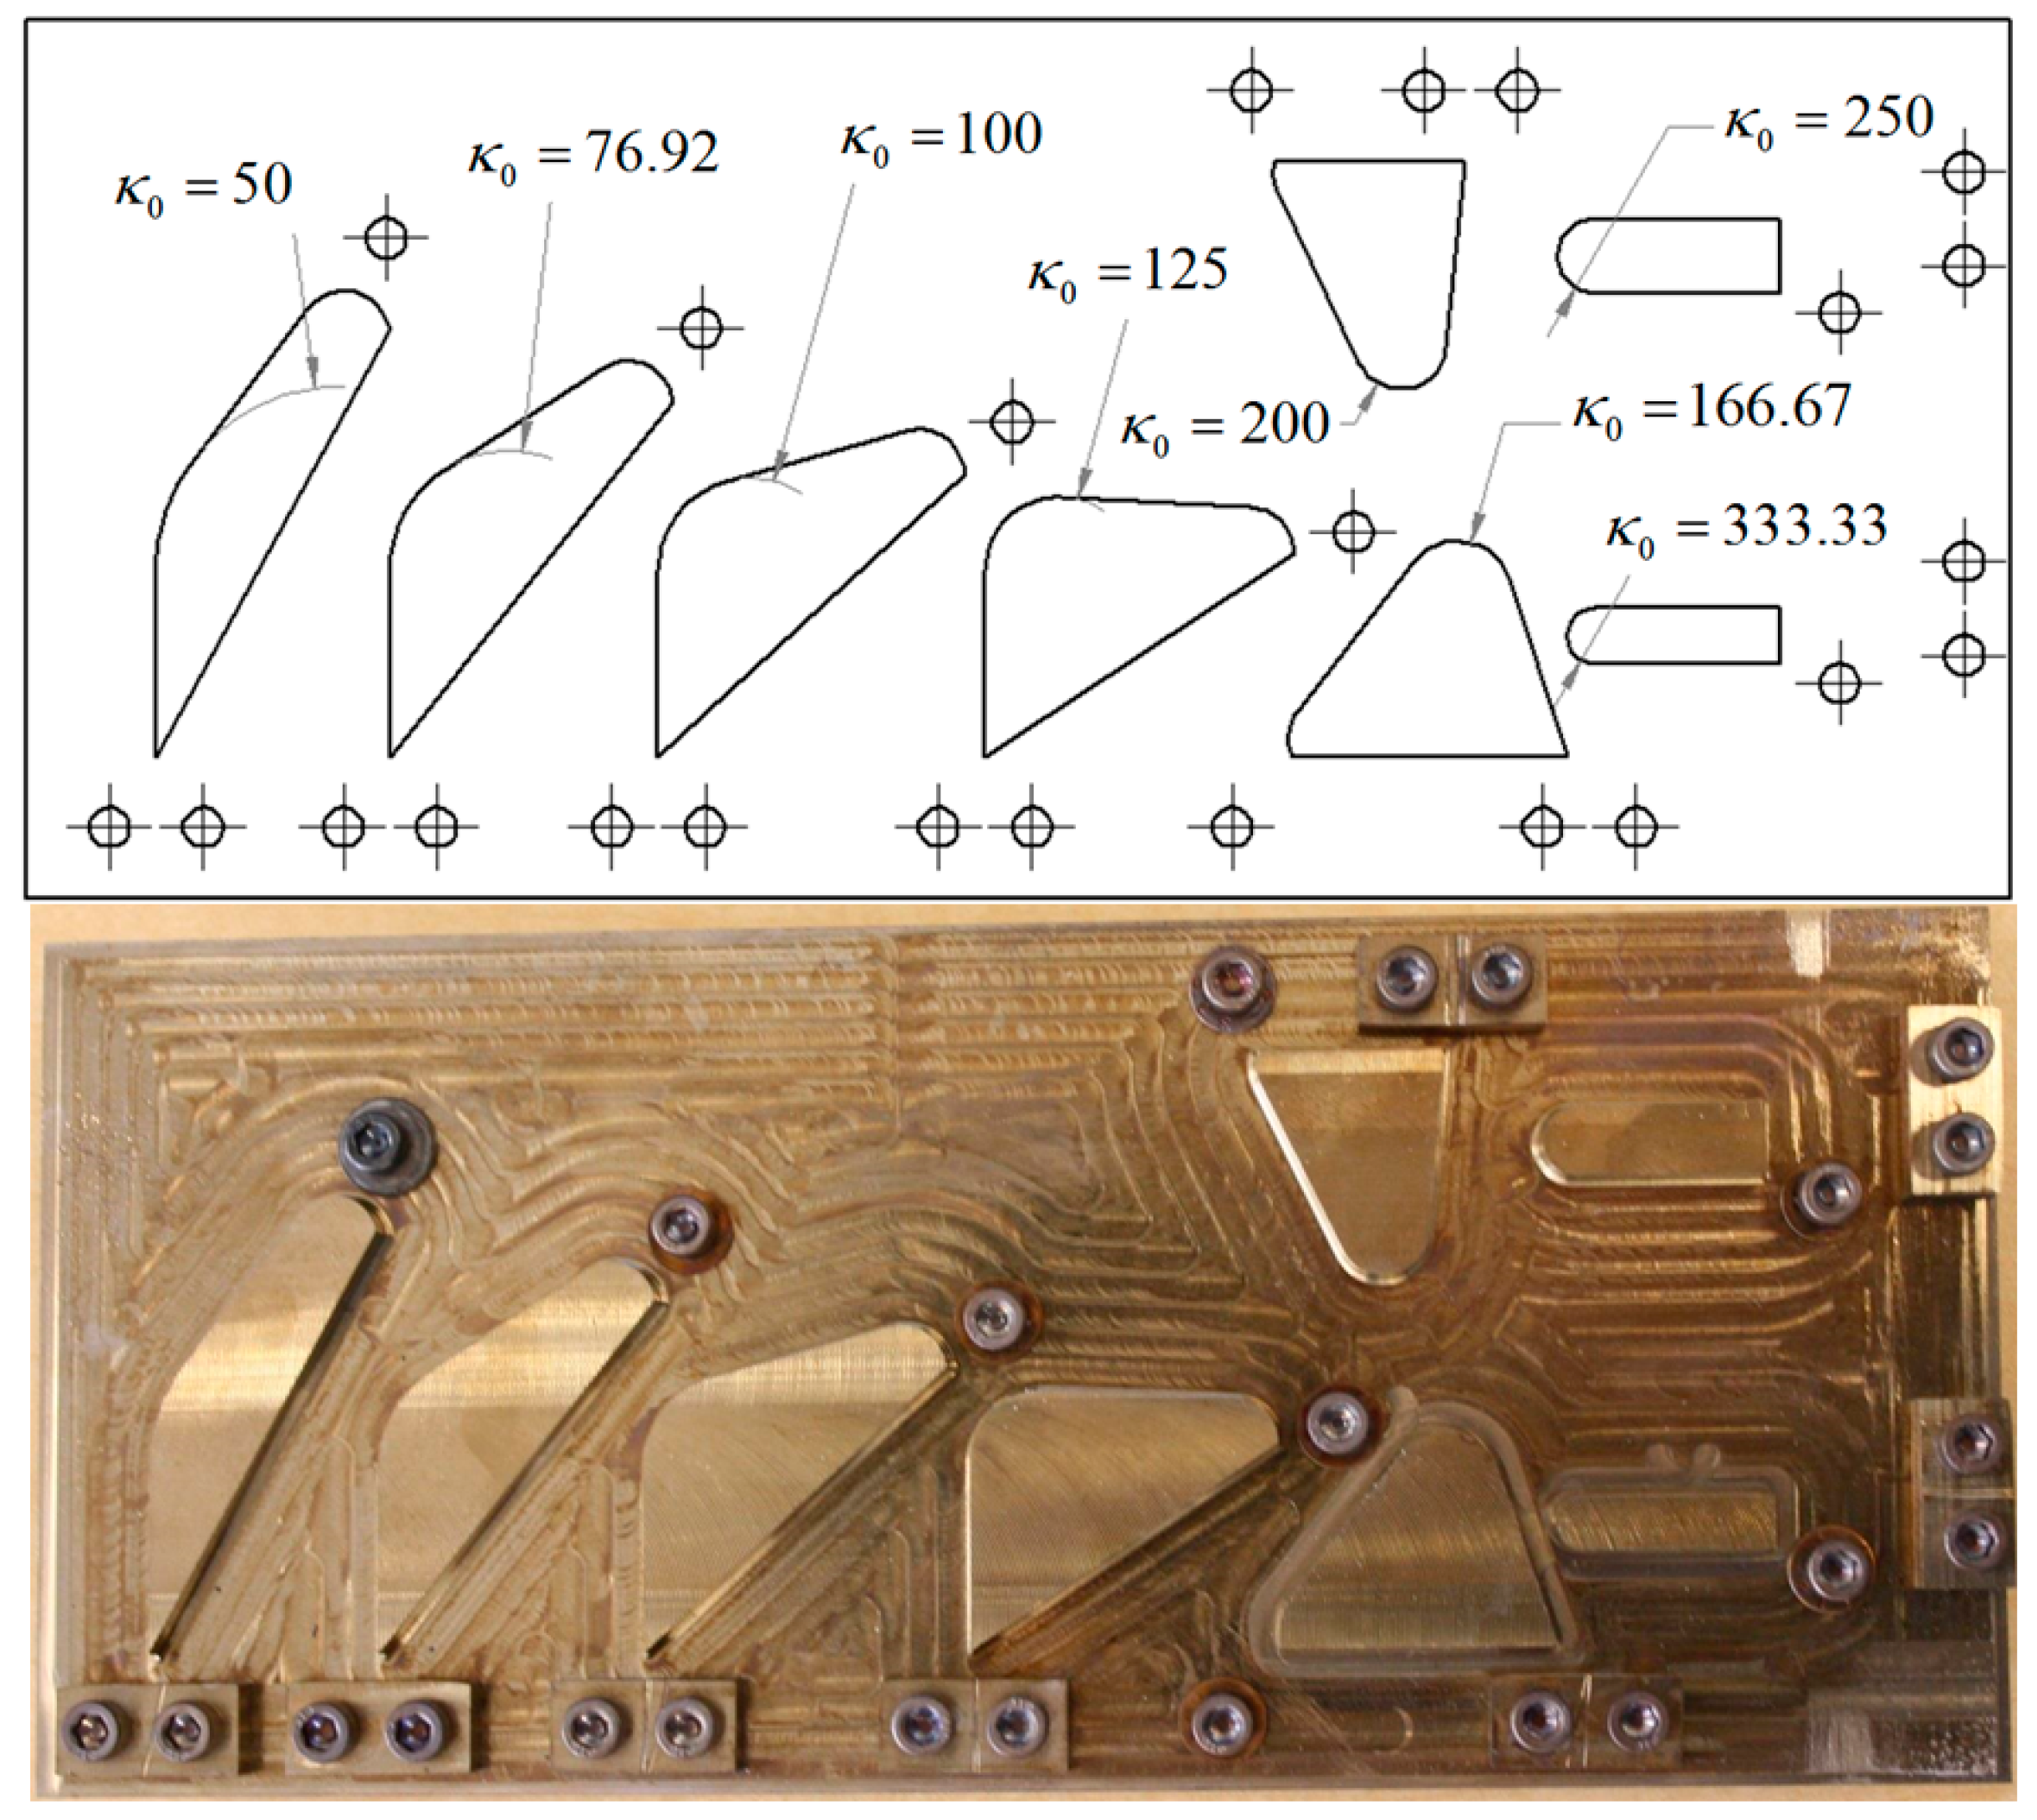
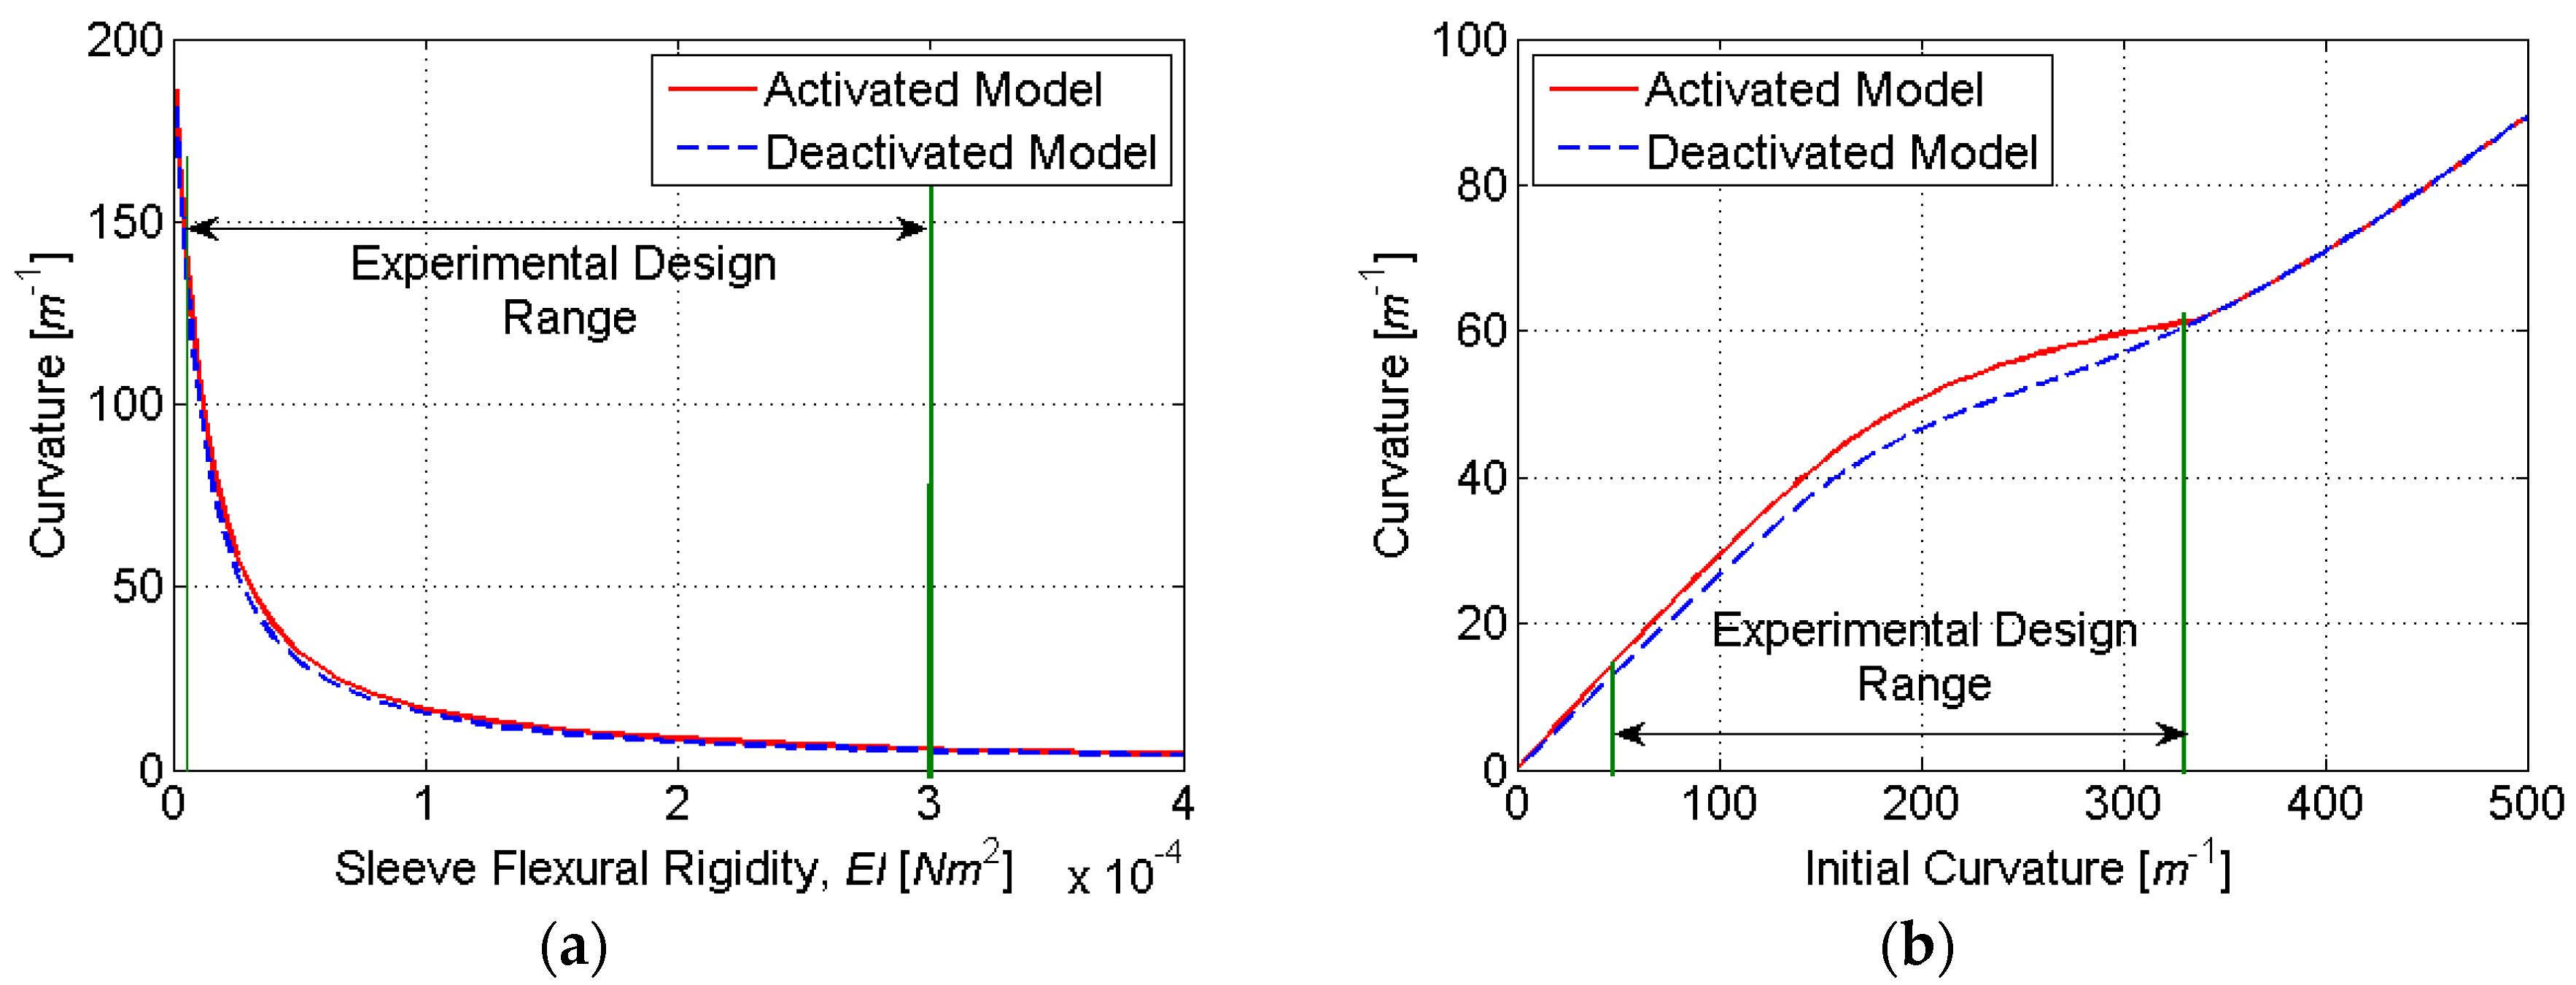
To constrain the SMA tendons during the shape setting process, a custom fixture (Figure 8) was designed and fabricated from a 304 stainless steel plate (0.305 m × 0.102 m × 0.013 m). This fixture features eight precisely machined curvature profiles ranging from 50 to 333 (m−1), with bolts and washers used to secure the SMA tendon during shape setting (Figure 9). This range of initial curvatures was determined from simulations to provide the largest difference in the activated and deactivated curvature (Figure 10b). To standardize the electrical resistance of each 0.31 mm diameter SMA tendon (Dynalloy, Inc., Irvine, CA, USA), each curvature profile was machined to provide the same arc length and straight length. Constant tendon tension was maintained by suspending a 400 g mass vertically from each SMA tendon during the fixture tightening process.
To shape-set the SMA tendons, a computer-controlled furnace (Thermolyne 1500) was preheated to 500 °C, and the loaded fixture was placed inside for 20 min [17]. Immediately following heating, the fixture was quenched in room-temperature water. After cooling, each SMA tendon was removed from the fixture, resulting in stress-induced deformations. To experimentally quantify each tendon’s initial curvature κ0, a programmable power supply (Agilent E3615A) was used to activate the specimen (maintaining 1.4 amps of DC current for 5.0 s, resulting in thermally-induced austenitic phase transformation). The curvature of the actuated specimen was measured by comparison to a printed scale.
To fabricate elastic sleeves with specific flexural rigidities (EI) in the bending plane, molds were designed with rectangular cross-sections (Figure 11). By specifying the cross-sectional height to be three times the width, the sleeve is 27 times more compliant in the bending plane than out-of-plane; the effects of self-weight are thus minimized during experimental testing. The range of flexural rigidities (6 × 10⁻⁶ to 3 × 10⁻⁴ Nm2) was determined from simulations to provide the largest change in activated and deactivated curvature (Figure 10). The molds were fabricated using rapid prototyping in ABSplus material (Dimension Elite, Stratasys, Eden Prairie, MN, USA). Nylon monofilament (0.31 mm diameter) was tensioned along the neutral axis of each rectangular mold to provide space for SMA tendon insertion. Each mold was cast with polydimethylsiloxane (PDMS, Dow Corning SYLGARD 184) and allowed to cure for two days.
Each actuator was assembled by inserting a shape-set SMA tendon into a molded elastic sleeve. The experimental set up consisted of a cantilevered actuator connected to a programmable power supply (E3615A, Agilent Technologies) by 36 AWG magnet wire. Actuation was achieved by passing 1.4 A of DC current through the SMA tendon for 30 s. The actuator was then deactivated for one minute, cooling via heat transfer to the ambient air. High-resolution photographs (Canon DS126191 EOS Rebel 10.1MP) were taken immediately before and after each actuation cycle. Digital images were acquired and stored for subsequent evaluation of κa and κd. The process of activating, deactivating and image acquisition was automated using a custom LabView program (National Instruments, Austin, TX, USA).
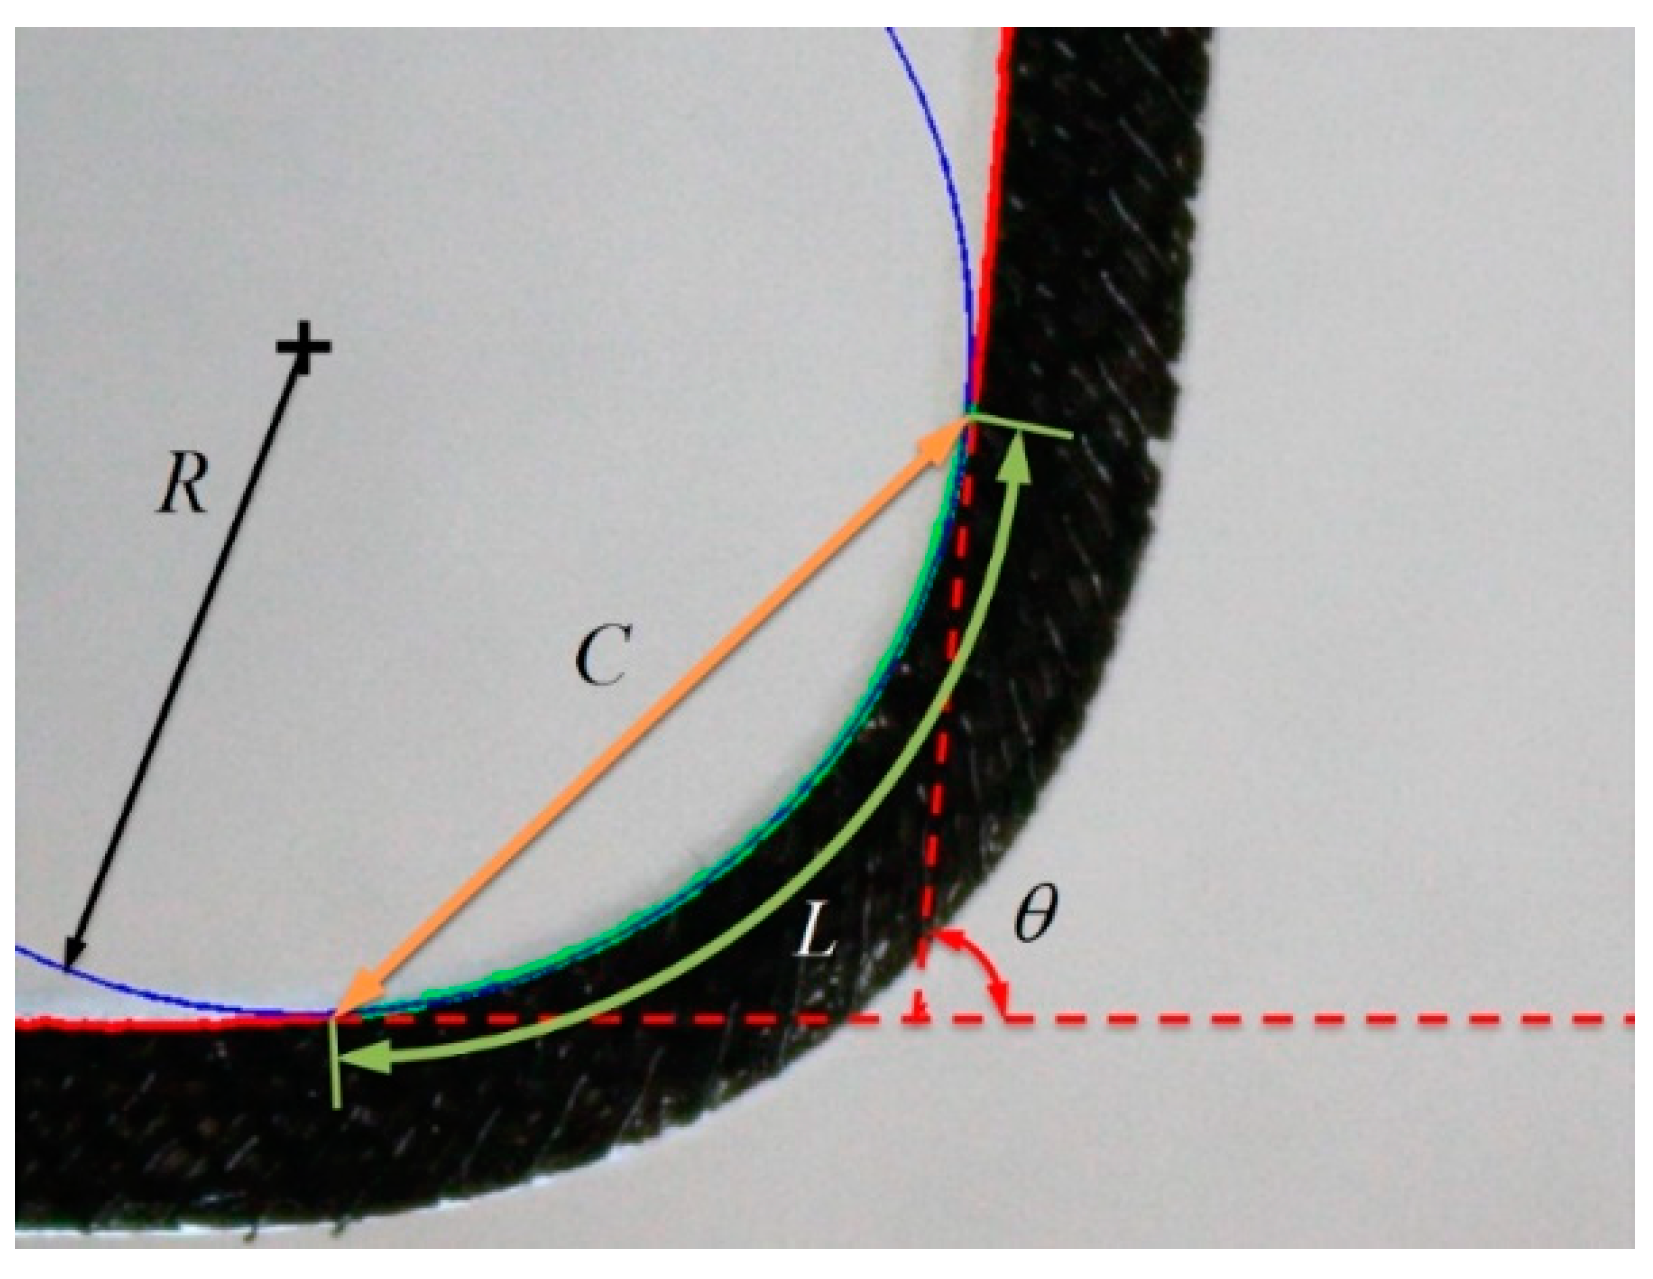
To compute κa and κd, an image processing code was developed using MATLAB’s Image Processing toolbox (Mathworks, Inc., Natick, MA, USA). The code applied golden-section optimization to find the bending radius R (Figure 12) that minimizes the difference between predicted (Lpred) and actual bending length (Lact) according to
where C is the corresponding chord length and θ is the included angle between the linear sections of the sleeve (Figure 12). To evaluate the curvature along the actuator’s neutral axis, half of the known width of the elastic sleeve was added to the computed inner radius (R). This computation was repeated for 110 consecutive actuations, averaging the last 10 cycles to eliminate variance and drift associated with low cycle fatigue [18].
Design optimization was conducted using multi-objective genetic algorithm (MOGA) techniques. Genetic algorithms (GAs) are optimization methods based on the principles of natural selection. These algorithms minimize (or maximize) one or more objective functions and are reliable and efficient in optimizing non-linear, multi-modal and complex systems. An excellent overview of GAs can be found in [19,20].
4. Results
4.1. HEM Parameter Optimization
A single-objective genetic algorithm was utilized to minimize
the sum of squared errors (SSE) between predicted and experimentally measured actuator curvatures. The 11 HEM stress density coefficients (αk,m and βk) and seven SMA constitutive model parameters (EA, EM, σL, ΔσT, εT, h and Tmax) were chosen as design variables. The design variables and their associated bounds are listed in Table 1.
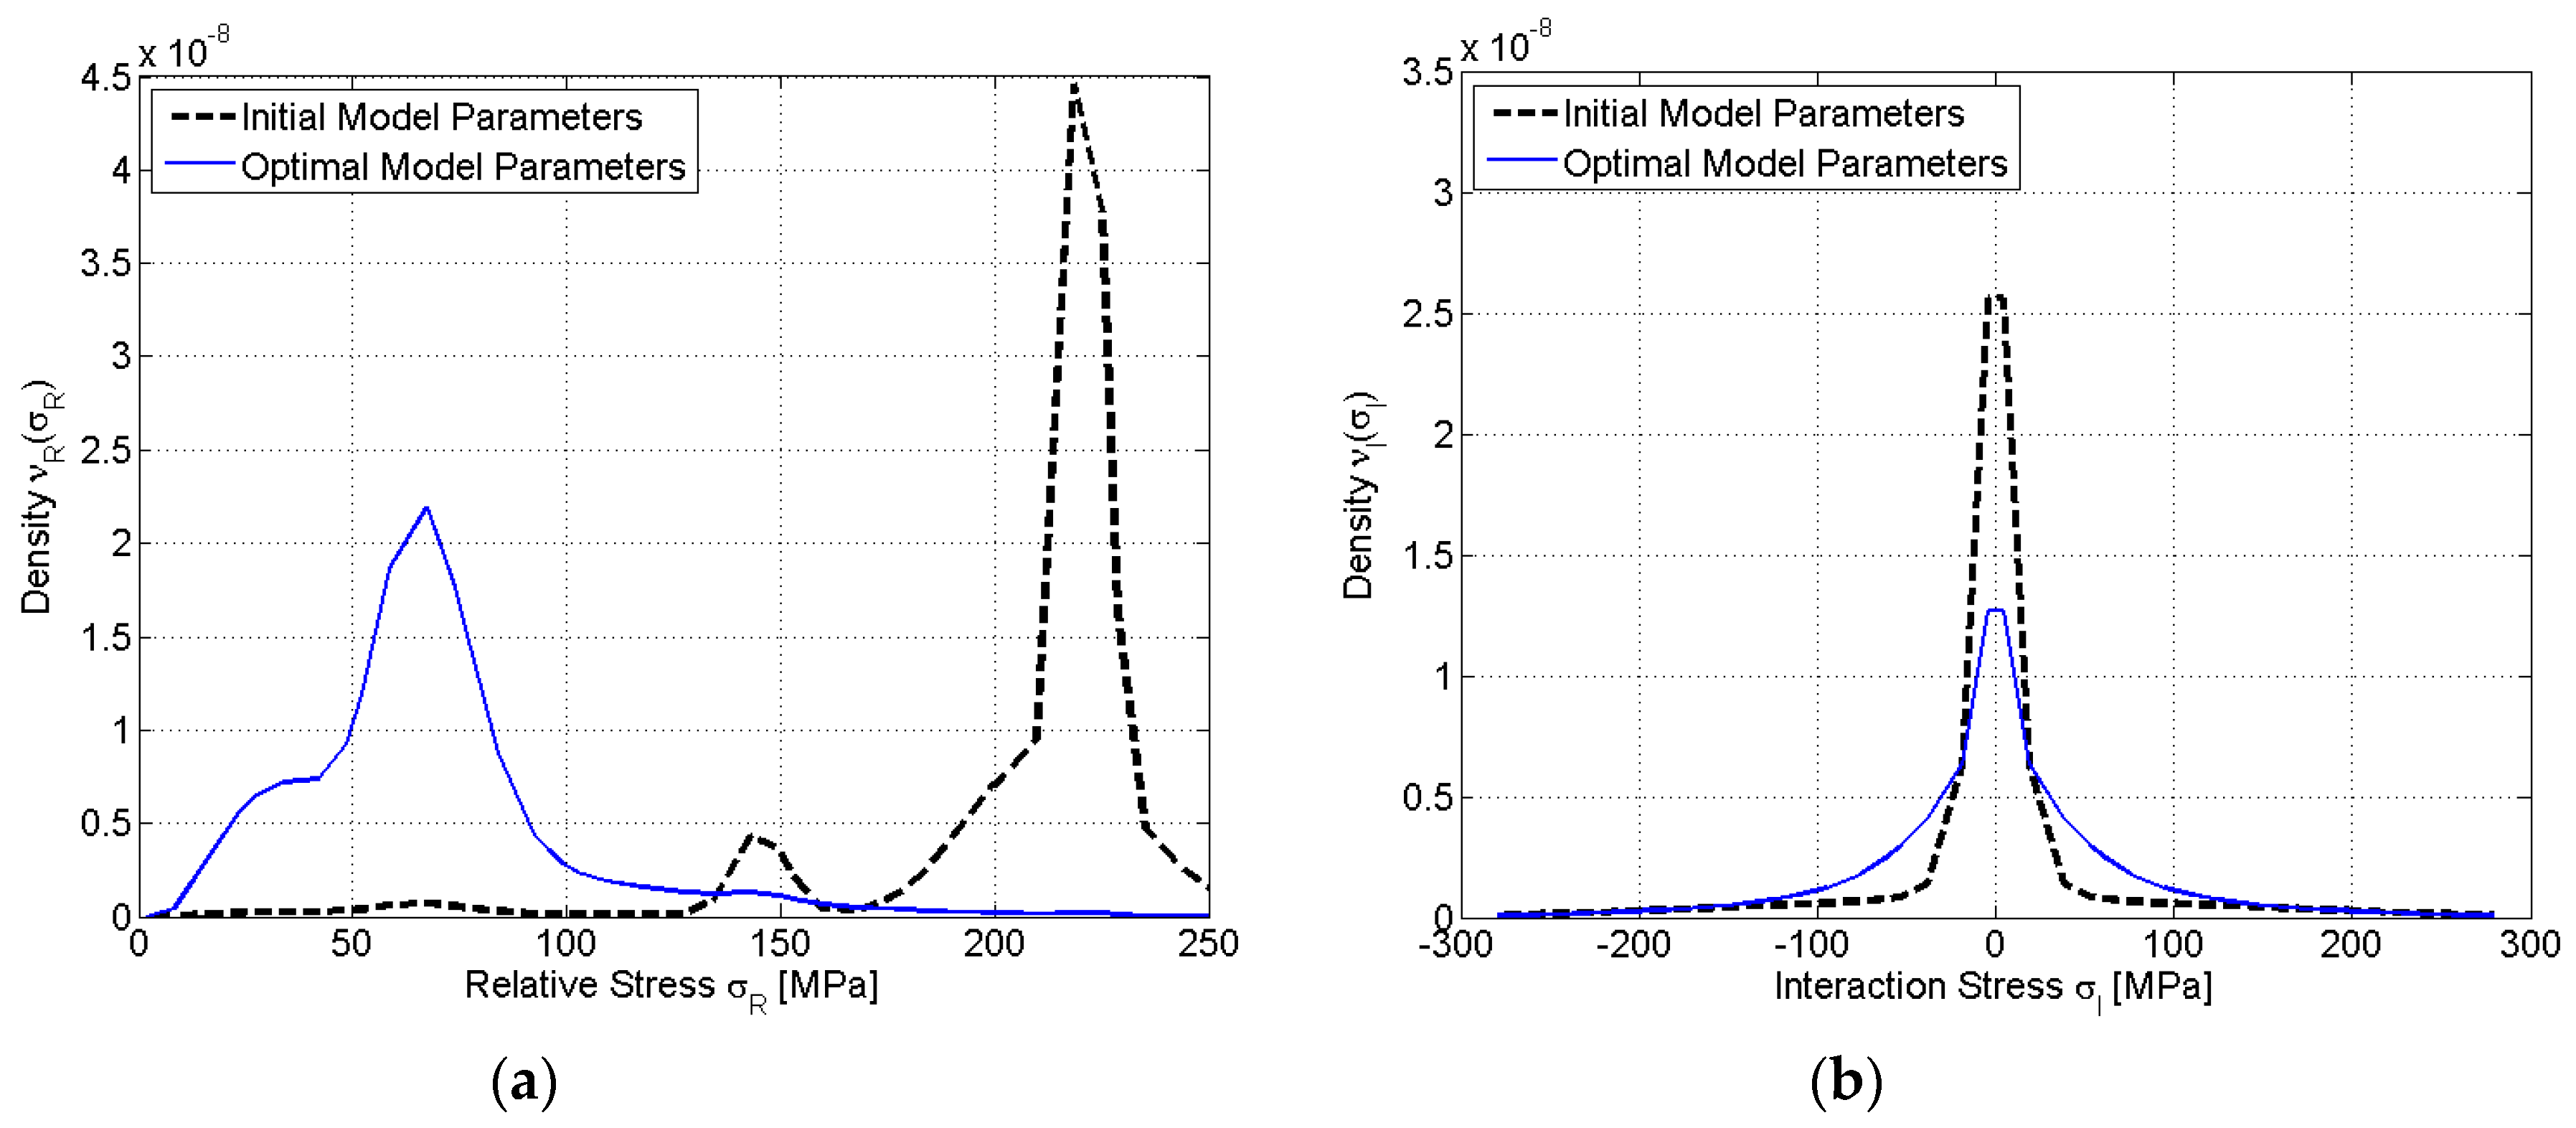
Experimental data was obtained for actuators with a fixed flexural rigidity (EI of 3 × 10⁻⁵ Nm2) and six different initial curvatures (κ0 = 100, 125, 167, 200, 250, and 333 m−1). Additional data was obtained for a fixed initial curvature (κ0 of 200 m−1) and four different values of flexural rigidity (EI = 6 × 10⁻⁶, 1.5 × 10⁻⁵, 3 × 10⁻⁵, 6 × 10⁻⁵ Nm2). The GA function in the MATLAB optimization toolbox was employed for single-objective design optimization. The design variables were real value encoded and 36 individuals were systematically populated within initial design variable bounds. The bounds were chosen from knowledge of the design space to speed convergence. Heuristic crossover was utilized with a crossover fraction of 1.2. The convergence criteria consisted of a minimum objective function gradient (1 × 10⁻⁶) and a generation limit (200). The initial and optimized model parameters are shown in Table 2 and in Figure 13. The initial parameters were taken from [10].
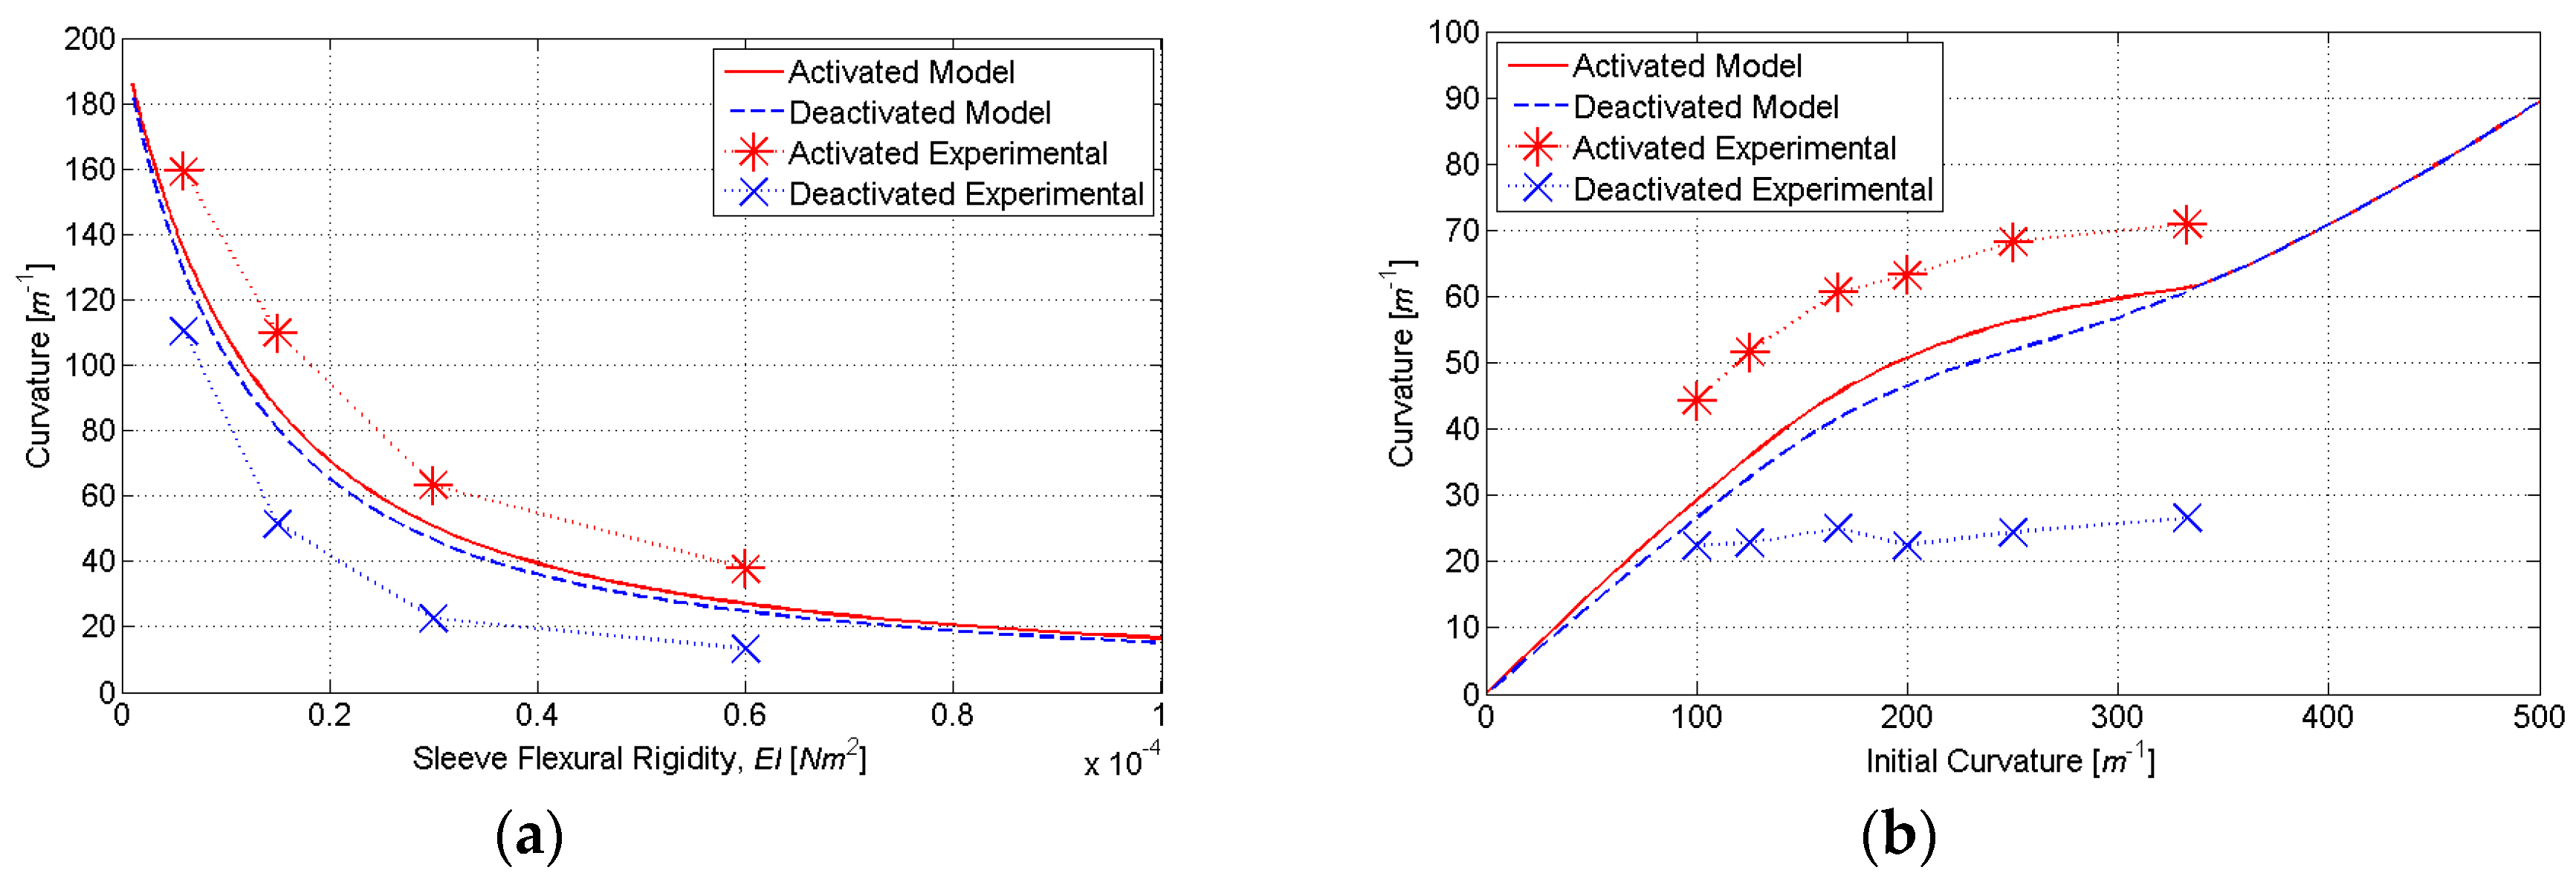
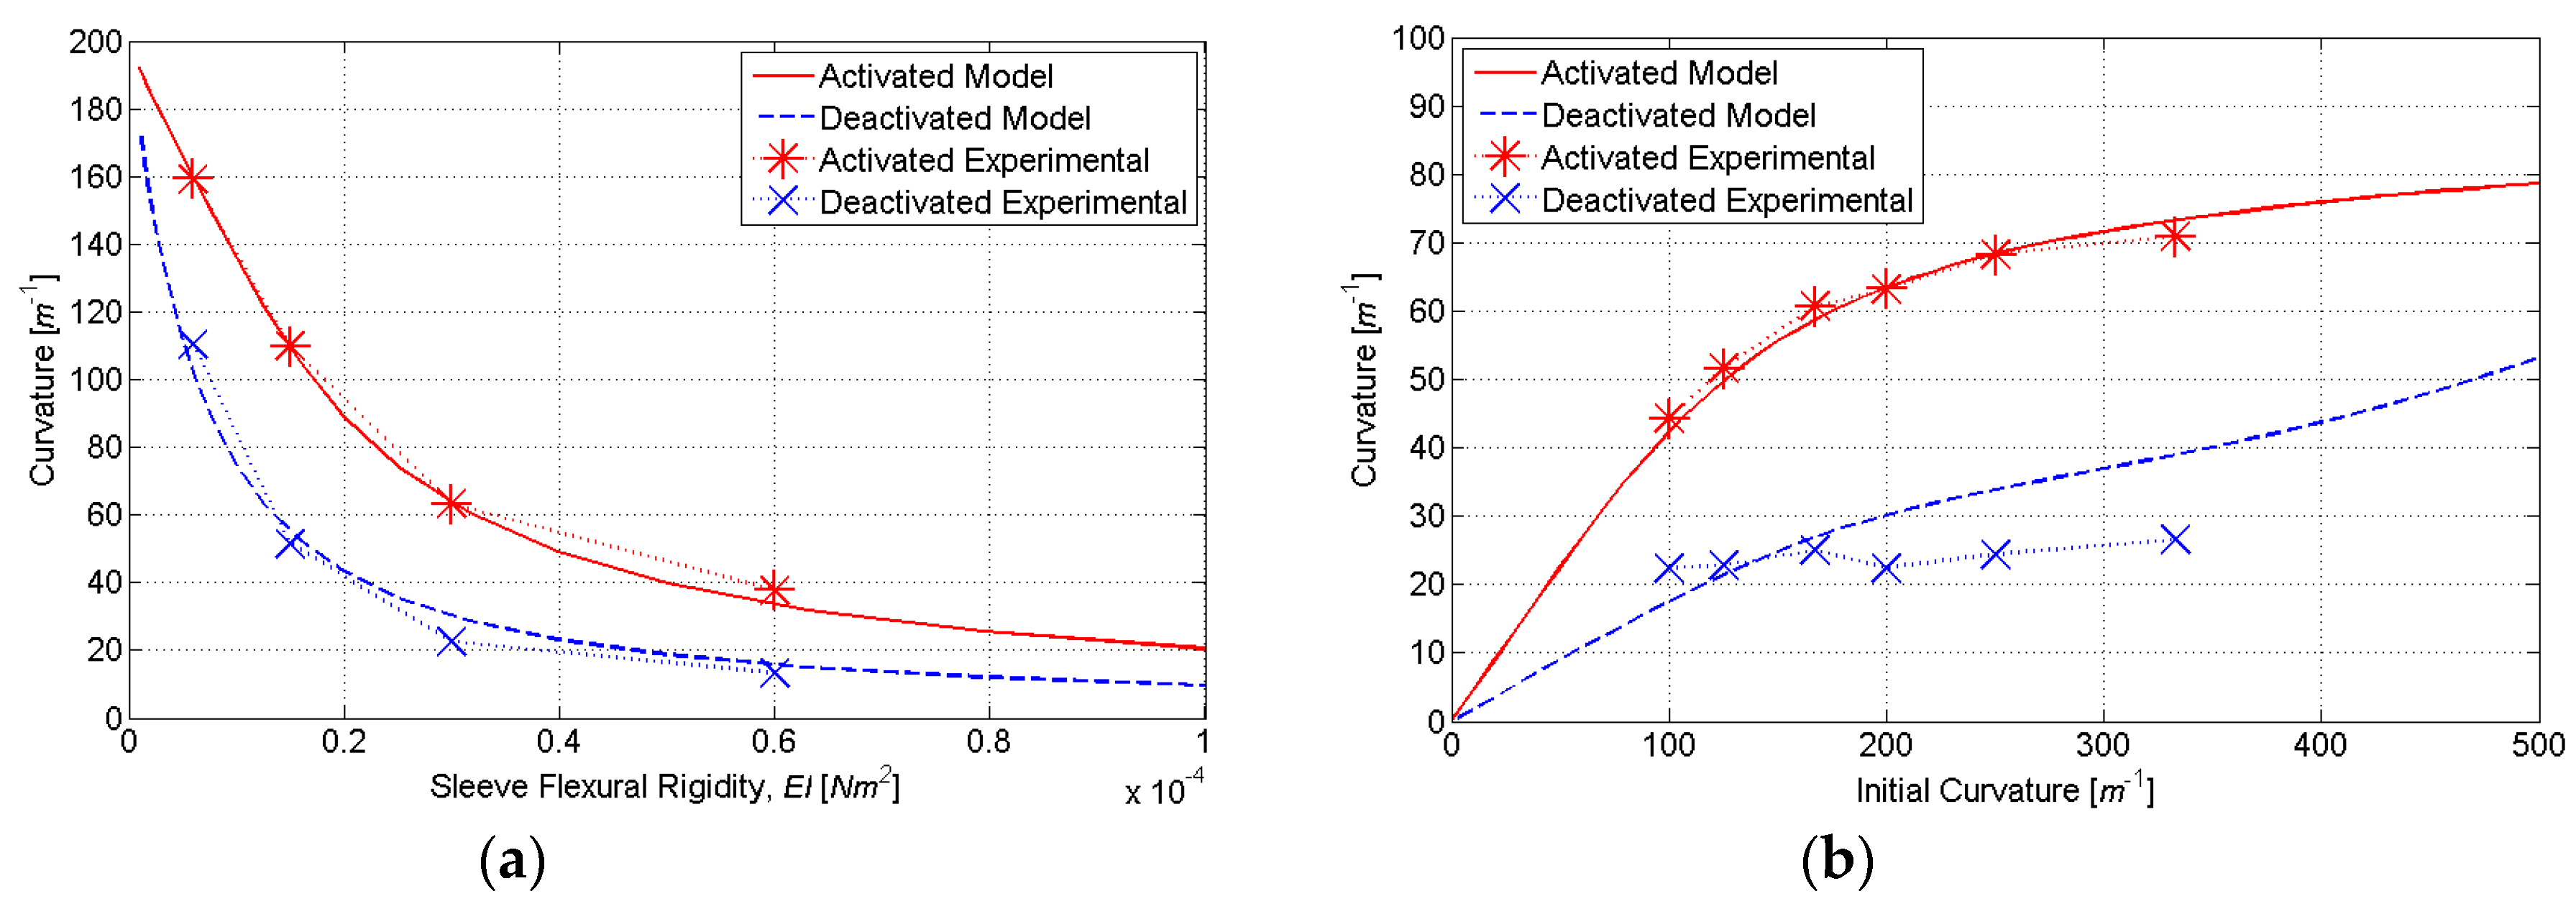
GA convergence was monitored for five simulations with different initialization parameters; all five simulations converged based on the minimum function gradient criteria and the simulation average SSE decreased from 7263 to 514.2 with a standard deviation of 7.1. Though the designs did not converge to the same values in the design space, all designs converged to approximately the same SSE. The optimized model parameter set that reduced SSE by 93% (Table 3) was selected for subsequent multi-objective optimization. Comparisons of the experimental data and initial (unoptimized) parameters are presented in Figure 14; the dependence of the actuator curvature on sleeve flexural rigidity is shown in Figure 14a, and its dependence on initial curvature is shown in Figure 14b. Differences between the two are primarily attributed to material parameter uncertainties (modulus of elasticity, etc.) and unmodeled dynamics (sliding friction between the SMA and sleeve, heat transfer modes, etc.). Figure 15 shows similar comparisons for the optimized model. The optimized HEM accurately characterizes the nonlinear dependence of the equilibrium curvature on sleeve flexural rigidity (Figure 15a) and the dependence of the actuator curvature on initial curvature (Figure 15b).
Comparing the optimized HEM parameters to the imposed parameter bounds reveals that the maximum recoverable strain lies on the upper bound. This indicates that the equilibrium model may need to take into account additional variables to more accurately predict equilibrium curvature: internal friction, non-linear elastic modulus of PDMS at high strains or the effect contact has on temperature distribution across the tendon. Despite these modeling limitations, the optimized model can still be used for design optimization.
4.2. Multi-Objective Optimization
To optimize the performance of the actuator, the deactivated displacement needs to be minimized while the activated displacement needs to be maximized. To accomplish this, a MOGA was utilized with κ0 and EI as the design variables. The optimized HEM and equilibrium curvature model are used to evaluate κa and κd, which are related to ya and yd via Equation (2). The actuator length (L = 0.011 m) was chosen to achieve 0.007 m displacement; the actuator is (Figure 12). To improve numerical conditioning, log10 (EI) was used to normalize the individuals for reproduction. The gamultiobj function in MATLAB was employed for the MOGA. Most of the GA settings were identical to the single-objective optimization case, with the exceptions of population (50) and minimum objective function gradient (1 × 10⁻⁴). Upper and lower parameter bounds were utilized for the population initialization (UBi and LBi, respectively), and values for subsequent populations (UB and LB) are shown in Table 4. The MOGA converged based on the minimum objective function gradient.
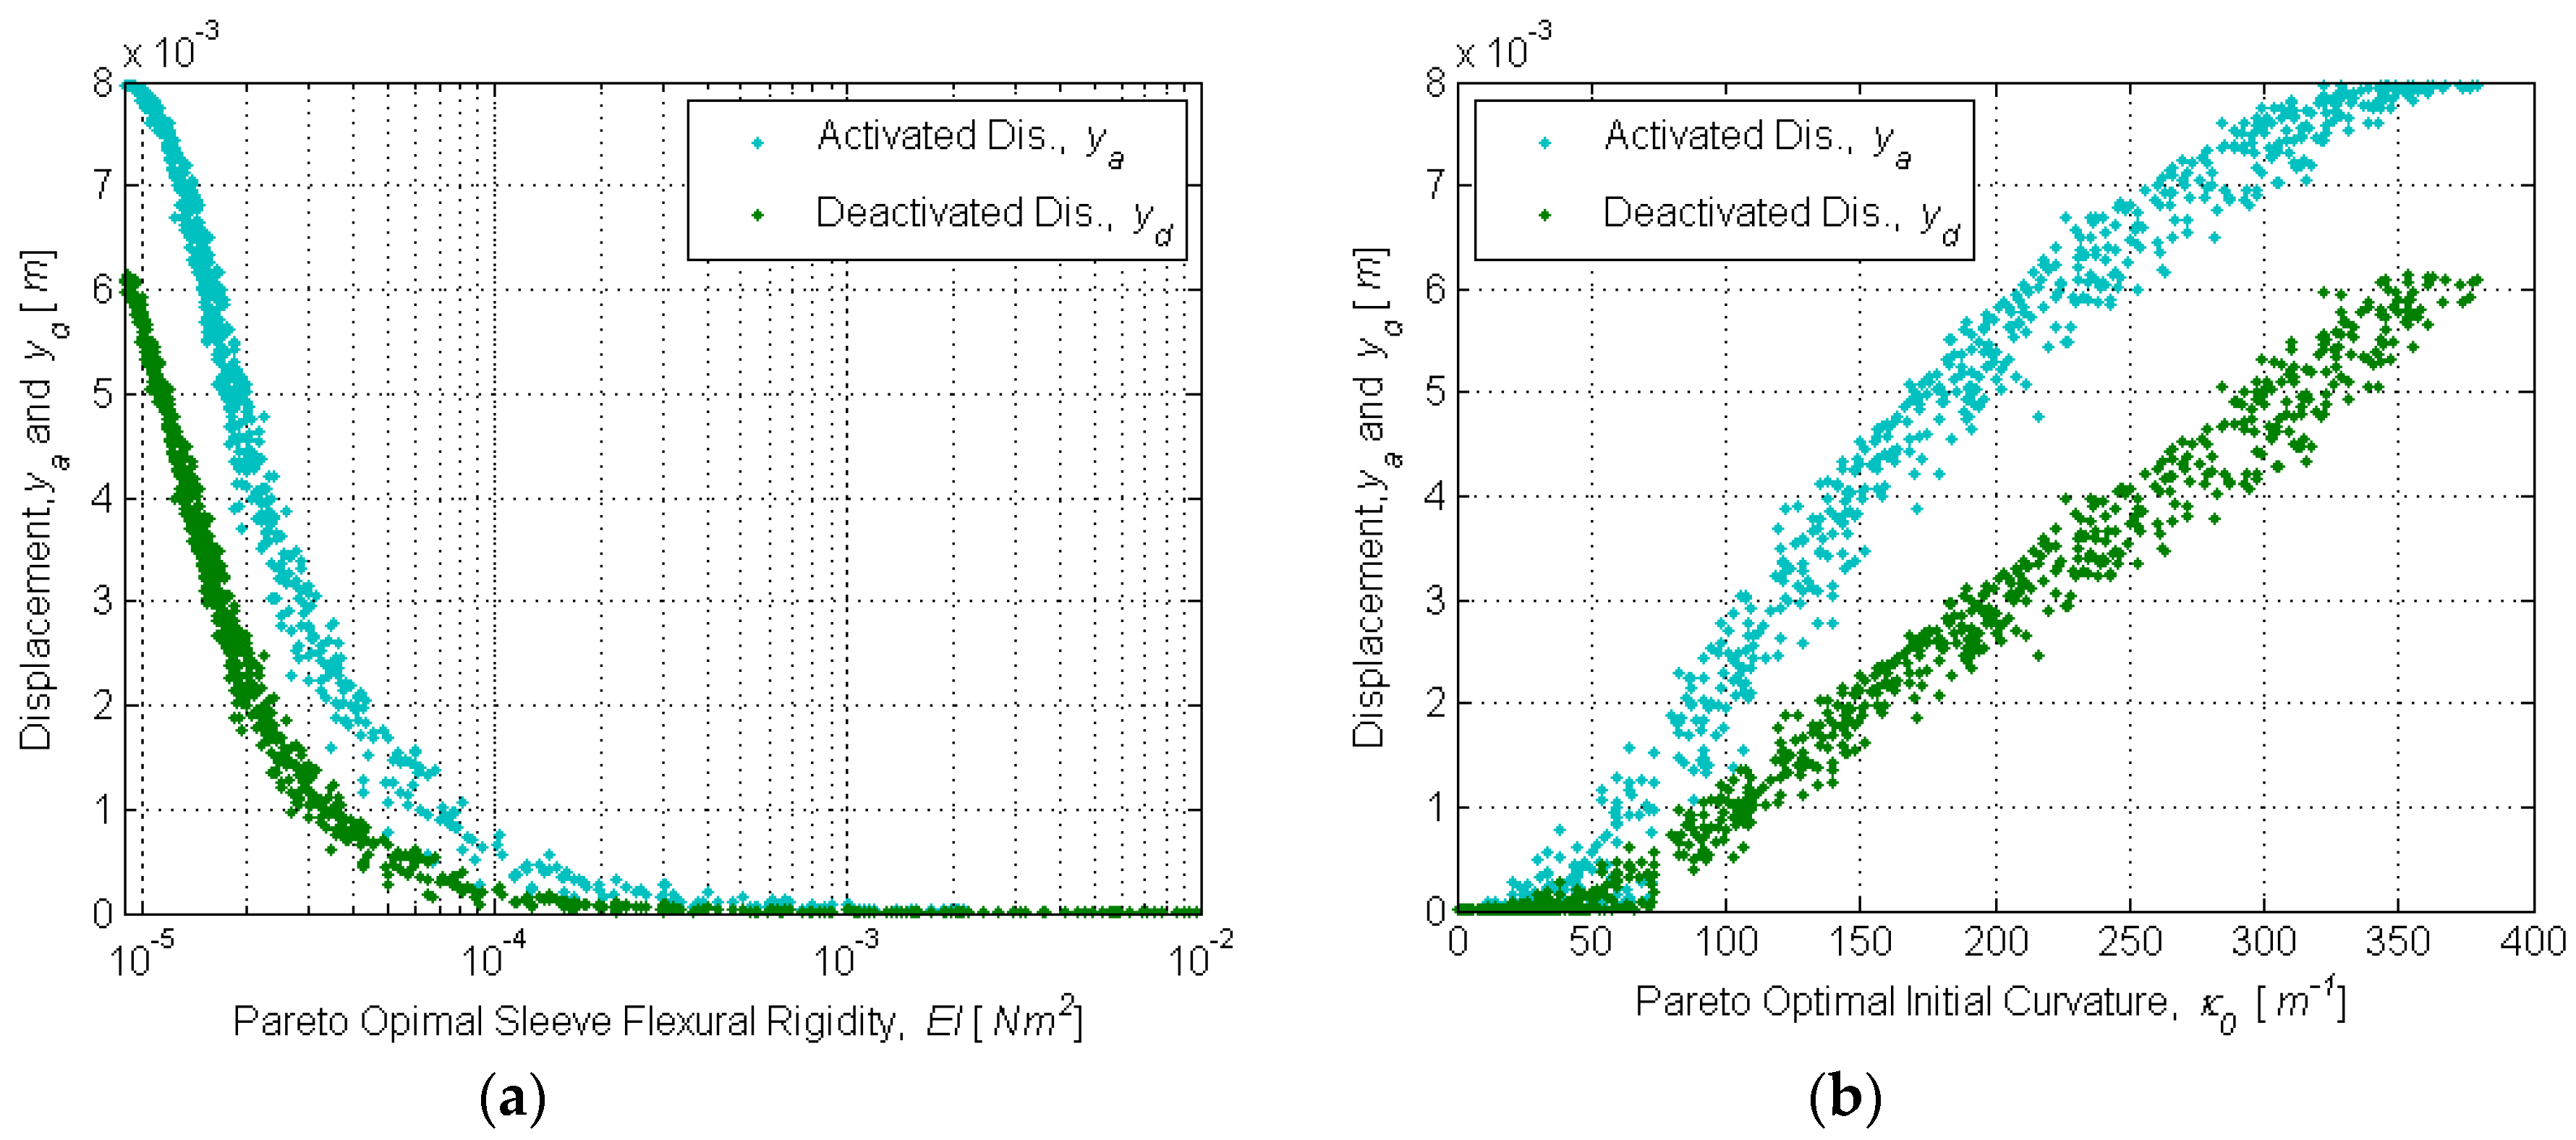
The Pareto frontier of Figure 16 shows the non-dominated designs from the optimization, and clearly reveals the inherent design tradeoff between yd and ya: no design combination of EI and κ0 perfectly minimizes yd (yd = 0 m) while simultaneously maximizing ya (ya ≥ 0.007 m). The results of Figure 17a indicate that the Pareto-optimal displacements yd and ya have strong non-linear dependencies on EI (as was the case with κa and κd in Figure 15a). Furthermore, the correlation between yd, ya and κ0 in Figure 17b resembles the quasi-linear dependence of κa and κd on κ0 in Figure 15b. It is also clear from Figure 17 that the change in activated displacement occurs predominantly over initial curvatures ranging from 50 to 375 (m−1) and flexural rigidities, EI, ranging from 1 × 10⁻⁵ to 5 × 10⁻⁴ Nm2.
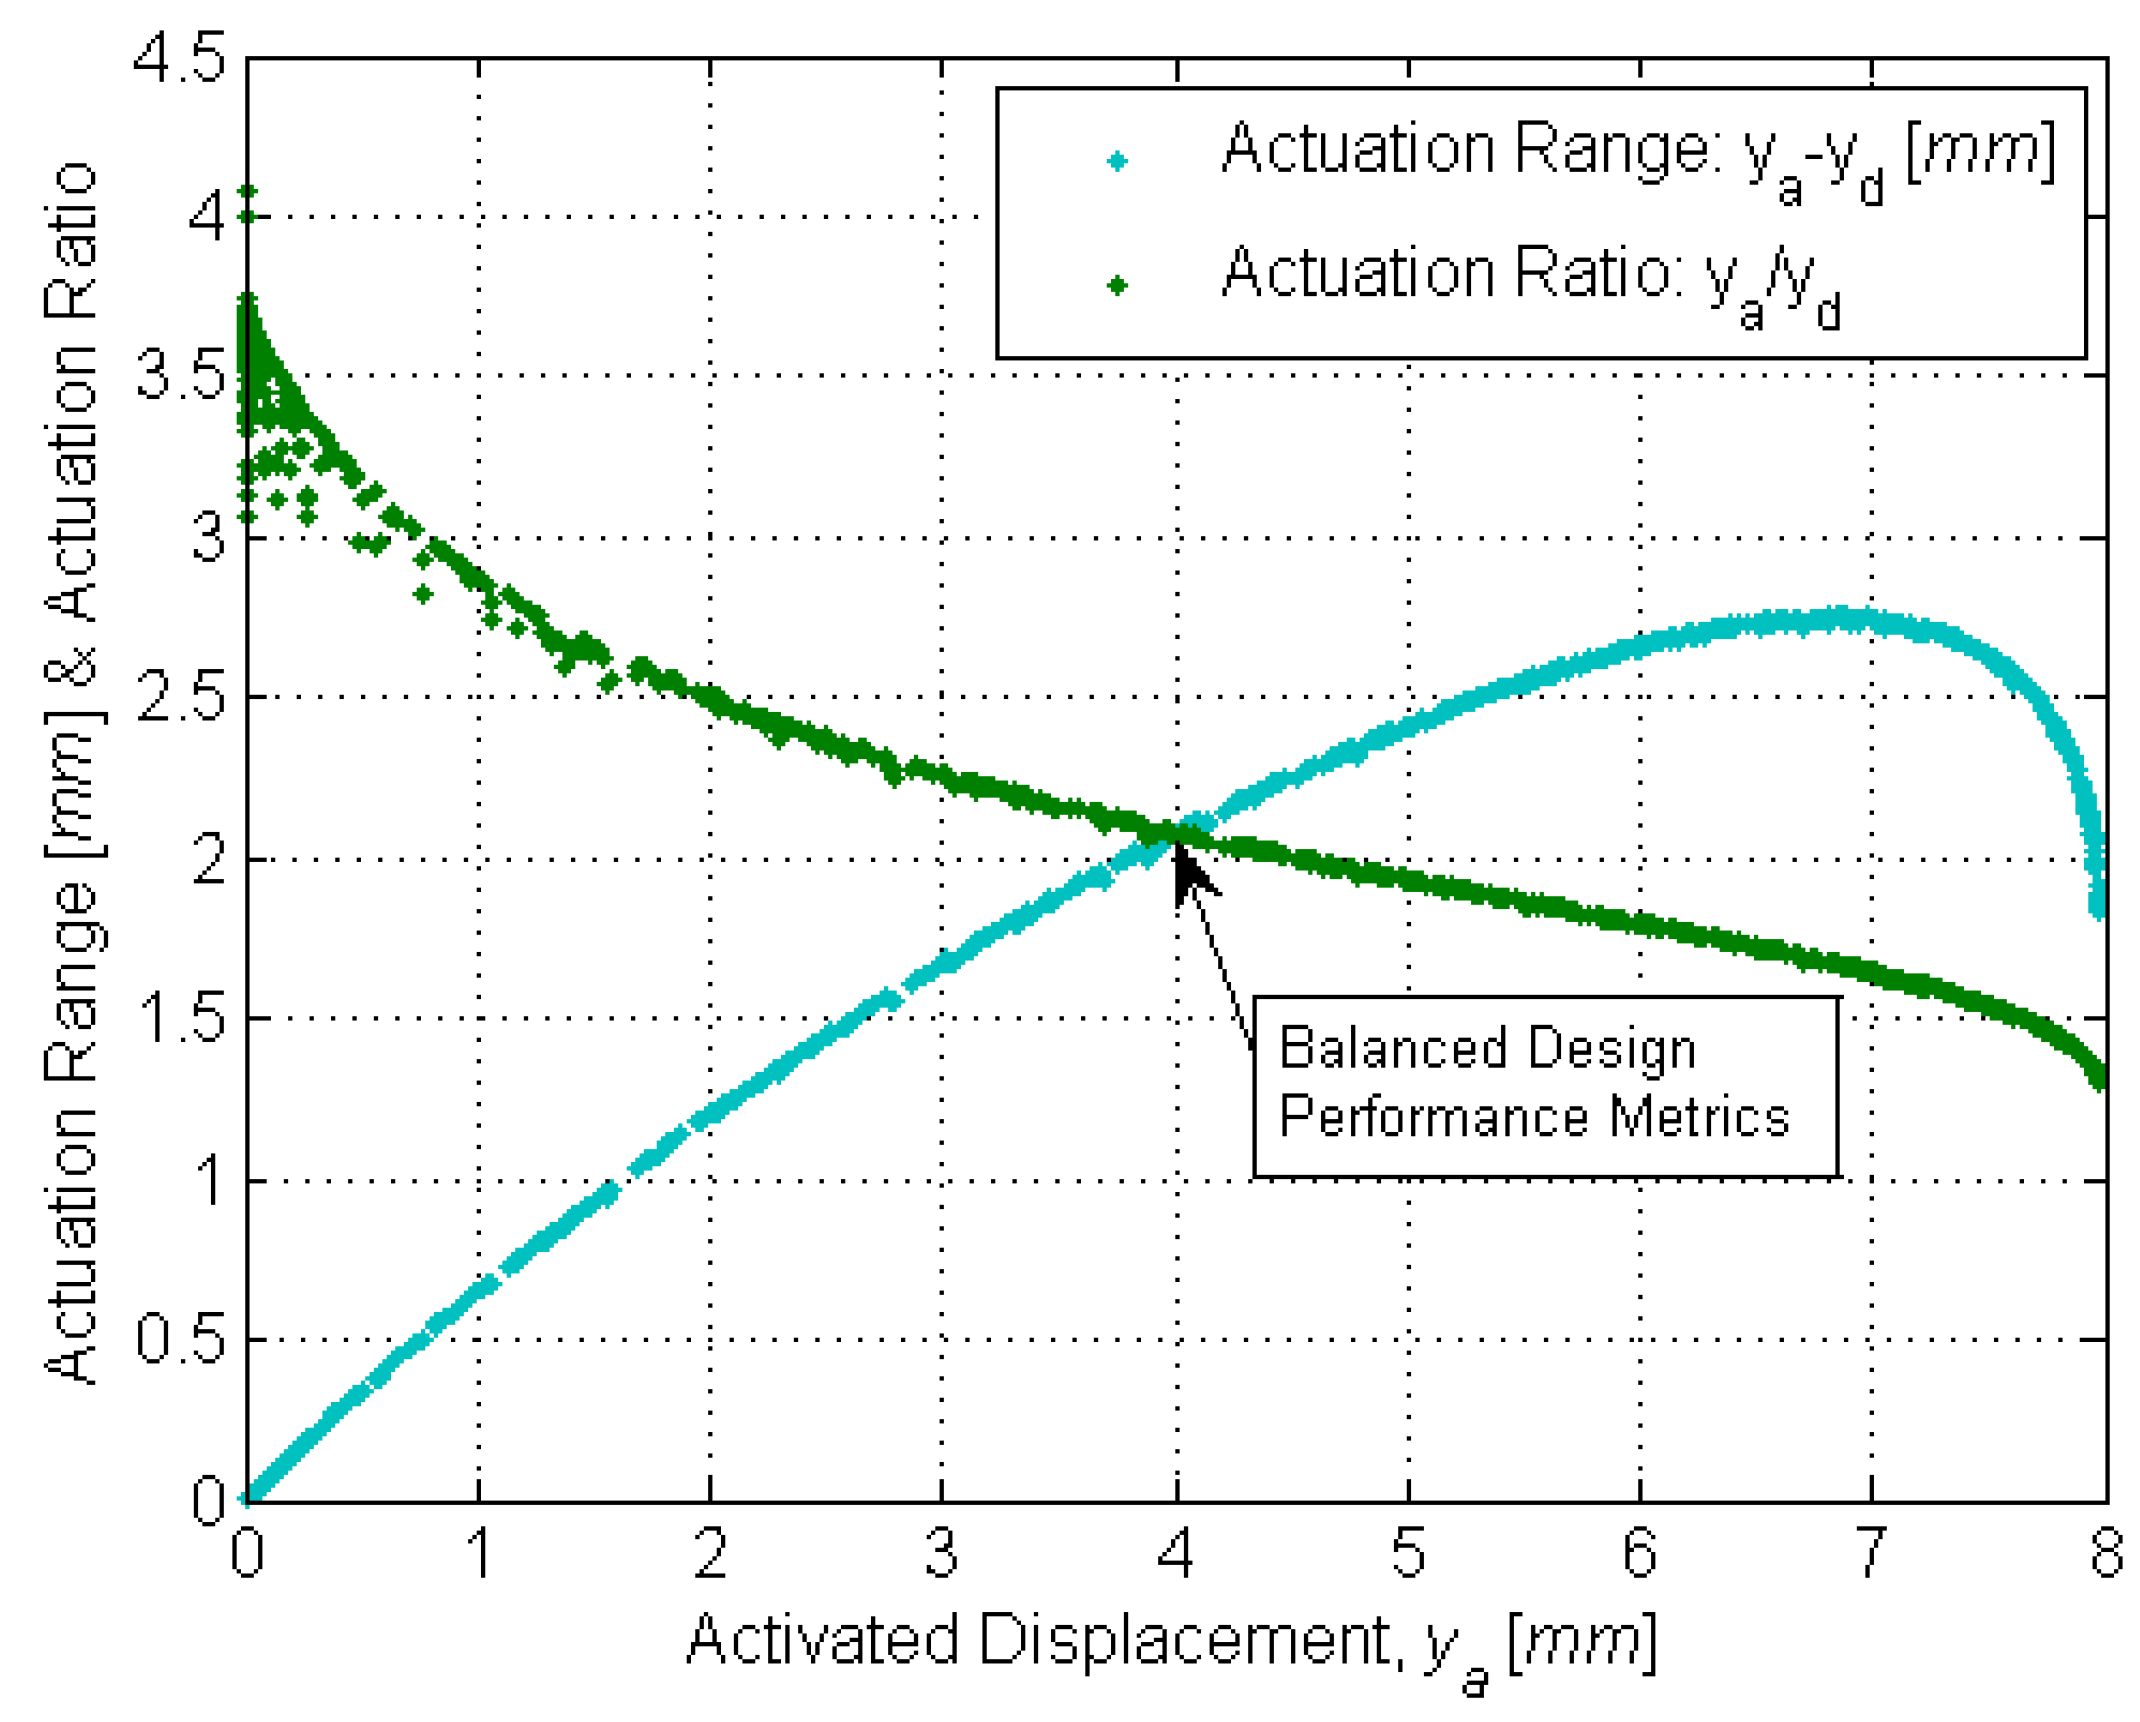
The interaction of Pareto-optimal EI and κ0 in Figure 18 illustrates how these design variables relate to actuation range: generally, this range is proportional to the initial curvature and inversely proportional to flexural rigidity. An additional performance metric, the actuation ratio (ya/yd), helps illustrate the design tradeoff between ya and yd, as shown in Figure 19. Arguably, the “best” design balances both performance metrics, such as the design (ya = 0.004 m, yd = 0.0019 m) indicated in Figure 19.
4.3. Experimental Validation of Pareto Frontier
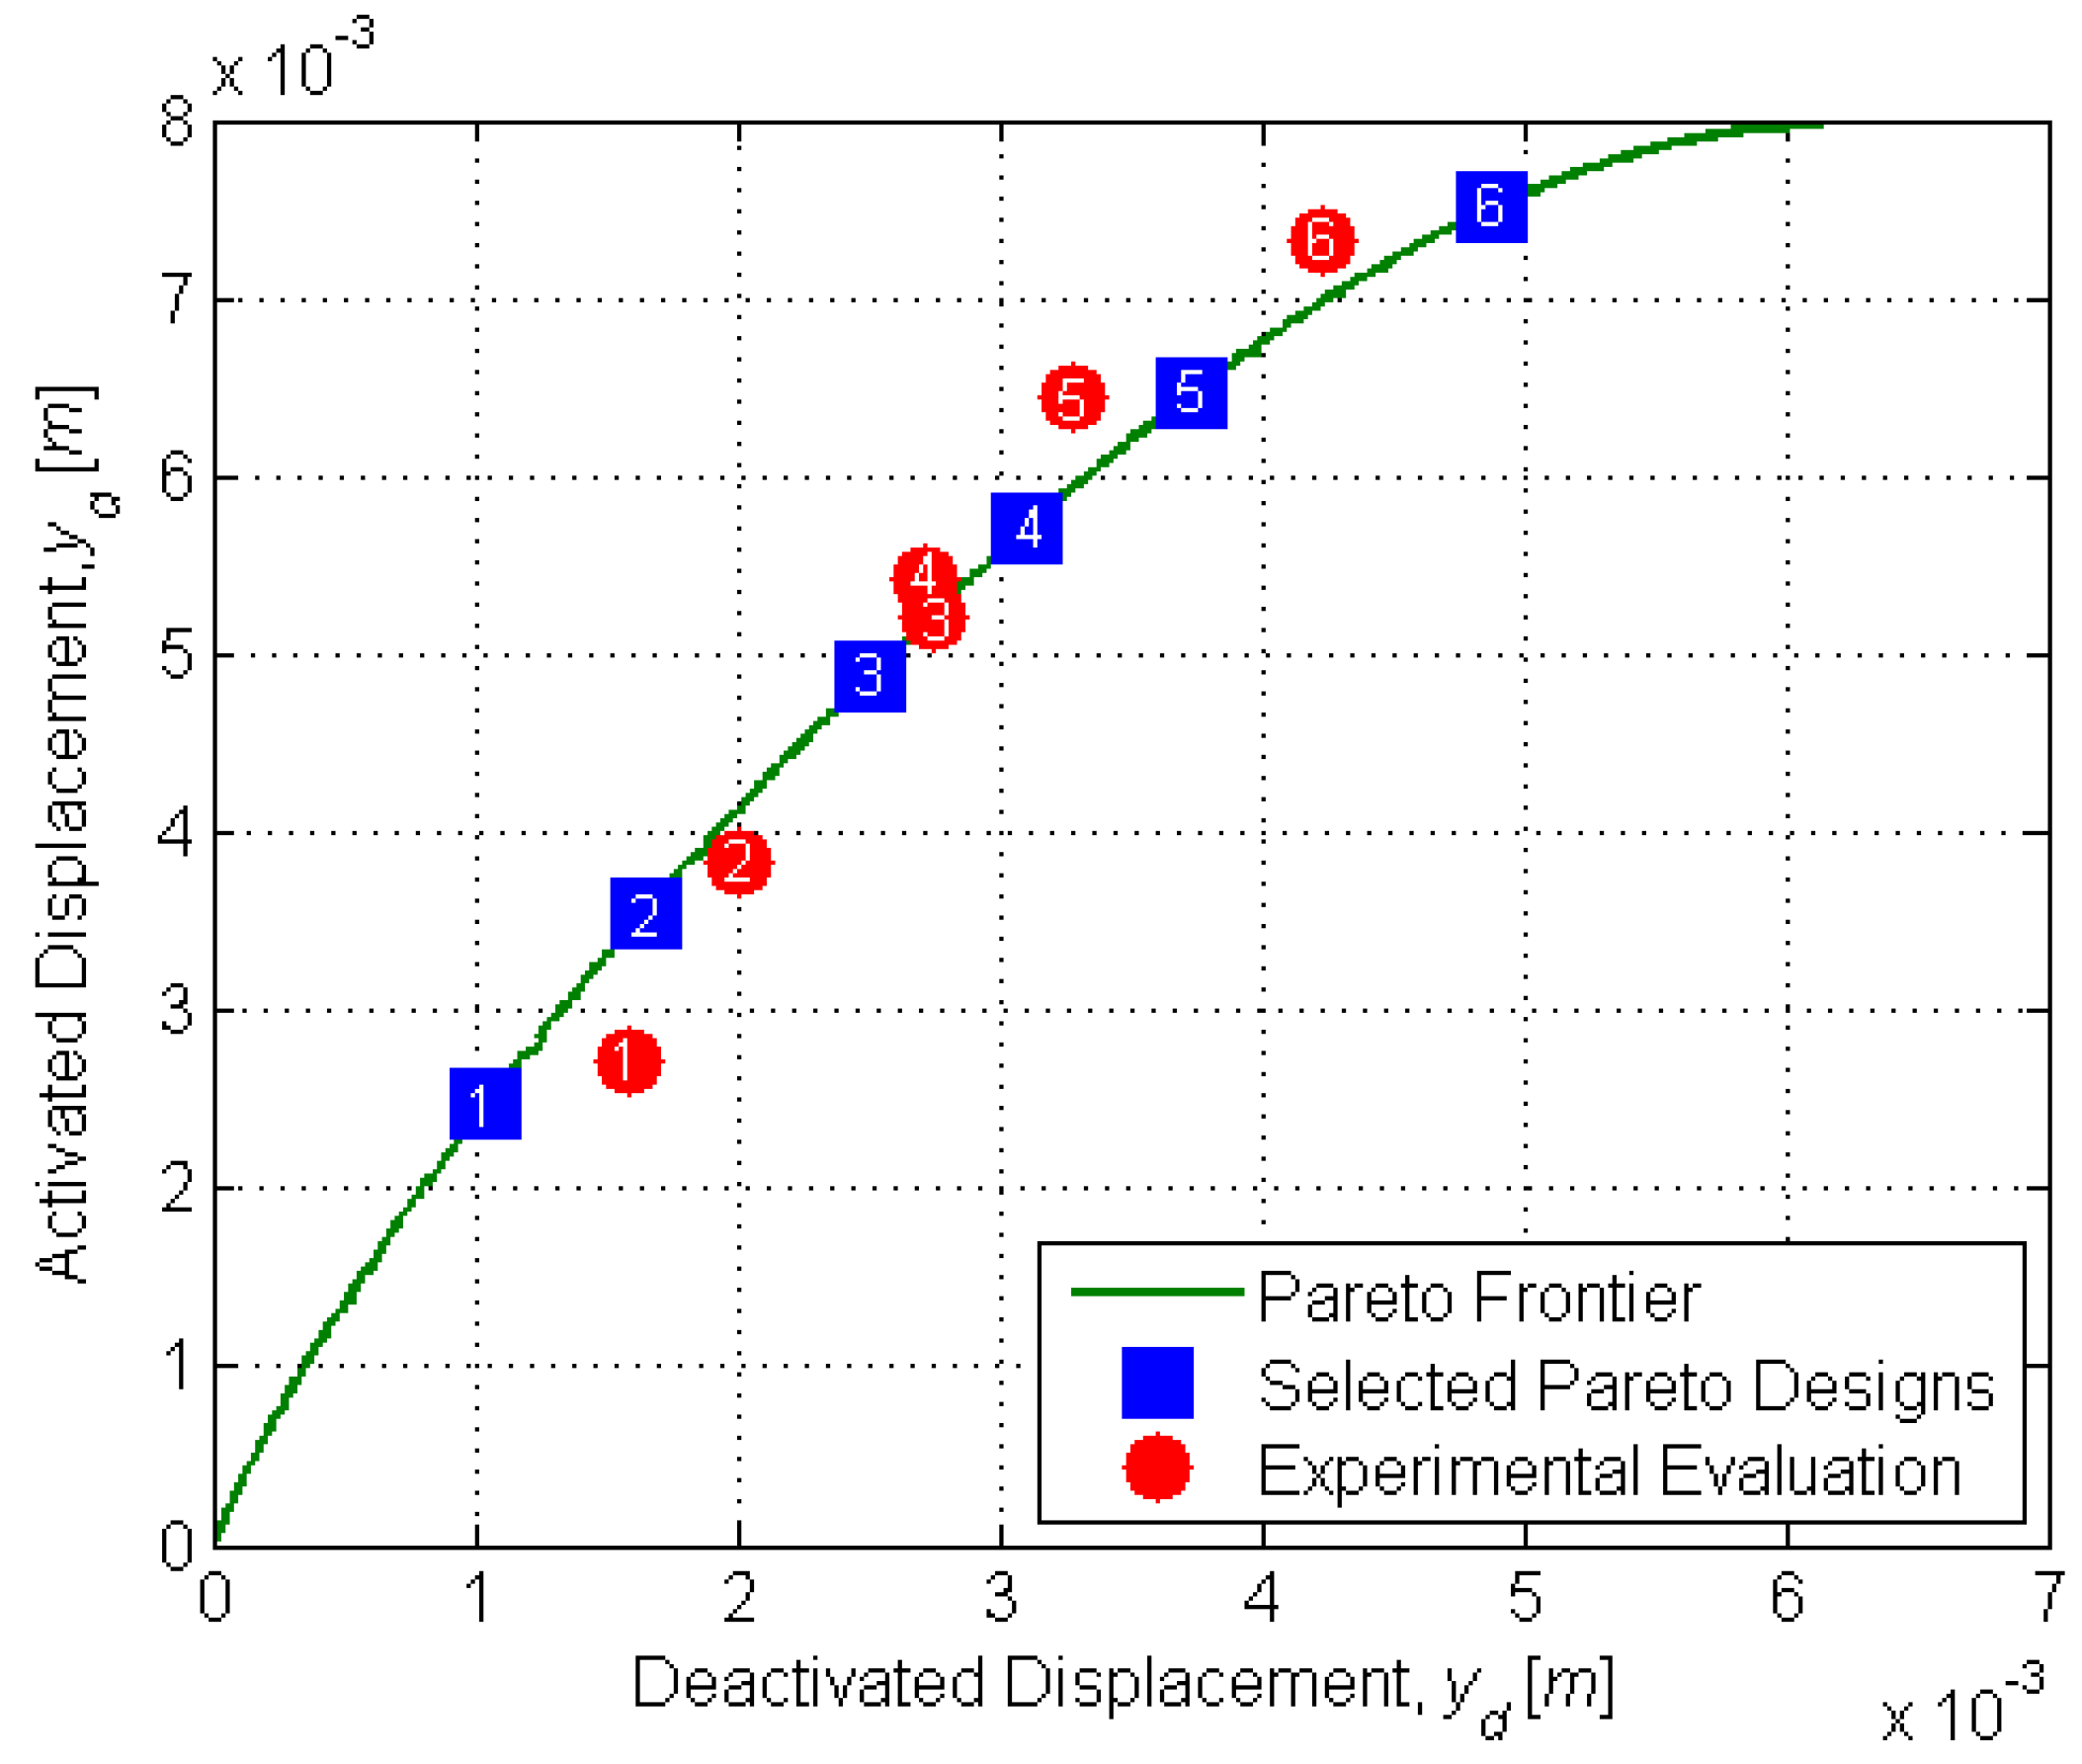
To experimentally validate the Pareto frontier, six Pareto-optimal designs (Table 5) were selected, fabricated, experimentally evaluated, and compared to the simulated Pareto frontier. The results of this comparison are displayed in Figure 20.
The error between the modeled and experimental actuator displacements was quantified via Euclidean norms and normalized with respect to maximum actuator displacement (0.008 m). The average error for all six selected Pareto-optimal designs was 6.4%. The average activated displacement error (2.5%) was significantly lower than average deactivated displacement error (5.6%). Figure 15b provides a likely explanation for this effect: the optimized HEM underestimates at low and overestimates at high . This also explains why certain experimental evaluations of representative designs out-perform the Pareto frontier: because , the experimental evaluations of yd at low κ0 (100, 125 m−1) were higher than predicted and high κ0 (200, 250, 333 m−1) were less than predicted.
5. Conclusions
This paper demonstrates a method for optimizing the design of shape-set SMA flexural actuators. Optimized HEM and bending equilibrium models reveal the non-linear dependencies of the actuator bending curvature on flexural rigidity and initial curvature. Experimental results validate the accuracy of these models as predictors of activated and deactivated curvature. A Pareto frontier based on these models reveals inherent design tradeoffs between activated and deactivated displacement. While the goal here is optimizing the performance of an SMA flexural actuator, the methods and results can easily be extended to other smart materials and actuator topologies. Future work will focus on weighting functions and “strength of preference” curves to guide the selection of the “best” design. The model will also be refined to include internal friction, non-linear sleeve elastic modulus and non-uniform temperature distribution.
Author Contributions
Conceptualization, C.D.H., S.W. and G.D.B.; Software, C.D.H., J.H.C. and S.W.; Validation, C.D.H. and S.W.; Formal Analysis, C.D.H., J.H.C. and S.W.; Investigation, C.D.H., J.H.C., S.W. and G.D.B.; Resources, G.D.B.; Data Curation, C.D.H. and J.H.C.; Writing-Original Draft Preparation, C.D.H., J.H.C., S.W. and G.D.B.; Writing-Review & Editing, G.D.B.; Visualization, C.D.H., J.H.C. and S.W.; Supervision, G.D.B.; Project Administration, G.D.B.; Funding Acquisition, G.D.B.
Funding
This research was supported by a North Carolina State University College of Engineering Dean’s Fellowship.
Acknowledgments
The authors appreciate the medical expertise and assistance of Andrew Kennedy.
Conflicts of Interest
The authors declare no conflict of interest. The funders had no role in the design of the study; in the collection, analyses, or interpretation of data; in the writing of the manuscript, and in the decision to publish the results.
References
- Torre, L.A.; Bray, F.; Siegel, R.L.; Ferlay, J.; Lortet-Tieulent, J.; Jemal, A. Global Cancer Statistics, 2012. Cancer J. Clin. 2015, 65, 87–108. [Google Scholar] [CrossRef] [PubMed]
- Welsh, J.S.; Kennedy, A.S.; Thomadsen, B. Selective internal radiation therapy (SIRT) for liver metastases secondary to colorectal adenocarcinoma. Int. J. Radiat. Oncol. Biol. Phys. 2006, 66, 2. [Google Scholar] [CrossRef] [PubMed]
- Kennedy, A.S.; Nutting, C.; Coldwell, D.; Gaiser, J.; Drachenberg, C. Pathologic response and microdosimetry of 90Y microspheres in man: Review of four explanted whole livers. Int. J. Radiat. Oncol. Biol. Phys. 2004, 60, 1552–1563. [Google Scholar] [CrossRef] [PubMed]
- Ibrahim, S.M.; Nikolaidis, P.; Miller, F.H.; Lewandowski, R.J.; Ryu, R.K.; Sato, K.T.; Senthilnathan, S.; Riaz, A.; Kulik, L.; Mulcahy, M.F.; et al. Radiologic findings following Y90 radioembolization for primary liver malignancies. Abdom. Imaging 2008, 34, 566–581. [Google Scholar] [CrossRef] [PubMed]
- Van Hazel, G.; Blackwell, A.; Anderson, J.; Price, D.; Moroz, P.; Bower, G.; Cardaci, G.; Gray, B. Randomised phase 2 trial of SIR-Spheres® plus fluorouracil/leucovorin chemotherapy versus fluorouracil/leucovorin chemotherapy alone in advanced colorectal cancer. J. Surg. Oncol. 2004, 88, 78–85. [Google Scholar] [CrossRef] [PubMed]
- Richards, A.L.; Kleinstreuer, C.; Kennedy, A.S.; Childress, E.; Buckner, G.D. Experimental Microsphere Targeting in a Representative Hepatic Artery System. IEEE Trans. Biomed. Eng. 2012, 59, 198–204. [Google Scholar] [CrossRef] [PubMed]
- Basciano, C.A.; Kleinstreuer, C.; Kennedy, A.S.; Dezarn, W.A.; Childress, E. Computer Modeling of Controlled Microsphere Release and Targeting in a Representative Hepatic Artery System. Ann. Biomed. Eng. 2010, 38, 1862–1879. [Google Scholar] [CrossRef] [PubMed]
- Nespoli, A.; Besseghini, S.; Pittaccio, S.; Villa, E.; Viscuso, S. The high potential of shape memory alloys in developing miniature mechanical devices: A review on shape memory alloy mini-actuators. Sens. Actuators A 2010, 158, 149–160. [Google Scholar] [CrossRef]
- Haigh, C.D.; Crews, J.H.; Wang, S.; Buckner, G.D. Modeling and experimental validation of shape memory alloy bending actuators. In Proceedings of the ASME Conference on Smart Materials, Adaptive Structures and Intelligent Systems, Stone Mountain, GA, USA, 19–21 September 2012. [Google Scholar]
- Smith, R.C. Smart Material Systems: Model Development; Society for Industrial and Applied Mathematics: Philadelphia, PA, USA, 2005. [Google Scholar]
- Crews, J.H.; Smith, R.C.; Pender, K.M.; Hannen, J.C.; Buckner, G.D. Data-driven techniques to estimate parameters in the homogenized energy model for shape memory alloys. J. Intell. Mater. Syst. Struct. 2012, 23, 1897–1920. [Google Scholar] [CrossRef]
- Lagoudas, D.C.; Tadjbakhsh, I.G. Active flexible rods with embedded SMA fibers. Smart Mater. Struct. 1992, 1, 162–167. [Google Scholar] [CrossRef]
- Wang, G.; Shahinpoor, M. Design, prototyping and computer simulations of a novel large bending actuator made with a shape memory alloy contractile wire. Smart Mater. Struct. 1997, 6, 214–221. [Google Scholar] [CrossRef]
- Baz, A.; Chen, T.; Ro, J. Shape Control of NITINOL-Reinforced Composite Beams. Composites Part B 2000, 31, 631–642. [Google Scholar] [CrossRef]
- Ryu, J.; Jung, B.S.; Kim, M.S.; Kong, J.; Cho, M.; Ahn, S.H. Numerical simulation of hybrid composite shape-memory alloy wire-embedded structures. J. Intell. Mater. Syst. Struct. 2011, 22, 1941–1948. [Google Scholar] [CrossRef]
- Li, Q. Modeling and Finite Element Analysis of Smart Materials. Ph.D. Thesis, North Carolina State University, Raleigh, NC, USA, 2006. [Google Scholar]
- Press, W.; Teukolsky, S.; Vetterling, W.; Flannery, B. Numerical Recipes: The Art of Scientific Computing; Cambridge University Press: Cambridge, UK, 1987. [Google Scholar]
- Morgan, N.B.; Broadley, M. Taking the Art out of Smart!-Forming Processes and Durability Issues for the Application of NiTi Shape Memory Alloys in Medical Devices. In Proceedings of the Materials & Processes for Medical Devices Conference, St. Paul, MN, USA, 25–27 August 2004. [Google Scholar]
- Lagoudas, D.C. (Ed.) Shape Memory Alloys: Modeling and Engineering Applications; Springer: New York, NY, USA, 2008. [Google Scholar]
- Goldberg, D.E.; Holland, J.H. Genetic algorithms in search, optimization, and machine learning. Mach. Learn. 1988, 3, 95–99. [Google Scholar] [CrossRef]
Figure 1.
Computational fluid dynamic (CFD) simulation results: microsphere trajectories in the common hepatic artery (CHA) are dependent on release location [7].
Figure 1.
Computational fluid dynamic (CFD) simulation results: microsphere trajectories in the common hepatic artery (CHA) are dependent on release location [7].

Figure 2.
Shape memory alloy (SMA) flexural actuators could enable precise positioning of microcatheter tips within the common hepatic artery.
Figure 2.
Shape memory alloy (SMA) flexural actuators could enable precise positioning of microcatheter tips within the common hepatic artery.

Figure 3.
(a) Shape-set SMA tendon, (b) elastic sleeve, (c) composite flexural micro-actuator.

Figure 4.
Composite actuator in its deactivated () and activated () states.

Figure 5.
Cross-sectional stress distributions across (a) the elastic sleeve and (b) SMA tendon.

Figure 6.
Discretized SMA cross-sectional area.

Figure 7.
Dependence of the simulated actuator curvature on discretization number (N): (a) as a function of the initial tendon curvature , (b) as a function of the sleeve flexural rigidity EI.
Figure 7.
Dependence of the simulated actuator curvature on discretization number (N): (a) as a function of the initial tendon curvature , (b) as a function of the sleeve flexural rigidity EI.

Figure 8.
Custom fixture used for shape-setting SMA specimens: top—dimensioned drawing; bottom—photograph of machined fixture.
Figure 8.
Custom fixture used for shape-setting SMA specimens: top—dimensioned drawing; bottom—photograph of machined fixture.

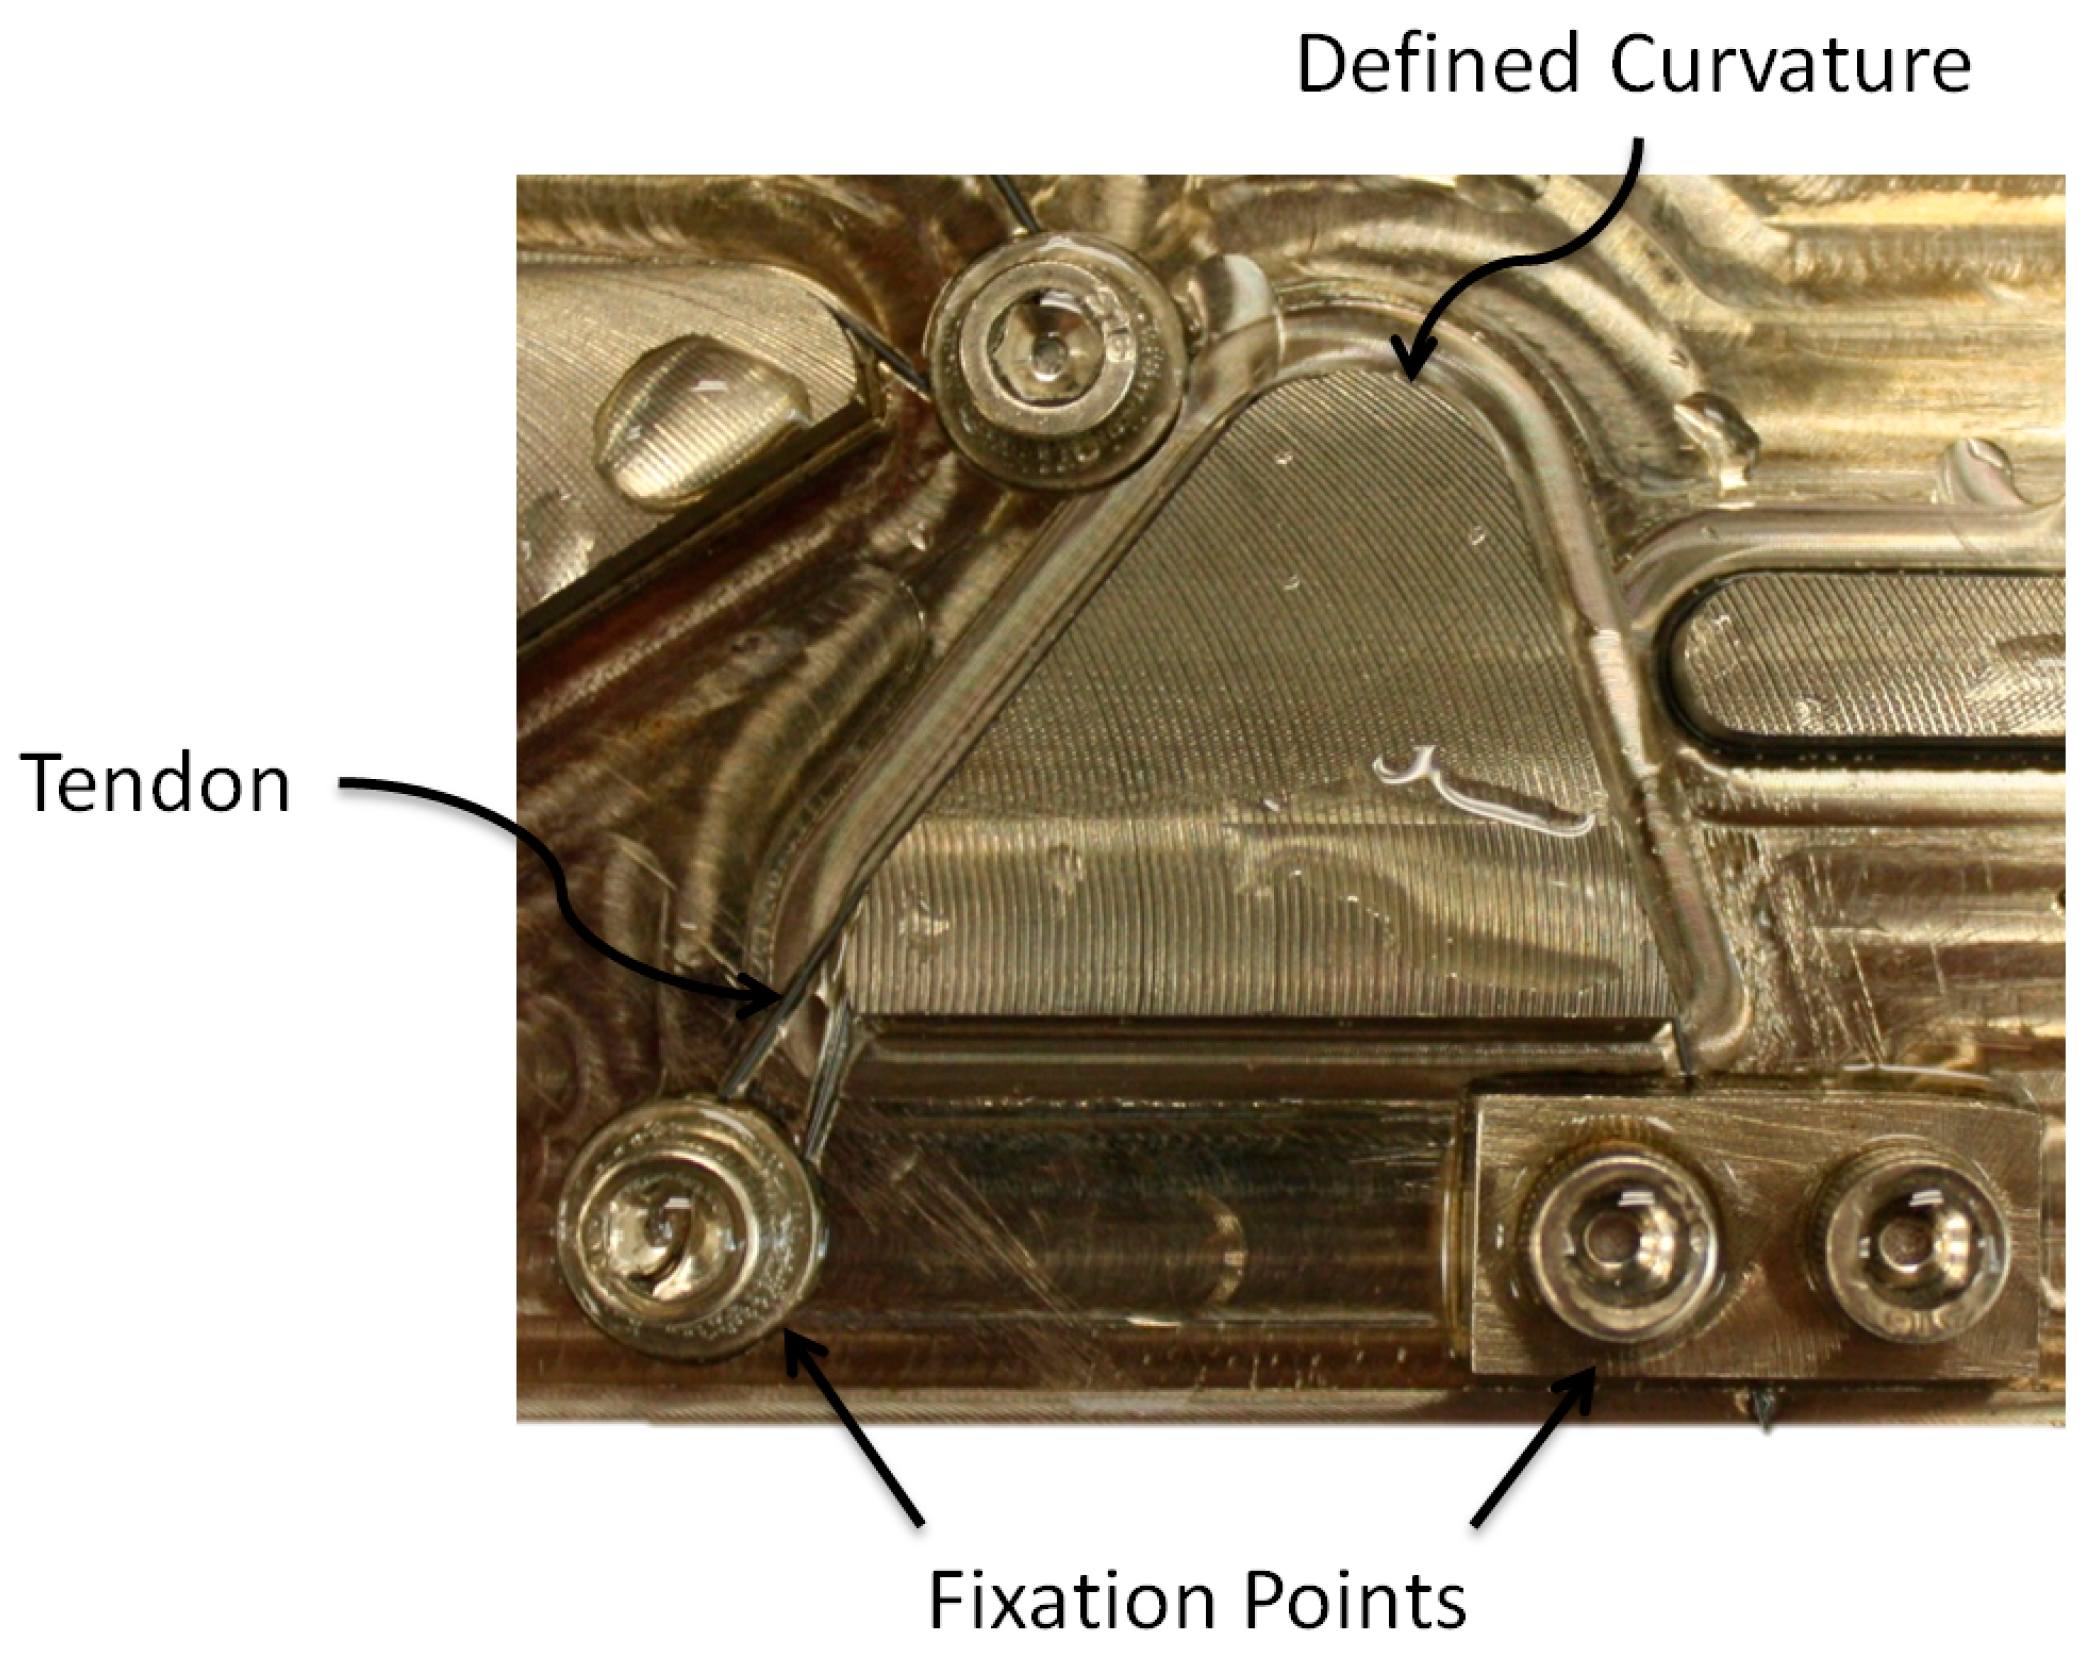
Figure 9.
Detail of bolts and washers used to secure SMA specimens during shape setting.

Figure 10.
Simulation results used to determine the parametric range of (a) EI and (b) .

Figure 11.
(a) Rectangular polydimethylsiloxane (PDMS) sleeves (edges highlighted in black for image contrast) with (b) molds used for fabrication.
Figure 11.
(a) Rectangular polydimethylsiloxane (PDMS) sleeves (edges highlighted in black for image contrast) with (b) molds used for fabrication.

Figure 12.
Processed image of activated actuator with parameters from the optimization labeled.

Figure 13.
Comparison between initial and optimized (a) relative stress density and (b) interaction stress density.
Figure 13.
Comparison between initial and optimized (a) relative stress density and (b) interaction stress density.

Figure 14.
Predicted vs. experimentally measured actuator curvatures for the initial (non-optimized) model: (a) as a function of the sleeve flexural rigidity EI, (b) as a function of the initial curvature .
Figure 14.
Predicted vs. experimentally measured actuator curvatures for the initial (non-optimized) model: (a) as a function of the sleeve flexural rigidity EI, (b) as a function of the initial curvature .

Figure 15.
Predicted vs. experimentally measured actuator curvatures for the optimized model: (a) as a function of the sleeve flexural rigidity EI, (b) as a function of the initial curvature κ0.
Figure 15.
Predicted vs. experimentally measured actuator curvatures for the optimized model: (a) as a function of the sleeve flexural rigidity EI, (b) as a function of the initial curvature κ0.

Figure 16.
Comparison of Pareto-optimal designs’ activated and deactivated displacement, and .

Figure 17.
Effects of Pareto-optimal design parameters on activated () and deactivated () displacement: (a) flexural rigidity, EI, (b) initial curvature, κ0.
Figure 17.
Effects of Pareto-optimal design parameters on activated () and deactivated () displacement: (a) flexural rigidity, EI, (b) initial curvature, κ0.

Figure 18.
Interaction of Pareto-optimal design variables (initial curvature, κ0, and flexural rigidity, EI) as a function of actuation range .
Figure 18.
Interaction of Pareto-optimal design variables (initial curvature, κ0, and flexural rigidity, EI) as a function of actuation range .

Figure 19.
Actuator performance trade-off: displacement ratio and change in displacement versus activated displacement .
Figure 19.
Actuator performance trade-off: displacement ratio and change in displacement versus activated displacement .

Figure 20.
Pareto frontier: Comparing selected Pareto-optimal designs to their experimental evaluation.
Figure 20.
Pareto frontier: Comparing selected Pareto-optimal designs to their experimental evaluation.


Table 1.
Single-objective design variables and bounds.
| Variable | Description | Lower Bound | Upper Bound | Units |
|---|---|---|---|---|
| Relative stress density coefficients | 0 | 3.0 | - | |
| Interaction stress density coefficients | 0 | 3.0 | - | |
| Austenitic elastic modulus | 10 | 100 | GPa | |
| Martensitic elastic modulus | 10 | 100 | GPa | |
| Martensitic transition stress at 348 K | 100 | 400 | MPa | |
| Hysteresis loop’s temperature dependence | 1.0 | 15.0 | MPa/K | |
| Maximum recoverable strain | 1.0 | 7.0 | % | |
| h | Convection Coefficient | 0.01 | 1.6 | W/(m2K) |
| Tmax | Maximum SMA Temperature | 353 | 403 | K |
Table 2.
Comparison of initial and optimized homogenized energy model (HEM) parameters.
| Variable | Initial Value | Optimized Value | Units |
|---|---|---|---|
| 30.7 | 59.02 | GPa | |
| 26.0 | 16.83 | GPa | |
| 295 | 204.17 | MPa | |
| 9.2 | 9.96 | MPa | |
| 4.4 | 7 | % | |
| h | 0.8 | 0.4279 | W/(m2K) |
| Tmax | 380 | 381.4 | K |
Table 3.
Sum of squared errors (SSE) for initial (non-optimized) and optimized models.
| SSE Deactivated | SSE Activated | SSE Sum | |
|---|---|---|---|
| Initial Model | 4792 | 2483 | 7263 |
| Optimized Model | 478.1 | 36.7 | 514.2 |
| Percent Improvement | 90% | 99% | 93% |
Table 4.
Upper and lower parameter bounds for the initial population (UBi and LBi, respectively) and subsequent populations (UB and LB).
Table 4.
Upper and lower parameter bounds for the initial population (UBi and LBi, respectively) and subsequent populations (UB and LB).
| EI | ||
|---|---|---|
| UBi | 600 | 1 × 10⁻⁵ |
| LBi | 0 | 1 × 10⁻² |
| UB | 600 | 1 |
| LB | 0 | 0 |
Table 5.
Selected Pareto-optimal designs for experimental validation.
| Design | Initial Curvature (m−1) | Sleeve EI (Nm2) | Deactivated Displacement (m) | Activated Displacement (m) |
|---|---|---|---|---|
| 1 | 100 | 3.05 × 10⁻⁵ | 0.0010 | 0.0025 |
| 2 | 125 | 2.23 × 10⁻⁵ | 0.0016 | 0.0036 |
| 3 | 167 | 1.76 × 10⁻⁵ | 0.0025 | 0.0049 |
| 4 | 200 | 1.58 × 10⁻⁵ | 0.0031 | 0.0057 |
| 5 | 250 | 1.47 × 10⁻⁵ | 0.0037 | 0.0065 |
| 6 | 333 | 1.16 × 10⁻⁵ | 0.0049 | 0.0075 |
© 2019 by the authors. Licensee MDPI, Basel, Switzerland. This article is an open access article distributed under the terms and conditions of the Creative Commons Attribution (CC BY) license (http://creativecommons.org/licenses/by/4.0/).
Share and Cite
MDPI and ACS Style
Haigh, C.D.; Crews, J.H.; Wang, S.; Buckner, G.D. Multi-Objective Design Optimization of a Shape Memory Alloy Flexural Actuator. Actuators 2019, 8, 13. https://doi.org/10.3390/act8010013
AMA Style
Haigh CD, Crews JH, Wang S, Buckner GD. Multi-Objective Design Optimization of a Shape Memory Alloy Flexural Actuator. Actuators. 2019; 8(1):13. https://doi.org/10.3390/act8010013
Chicago/Turabian StyleHaigh, Casey D., John H. Crews, Shiquan Wang, and Gregory D. Buckner. 2019. "Multi-Objective Design Optimization of a Shape Memory Alloy Flexural Actuator" Actuators 8, no. 1: 13. https://doi.org/10.3390/act8010013
Note that from the first issue of 2016, this journal uses article numbers instead of page numbers. See further details here.