

Comparative Cranial Geometric Morphometrics among Wistar Albino, Sprague Dawley, and WAG/Rij Rat Strains
 ,
,  ,
,
Abstract
:Simple Summary
Abstract
1. Introduction
2. Materials and Methods
2.1. Samples
2.2. Data Collection
2.3. Geometric Morphometrics
3. Results
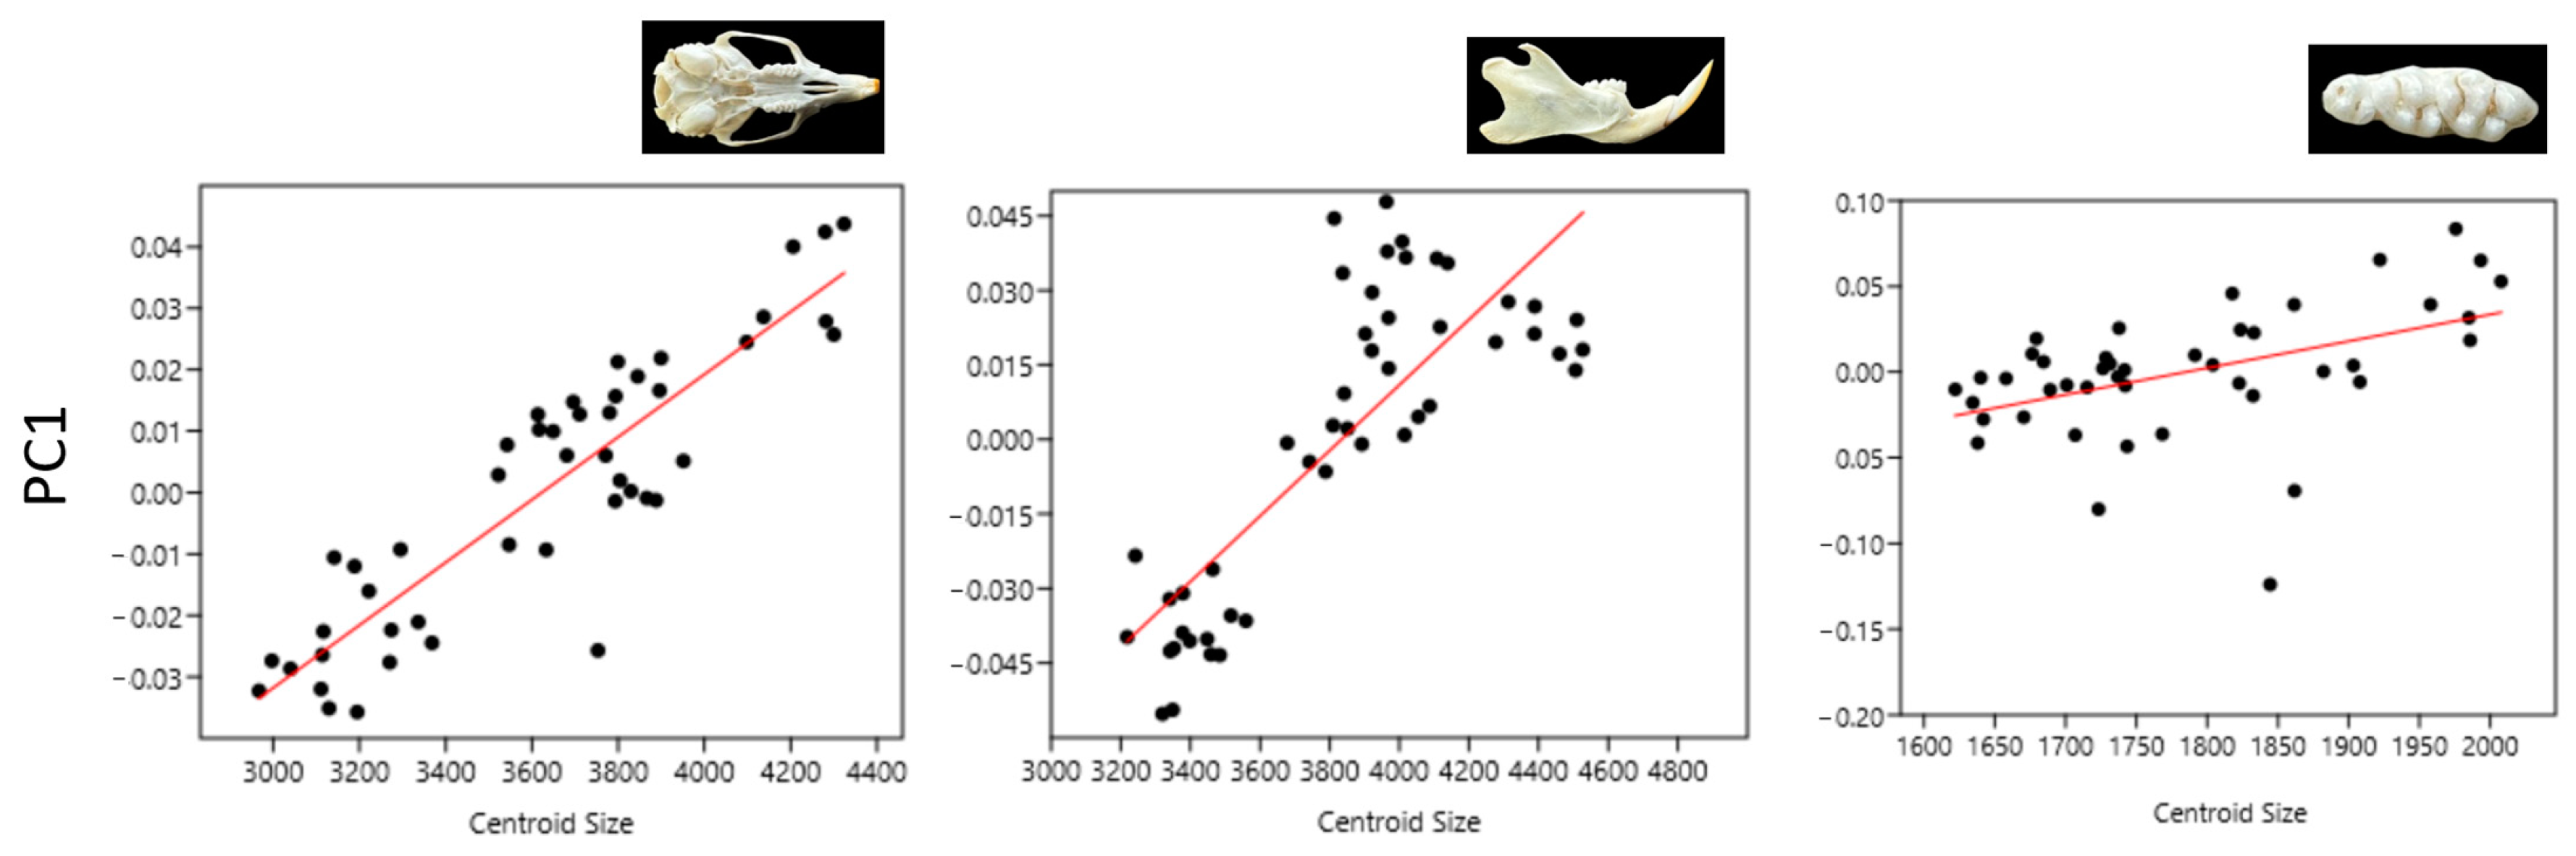
3.1. Size
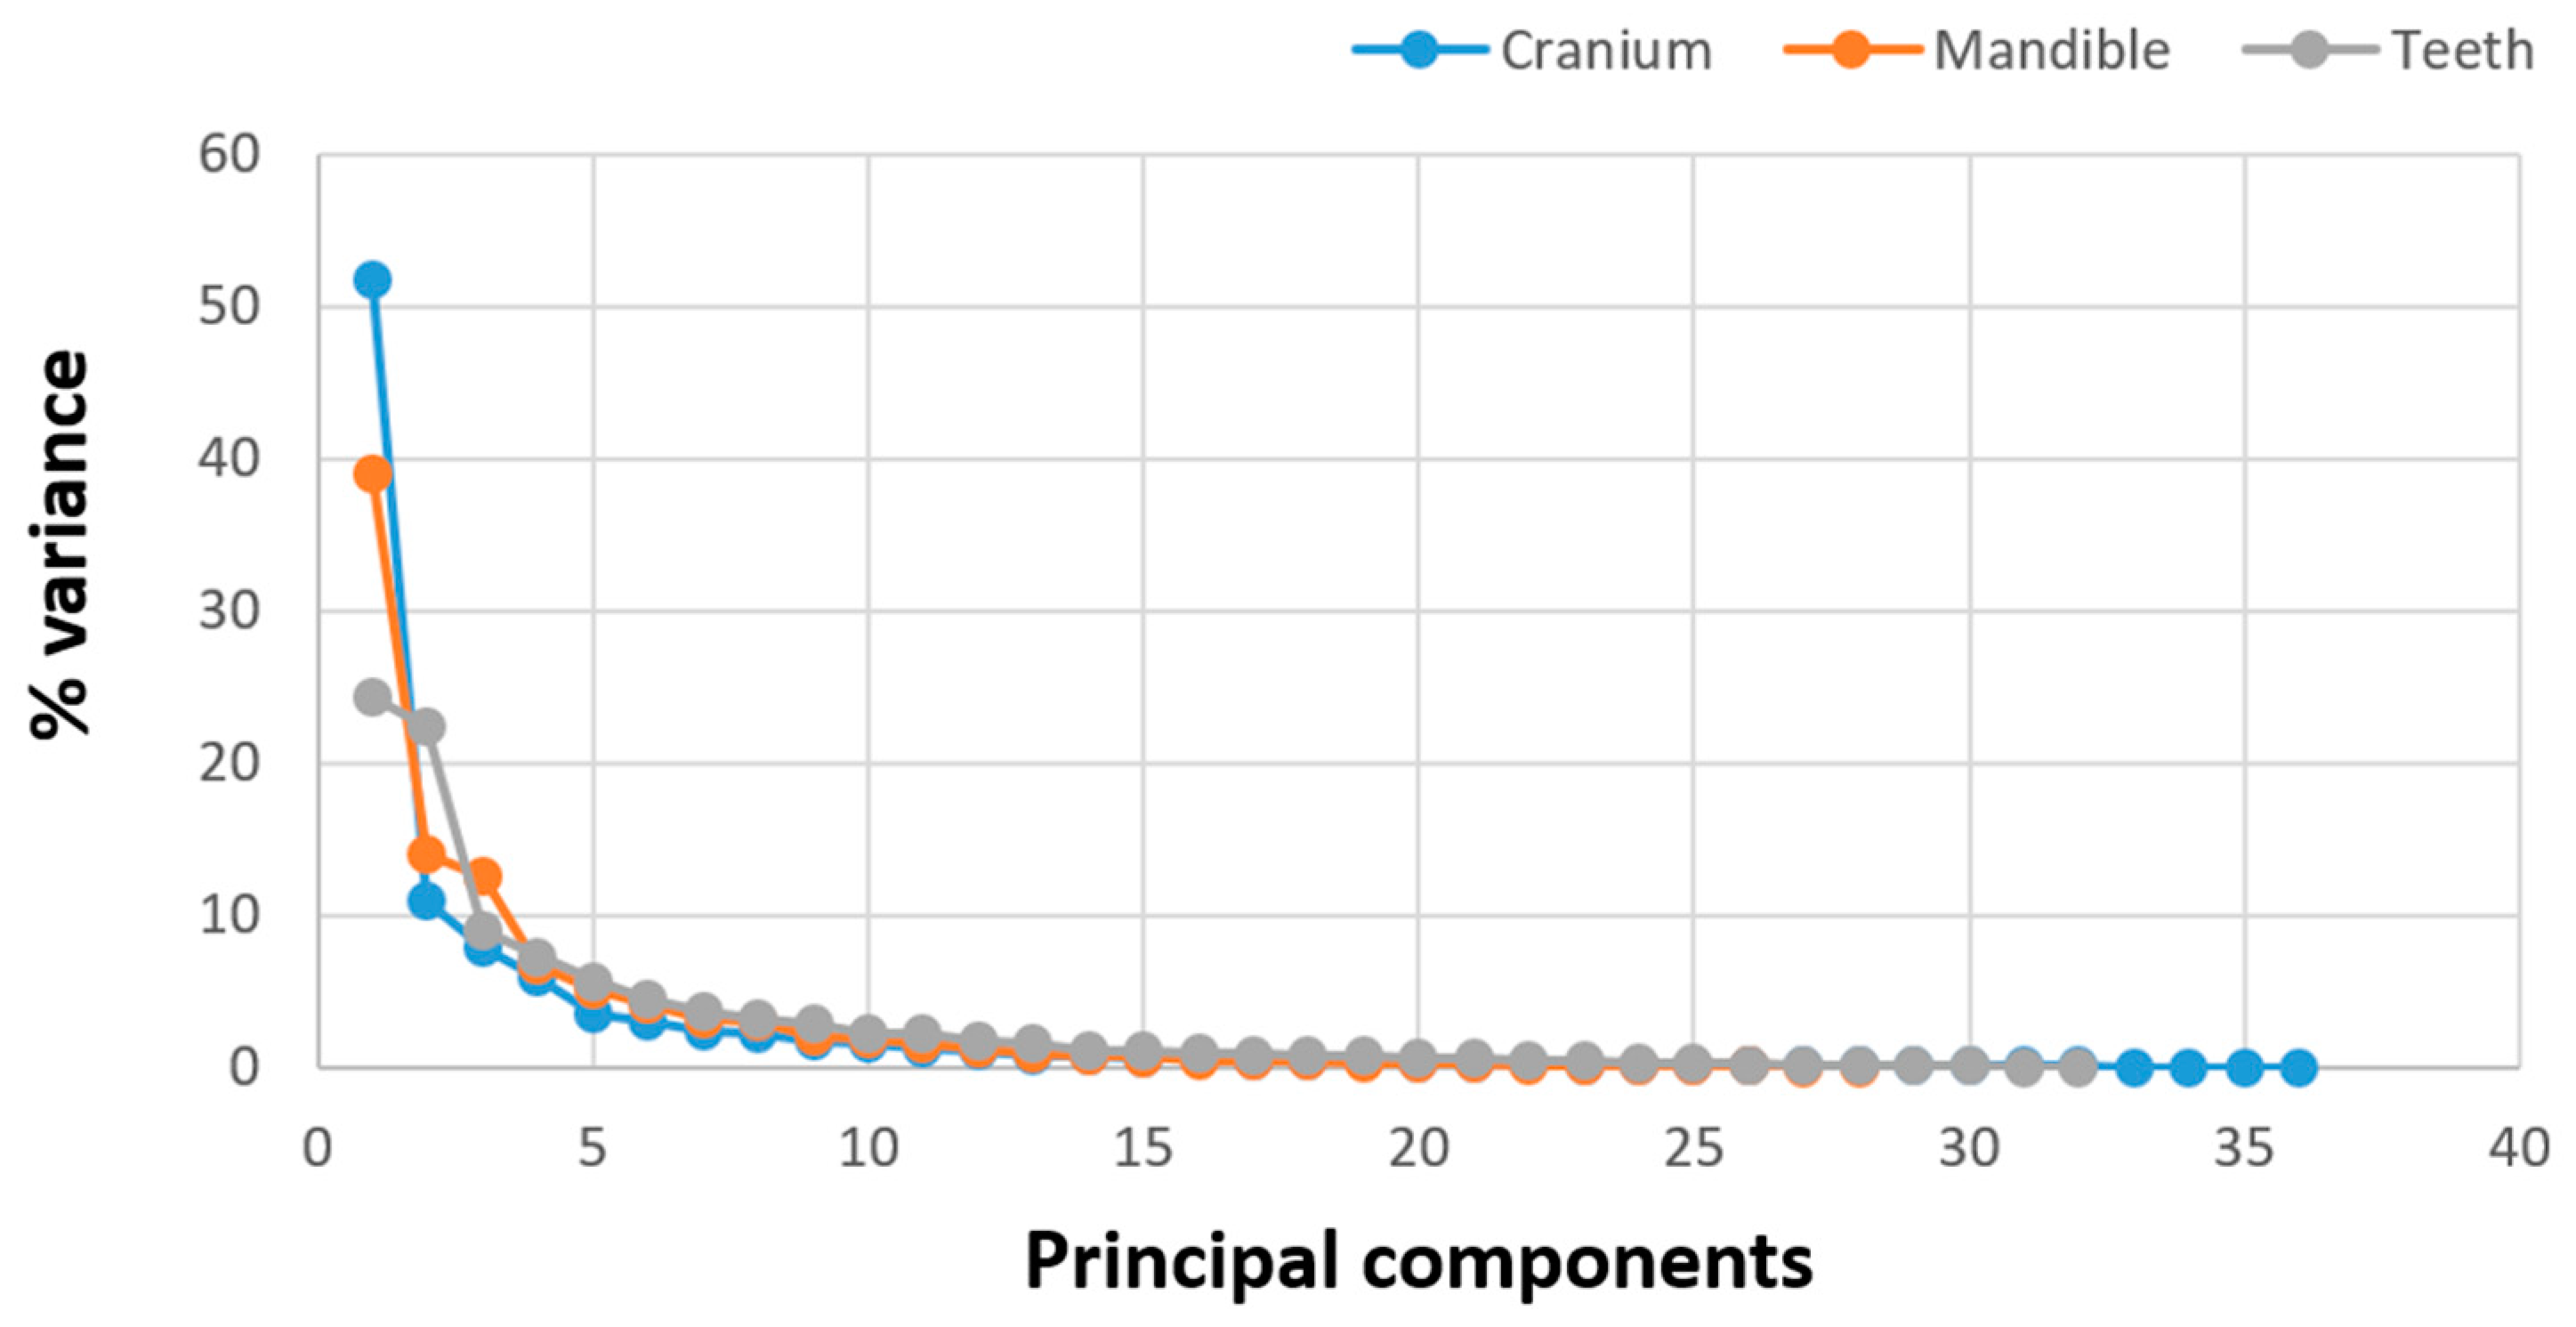
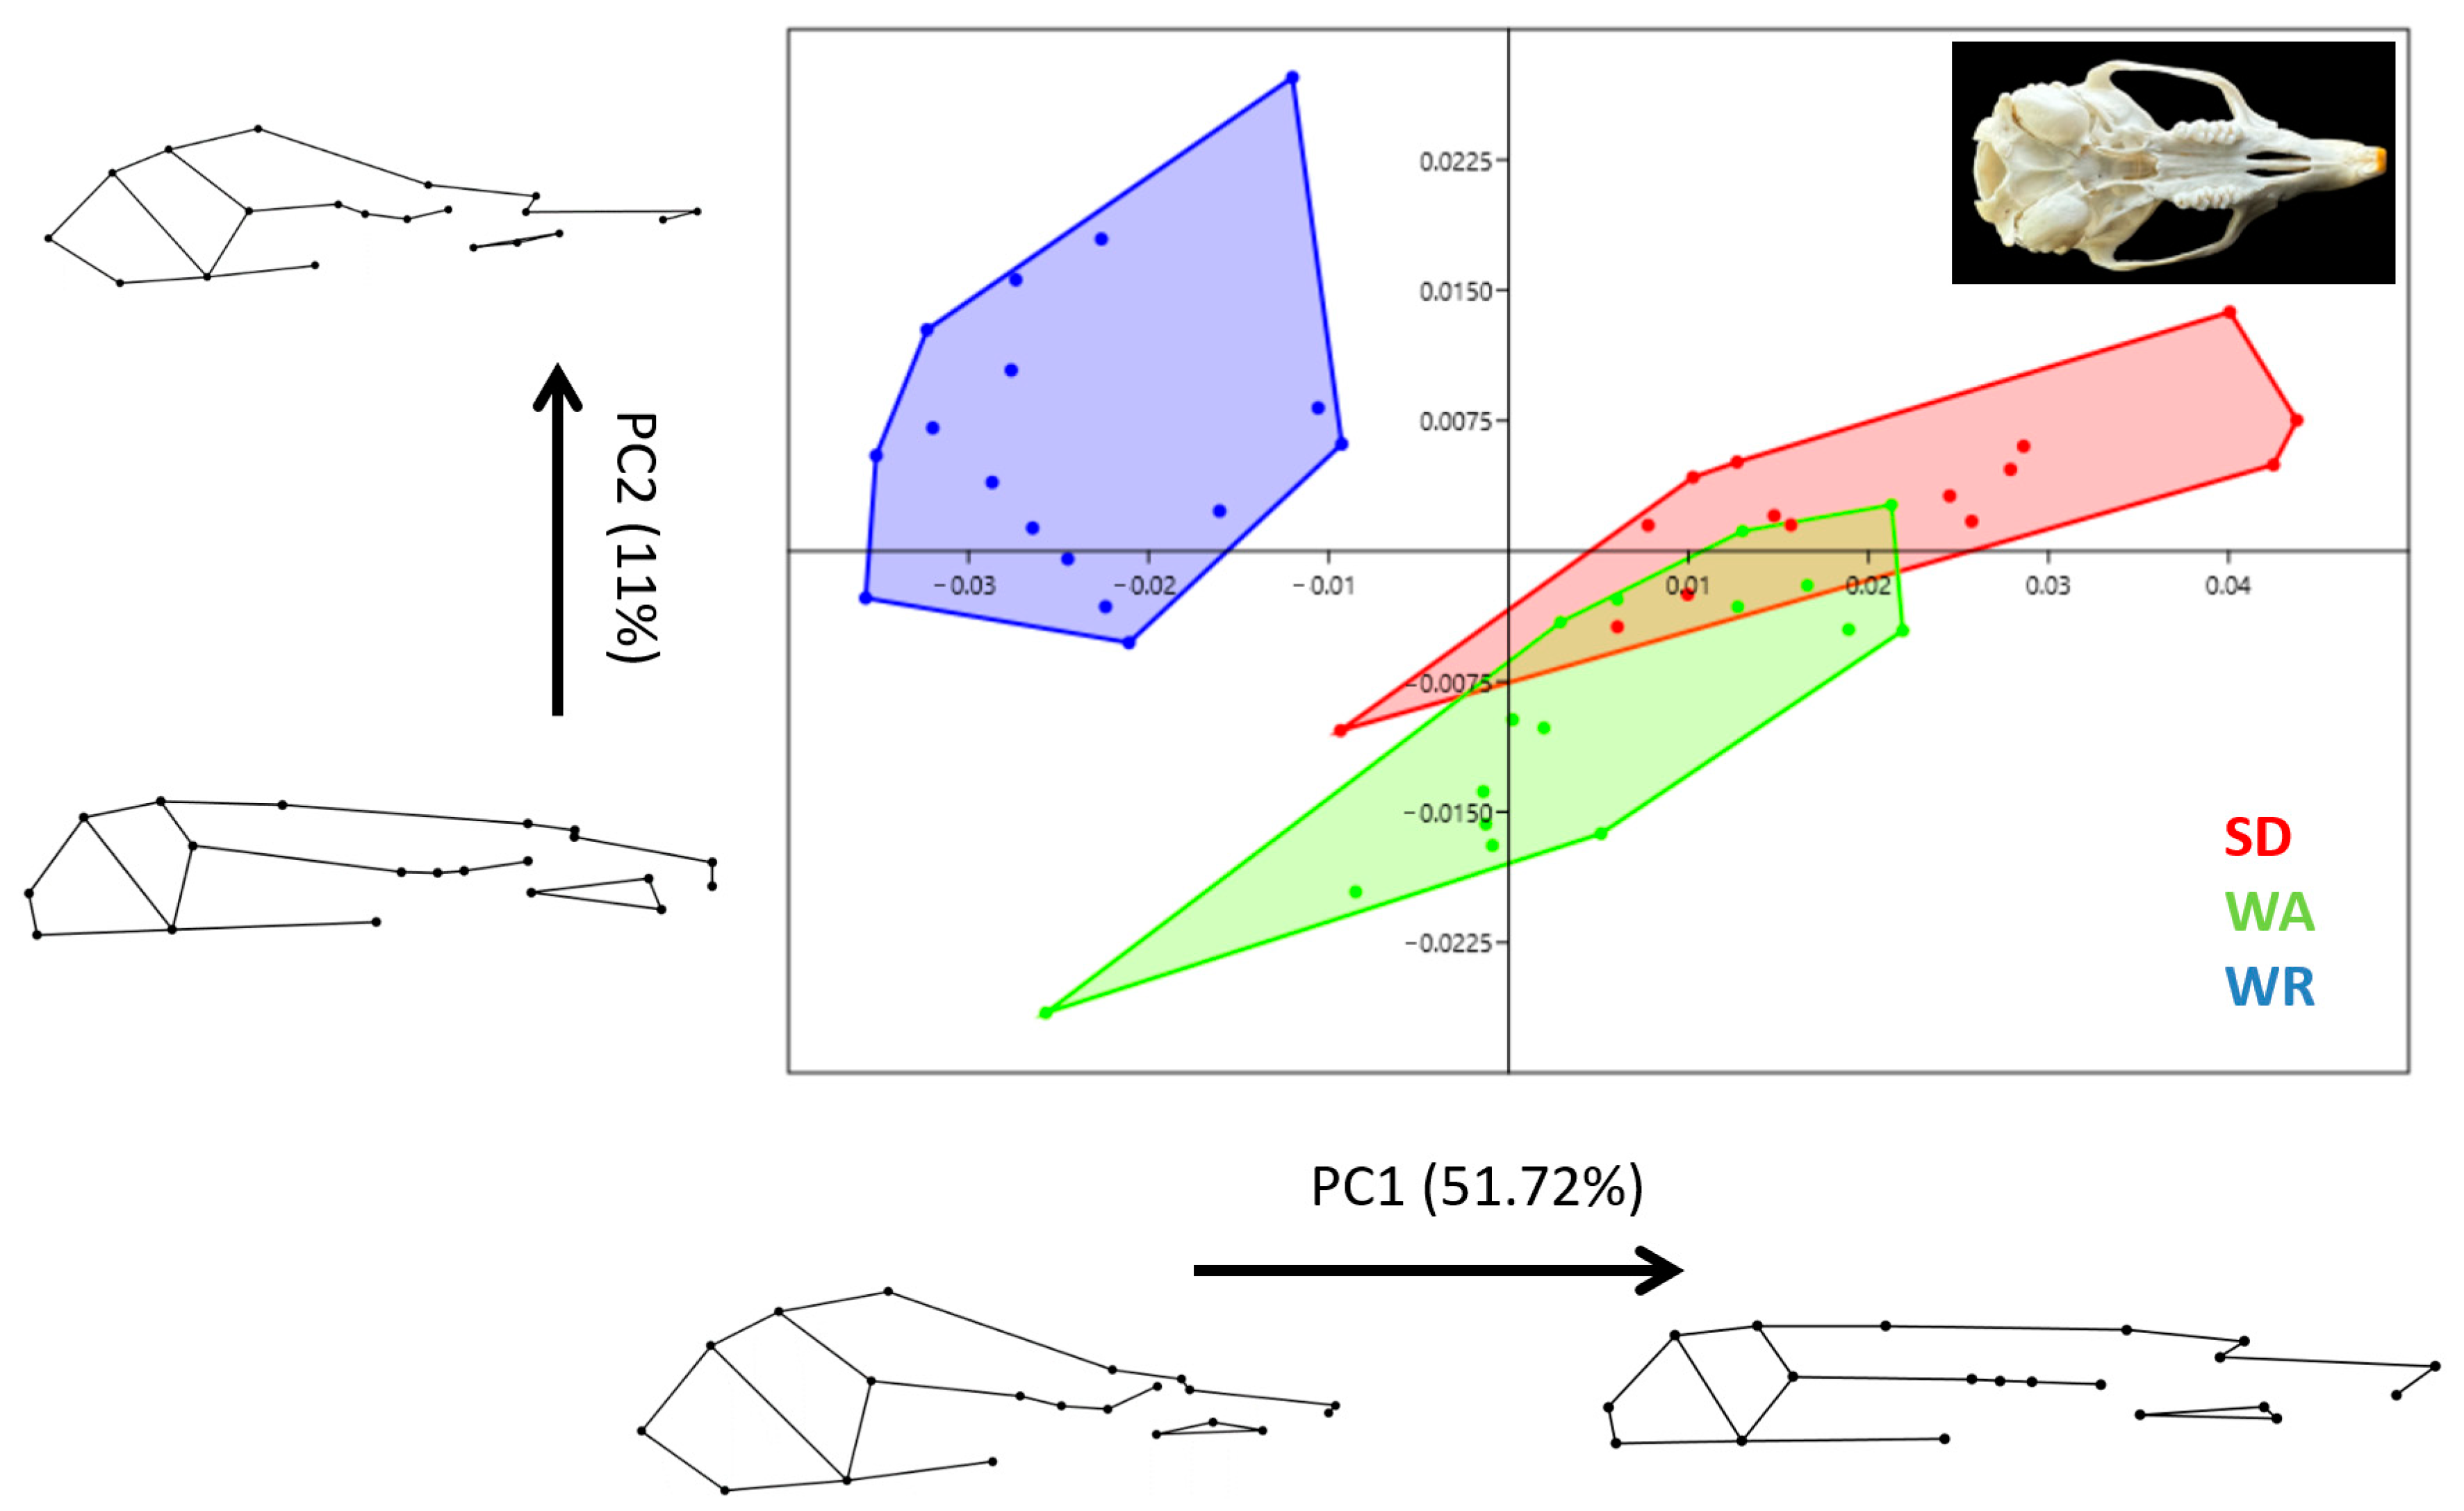
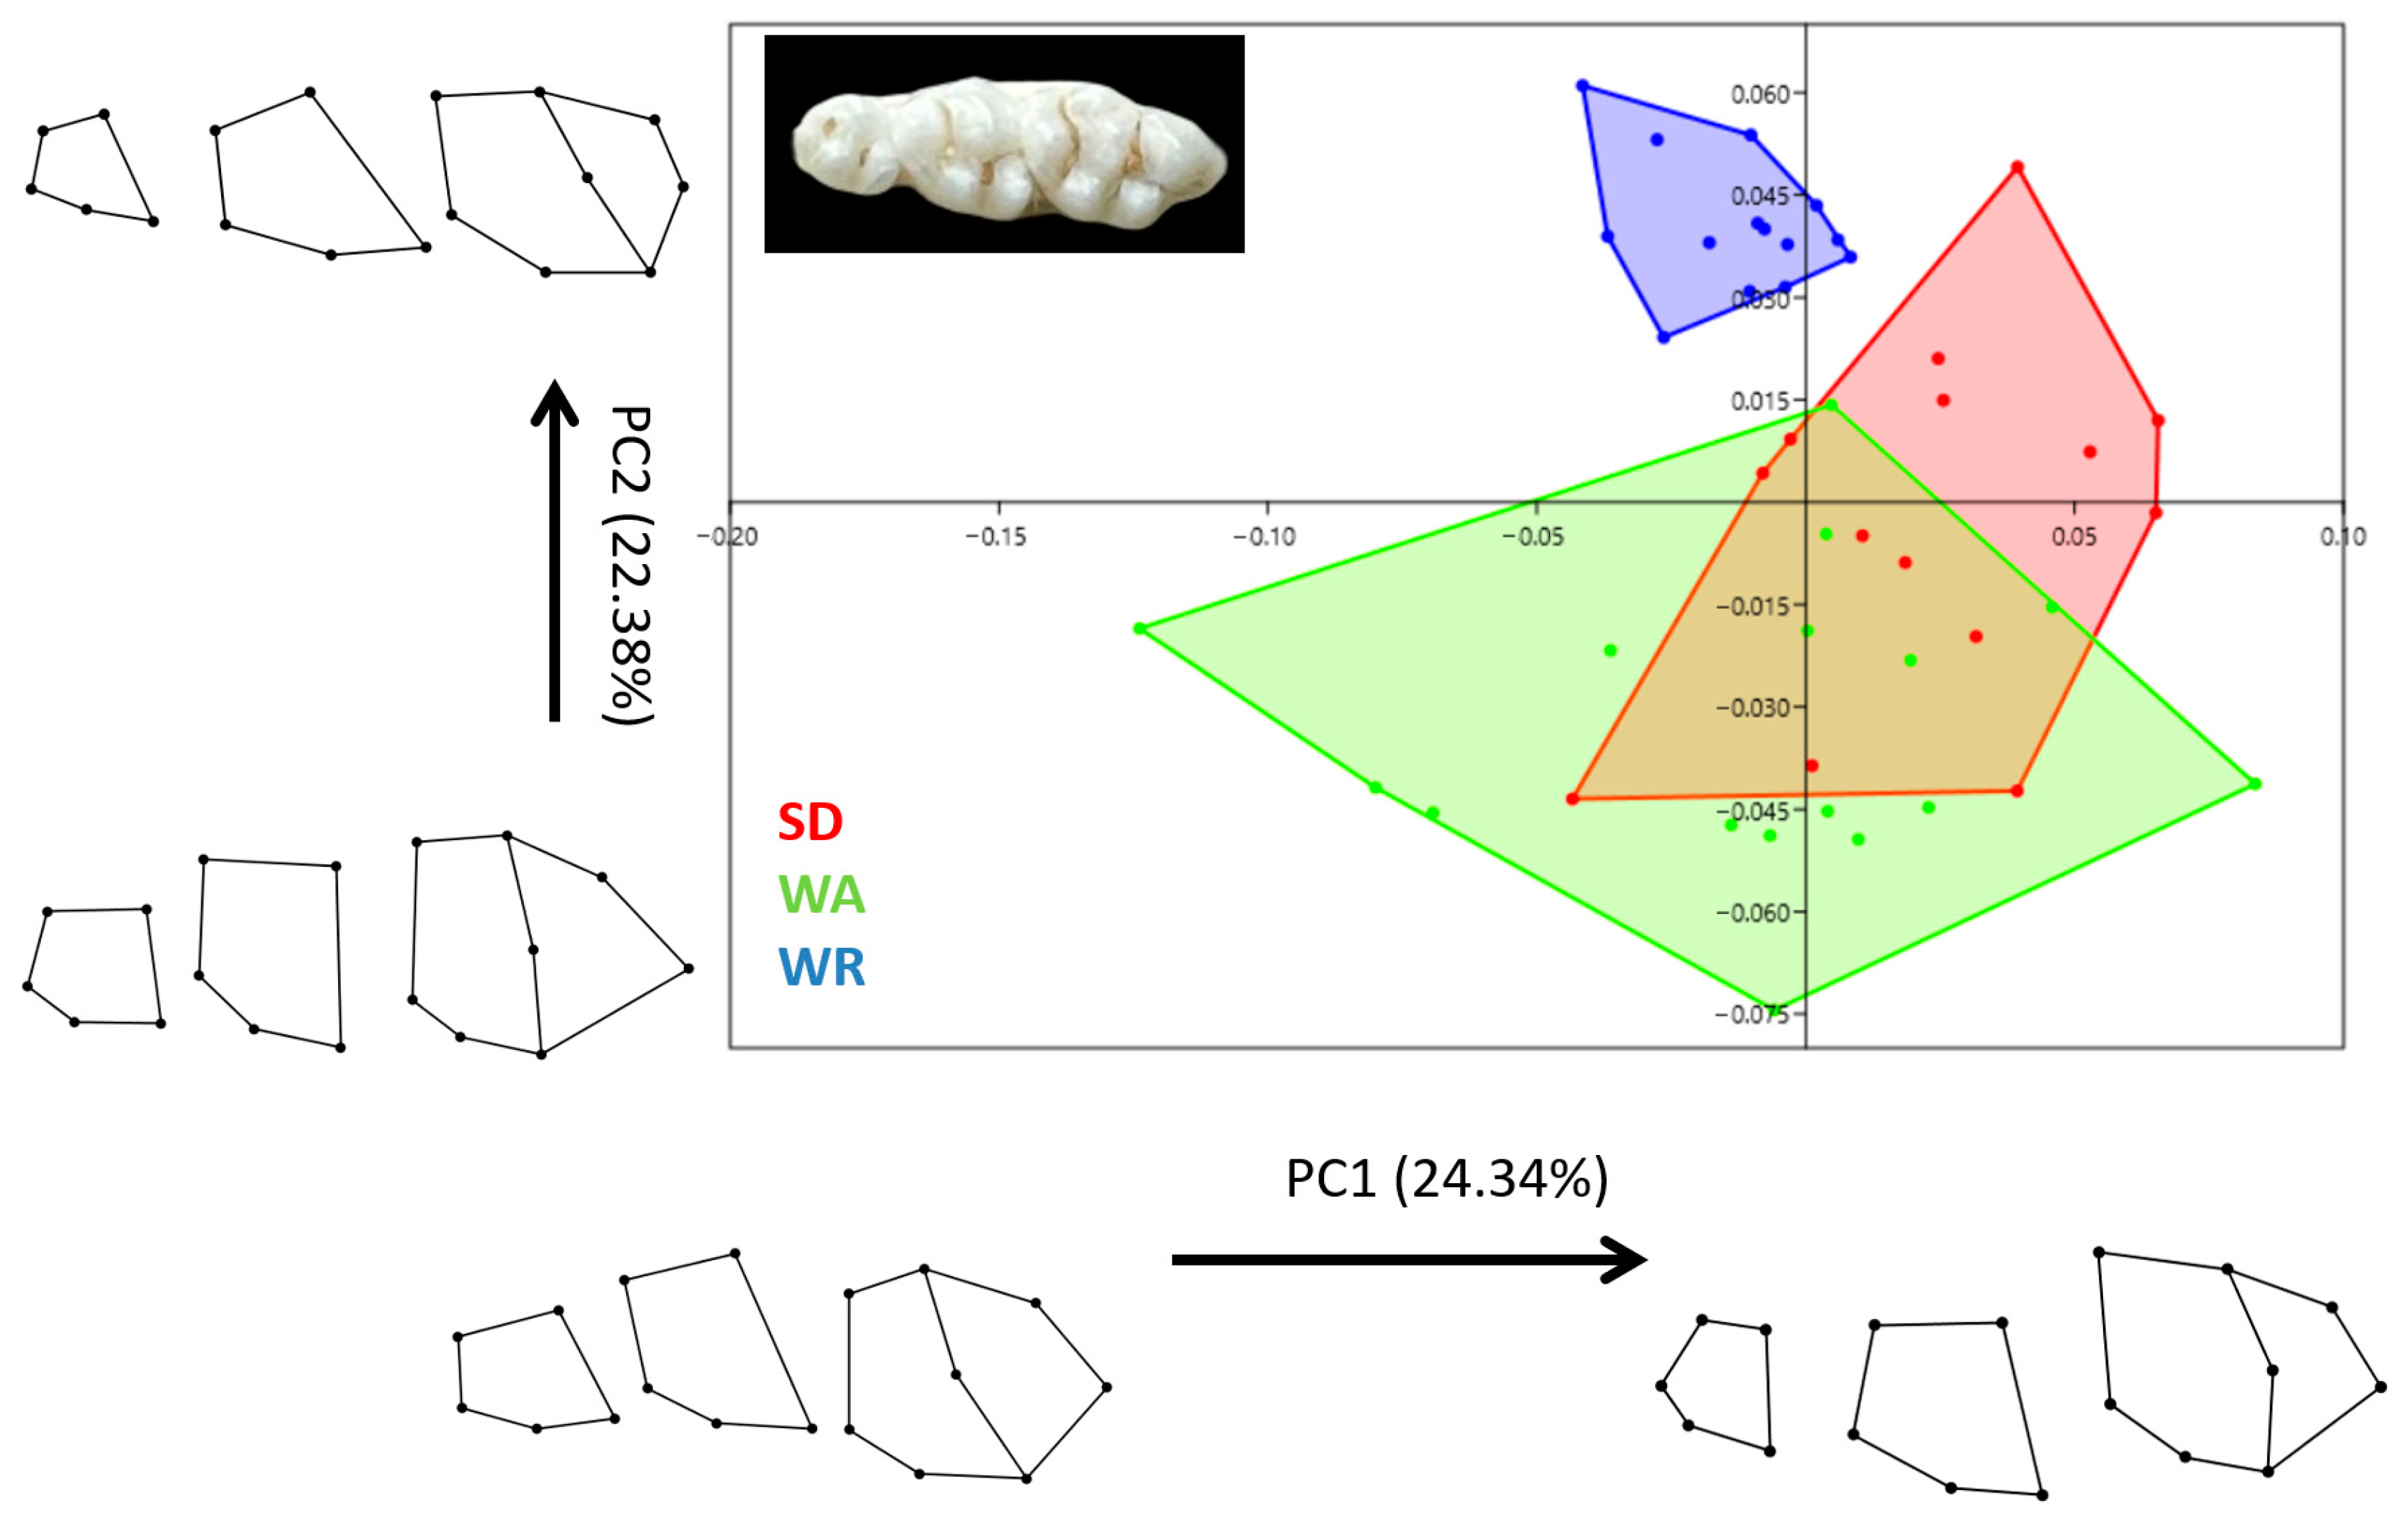
3.2. Shape Variation
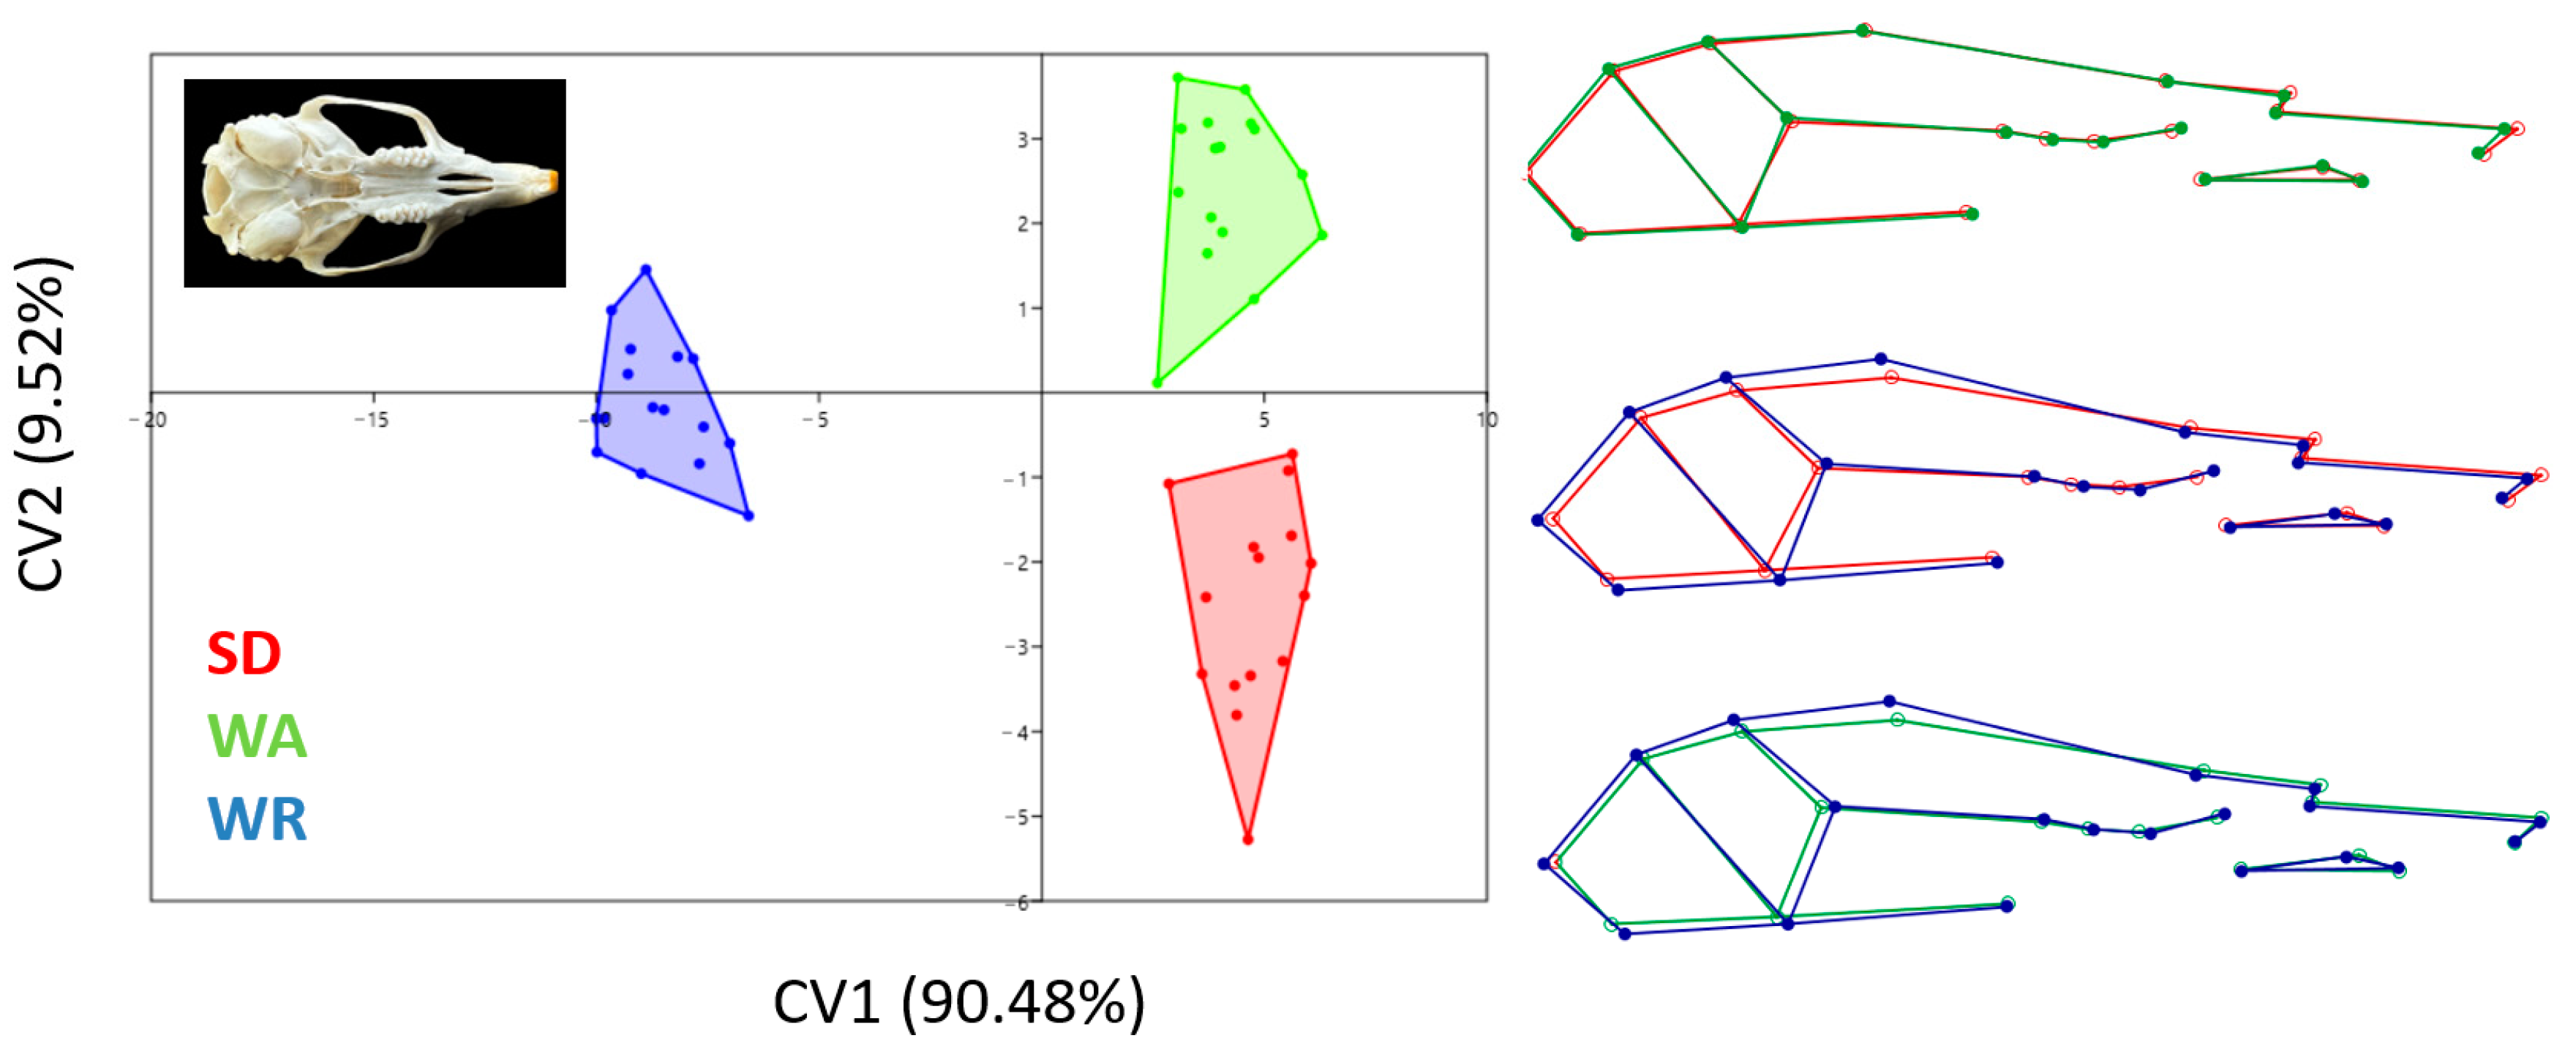
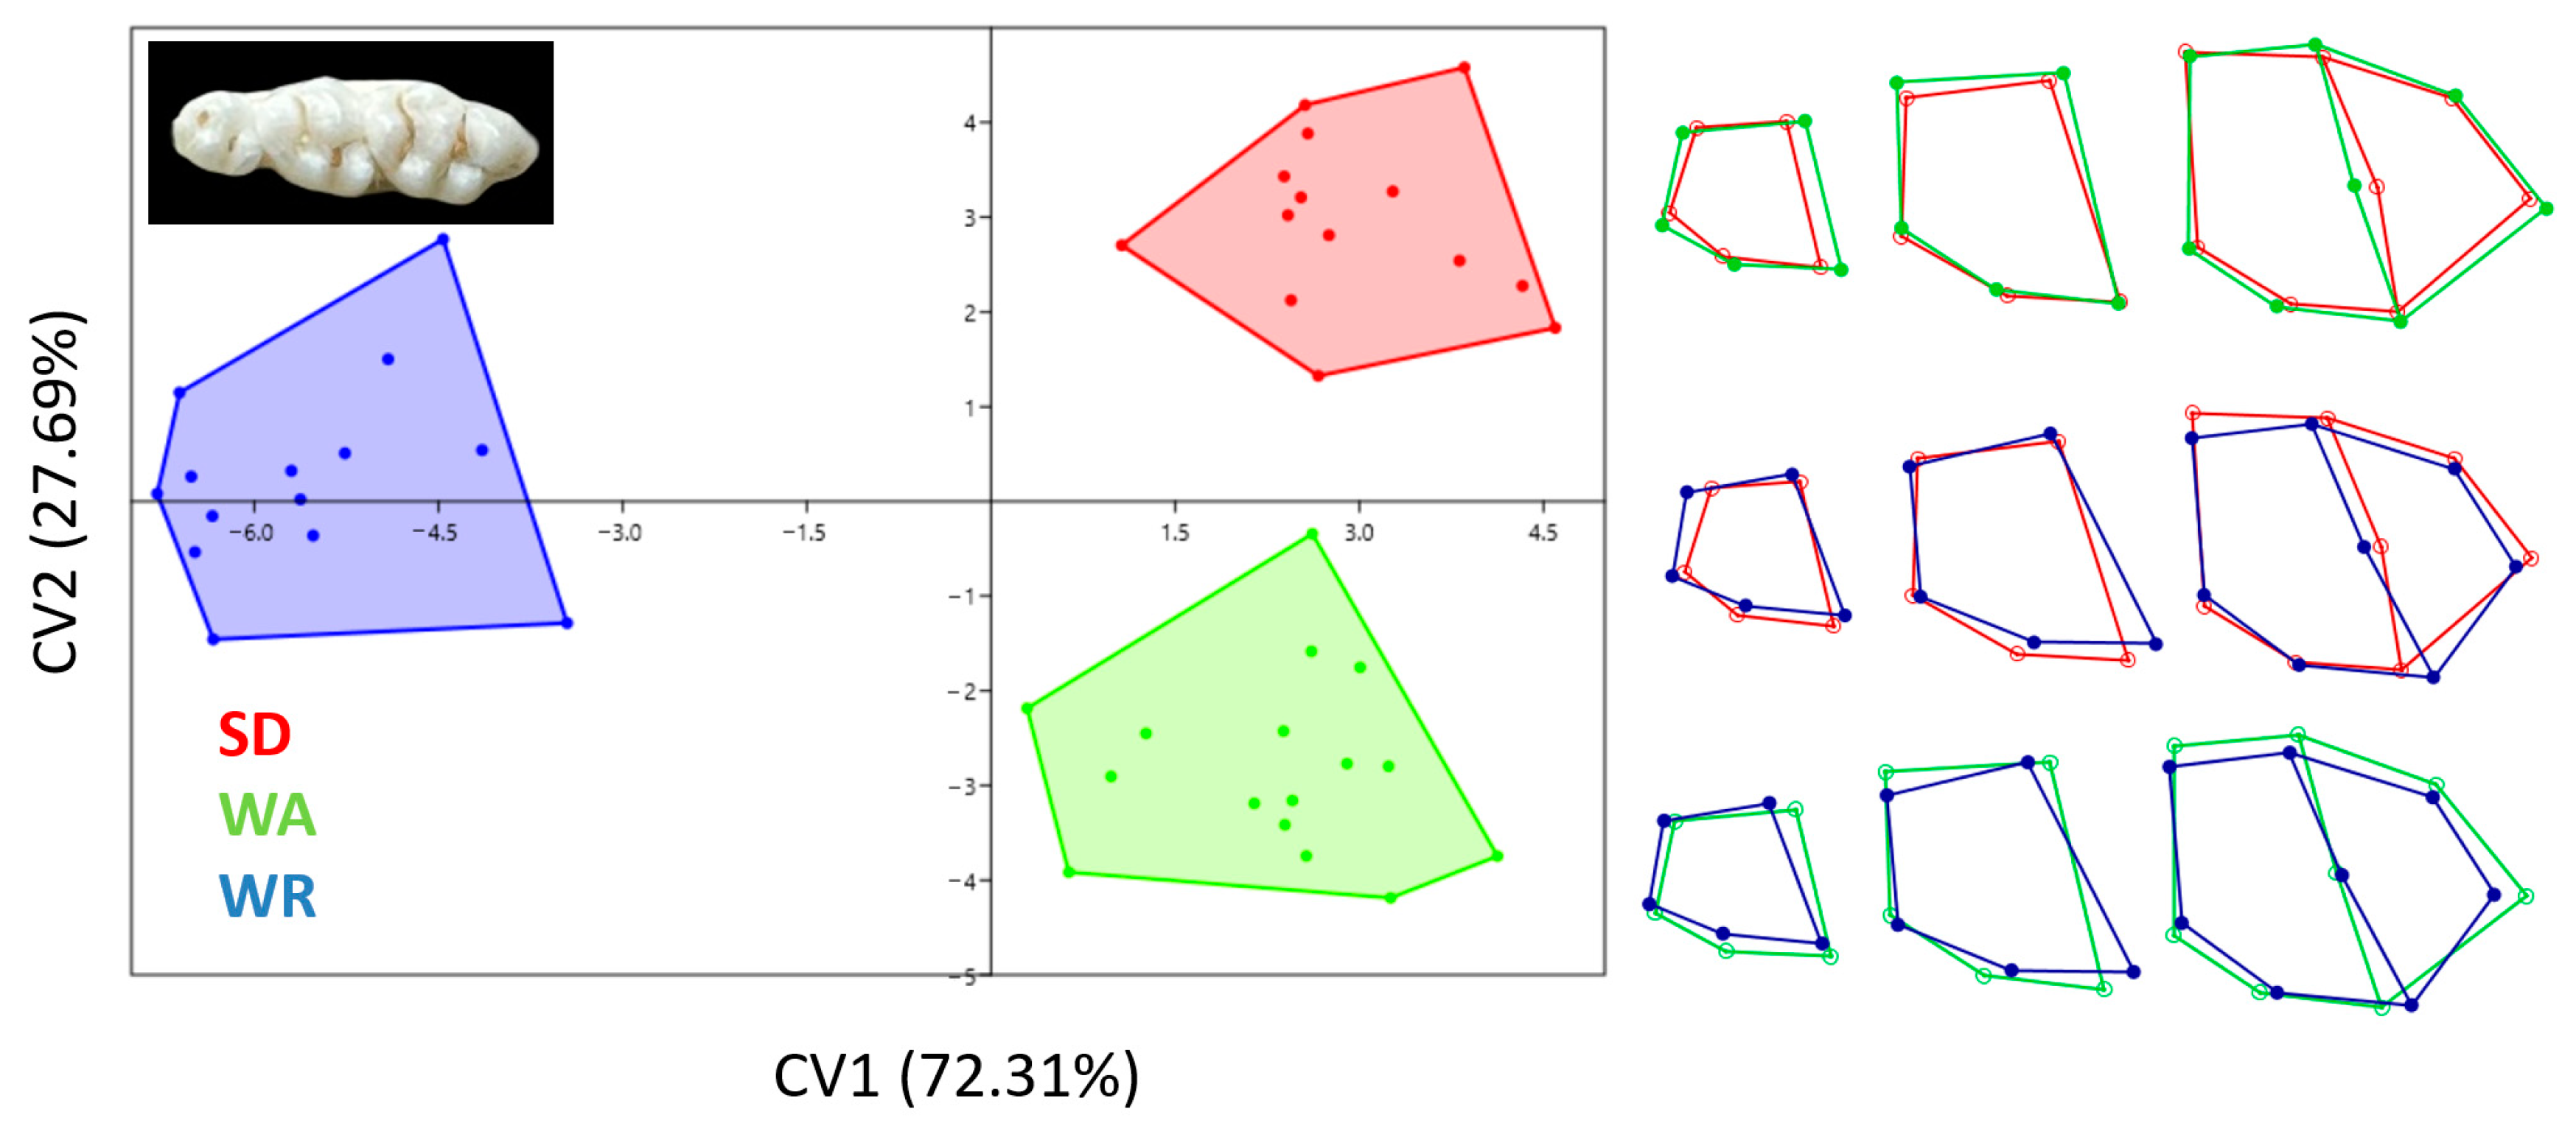
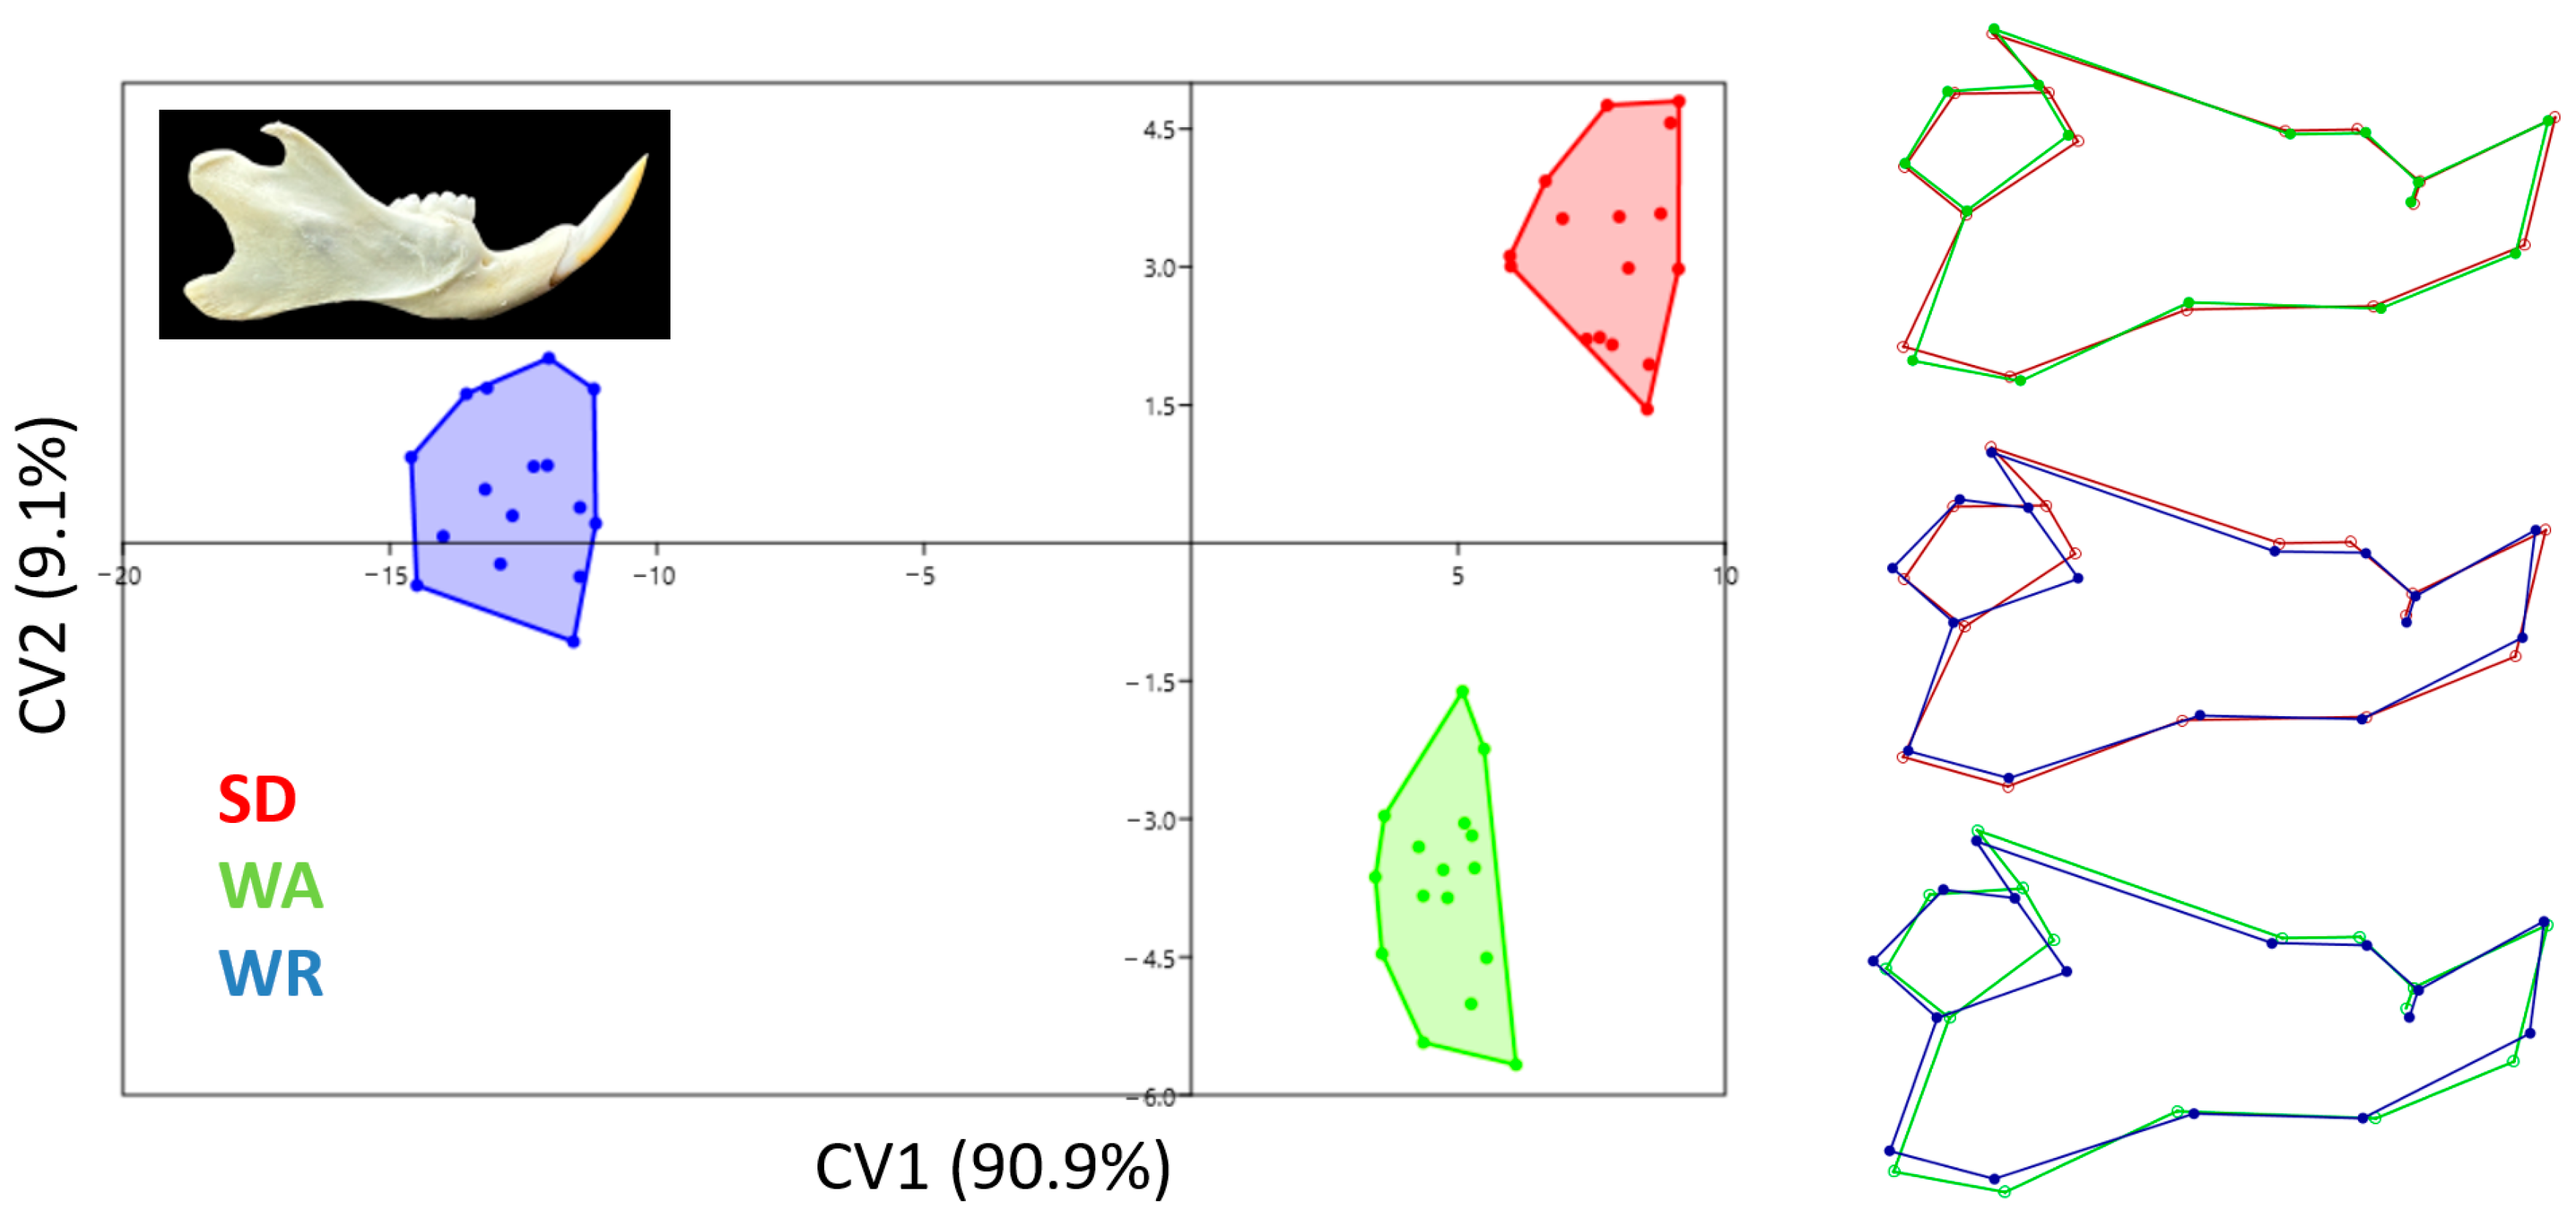
3.3. Canonical Variates Analysis
4. Discussion
5. Conclusions
Author Contributions
Funding
Institutional Review Board Statement
Informed Consent Statement
Data Availability Statement
Conflicts of Interest
Appendix A
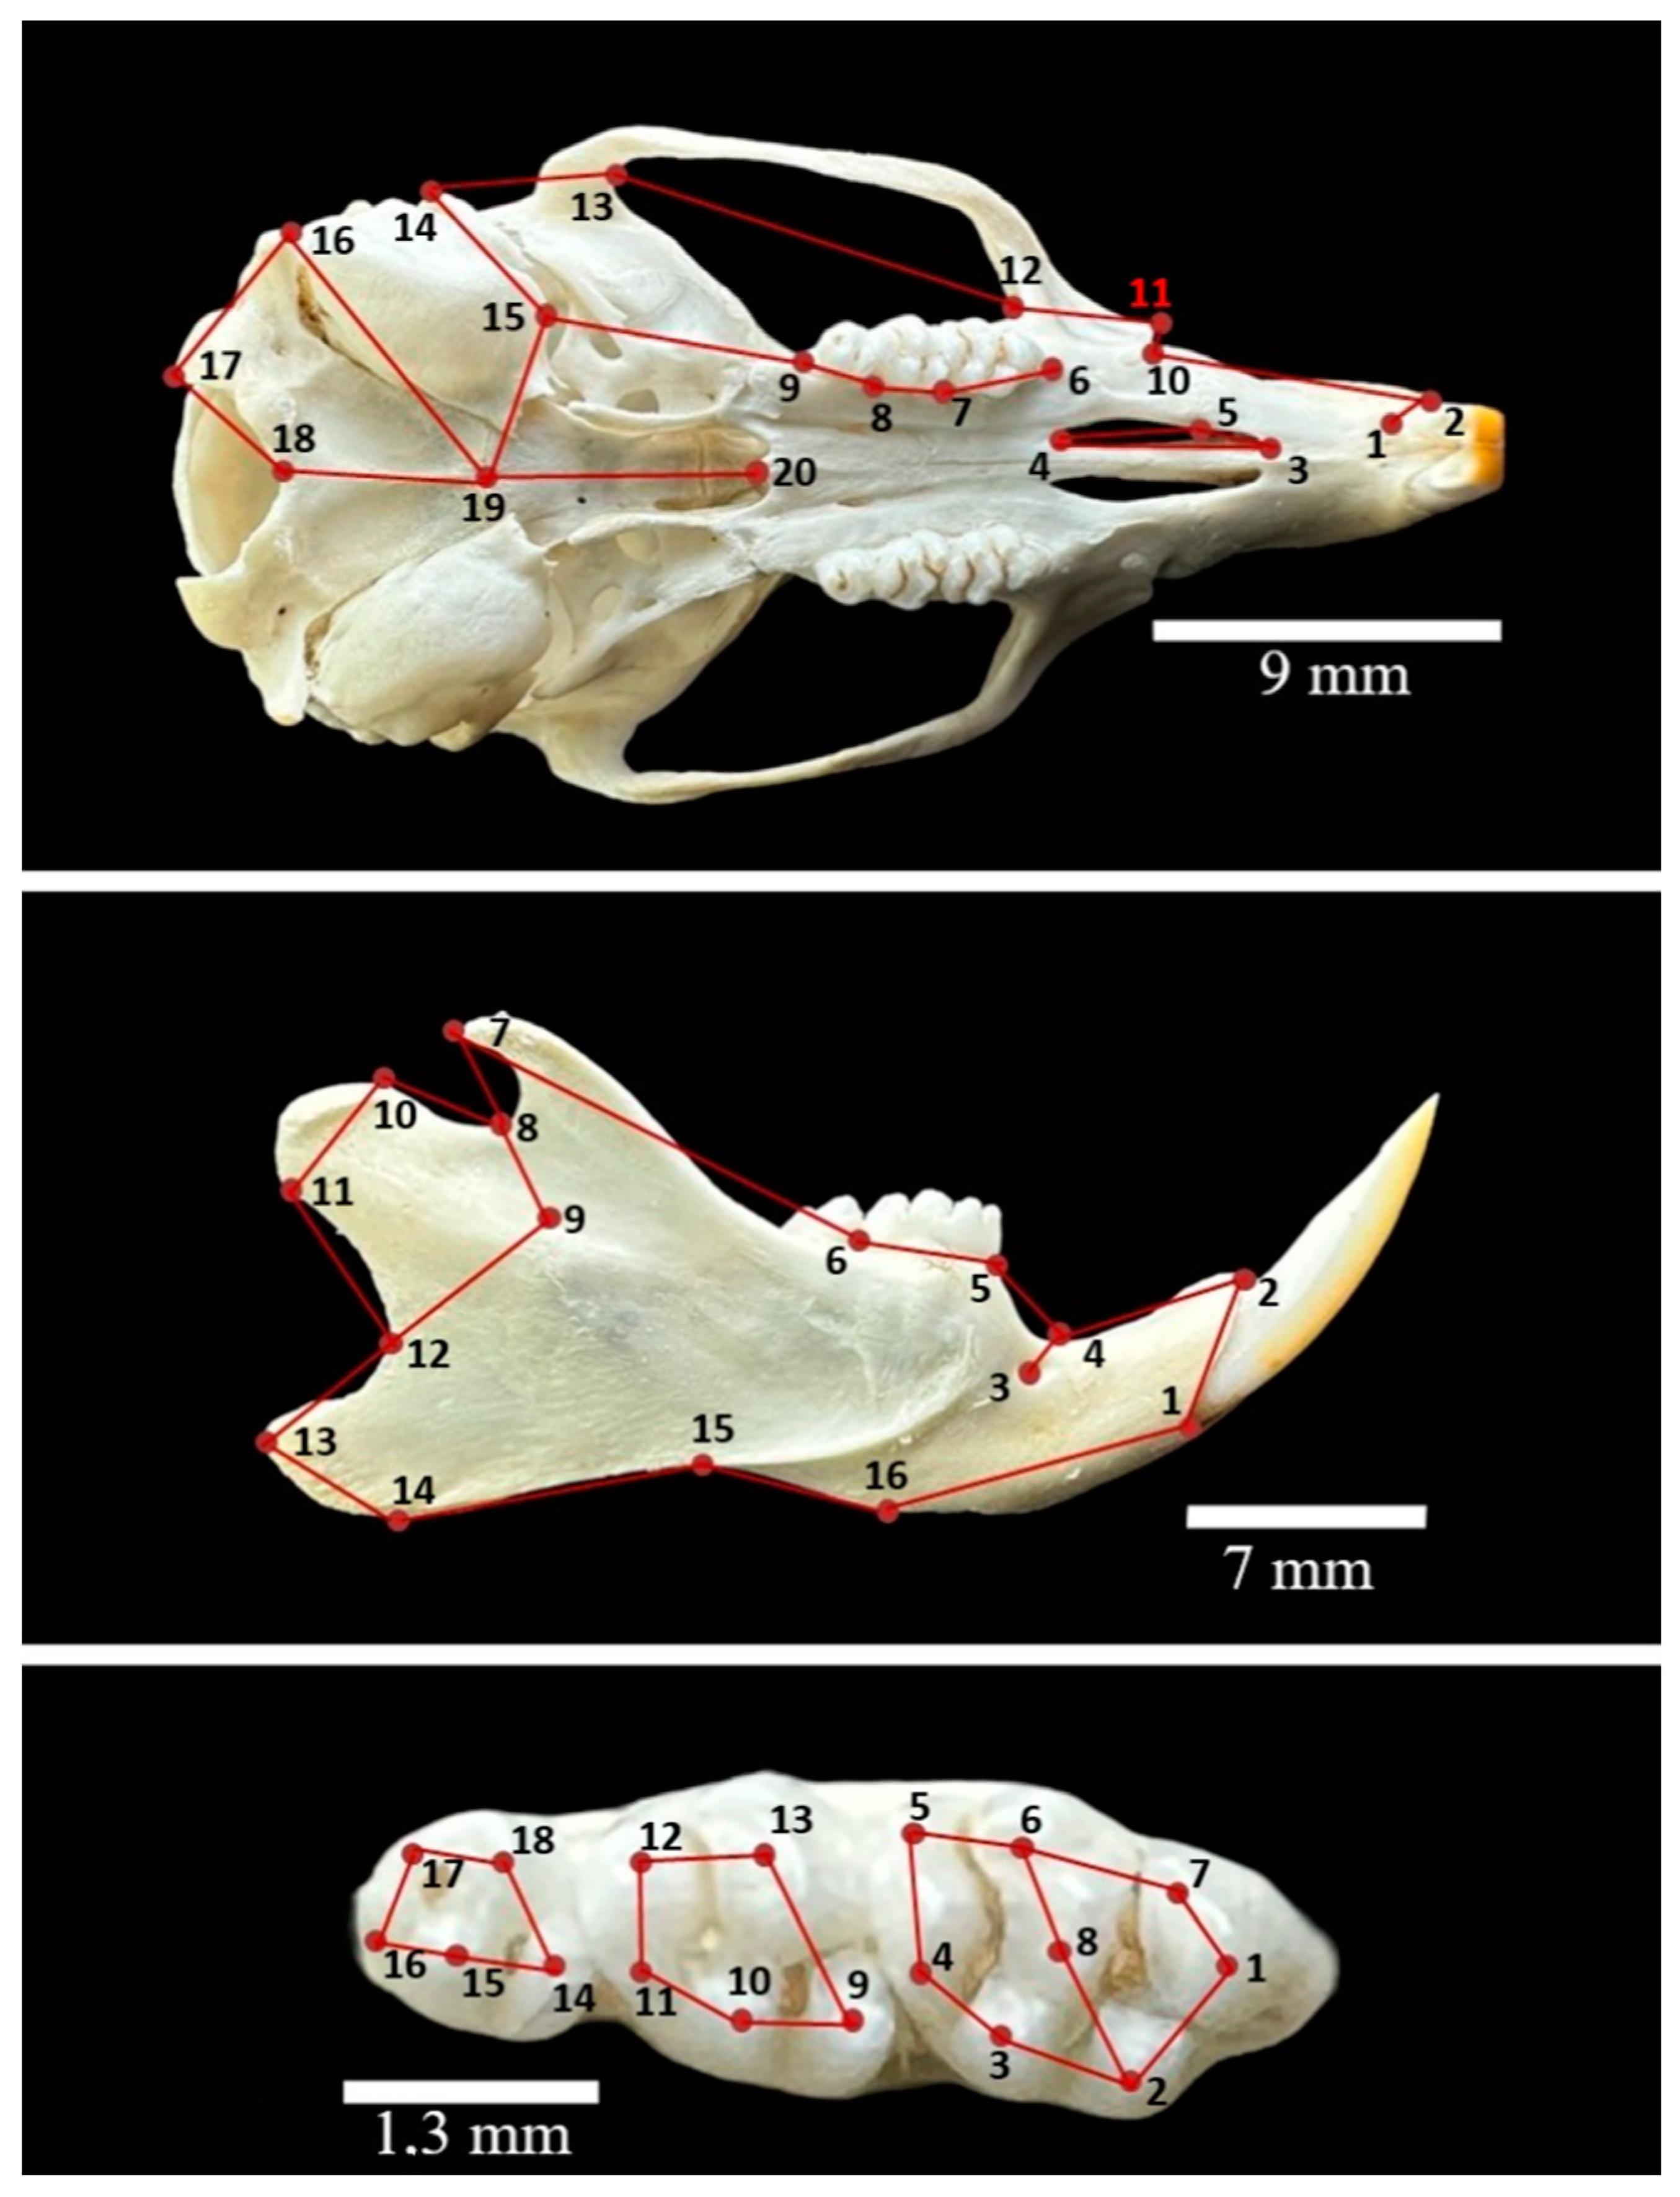
- Caudal border of the upper incisor alveolus
- Lateral border of the upper incisor alveolus
- Rostralmost point of the palatine fissure
- Caudalmost point of the palatine fissure
- Medial extend of the maxilloincisive suture
- Rostral border of the first molar alveolus
- Rostralmost point of the second molar (mesial surface)
- Rostralmost point of the third molar (mesial surface)
- Caudalmost point of the third molar
- Infraorbital notch
- Facial tuber
- Deepest rostral indentation of the zygomatic arch
- Deepest caudal indentation of the zygomatic arch
- Most lateral point of the external acoustic meatus
- Rostralmost point of the tympanic bulla
- Caudalmost point of the tympanic bulla
- Caudalmost point of the occipital condyle
- Rostralmost point of the foramen magnum
- Median point of the sphenooccipital suture
- Median point of the caudal edge of the bony palate
- Ventral edge of the lower incisor alveolus
- Dorsal edge of the lower incisor alveolus
- Mental foramen
- Deepest indentation of the interalveolar margin
- Rostral edge of the first lower molar alveolus
- Rostral edge of the third lower molar alveolus
- Apex of the coronoid process
- Mandibular notch
- Projection of the mandibular foramen
- Rostralmost point of the condylar process
- Caudalmost point of the condylar process
- Deepest indentation of the caudal edge of the mandibular ramus
- Angular process
- Angle of the mandible
- Facial notch
- Caudal edge of the mandibular symphysis
References
- Wilson, D.E.; Reeder, D.M. (Eds.) Mammal Species of the World: A Taxonomic and Geographic Reference, 3rd ed.; Johns Hopkins University Press: Baltimore, MD, USA, 2005. [Google Scholar]
- Dikmen, S.; Petek, M.; Oğan, M.; Onbaşılar, E. Laboratuvar Hayvanları Yetiştirme ve Sağlığı; Anadolu Üniversitesi Yayını: Eskişehir, Turkey, 2011; p. 2441. [Google Scholar]
- Treuting, P.M.; Dintzis, S.M.; Montine, K.S. Comparative Anatomy and Histology: A Mouse, Rat, and Human Atlas, 2nd ed.; Academic Press: Washington, DC, USA, 2017. [Google Scholar]
- Sarkisova, K.; van Luijtelaar, G. The WAG/Rij strain: A genetic animal model of absence epilepsy with comorbidity of depressiony. Prog. Neuro-Psychopharmacol. Biol. Psychiatry 2011, 35, 854–876. [Google Scholar] [CrossRef] [PubMed]
- Sarkisova, K.Y.; Kulikov, M.A. Behavioral characteristics of WAG/Rij rats susceptible and non-susceptible to audiogenic seizures. Behav. Brain Res. 2006, 166, 9–18. [Google Scholar] [CrossRef] [PubMed]
- Dyce, K.M.; Sack, W.O.; Wensing, C.G. Textbook of Veterinary Anatomy: Elsevier: Amsterdam, The Netherlands, 2010; pp. 279–290.
- Novacek, M.J. Patterns of diversity in the mammalian skull. Skull 1993, 2, 438–545. [Google Scholar]
- Lewis, M.R.; Noel, D. Anatomy and Histology of the Laboratory rat in Toxicology and Biomedical Research; Andre Gerhard Wolff: London, UK, 2019; pp. 1–359. [Google Scholar]
- Missagia, R.V.; Perini, F.A. Skull morphology of the Brazilian shrew mouse Blarinomys breviceps (Akodontini; Sigmodontinae), with comparative notes on Akodontini rodents. Zool. Anz. 2018, 277, 148–161. [Google Scholar] [CrossRef]
- Bookstein, F.L. Combining the tools of geometric morphometrics. In Advances in Morphometrics; Springer: Boston, MA, USA, 1996; pp. 131–151. [Google Scholar]
- Zelditch, M.; Swiderski, D.; Sheets, H.D. Geometric Morphometrics for Biologists: A Primer; Academic Press: Cambridge, MA, USA, 2012. [Google Scholar]
- Cooke, S.B.; Terhune, C.E. Form, function, and geometric morphometrics. Anat. Rec. 2015, 298, 5–28. [Google Scholar] [CrossRef] [PubMed]
- Slice, D.E. Geometric morphometrics. Annu. Rev. Anthropol. 2007, 36, 261–281. [Google Scholar] [CrossRef]
- Gündemir, O.; Koungoulos, L.; Szara, T.; Duro, S.; Spataru, M.C.; Michaud, M.; Onar, V. Cranial morphology of Balkan and West Asian livestock guardian dogs. J. Anat. 2023, 243, 951–959. [Google Scholar] [CrossRef]
- Hanken, J.; Thorogood, P. Evolution and development of the vertebrate skull: The role of pattern formation. Trends Ecol. Evol. 1993, 8, 9–15. [Google Scholar] [CrossRef] [PubMed]
- Lawing, A.M.; Polly, P.D. Geometric morphometrics: Recent applications to the study of evolution and development. J. Zool. 2010, 280, 1–7. [Google Scholar] [CrossRef]
- Kryštufek, B.; Janžekovič, F.; Hutterer, R.; Klenovšek, T. Morphological evolution of the skull in closely related bandicoot rats: A comparative study using geometric morphometrics. Hystrix 2016, 27, 163–169. [Google Scholar]
- Samuel, O.M.; Parés Casanova, P.M.; Nwaogu, I.C.; Olopade, J.O. Geometric morphometrics of the skull of two African rodents, Thryonomys swinderianus and Cricetomys gambianus. Ann. Exp. Biol. 2015, 3, 21–30. [Google Scholar]
- Yanai, J. Strain and sex differences in the rat brain. Cells Tissues Organs 1979, 103, 150–158. [Google Scholar] [CrossRef] [PubMed]
- Gregory, E. Comparison of postnatal CNS development between male and female rats. Brain Res. 1975, 99, 152–156. [Google Scholar] [CrossRef] [PubMed]
- Rohlf, F.J. TpsUtil; Department of Ecology and Evolution, State University of New York, Stony Brook: New York, NY, USA, 2004. [Google Scholar]
- Rohlf, F.J. TpsDig; Department of Ecology and Evolution, State University of New York, Stony Brook: New York, NY, USA, 2004. [Google Scholar]
- Klingenberg, C.P. MorphoJ: An integrated software package for geometric morphometrics. Mol. Ecol. Resour. 2011, 11, 353–357. [Google Scholar] [CrossRef] [PubMed]
- Boz, İ.; Manuta, N.; Özkan, E.; Kahvecioğlu, O.; Pazvant, G.; Ince, N.G.; Gundemir, O. Geometric morphometry in veterinary anatomy. Veterinaria 2023, 72, 15–27. [Google Scholar]
- Caumul, R.; Polly, P.D. Phylogenetic and environmental components of morphological variation: Skull, mandible, and molar shape in marmots (Marmota, Rodentia). Evolution 2005, 59, 2460–2472. [Google Scholar] [PubMed]
- Taylor, P.J.; Kumirai, A.; Contrafatto, G. Geometric morphometric analysis of adaptive cranial evolution in southern African laminate-toothed rats (Family: Muridae, Tribe: Otomyini). Durb. Mus. Novit. 2004, 29, 110–122. [Google Scholar]
- Hadžiomerović, N.; Gündemir, O.; Kovačević, S. Mandible size and shape of the red fox (Vulpes vulpes) and golden jackal (Canis aureus). Adv. Anim. Vet. Sci. 2022, 10, 364–368. [Google Scholar] [CrossRef]
- Demircioğlu, İ.; Demiraslan, Y.; Gürbüz, İ.; Dayan, M.O. Geometric morphometric analysis of skull and mandible in Awassi ewe and ram. Kafkas Üniversitesi Vet. Fakültesi Derg. 2021, 27, 43–49. [Google Scholar]
- Demiraslan, Y.; Özgel, Ö.; Gürbüz, İ.; Kaştan, Ö. The mandibles of the Honamli and Hair goat (Capra hircus); a geometric morphometric study. Ank. Üniversitesi Vet. Fakültesi Derg. 2021; 68, 321–328. [Google Scholar]
- Langer, M.; Brandt, C.; Löscher, W. Marked strain and substrain differences in induction of status epilepticus and subsequent development of neurodegeneration, epilepsy, and behavioral alterations in rats: Strain and substrain differences in an epilepsy model in rats. Epilepsy Res. 2011, 96, 207–224. [Google Scholar] [CrossRef]
- Maga, A.M.; Navarro, N.; Cunningham, M.L.; Cox, T.C. Quantitative trait loci affecting the 3D skull shape and size in mouse and prioritization of candidate genes in-silico. Front. Physiol. 2015, 6, 133705. [Google Scholar] [CrossRef] [PubMed]
- Pallares, L.F.; Harr, B.; Turner, L.M.; Tautz, D. Use of a natural hybrid zone for genomewide association mapping of craniofacial traits in the house mouse. Mol. Ecol. 2014, 23, 5756–5770. [Google Scholar] [CrossRef] [PubMed]
- Lieberman, D.E.; Hallgrímsson, B.; Liu, W.; Parsons, T.E.; Jamniczky, H.A. Spatial packing, cranial base angulation, and craniofacial shape variation in the mammalian skull: Testing a new model using mice. J. Anat. 2008, 212, 720–735. [Google Scholar] [CrossRef] [PubMed]
- Unger, C.M.; Devine, J.; Hallgrímsson, B.; Rolian, C. Selection for increased tibia length in mice alters skull shape through parallel changes in developmental mechanisms. eLife 2021, 10, e67612. [Google Scholar] [CrossRef]


| Data | Pair | Difference | SE | Q | p-Value |
|---|---|---|---|---|---|
| Skull | SD-WA | 132.49 | 50.7039 | 2.613 | 0.1662 |
| SD-WR | 750.7664 | 50.7039 | 14.8069 | <0.01 | |
| WA-WR | 618.2764 | 49.8794 | 12.3954 | <0.01 | |
| Mandible | SD-WA | 137.1119 | 50.2469 | 2.7288 | 0.1422 |
| SD-WR | 733.8179 | 50.2469 | 14.6043 | <0.01 | |
| WA-WR | 596.7059 | 50.2469 | 11.8755 | <0.01 | |
| Teeth | SD-WA | 27.3805 | 21.8871 | 1.251 | 0.653 |
| SD-WR | 175.635 | 22.6048 | 7.7698 | <0.01 | |
| WA-WR | 148.2545 | 21.8871 | 6.7736 | <0.01 |
| Data | Source | DF | Sum of Square | Mean Square | F Statistic | p-Value |
|---|---|---|---|---|---|---|
| Cranium | Groups (between groups) | 2 | 5,049,977.158 | 2,524,988.579 | 63.4303 | <0.01 |
| Error (within groups) | 44 | 1,751,520.212 | 39,807.2775 | |||
| Mandible | Groups (between groups) | 2 | 4,871,180.276 | 2,435,590.138 | 60.2929 | <0.01 |
| Error (within groups) | 45 | 1,817,818.349 | 40,395.9633 | |||
| Teeth | Groups (between groups) | 2 | 253,124.045 | 126,562.0225 | 17.6918 | <0.01 |
| Error (within groups) | 41 | 293,302.0438 | 7153.7084 |
| Procrustes Distance | p Value for Procrustes Distance | ||||
|---|---|---|---|---|---|
| SD | WA | SD | WA | ||
| Skull | WA | 0.0201 | <0.0001 | ||
| WR | 0.0445 | 0.0334 | <0.0001 | <0.0001 | |
| Mandible | WA | 0.0366 | <0.0001 | ||
| WR | 0.0564 | 0.0684 | <0.0001 | <0.0001 | |
| Teeth | WA | 0.0507 | 0.0035 | ||
| WR | 0.0648 | 0.0753 | <0.0001 | <0.0001 | |
| Classification | Misclassification | ||||
|---|---|---|---|---|---|
| SD-WA | |||||
| Cranium | SD | WA | SD | WA | |
| SD | 15 | 0 | 6 | 9 | |
| WA | 0 | 16 | 9 | 7 | |
| SD-WR | |||||
| SD | WR | SD | WR | ||
| SD | 15 | 0 | 14 | 1 | |
| WR | 0 | 16 | 2 | 14 | |
| WA-WR | |||||
| WA | WR | WA | WR | ||
| WA | 16 | 0 | 15 | 1 | |
| WR | 0 | 16 | 1 | 15 | |
| Mandible | SD-WA | ||||
| SD | WA | SD | WA | ||
| SD | 16 | 0 | 12 | 4 | |
| WA | 0 | 16 | 4 | 12 | |
| SD-WR | |||||
| SD | WR | SD | WR | ||
| SD | 16 | 0 | 12 | 4 | |
| WR | 0 | 16 | 4 | 12 | |
| WA-WR | |||||
| WA | WR | WA | WR | ||
| WA | 16 | 0 | 12 | 4 | |
| WR | 0 | 16 | 4 | 12 | |
| Teeth | SD-WA | ||||
| SD | WA | SD | WA | ||
| SD | 14 | 0 | 6 | 8 | |
| WA | 0 | 16 | 8 | 8 | |
| SD-WR | |||||
| SD | WR | SD | WR | ||
| SD | 14 | 0 | 13 | 1 | |
| WR | 0 | 14 | 0 | 14 | |
| WA-WR | |||||
| WA | WR | WA | WR | ||
| WA | 16 | 0 | 14 | 2 | |
| WR | 0 | 14 | 1 | 13 | |
Disclaimer/Publisher’s Note: The statements, opinions and data contained in all publications are solely those of the individual author(s) and contributor(s) and not of MDPI and/or the editor(s). MDPI and/or the editor(s) disclaim responsibility for any injury to people or property resulting from any ideas, methods, instructions or products referred to in the content. |
© 2024 by the authors. Licensee MDPI, Basel, Switzerland. This article is an open access article distributed under the terms and conditions of the Creative Commons Attribution (CC BY) license (https://creativecommons.org/licenses/by/4.0/).
Share and Cite
Ağaç, D.K.; Onuk, B.; Gündemir, O.; Kabak, M.; Manuta, N.; Çakar, B.; Janeczek, M.; Crampton, D.A.; Szara, T. Comparative Cranial Geometric Morphometrics among Wistar Albino, Sprague Dawley, and WAG/Rij Rat Strains. Animals 2024, 14, 1274. https://doi.org/10.3390/ani14091274
Ağaç DK, Onuk B, Gündemir O, Kabak M, Manuta N, Çakar B, Janeczek M, Crampton DA, Szara T. Comparative Cranial Geometric Morphometrics among Wistar Albino, Sprague Dawley, and WAG/Rij Rat Strains. Animals. 2024; 14(9):1274. https://doi.org/10.3390/ani14091274
Chicago/Turabian StyleAğaç, Duygu Küçük, Burcu Onuk, Ozan Gündemir, Murat Kabak, Nicoleta Manuta, Buket Çakar, Maciej Janeczek, Denise Amber Crampton, and Tomasz Szara. 2024. "Comparative Cranial Geometric Morphometrics among Wistar Albino, Sprague Dawley, and WAG/Rij Rat Strains" Animals 14, no. 9: 1274. https://doi.org/10.3390/ani14091274