3.1.1. Canadian Livestock GHG and Land Use Inventory
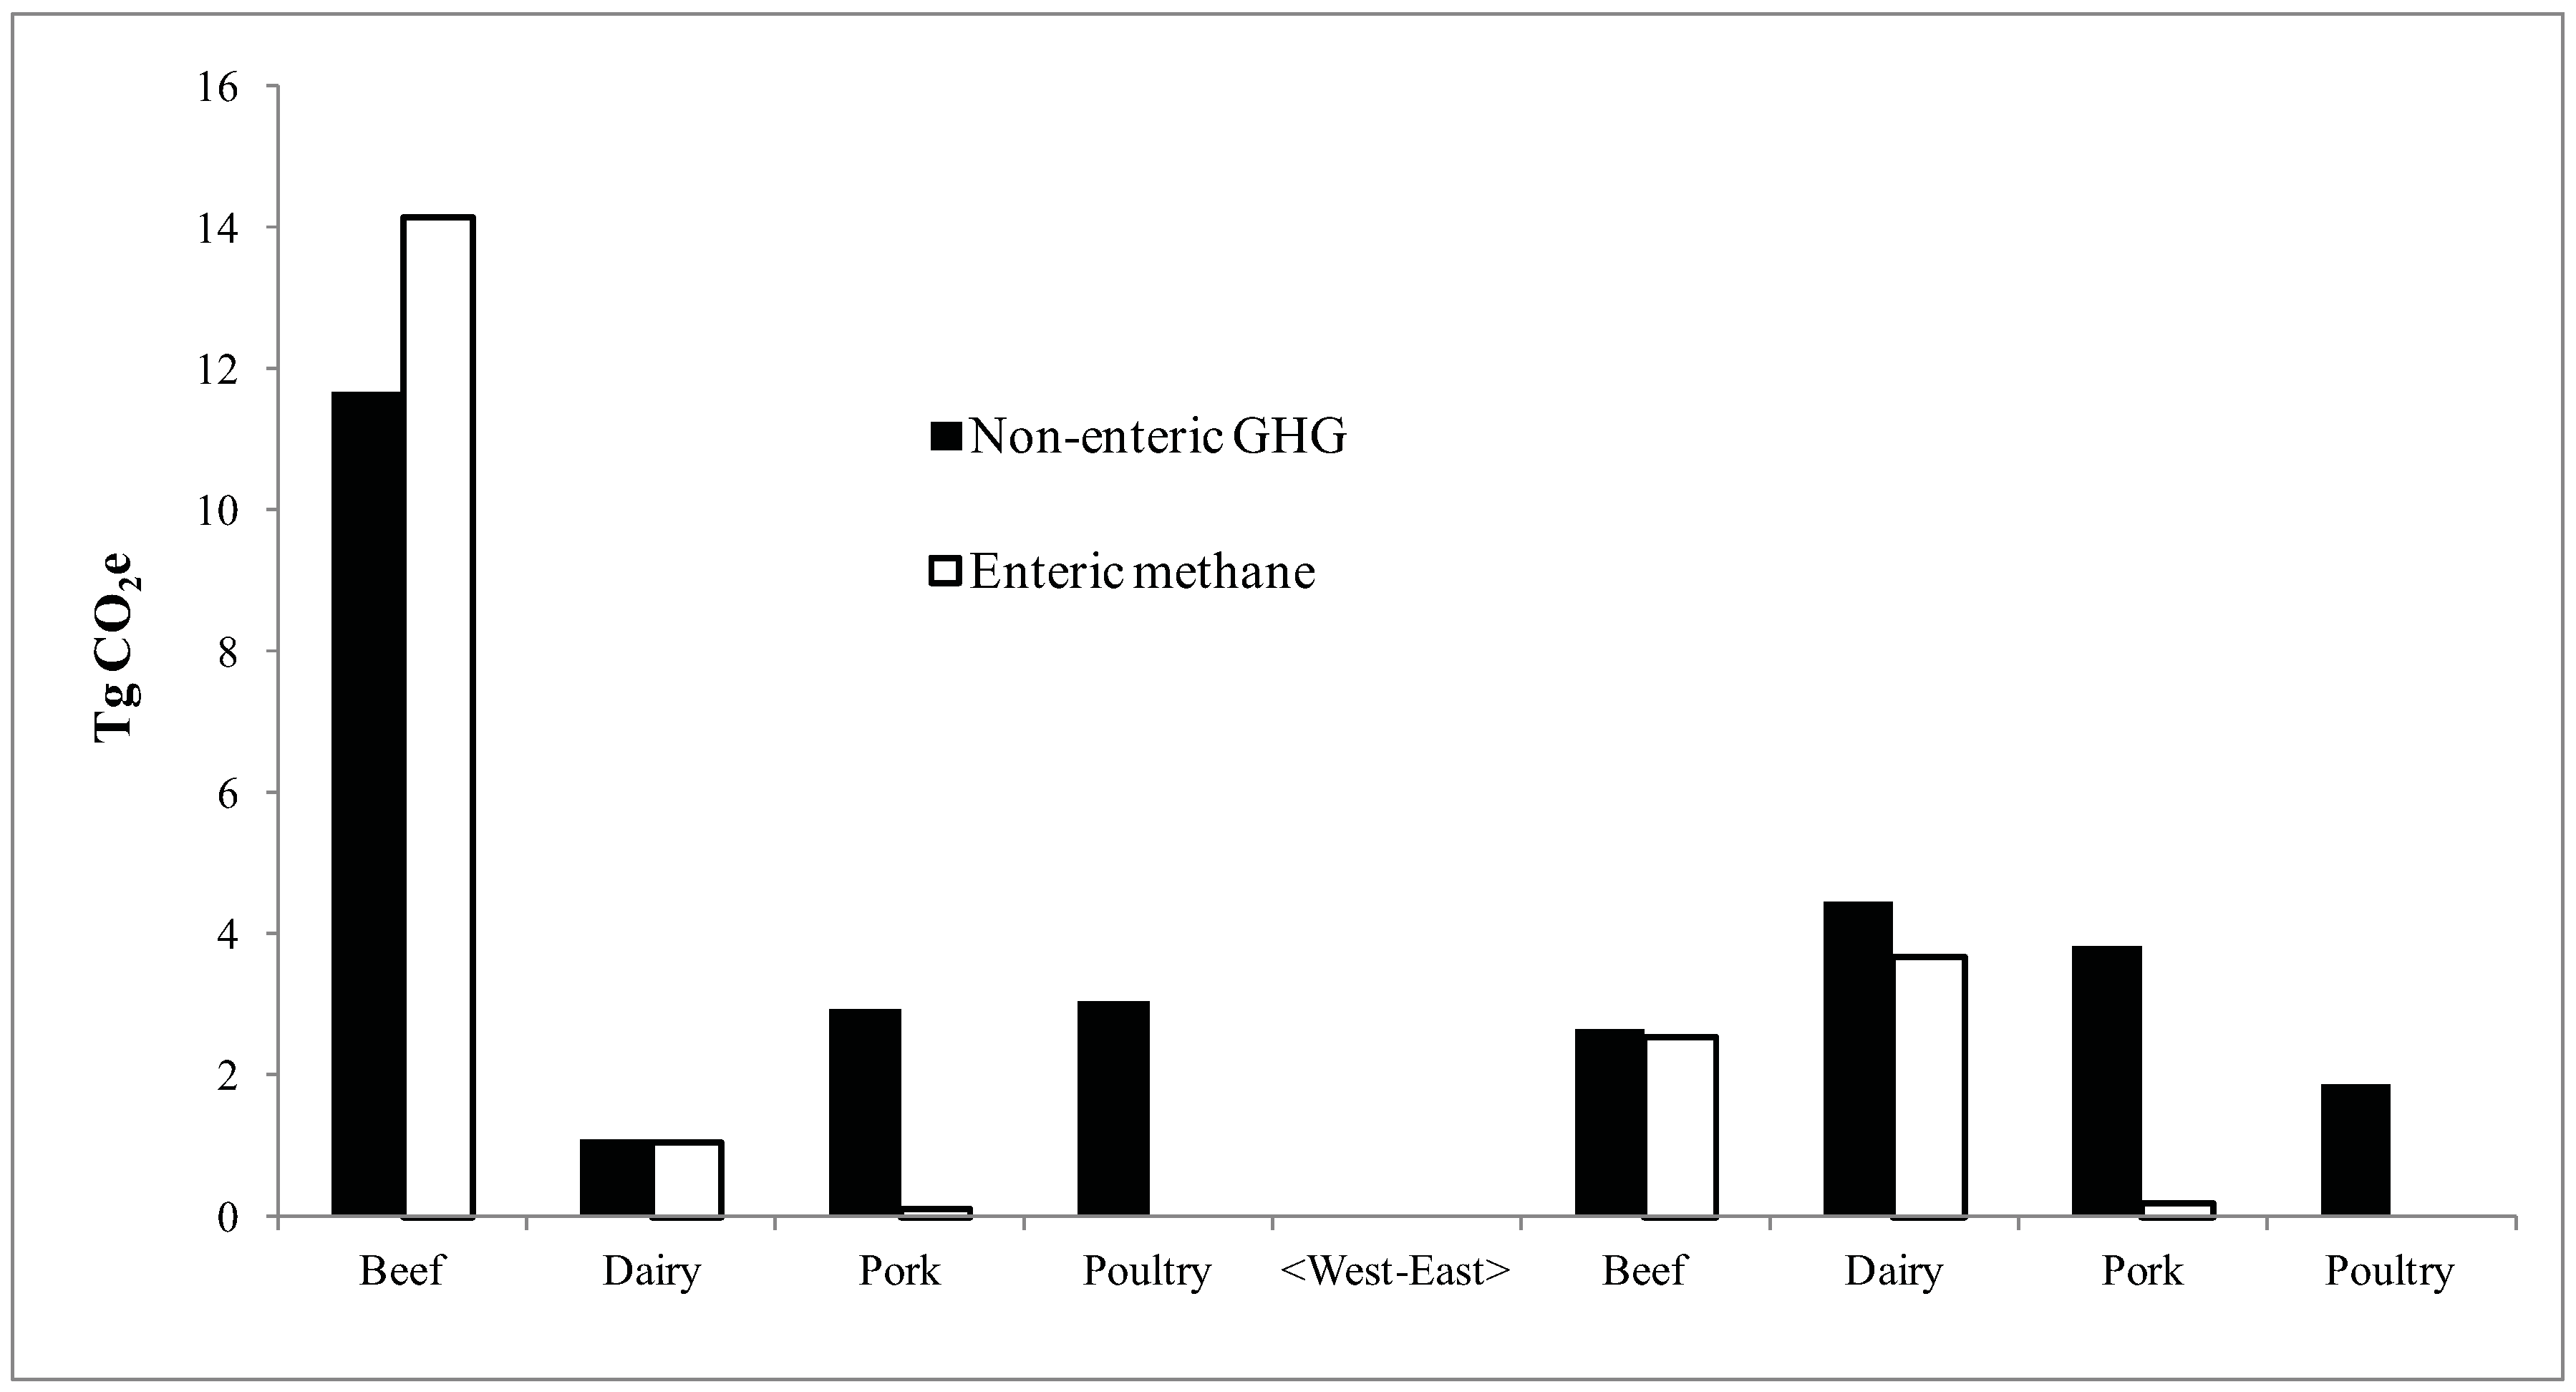
A summary of GHG emissions from the four livestock industries for eastern (Atlantic Provinces, Québec, Ontario) and western (Manitoba, Saskatchewan, Alberta, British Columbia) Canada is shown in
Figure 2. These quantities reflect the respective sizes of the four industries as much as differences in GHG emission types. Since changes in soil carbon relate to interactions among livestock populations, GHG emissions were grouped in a way that most closely relates to ruminant and non-ruminant livestock systems. Hence, the GHG emissions in
Figure 2 are distinguished as either enteric or non-enteric. Non-enteric GHG emissions include manure methane, N
2O from both the soil and stored manure, and fossil CO
2. The main sources of the non-enteric GHGs are the annual crops that supply the feed grains for non-ruminants (hogs and poultry), and the grain component of cattle diets. Canadian livestock accounted for 53 TgCO
2e in 2001 with 22 TgCO
2e coming from enteric methane. The Canadian beef industry emitted 31 TgCO
2e. Western beef accounted for 26 TgCO
2e, 14 of which were enteric methane. Dairy and pork production accounted for 10 and 7 TgCO
2e, respectively. At 5 TgCO
2e, poultry was the lowest source of GHG from the livestock industry in Canada.
Figure 2.
Greenhouse gas (GHG) emissions from four types of livestock in eastern and western Canada separated into enteric and non-enteric sources (land use and manure storage systems) in 2001.
Figure 2.
Greenhouse gas (GHG) emissions from four types of livestock in eastern and western Canada separated into enteric and non-enteric sources (land use and manure storage systems) in 2001.
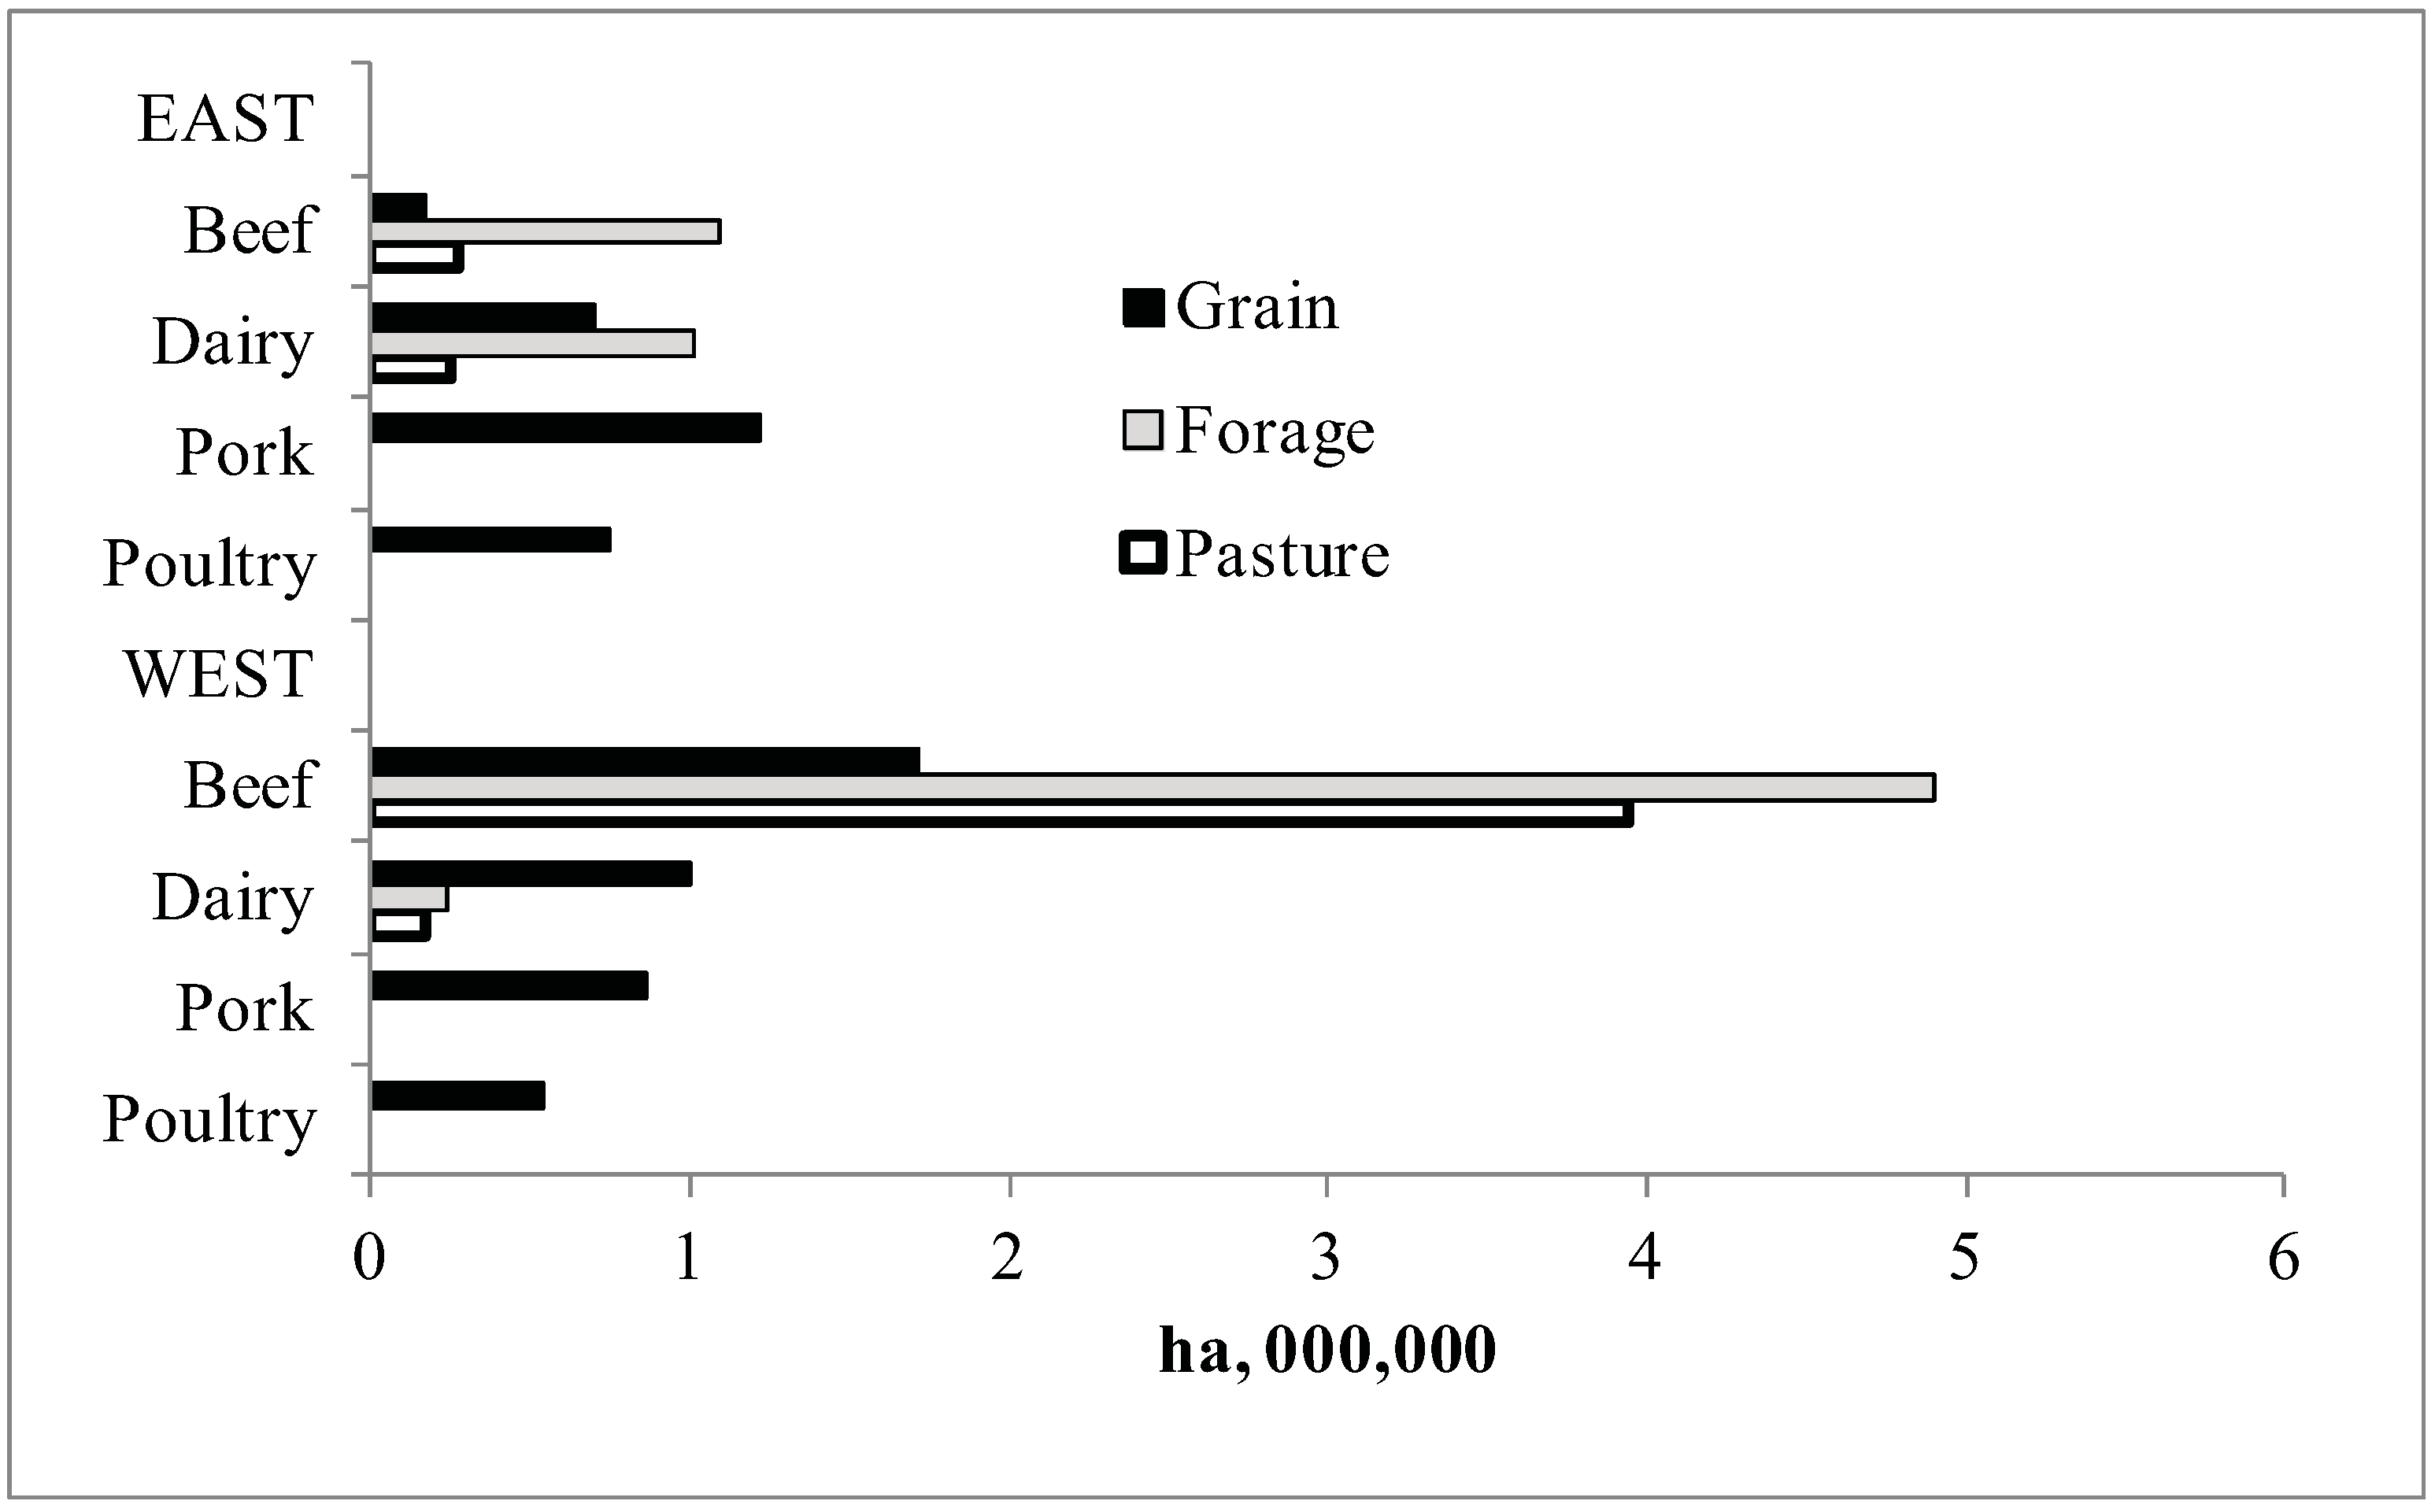
Figure 3 shows the areas in each of these four crop complexes and groups land use according to those cultivated for grain, harvested forage, or improved pasture. The BCC and DCC include all three classes of land (grain, forage and pasture), but the only land in the PCC and ACC is land that can produce grains and pulses (annuals). Since soil carbon is generally higher under perennial forage than under annual crops [
10], a shift from ruminant to non-ruminant livestock production would reduce soil carbon stock. Silage corn, although an annual crop, was grouped with the forages in
Figure 3. Pasture represents an appreciable land use only in the western beef industry. It was assumed in this study that most of that land would be unsuitable, or at least the last land selected, for reseeding to grow annual feed grains or harvested field crops. Hence, that land would most likely continue to be under permanent (perennial) cover under the 10% livestock redistribution scenarios examined in this paper.
Figure 3.
Areas in the livestock crop complex in each of four types of livestock in eastern and western Canada in 2001 grouped by three general land use classes.
Figure 3.
Areas in the livestock crop complex in each of four types of livestock in eastern and western Canada in 2001 grouped by three general land use classes.
3.1.2. Impacts of Beef to Pork Redistribution on Crop Lands and GHG Emissions
In
Table 1, the pork inflation factor is closer to 100% than the beef deflation factor (90%) in the east because the total supply of pork protein is much greater than the total supply of protein from beef in that region. The opposite is true in the west because the total supply of beef protein is higher than the total pork protein supply in that region. The post-redistribution areas in
Table 2 reflect the percentages shown in
Table 1, whereby the proportional increase in land resources allocated to pork production is smaller than the proportional decrease in areas supporting beef in the east, but is larger in the west. As expected, the new areas to produce feed grains for the expanded hog population exceeded the reduction in areas that had produced feed grains and silage corn for beef in both regions.
Table 2 also shows that silage corn was the dominant annual crop for beef feed in the east, but was not important in the west. Even though there is 3.4 times as much land in these two industries in the west (
Table 2), the total protein supplied by beef and pork from the west only exceeds the east by 80% (
Table 1).
Table 2.
Crop areas that support the beef and pork industries before and after redistribution of land from beef to pork production.
Table 2.
Crop areas that support the beef and pork industries before and after redistribution of land from beef to pork production.
| | | Beef | | Hogs |
| | Feed grain | Silage corn | Harvested perennials | Feed grain |
| | | Before redistribution (ha.103) | |
| East | 117 | 98 | 1,000 | 1,219 |
| West | 1,818 | 42 | 4,944 | 1,641 |
| Canada | 1,994 | 140 | 5,944 | 2,860 |
| | | After redistribution (ha.103) | |
| East | 159 | 88 | 900 | 1,247 |
| West | 1,636 | 38 | 4,449 | 1,932 |
| Canada | 1,795 | 126 | 5,350 | 3,179 |
The new area in annuals in
Table 3 (first column, ∆
cA) does not affect GHG emissions among the four scenarios because the emissions are already accounted for in the area of expanded pork. The areas in the second column, ∆
cA + ∆
rA, signify the initial reduction of the beef population, before reallocating ∆
cA back to the pork industry. The third column, ∆
rA, takes the areas required for the expanded pork production system shown in Column 1 into account. Column 3 is the result of the differences in areas in
Table 2 for changes in both livestock populations. Because of the stronger role of silage corn in the eastern beef diet, the encroachment into perennial forage land area for grain production for hogs (Column 2) was much lower in the east. The portions of ∆
rA that must be used to grow feed grain for the repopulated beef in the third and fourth scenarios are shown in the last two columns of
Table 3. The areas for growing additional feed grain are about a third higher for Scenario 3 compared to Scenario 4. These relatively small portions of ∆
rA reflect the lesser role of grains in the diet of the repopulated beef cattle.
Table 3.
Changes in area in the beef crop complex as a result of reducing beef production and expanding pork production, and after repopulating the residual forage area (∆rA) with beef cattle.
Table 3.
Changes in area in the beef crop complex as a result of reducing beef production and expanding pork production, and after repopulating the residual forage area (∆rA) with beef cattle.
| | New area in | Area remaining from | Annuals to support new beef |
|---|
| | annuals (∆cA) | harvested perennial forage | Mix of forage | Mainly |
|---|
| | beef to pork | Initial 1 | Residual 2 | and grain | grass-fed |
|---|
| Regions | ha,000 |
| East | 1.1 | 100.0 | 99.0 | 21.3 | 16.6 |
| West | 104.7 | 494.4 | 389.7 | 106.5 | 77.1 |
| Canada | 105.8 | 594.4 | 488.6 | 129.1 | 93.4 |
The GHG emission budgets for beef and pork production prior to the four scenarios are presented in
Table 4. The first group of four rows illustrates the basic livestock-specific GHG simulations generated by ULICEES. The western beef industry is by far the largest source of GHG emissions, and methane from western beef is the largest term in the combined GHG budget of these two industries. There was much less east-west difference in emissions in the pork industry, but both were lower than the eastern beef industry emissions. Fossil CO
2 was the lowest GHG emission from both industries while CH
4 was the highest. The second and third groups of two rows represent GHG deducted from beef and added to pork production, respectively. The remaining data in
Table 4 show the net potential savings or reductions in annual GHG emissions as a result of the beef to pork redistribution. The values in the fourth column and the last two rows represent the GHG emission changes from the redistribution from eastern and western Canada, respectively, prior to the scenario assessment. The first three quantities in the last two lines show that the beef to pork redistribution resulted in lower annual emissions for all three GHGs, but especially for methane because of the ruminant digestion of forage by cattle.
Table 4.
Comparison of the annual GHG emission budgets of the 2001 Canadian beef and pork industries before and after land redistribution due to increased pork production.
Table 4.
Comparison of the annual GHG emission budgets of the 2001 Canadian beef and pork industries before and after land redistribution due to increased pork production.
| | TgCO2e |
|---|
| Farm type | Region | CH4 | N2O | CO2 | GHGs |
|---|
| | Baseline annual GHG emissions prior to land redistribution |
| Beef | East | 2.64 | 2.06 | 0.49 | 5.19 |
| | West | 14.71 | 8.32 | 2.78 | 25.81 |
| Pork | East | 1.62 | 1.44 | 0.92 | 3.99 |
| | West | 1.46 | 0.77 | 0.83 | 3.06 |
| | Deducted GHG emissions resulting from reduced beef production |
| Beef | East | 0.26 | 0.21 | 0.05 | 0.52 |
| | West | 1.47 | 0.83 | 0.28 | 2.58 |
| | Additional GHG emissions resulting from increased pork production |
| Pork | East | 0.04 | 0.03 | 0.02 | 0.09 |
| | West | 0.26 | 0.14 | 0.15 | 0.54 |
| | Net annual GHG emissions deducted from land redistribution |
| | East | 0.23 | 0.17 | 0.03 | 0.43 |
| | West | 1.21 | 0.69 | 0.13 | 2.04 |
Table 5.
Annual GHG emissions from the residual forage area (∆rA) under four land use scenarios 1 in eastern and western Canada in 2001.
Table 5.
Annual GHG emissions from the residual forage area (∆rA) under four land use scenarios 1 in eastern and western Canada in 2001.
| Scenario # | 1 | 2 | 3 | 4 |
|---|
| | TgCO2e |
| East | 0.00 | 0.19 | 0.40 | 0.50 |
| West | 0.00 | 0.29 | 1.48 | 1.81 |
| Canada | 0.00 | 0.48 | 1.88 | 2.31 |
The estimated annual GHG emissions from ∆
rA under the four scenarios are shown in
Table 5. These GHG emissions were subtracted from the GHG reductions in
Table 4 to estimate the net changes in GHG emissions under each scenario. Due to enteric methane, the highest GHG emissions resulted from Scenario 4, followed by Scenario 3. The fertilizer N
2O and fossil CO
2 from farm field operations under Scenario 2 resulted in lower annual GHG emissions than from Scenarios 3 and 4. There were no GHG emissions from ∆
rA under Scenario 1 since ∆
rA is supposed to remain under perennial forage.
The expected 40 year losses in soil carbon [
40] as a result of the four scenarios are shown
Table 6 (rows 1 to 3). The net changes in annual GHG emissions associated with each of the four scenarios are then presented (rows 4 to 6). In Scenario 1, the net annual reduction in GHG emissions from
Table 4 were compared to the changes in soil carbon under ∆
cA. For Scenarios 2, 3 and 4, the annual GHG emission changes had to be compared to changes in soil carbon under both ∆
cA and ∆
rA. The payback periods in years required for reductions in annual GHG emissions to equal the 40 year cumulative losses in the soil carbon stock were determined from the ratios of the 40 year soil carbon losses (rows 1 to 3) to the respective decreases in annual GHG emissions (rows 4 to 6).
Table 6.
Changes in soil carbon and annual GHG emissions due to beef to pork redistribution, and payback periods required for decreased GHG to compensate soil carbon losses, under four scenarios 1 for using residual land 2 in 2001.
Table 6.
Changes in soil carbon and annual GHG emissions due to beef to pork redistribution, and payback periods required for decreased GHG to compensate soil carbon losses, under four scenarios 1 for using residual land 2 in 2001.
| Scenario # | 1 | 2 | 3 | 4 |
|---|
| | Soil carbon loss over 40 years (Tg CO2e) |
| East | 0.10 | 9.57 | 2.12 | 1.67 |
| West | 7.67 | 54.48 | 15.48 | 13.32 |
| Canada | 7.77 | 64.06 | 17.60 | 14.99 |
| | Decrease 3 in annual GHG emissions (Tg CO2e) |
| East | 0.43 | 0.24 | 0.02 | −0.08 |
| West | 2.04 | 1.75 | 0.56 | 0.23 |
| Canada | 2.46 | 2.02 | 0.59 | 0.15 |
| | | Payback period (years) | |
| East | 0.2 | 40.1 | 92.7 | - |
| West | 3.8 | 31.2 | 27.6 | 57 |
| Canada | 3.2 | 31.9 | 29.9 | 96.9 |
The largest loss of soil carbon came from reseeding all of ∆
rA to annual crops (Scenario 2,
Table 6). The lowest loss in soil carbon results from leaving all of the residual land under perennial ground cover without repopulating ∆
rA with beef cattle (Scenario 1). Repopulating ∆
rA with just a category of beef that is highly forage dependent (Scenario 4) resulted in slightly less soil carbon loss than from repopulating ∆
rA with beef cattle fed a mix of forage and grain (Scenario 3) in both eastern and western Canada. The net annual GHG emission reductions for Scenarios 3 and 4 are appreciably lower than the net annual emission reductions in Scenarios 1 and 2. The negative result for the eastern emission quantity for Scenario 4 indicates a net increase in annual GHG emissions. Because this scenario resulted in a loss of GHG mitigation potential in the east, there was no need to relate this annual loss to the loss of soil carbon.
Due to high methane emissions, payback periods were the highest for Scenario 4, even though the predominantly forage based cattle produced the second lowest decrease in soil carbon. The payback period for reseeding all residual perennial forage to annual crops (Scenario 2) was 13% longer than the mixed forage and grain fed beef herd (Scenario 3) in western Canada, but was only 40% as long as in the east. Due to the increase in annual GHG emissions in the east under Scenario 4, no payback period was shown for this case. For Scenario 3 in the east, the payback period was 2.3 times the 40 year benchmark period. In western Canada, the two ratios of payback to benchmark periods were 0.7 and 1.4 for Scenarios 3 and 4, respectively. For Scenario 2, the payback to benchmark period ratios were 1.0 and 0.8 for eastern and western Canada, respectively. For Scenario 1, the ratios were less than 0.1 for both eastern and western Canada. The very short payback periods for Scenario 1 were the result of the lowest change in soil carbon of any of the four Scenarios, as well as the unreduced GHG savings from the basic beef to pork redistribution.


 ,
, 


