Article

Correlation of Geotechnical and Mineralogical Properties of Lithomargic Clays in Uttara Kannada Region of South India

by
Deepak Nayak
,
Purushotham G. Sarvade
*,
H. N. Udayashankar
,
Balakrishna S. Maddodi
and
M. Prasanna Kumar
Department of Civil Engineering, Manipal Institute of Technology, Manipal Academy of Higher Education, Udupi District, Manipal 576104, Karnataka, India
*
Author to whom correspondence should be addressed.
Geosciences 2024, 14(4), 92; https://doi.org/10.3390/geosciences14040092
Submission received: 7 February 2024 / Revised: 11 March 2024 / Accepted: 14 March 2024 / Published: 23 March 2024
(This article belongs to the Special Issue Soil-Structure Interactions in Underground Construction)

Abstract

:
The present study explores the intricate relationship between the geotechnical and mineralogical properties of lithomargic clays in the Uttara Kannada region of south India. Lithomargic clays, characterized by their unique composition of clay minerals and calcareous content, play a crucial role in the geotechnical behavior of soils. The study aims to provide a comprehensive understanding of the interplay between the mineralogical composition and engineering characteristics of lithomargic clays, shedding light on their suitability for various construction and infrastructure projects. The research methodology involves a systematic analysis of lithomargic clay samples collected from different locations in the Uttara Kannada region. Geotechnical investigations, including particle size distribution, Atterberg limits, unconfined compressive strength (UCS), California bearing ratio (CBR) and triaxial tests, are conducted to assess the engineering properties of the clays. Concurrently, mineralogical analyses, such as X-ray diffraction (XRD) and scanning electron microscopy (SEM), are employed to identify and quantify the clay mineral constituents within the samples. The findings of this study reveal correlations between specific mineralogical features and geotechnical behaviors of lithomargic clays. Understanding these relationships is crucial for predicting the response of these clays to different engineering applications, including slope stability, foundation design and embankment construction. The research contributes valuable insights to the scientific and engineering communities, aiding in the informed utilization of lithomargic clays in geotechnical projects in the Uttara Kannada region and beyond. The outcomes of this investigation, such as the correlation of geotechnical properties with the variation in minerals in various sample locations, enhance our understanding of the complex nature of lithomargic clays, providing a foundation for more sustainable and effective engineering practices in the geologically diverse landscapes of south India.

1. Introduction

The Uttara Kannada region of south India is renowned for its unique lithomargic clays (locally known as shedi soil), attracting significant attention from geotechnical and geological researchers due to their distinctive mineralogical and geotechnical characteristics. Lithomargic clays with dispersive properties are prone to erosion, and they are mostly found along south India’s western coast. Our forebears dismissed lithomargic clay due to its perceived issues, including high silt content and diminished shear strength upon contact with water. This soil type is prone to erosion and landslides. Presently, the coastal region of the Uttara Kannada district is experiencing substantial growth, encompassing industrial expansion, infrastructure initiatives and numerous other undertakings. Transforming lithomargic clay into a suitable foundation for diverse engineering structures, such as buildings, pavements, railways and dams, presents a considerable challenge, necessitating a thorough examination. Lithomargic clays, formed through the weathering of mafic rocks, have gained prominence in recent years as potential materials for various engineering applications. Lithomargic clays are deposited below lateritic formations at shallow depths, packed in between the parent granitic gneiss beneath and the hard lateritic crust [1]. This article aims to provide a comprehensive review of the correlation between geotechnical and mineralogical properties of lithomargic clays in the Uttara Kannada region, shedding light on their potential utilization in construction, geotechnical engineering and other relevant fields. The primary minerals found in the lithomargic clays of the Udupi regions were quartz and feldspar, including orthoclase and muscovite. The secondary minerals, which resulted from the breakdown and chemical modification of the primary minerals, included high concentrations of sheet minerals, such as kaolinite, halloysite, dickite, gibbsite and illite. The investigation also revealed the existence of iron compounds, including siderite, goethite and fayalite. Oxygen, aluminum, silicon, potassium and iron comprised most of the elements found, indicating the presence of the compounds found via XRD analysis [2]. A correlation study conducted by Bhagyashree et al. [3] on lateritic soil overlying lithomargic clay layer showed that the liquid limit decreases with quartz, magnetite and hematite, whereas the plastic limit increases with corundum and anatase, remains constant with quartz and decreases with magnetite and hematite. The coefficient of permeability decreases with anatase and magnetite content. Lakkimsetti and Nayak [4] investigated the performance of lithomargic clay through mineralogical analysis and observed that chemical stabilization using calcium chloride (CaCl2) and an industrial by-product obtained from the iron industry, i.e., granulated blast furnace slag (GBFS), significantly increased the unconfined compressive strength of lithomargic clay through the development of compounds such as calcium-silicate-hydrate (CSH), calcium-alumina-hydrate (CAH), calcium-aluminate-silicate-hydrate (CASH) in the stabilized soil mixtures and helped in bonding the soil grains to form a stiff and strong soil matrix. Such revelations provide a nuanced understanding of the intricate connection between mineralogy and engineering properties. Amulya et al. [5] found that the unconfined compressive strength (UCS) and the California bearing ratio (CBR) increased when 30% of GGBS replaced by weight of soil and 30% of fly ash replaced by dry weight of soil were added, respectively. As we synthesize these diverse findings, our aim is to contribute meaningfully to the understanding of the correlation between geotechnical and mineralogical properties of lithomargic clays in the Uttara Kannada region. This comprehensive exploration not only deepens our scientific understanding but also provides valuable insights for future research endeavors and engineering applications in areas rich in lithomargic clays.
In the western coastal regions of India, stretching from Trivandrum to Mumbai, lithomargic clay is commonly found at depths from one to three meters beneath the uppermost lateritic soil. This type of clay comprises a significant portion of the silt deposits [6]. Lithomargic clay presents challenges, as it allows water penetration, significantly reducing its strength in saturated conditions. The high silt content contributes to issues such as slope failures, differential settlements, foundation failures and embankment failures. The feldspar undergoes significant mineral changes during the weathering of granite or granitic gneiss, changing into montmorillonite, illite, kaolinite or halloysite, and finally bauxite [7]. Stabilizers, such as ground granulated blast furnace slag, can improve the strength characteristics of clays, which are lithomargic [8]. Thomas et al. [9] found that soils with lower plasticity indices are more prone to erosion than lithomargic clays with higher indices. Highway and foundation engineers face a number of difficulties when working with shedi soils, such as the loss of shear strength when wet, the elimination of confinement, erosion issues, landslides and problems with slope stability. Soft soils present foundation problems, such as low shear strength and increased settlement, making it challenging for civil engineers to design and construct structures on such problematic soils. The addition of coir fibers by 0.5% of dry weight of soil significantly improved the soil’s strength properties. Reinforced with randomly distributed untreated coir fibers, the cohesion of the soil rose roughly fivefold [10]. The addition of coir mats positioned at one-third and two-thirds height of a UCS sample along with coir mats coated in liquid cashew nut oil strengthened the clay [11]. Narloch et al. [12] studied the influence of soil mineral composition on the compressive strength of cement stabilized rammed earth (CSRE), discovering that both beidellite and montmorillonite significantly decreased the compressive strength of CSRE. Slightly higher compressive strength was achieved with kaolinite. Montmorillonite—one of the clay minerals with the highest adsorptive ability—may chemically adsorb potassium ions, which can result in the creation of illite; commonly, igneous and metamorphic rocks include them. The potash feldspar typically occurs as a microcline rather than an orthoclase [13]. The soaked CBR values for lithomargic clays along the coastal area of the Uttara Kannada district were found to be less than 5% [14]. The XRD analysis of lithomargic clay showed the presence of minerals such as gibbsite, kaolinite, biotite and muscovite [15]. Dickite and other kaolin minerals are formed as a result of feldspar and muscovite weathering. The differences in layer stacking atop one another yield different members of the kaolinite subgroup [16]. Like sodium (Na), potassium (K) can also cause clay soil to inflate and disperse. Exchangeable potassium (K) has been shown to have an impact on soil structural stability, which is either comparable to or smaller than that of sodium (Na) [17,18].

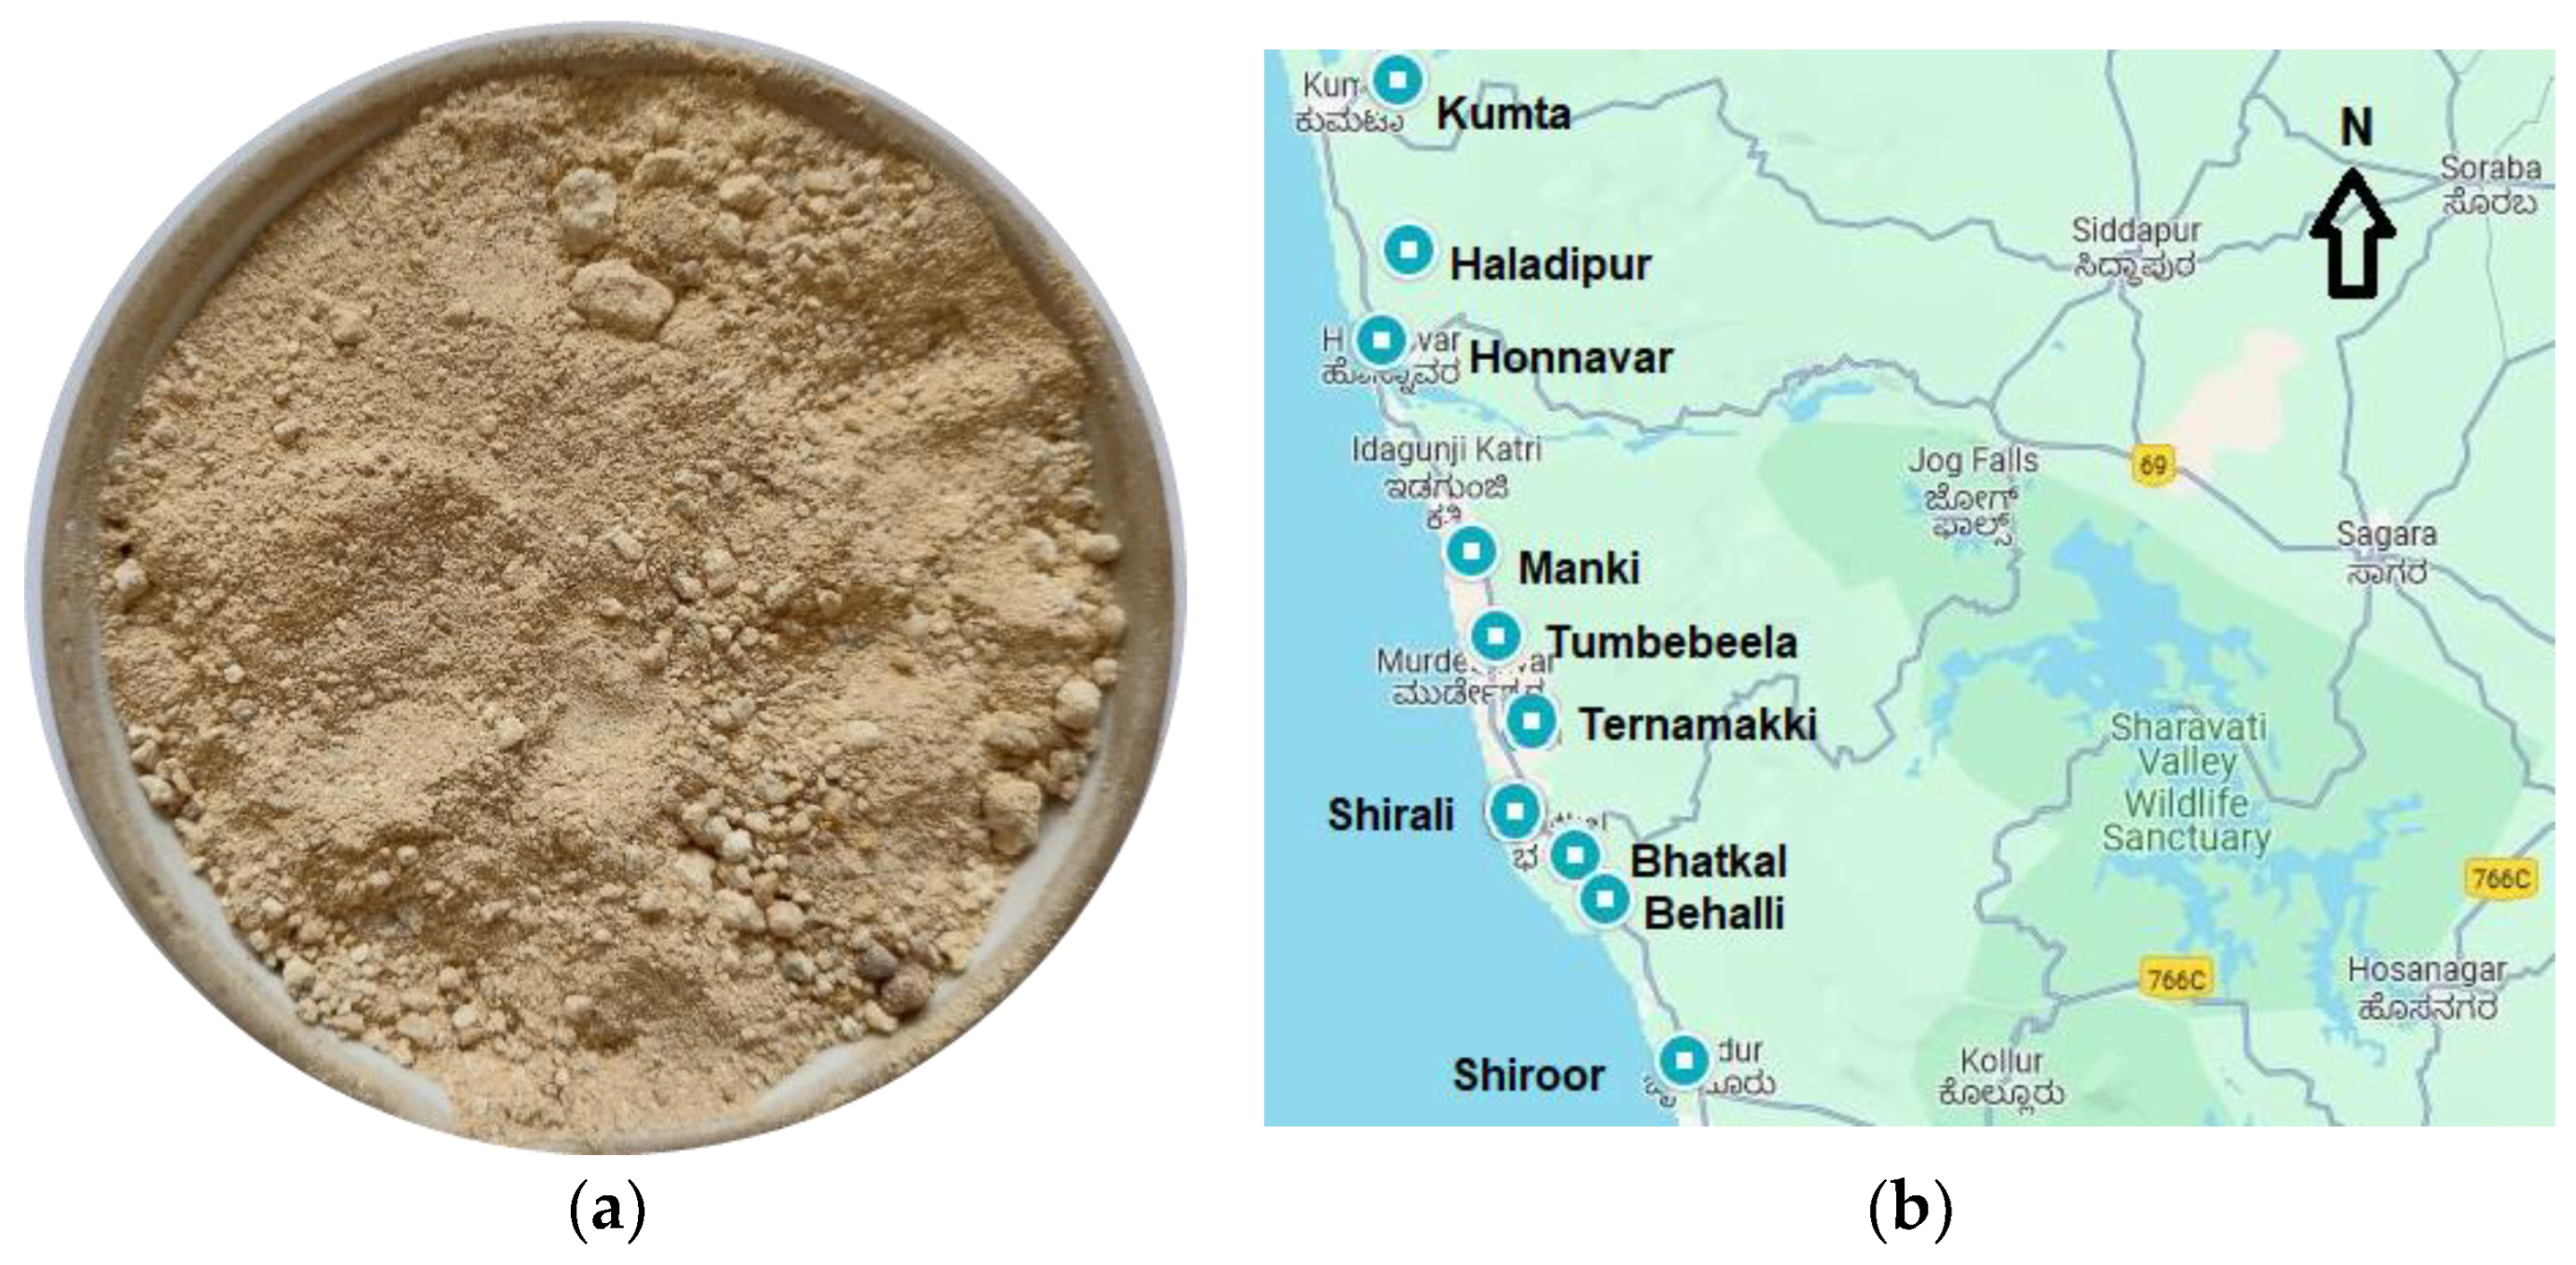
2. Materials and Methods

2.1. Geotechnical Characterization of Soil

Soil samples were collected from different locations along the coastal belt of the Uttara Kannada region to represent the full range of lithomargic clay properties. The sampling sites, illustrated in Figure 1b, included Shiroor, Behalli, Bhatkala, Shirali, Ternamakki, Tumbebeela, Manki, Honnavar, Haladipur and Kumta. The collection of undisturbed soil samples was carried out using the core cutter method in accordance with IS: 2720 (Part 29) 1975 [19,20,21,22,23]. For laboratory experiments on the soil to determine mineralogical and geotechnical properties, disturbed samples were gathered in bulk quantities and placed in plastic bags. Subsequently, the collected disturbed samples were pulverized, thoroughly mixed, air-dried and subjected to oven drying at 105 °C before being stored in plastic bags. Figure 1a shows the typical lithomargic clay sample from the Shiroor location.
To evaluate the various geotechnical properties of the soil, a range of geotechnical tests were performed, including specific gravity, Atterberg limits, particle size analysis, hydrometer analysis, standard and modified Proctor compaction tests, California bearing ratio tests, triaxial compression tests and unconfined compression tests. The geotechnical properties of the soil were ascertained by conducting all geotechnical tests in compliance with IS codes.

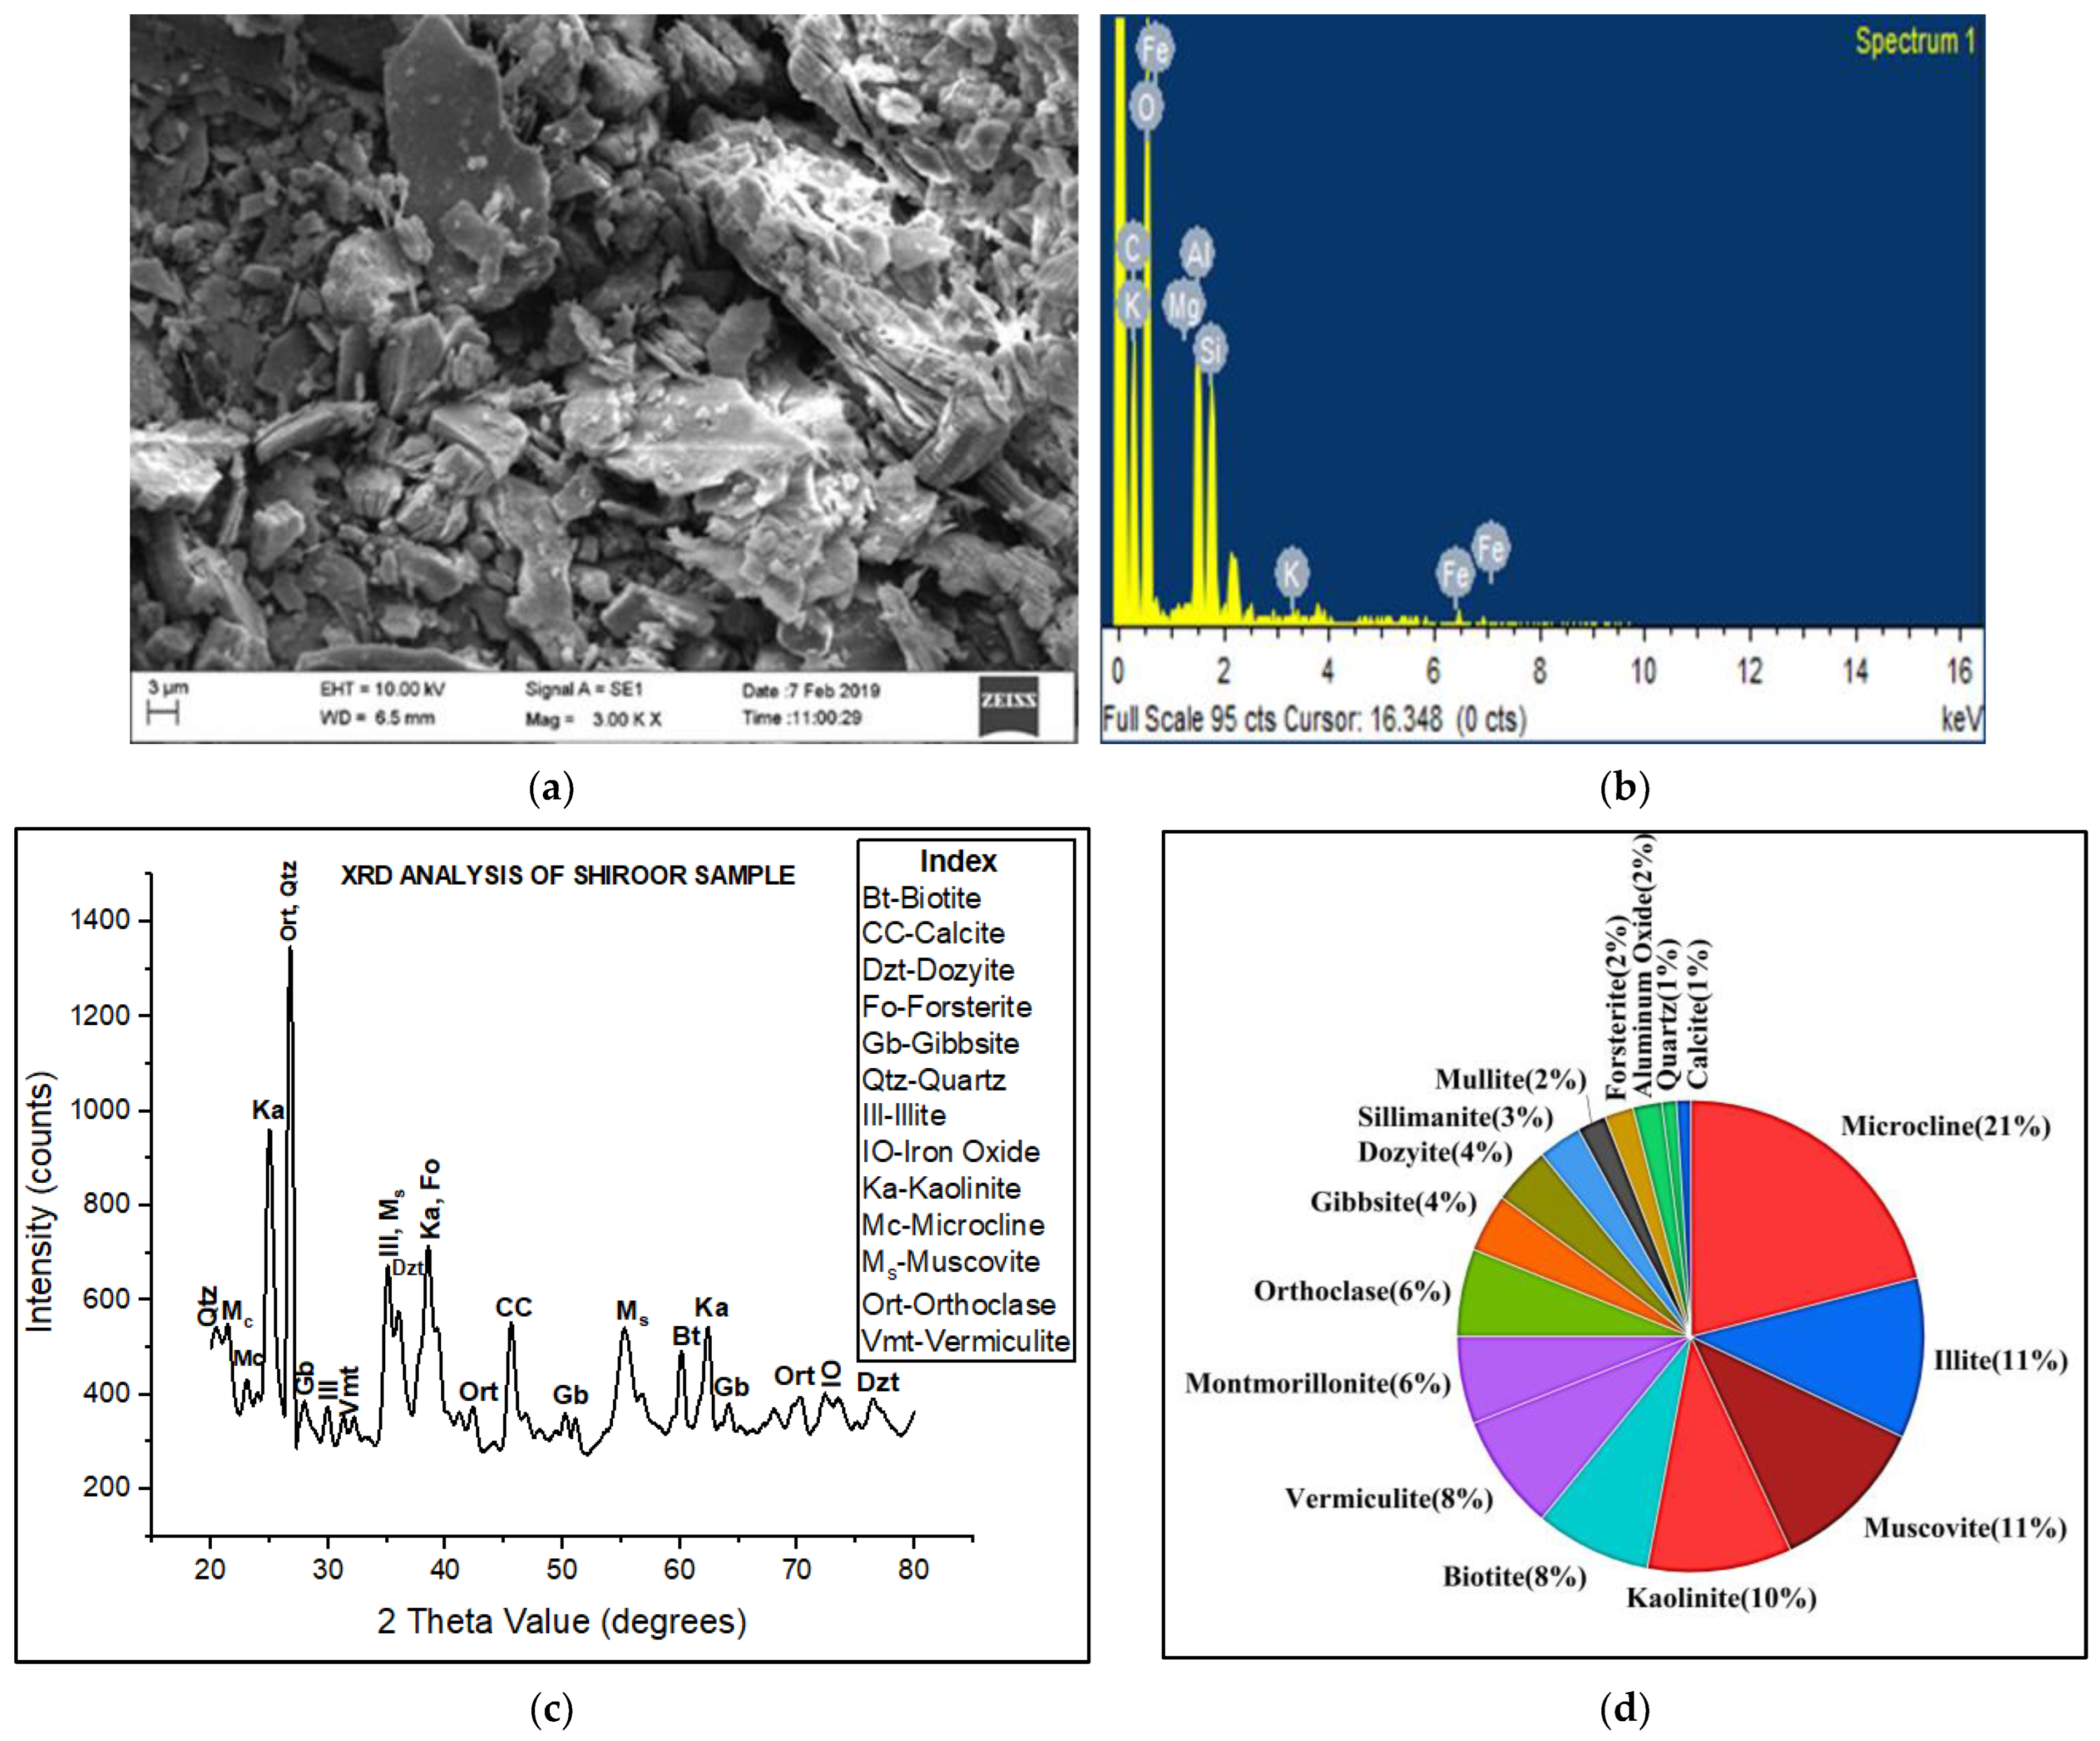
2.2. Mineralogical Characterization of Soil

The mineralogical analysis comprises scanning electron microscopy (SEM) and energy-dispersive X-ray spectroscopy (EDS), which are employed to ascertain the mineralogical composition. The outcomes obtained are then scrutinized to identify the elemental constituents within the soil.
The X-ray diffraction (XRD) analysis is performed using Cu-Kα radiation (k = 1.54 Å) at 40 kV, employing a Rigaku MiniFlex 600 X-ray diffractometer. This analysis is conducted to determine the minerals present in the soil samples.

2.3. Correlation Analysis

A Spearman correlation analysis is performed using the SPSS statistical analysis tool to identify the correlation between geotechnical and mineralogical properties of lithomargic soil. A non-parametric way to measure statistical dependency between two variables and evaluate their monotonic relationship is the Spearman correlation coefficient. In this case, a positive Spearman correlation implies that the other variable tends to increase along with the level of the first, whereas a negative Spearman correlation shows that the other variable tends to fall along with the level of the first.

3. Results and Discussion

3.1. Geotechnical Properties of Soil Samples

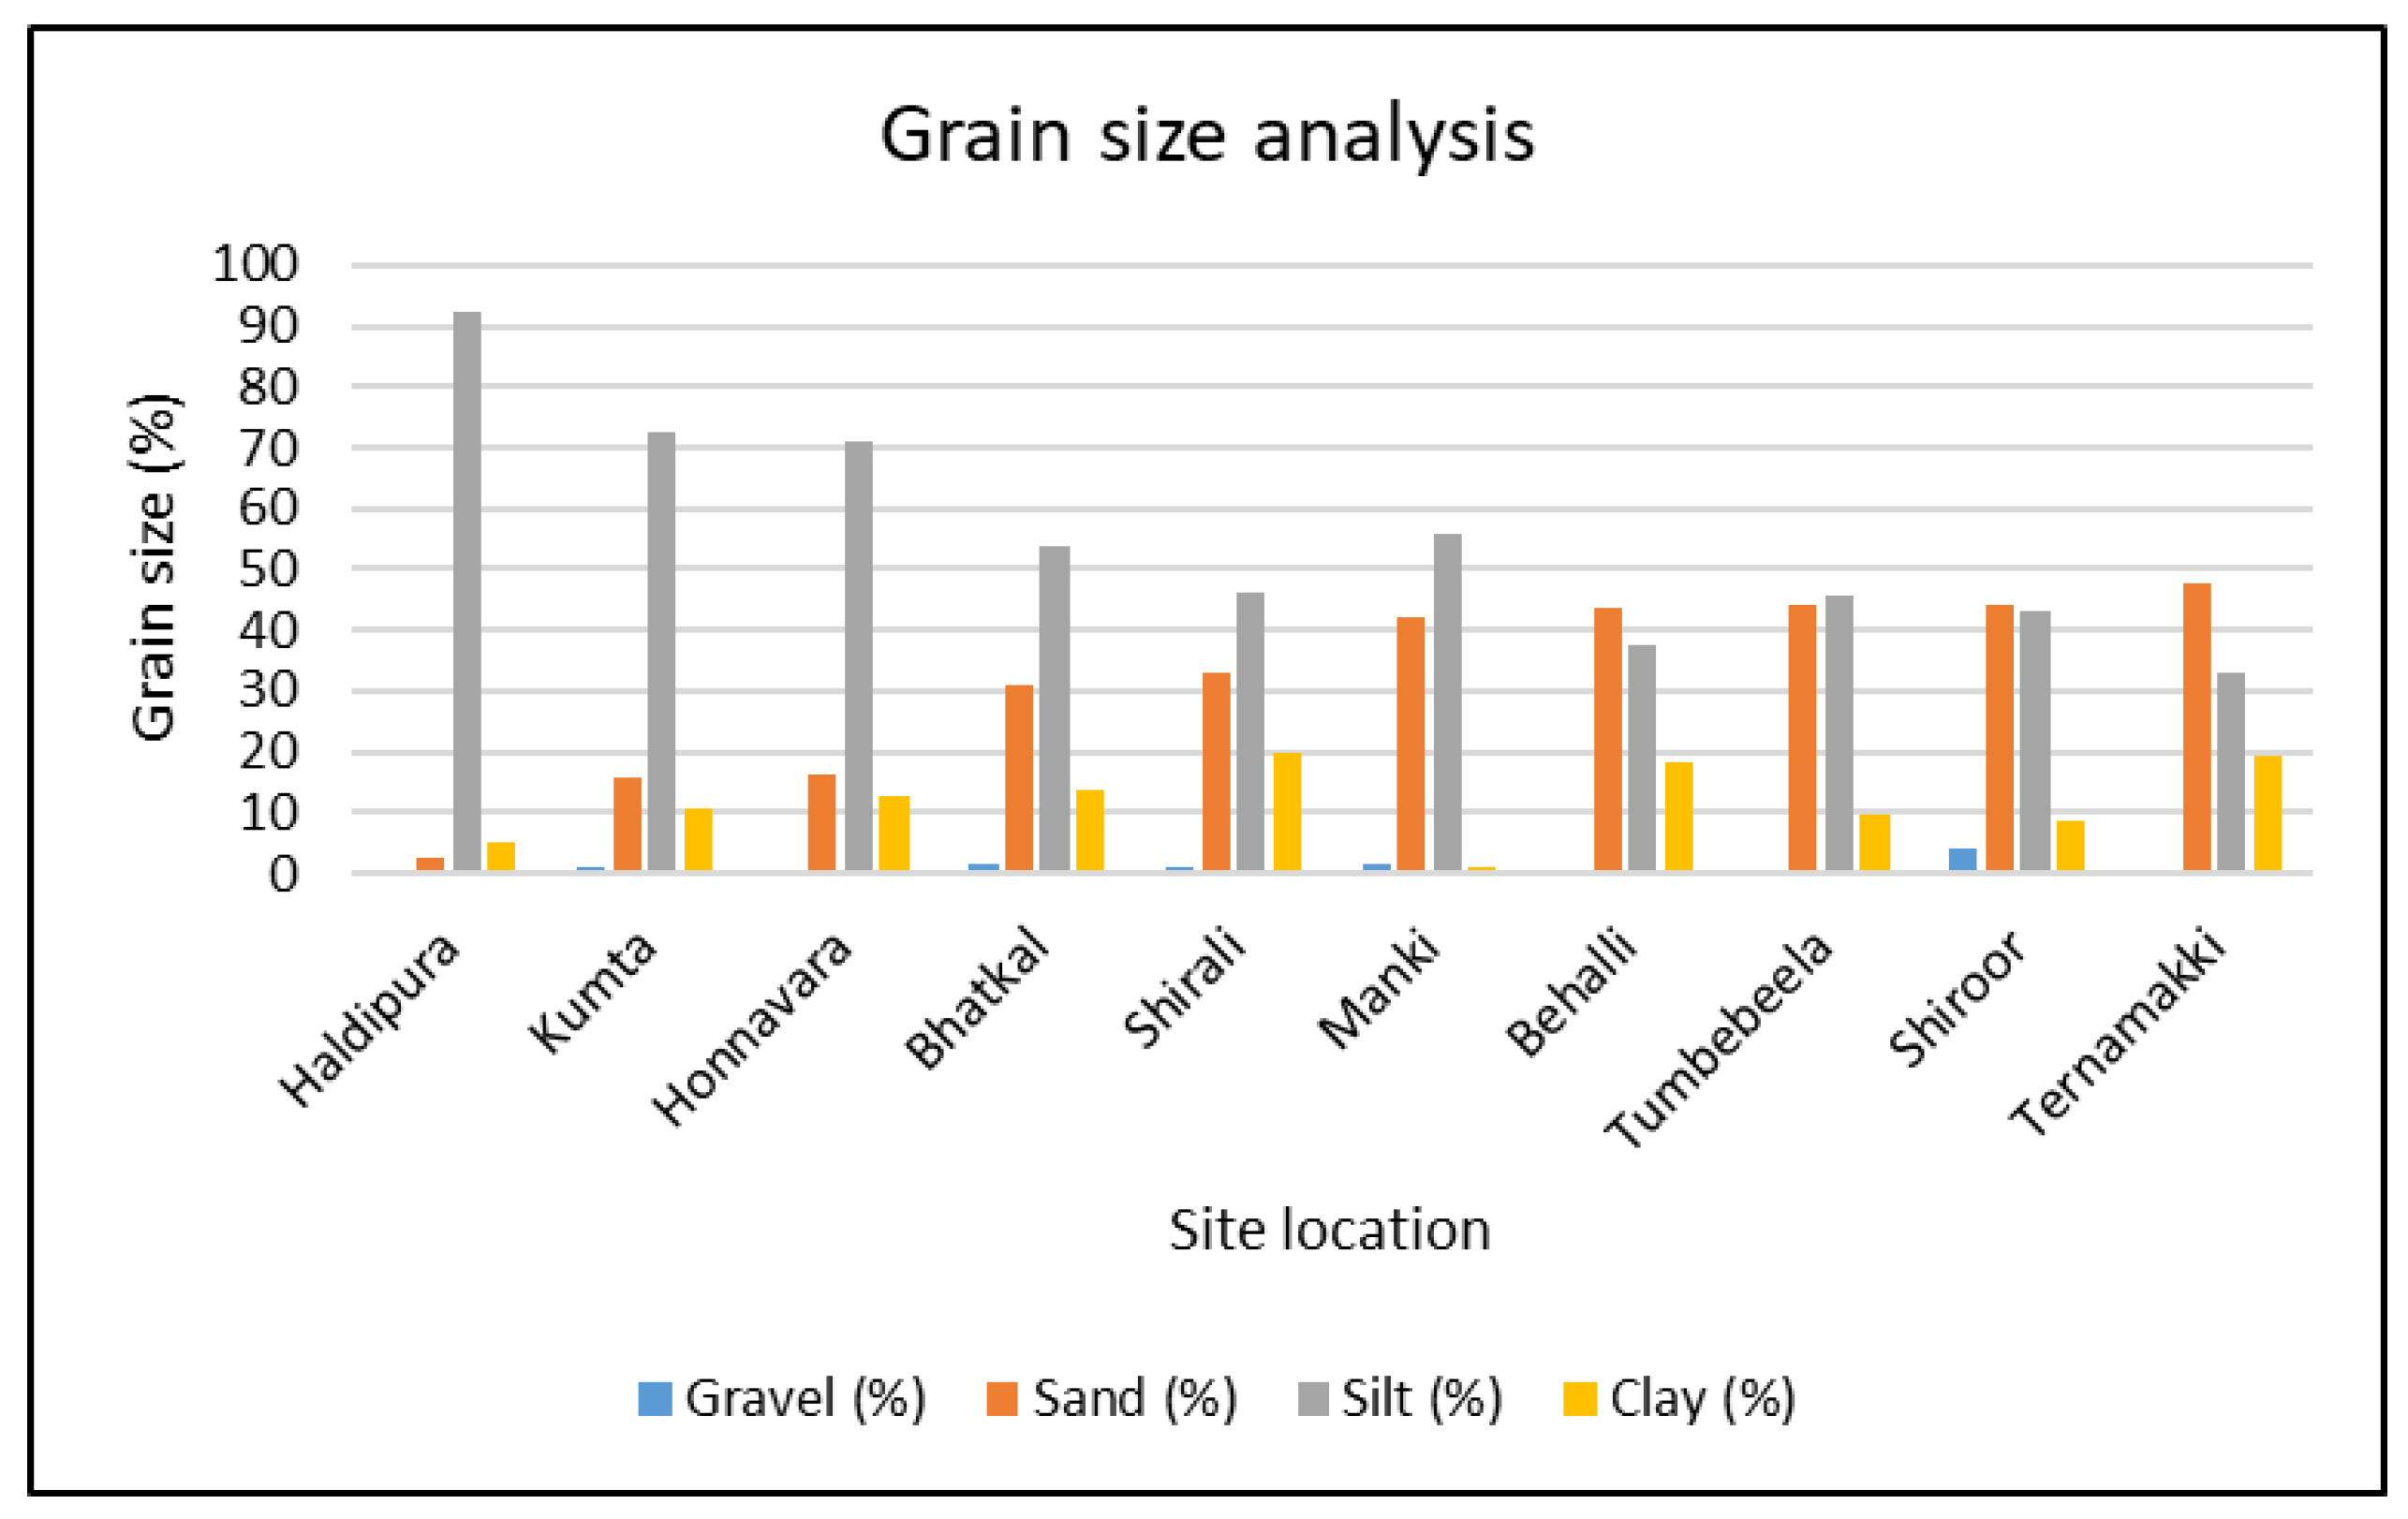
3.1.1. Index Properties

The basic geotechnical properties of various soil samples collected along the coast of the Uttara Kannada district are shown in Table 1. The specific gravity of the samples ranges from 2.34 to 2.59.
The dry unit weight of soil samples ranges from 14.03 kN/m3 to a maximum of 15.20 kN/m3, as shown in Table 1.
The sieve analysis results are combined with results of the hydrometer test and its variations for various soil samples, as shown in Figure 2.
Figure 2 provides the composition data for different locations based on gravel, sand, silt and clay percentages. Notably, Shiroor sample has the highest gravel content at 4.07%, with sand at 44.2%, silt at 42.94% and clay at 8.79%. Ternamakki exhibits the lowest gravel content (0.14%) but higher percentages of sand (47.73%) and clay (19.22%). Generally, locations such as Manki and Tumbebeela have substantial sand content, while Behalli and Shirali show higher proportions of silt and clay. Understanding these soil compositions is essential for various construction and engineering applications in each location. In Figure 2, a clear pattern of increasing sand content with decreasing silt content can be observed.

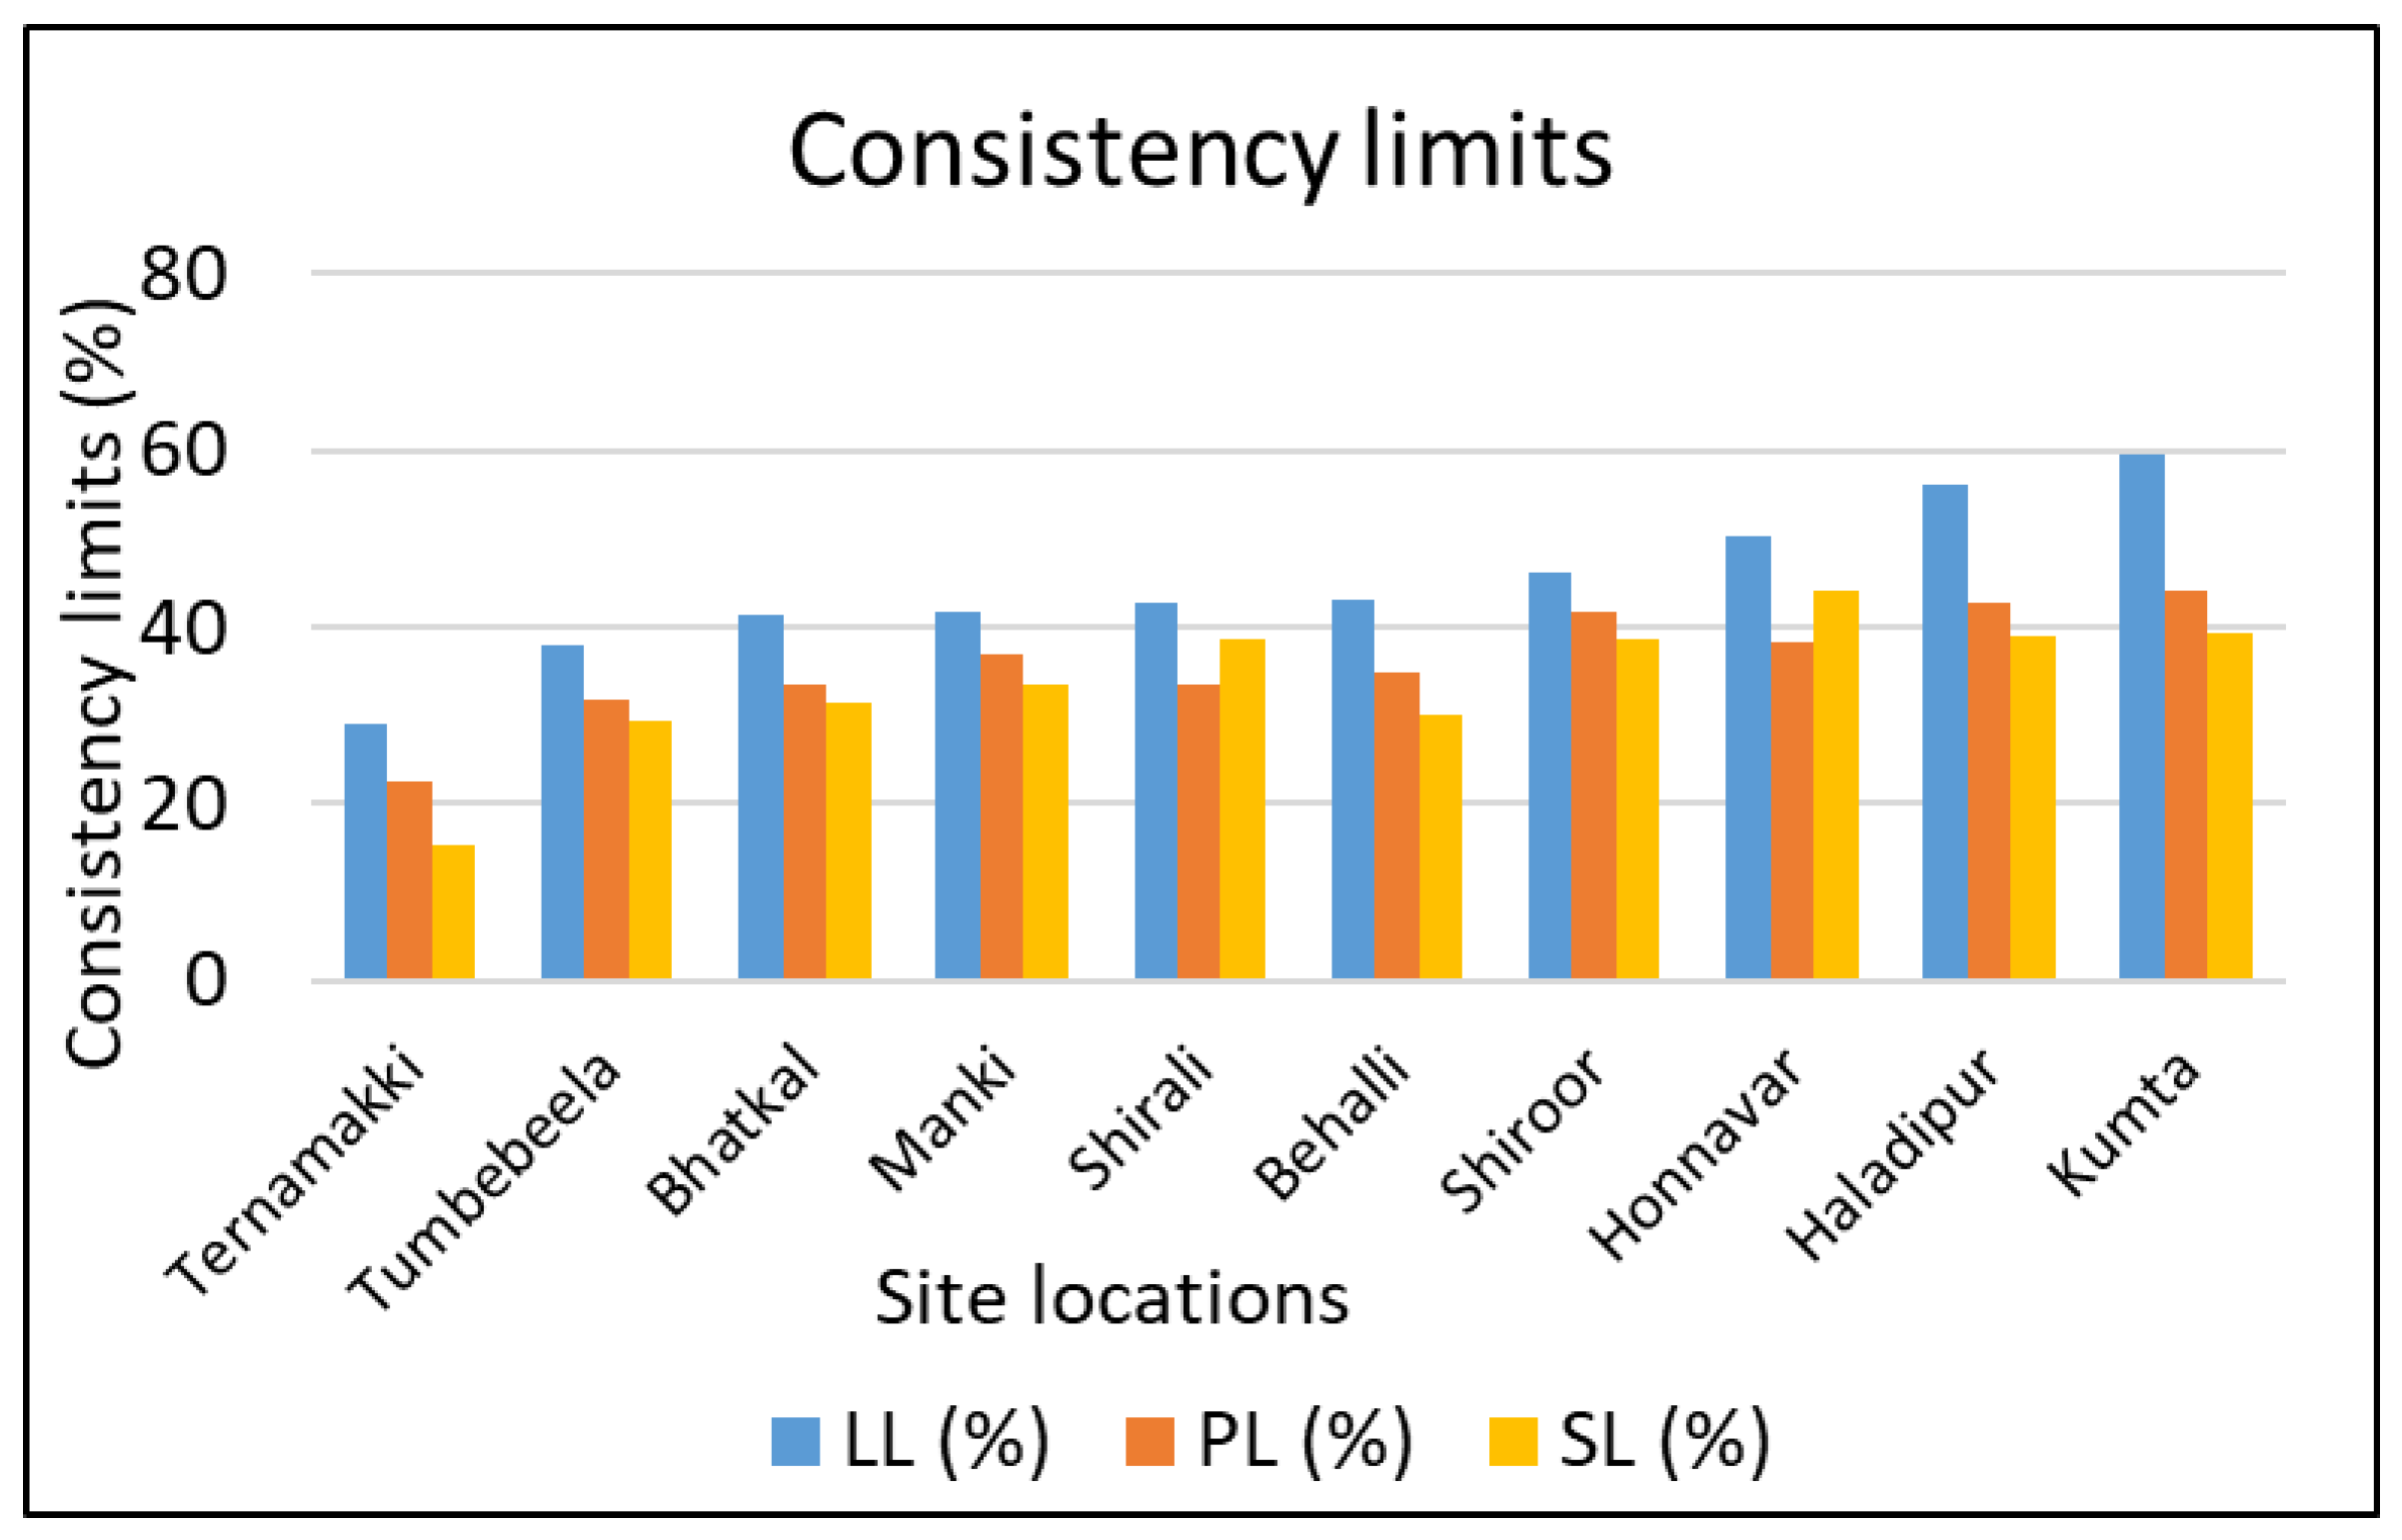
3.1.2. Consistency Limits of Soil Samples

The liquid limit test is conducted using the Casagrande apparatus. In Figure 3, it can be observed that Kumta has the highest liquid limit (LL) of 59.5%, indicating that a higher moisture content is needed to change its state from plastic to liquid. Ternamakki has the lowest LL (29.1%). Honnavar has the highest plastic limit (PL) of 38.43%, indicating the moisture content at which the soil transitions from plastic to semisolid. Ternamakki has the lowest PL (22.34%). Kumta has the highest plasticity index (PI) of 15.41%, reflecting its overall plasticity and susceptibility to changes in moisture. Ternamakki has the lowest PI (6.76%). Honnavar and Kumta share the highest shrinkage limit (SL) of 44.01% and 39.36%, respectively, indicating the point at which the soil no longer shrinks further upon drying. Ternamakki has the lowest SL of 15.39%. With the growing liquid limit, it is evident that the shrinkage limit, plasticity index and plastic limit are all trending upward. As per IS classification, soil samples from Bhatkal, Shirali, Manki, Tumbebeela, Shiroor and Shirali are categorized as MI, which denotes medium-plastic inorganic silts. The Ternamakki sample falls within the ML category, which denotes inorganic silts with little to no plasticity. Soil samples from Honnavar, Haladipur and Kumta are categorized as MH, which denotes high-compressibility inorganic silt. Minerals such as calcium carbonate (calcite), iron oxides or aluminum oxides are observed to be relatively higher in the Kumta, Haladipur and Honnavar samples, which can act as natural cementing agents. These agents may enhance cohesion and contribute to higher LL and PL values. The Honnavar sample has a relatively higher proportion of montmorillonite; the Haladipur sample has a higher content of illite and calcite; and the Kumta sample has relatively higher proportions of illite, montmorillonite and vermiculite. These minerals in silt and clay contribute to an increase in liquid limits and plastic limits.

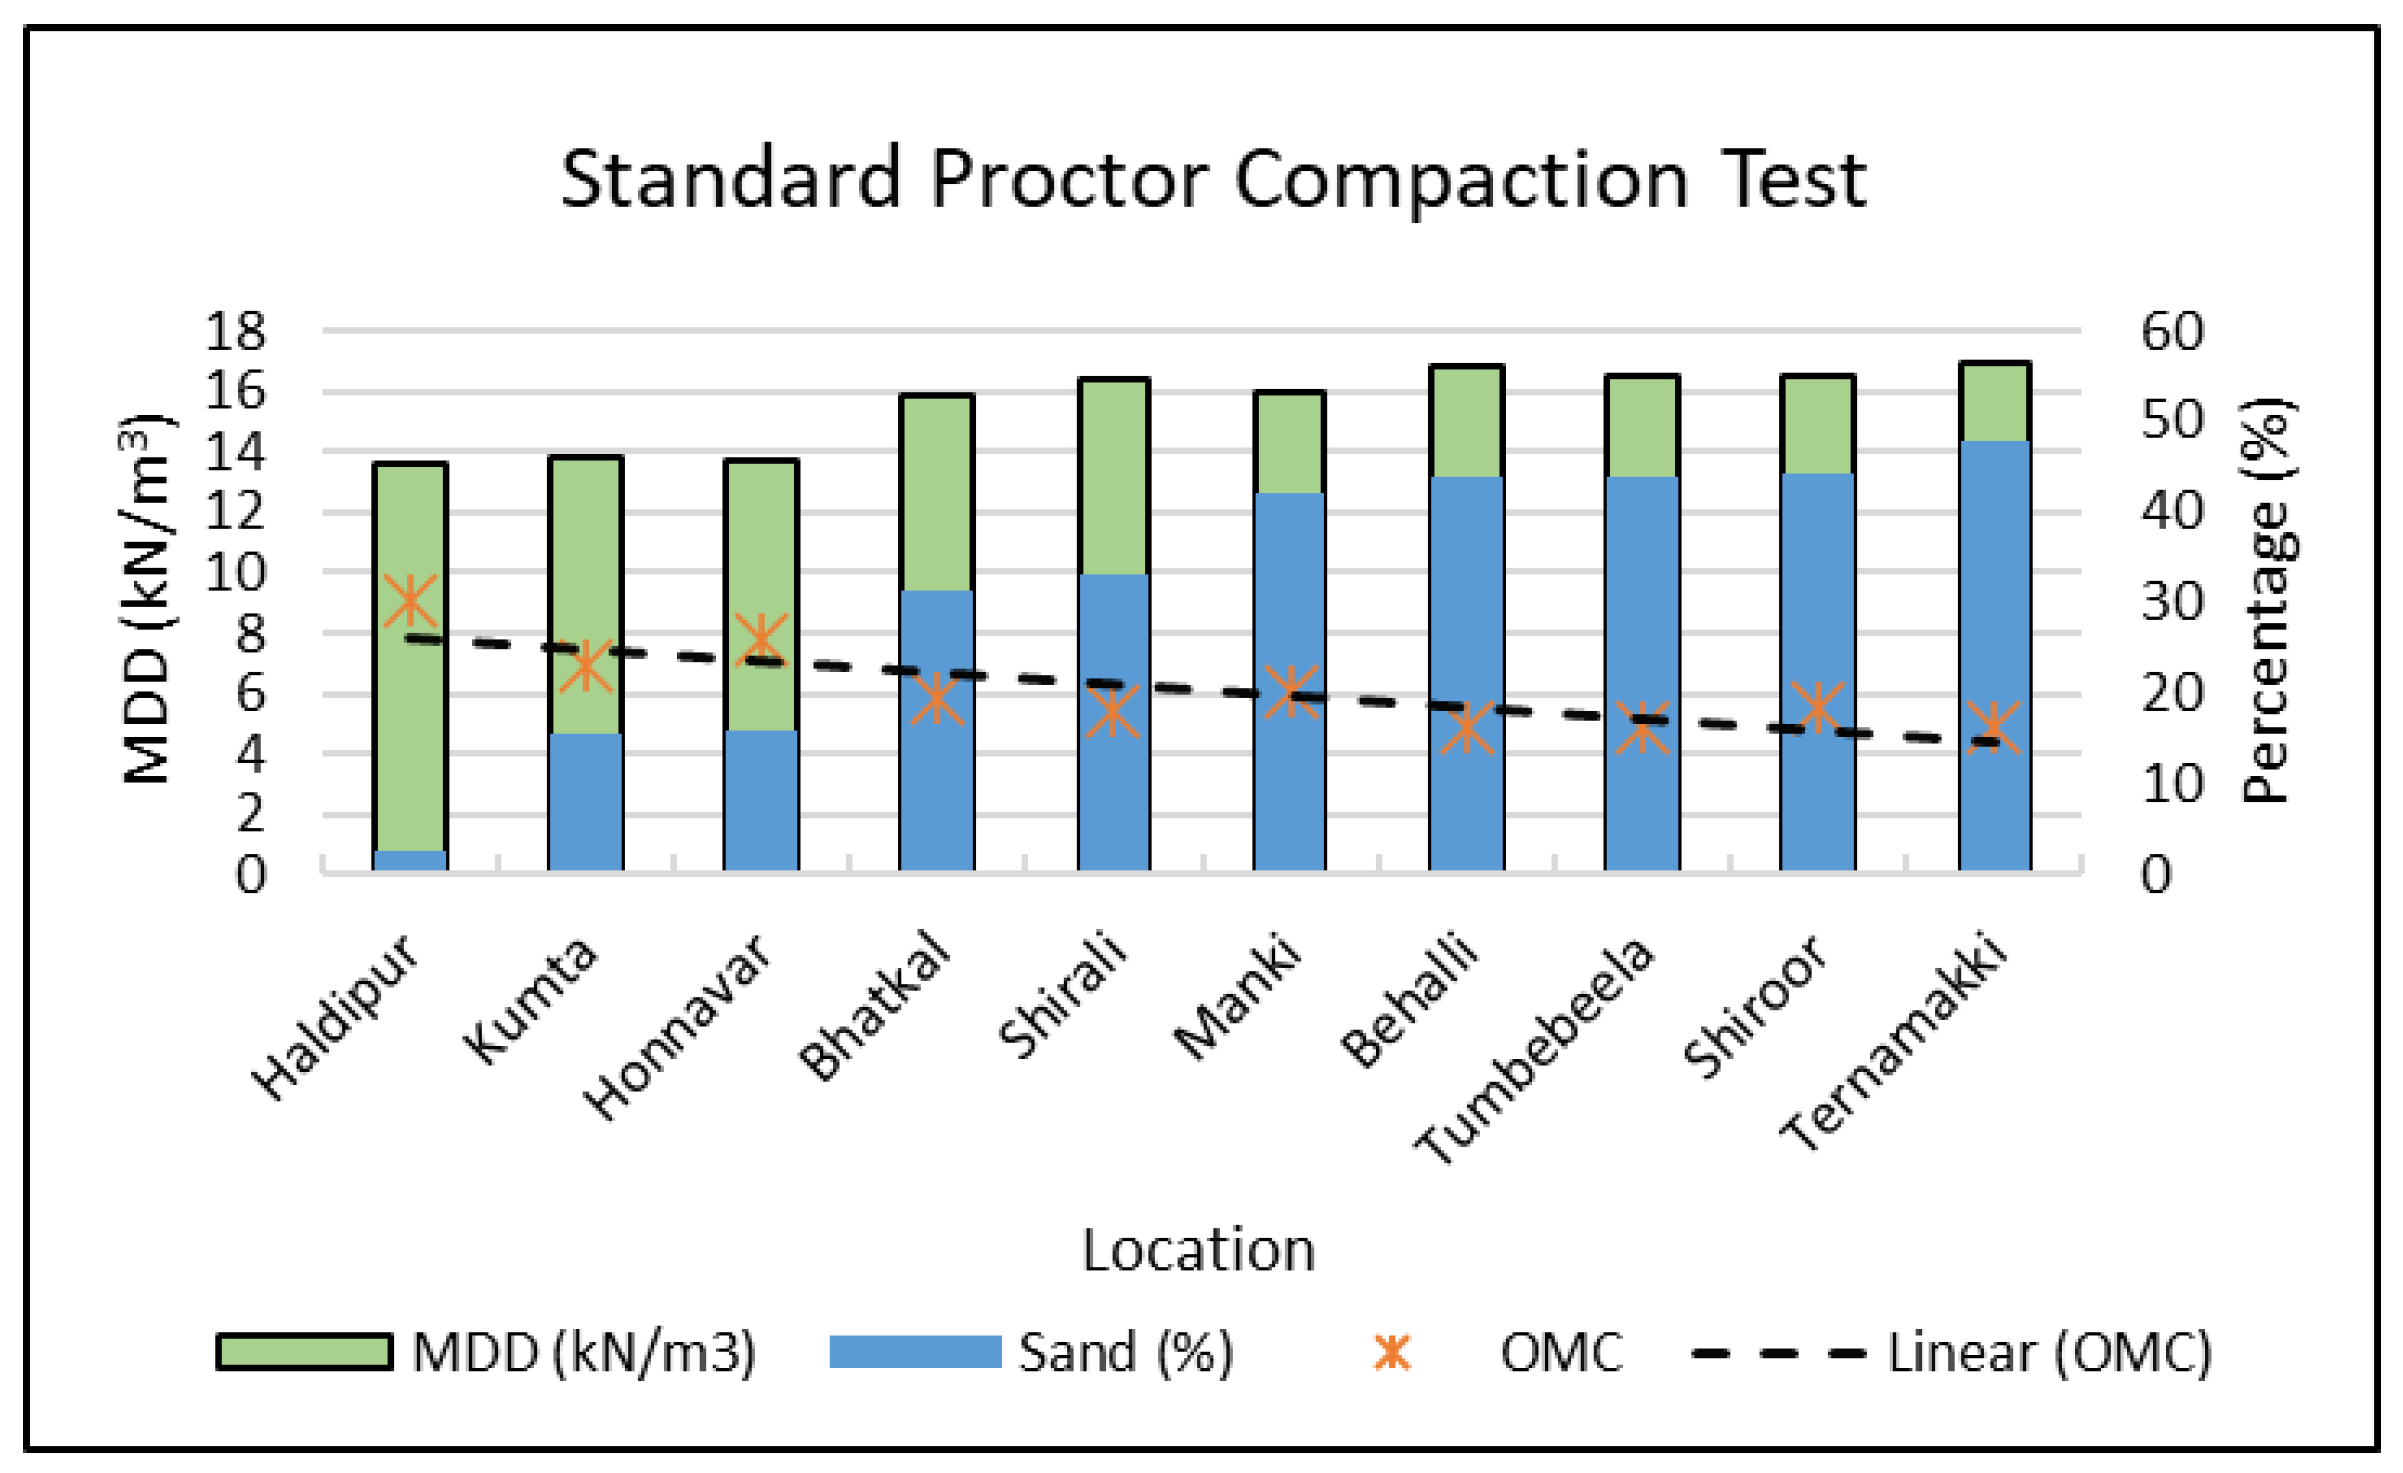
3.1.3. Standard Proctor Compaction Test

Maximum dry density (MDD) shows variability, with values ranging from 13.63 kN/m3 in Haldipura to 16.87 kN/m3 in Ternamakki, as shown in Figure 4. Locations such as Bhatkal, Shirali and Ternamakki have relatively higher MDD values. The value of optimum moisture content (OMC) is decreasing with the increase in MDD and also with the sand content.

3.1.4. Modified Proctor Compaction Test

An ascending trend is observed in the MDD values of the modified Proctor test with the increase in values of sand content, as shown in Figure 5. The sample from Haladipur showed a lower value of 15.59 kN/m3 with a sand content of 2.67%. The MDD value depicts an ascending trend in various locations with the rise in sand content. The Ternamakki sample depicts the highest MDD value of 18.44 kN/m3 with a sand content of 47.73%. The optimum moisture content decreases with an increase in the proportion of sand content, as shown in Figure 5.

3.1.5. Unconfined Compressive Strength Test (UCS)

In Figure 6, the UCS values also show variability, with the lowest value of 72.9 for Bhatkal and the highest value of 202.43 for Kumta. The higher UCS values for the Kumta and Haladipur samples may be due to those areas having relatively lower amounts of sand and higher amounts of silt and clay in the soil. Samples such as Tumbebeela and Shiroor have similar sand content, but their UCS values differ, suggesting that other factors also influence the compressive strength. Gibbsite and muscovite are minerals commonly associated with lower unconfined compressive strength (UCS) in the soils of Shiroor, Ternamakki and Tumbebeela. Gibbsite—an aluminum hydroxide mineral—contributes to lower UCS values due to its softness, low cohesion and high porosity. Similarly, muscovite—a phyllosilicate mineral with a platy structure—exhibits reduced cohesion, lower shear strength and looser particle arrangement, all contributing to soil’s diminished compressive strength [24]. It is important to note that the overall geotechnical behavior of soils is complex and influenced by a combination of minerals, their proportions and particle characteristics.

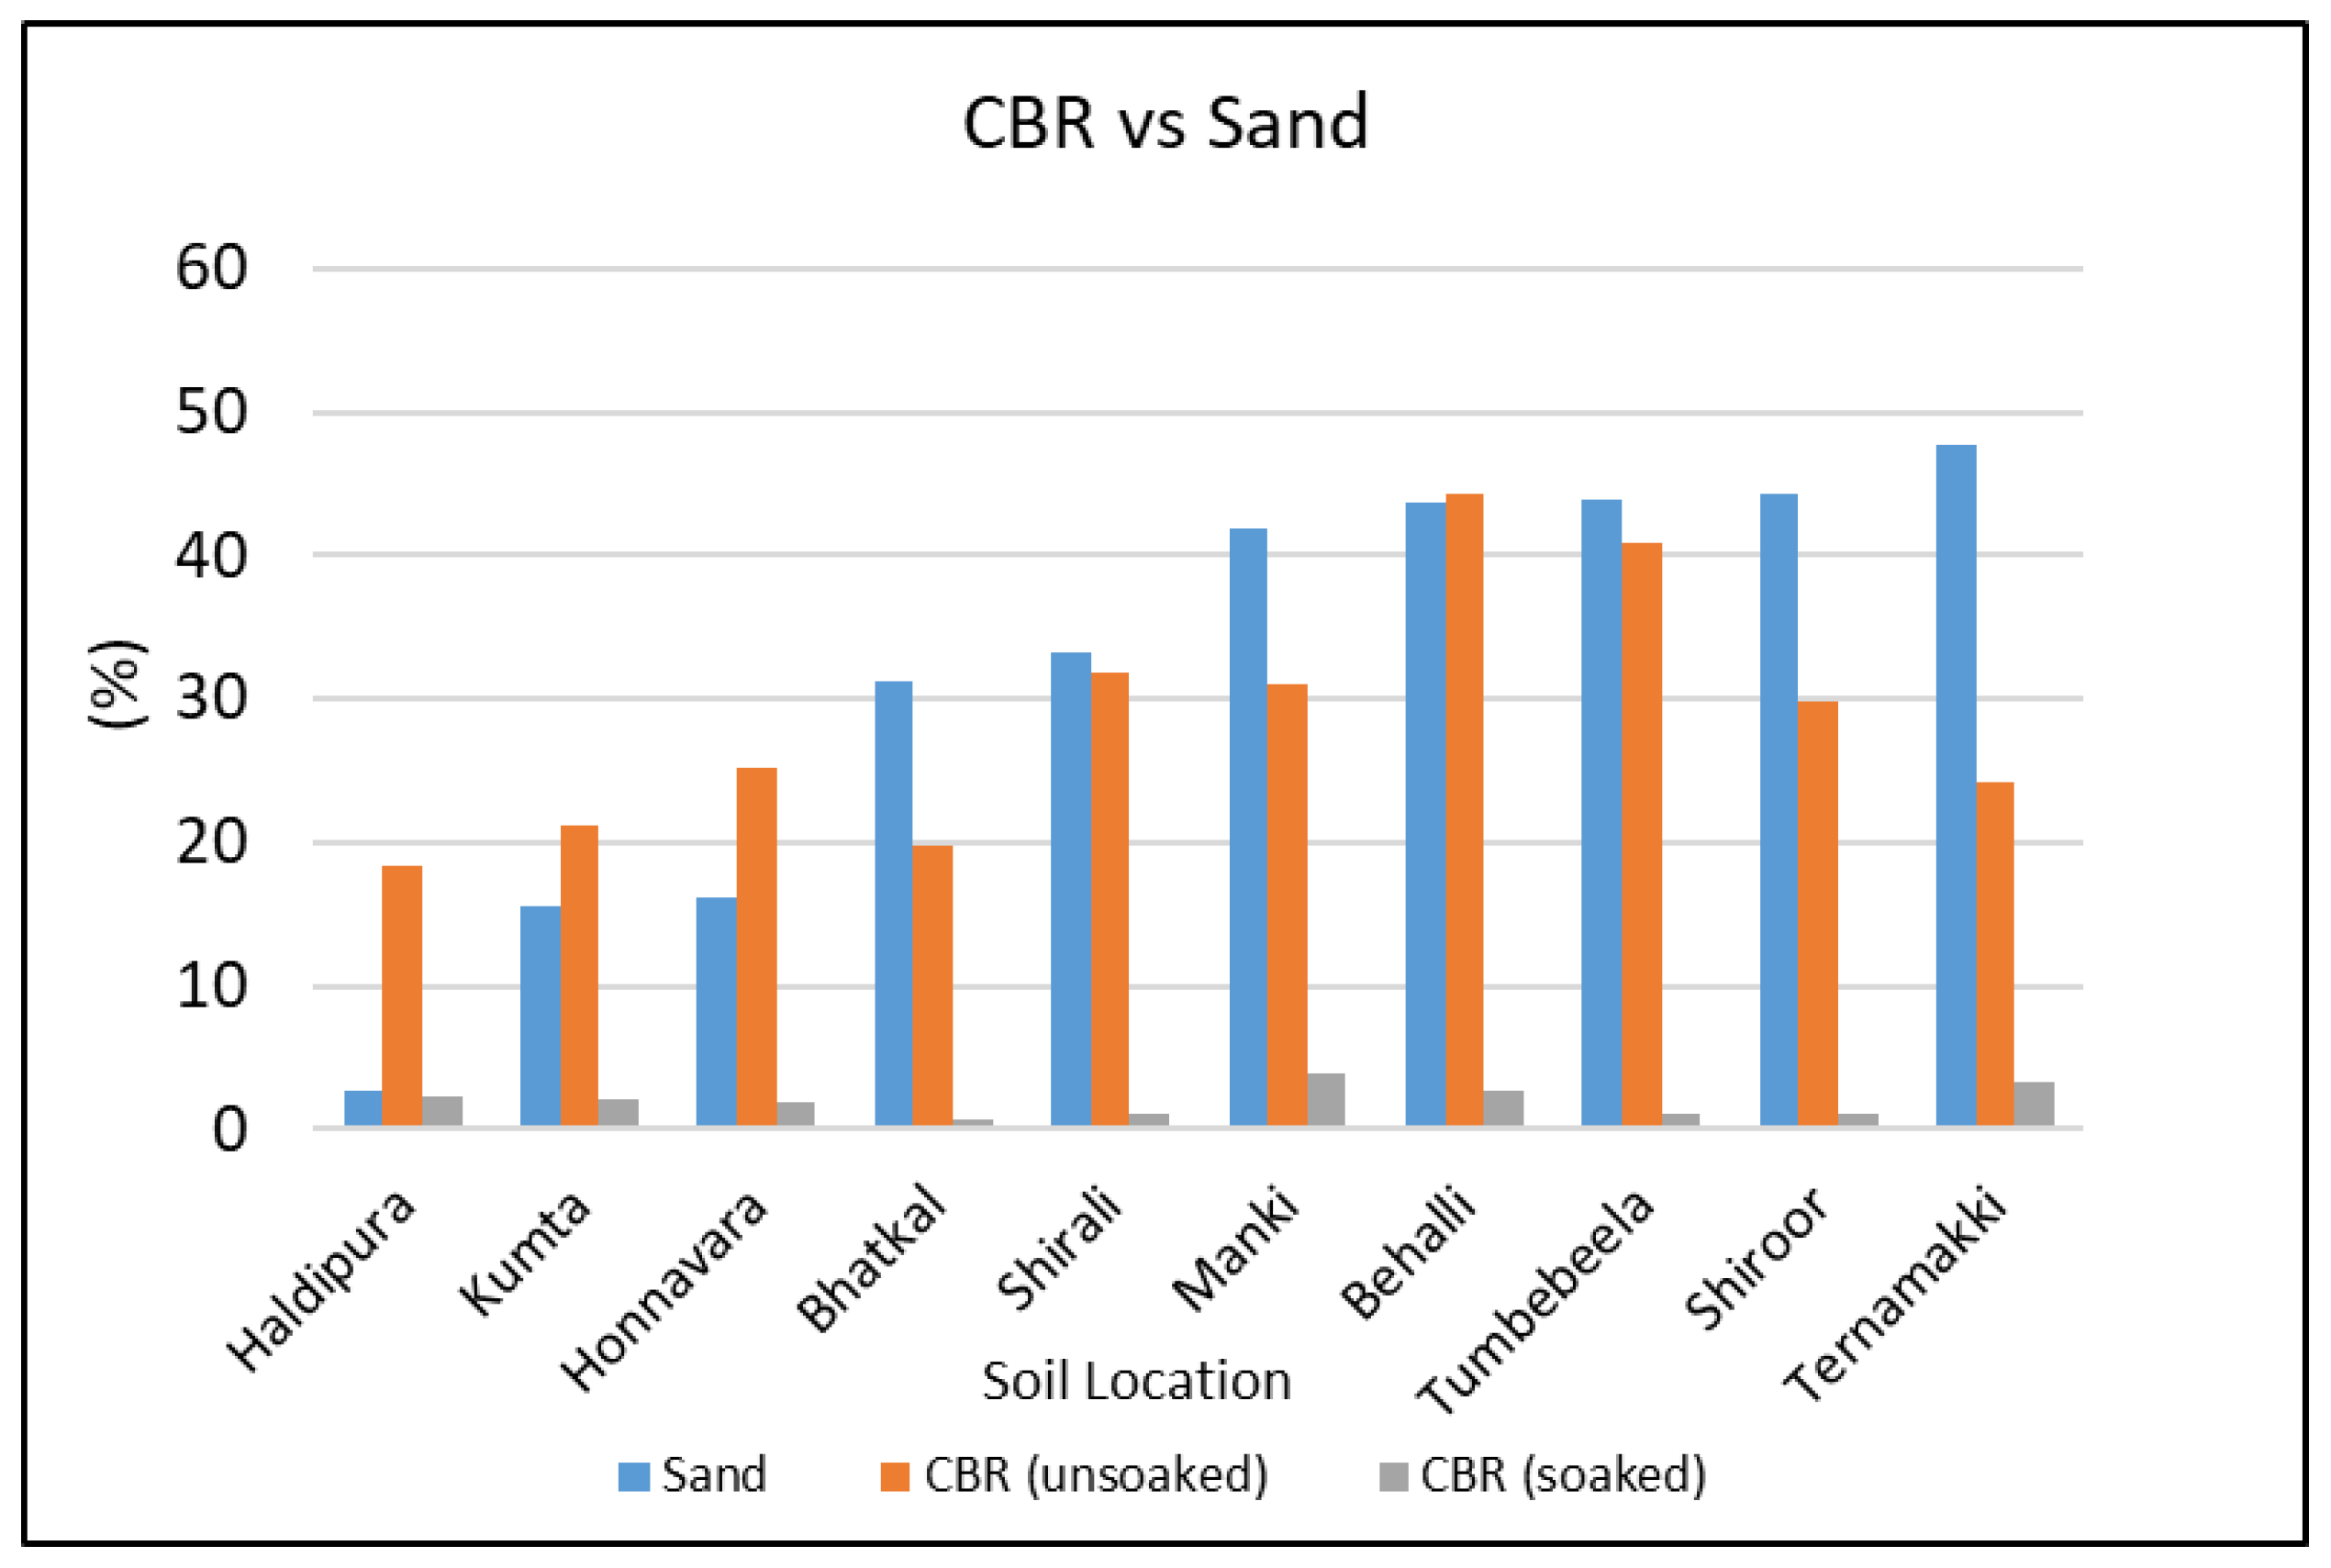
3.1.6. California Bearing Ratio (CBR) Test

It is evident in Figure 7 that the unsoaked CBR value demonstrates an increasing trend from 18.30% to 44.20% with an increase in sand content up to 43.68% in the Behalli sample. The soaked CBR values vary from a value of 0.7% for the Bhatkal sample to a maximum value of 3.9% for the Manki sample. Ternamakki and Manki experience a notable increase in CBR when soaked, suggesting relatively good strength and load-bearing capacity in saturated conditions. The Bhatkal soil undergoes a substantial reduction in CBR when soaked, suggesting potential challenges in maintaining stability and load-bearing capacity in wet conditions. Most of the minerals identified among all the locations with a plate-like structure can result in lower shear strength and compaction characteristics, especially when they come in contact with water, which may lead to decreased soaked CBR values [24]. Montmorillonite has a high cation-exchange capacity and can undergo significant volume changes with variations in water content, leading to reduced shear strength and compaction characteristics. Soil with a significant presence of montmorillonite may exhibit lower CBR values due to the mineral’s influence on the soil’s mechanical properties.

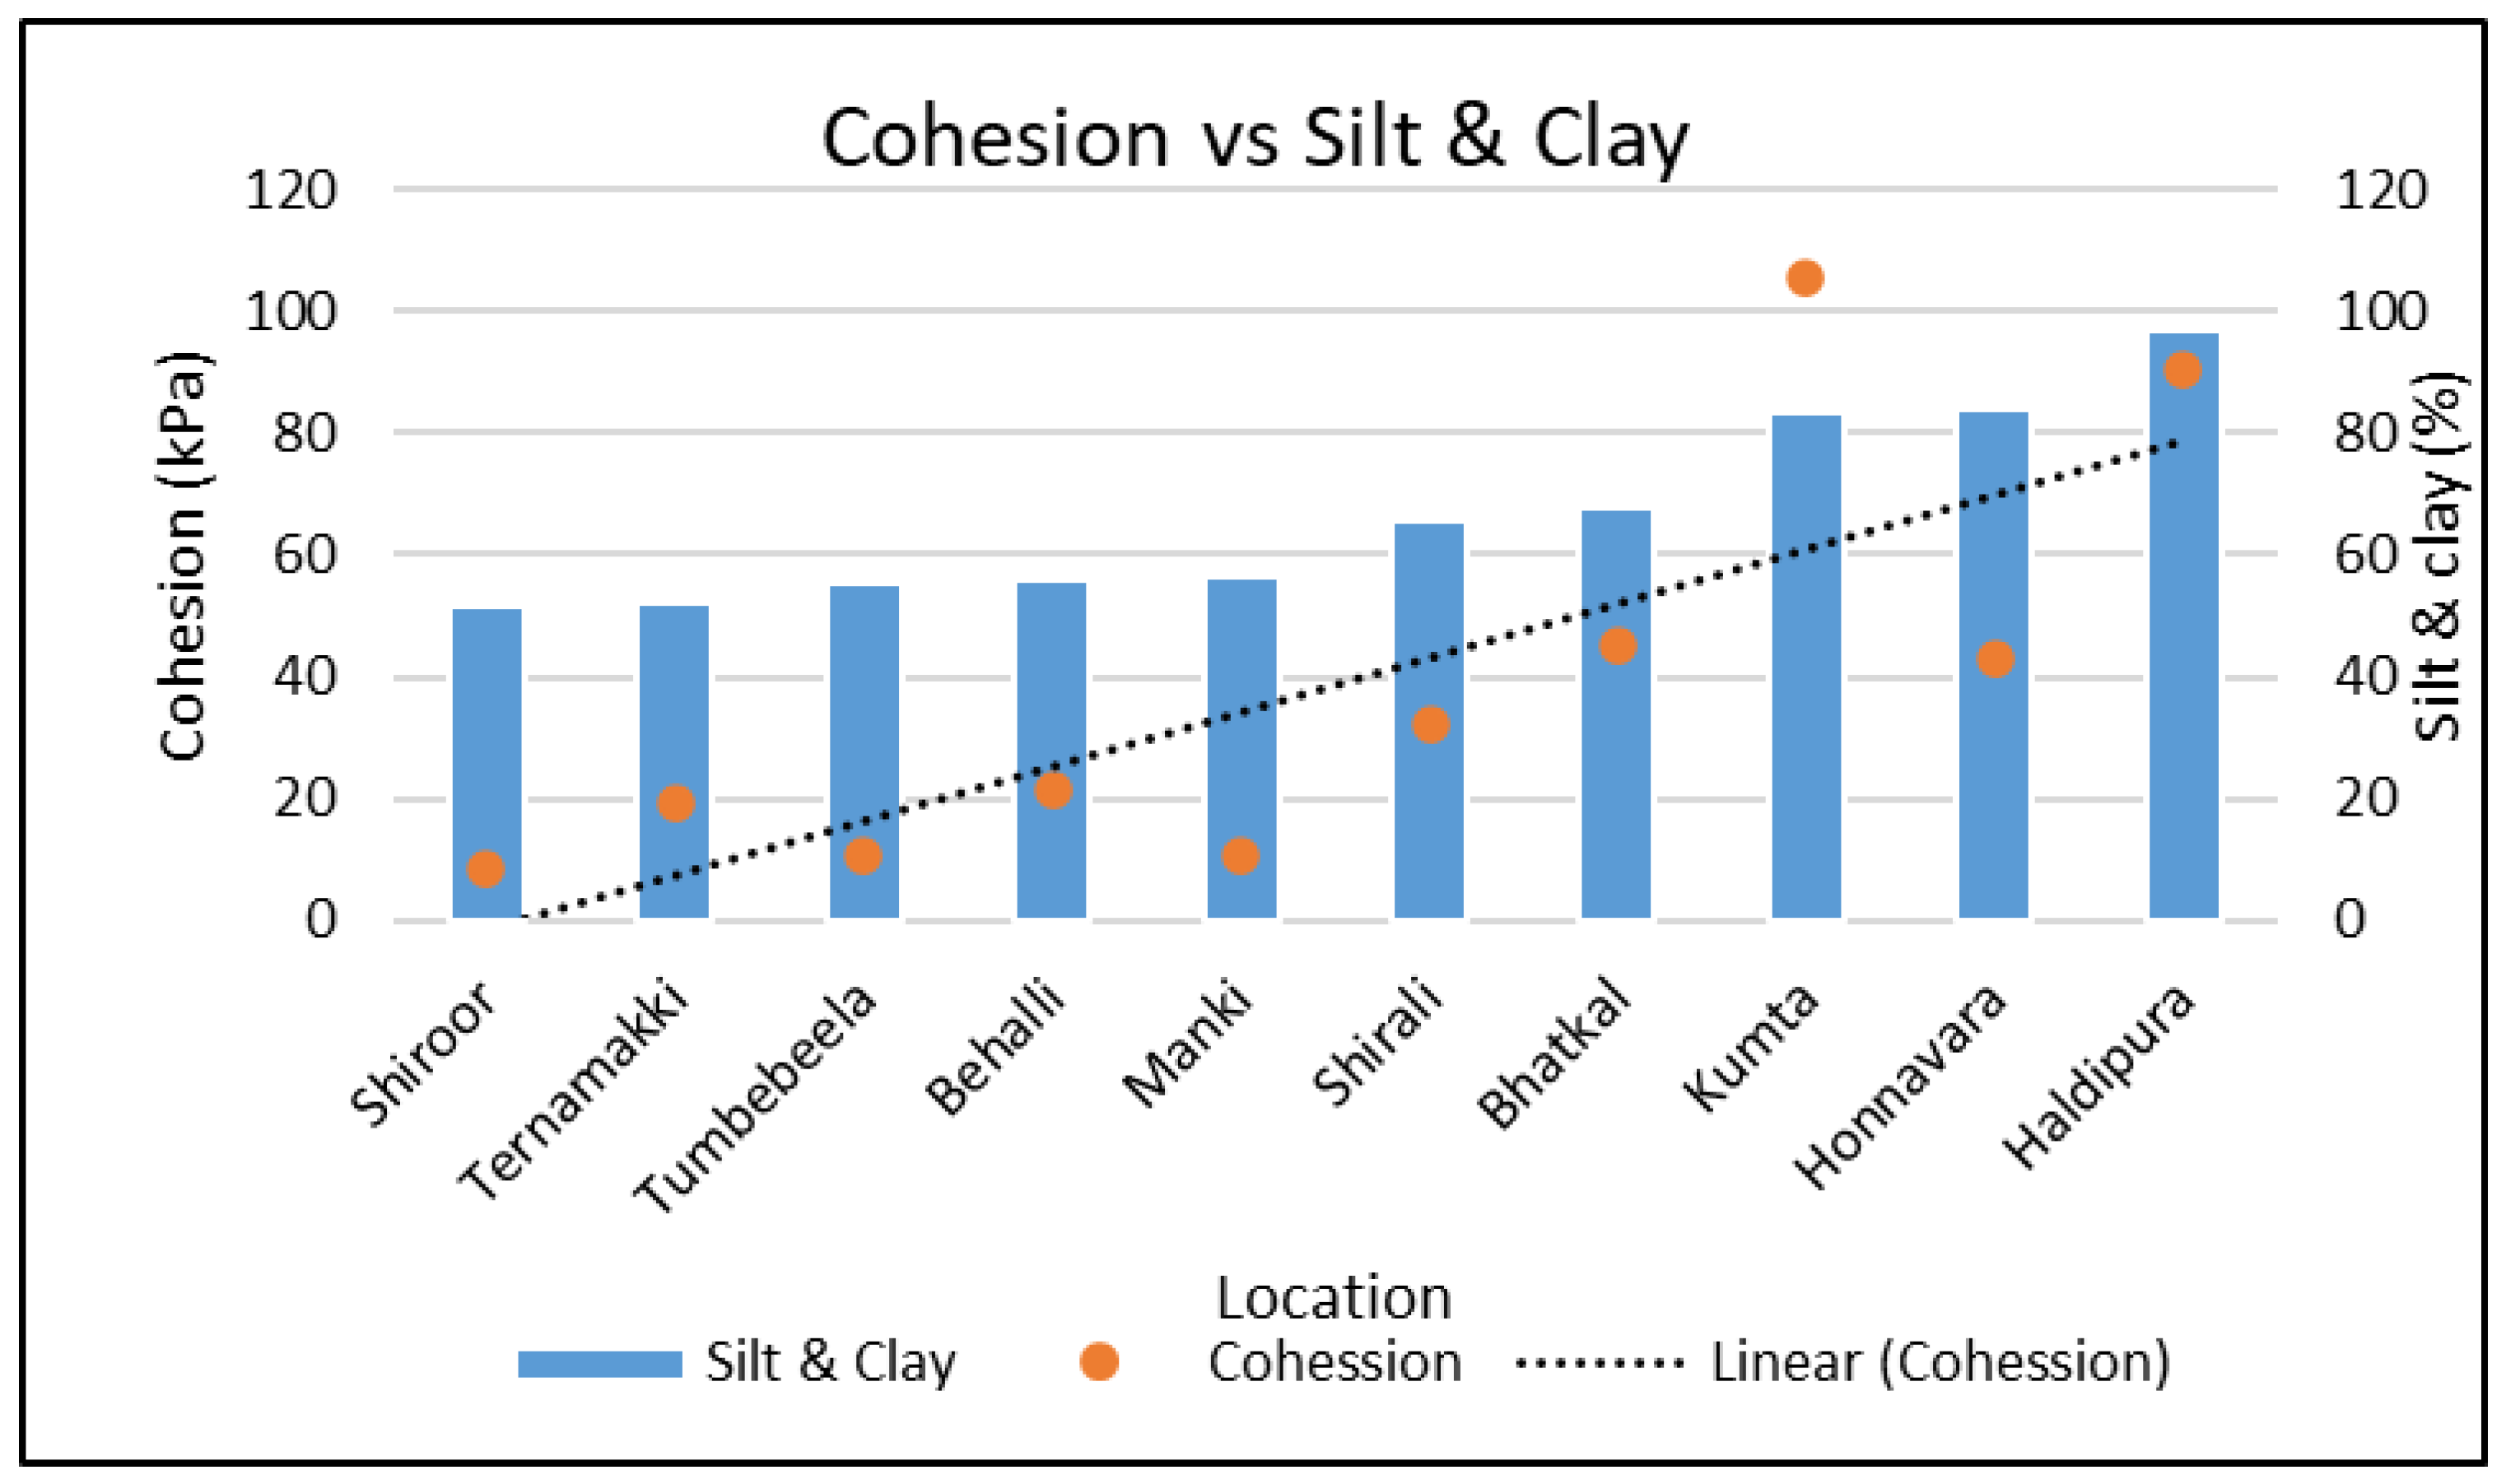
3.1.7. Triaxial Compression Test

In order to determine the cohesion and angle of internal friction, the triaxial compression test is conducted. As the amount of sand increases, the friction angle in Figure 8 shows a rising tendency. For a sand content of 2.67%, the friction angle is 17°; for a sand content of 47.7%, the friction angle is 30.5°.
The Manki and Shiroor soils, while possessing high silt content, lack significant clay, and their moderate cohesion values require a careful engineering assessment for construction. High cohesion (32.25 kPa) suggests significant shear strength. The Shirali and Kumta soils have high cohesion values with balanced silt and clay content indicating potential stability in construction, but they may require specific engineering measures due to the high silt and clay content, as depicted in Figure 9. The plate-like structures of minerals and high water content can result in lower shear strength and friction angle, making soils with a significant presence of muscovite, vermiculite, montmorillonite susceptible to shear deformation.
Factors such as particle size distribution, mineralogy and the presence of other materials (such as organic matter) all play a role in determining the cohesion of soil. Additionally, the interaction between soil particles and the moisture content of the soil also influences cohesive strength. The degree of crystallization affects the strength of interparticle bonds, and poorly crystallized minerals may not form strong cohesive forces. Silt particles are smaller than sand but larger than clay, and their relatively smooth surfaces reduce the ability of particles to interlock, resulting in lower cohesion. Meanwhile, certain clay minerals, such as kaolinite, are known for their low cohesive strength. Kaolinite clay particles have a platy structure, and their arrangement can result in weak interparticle forces, leading to lower cohesion.

3.2. Mineralogical Properties

The mineralogical analysis comprises scanning electron microscopy (SEM) and energy-dispersive X-ray spectroscopy (EDS), which are employed to ascertain the mineralogical composition. The outcomes obtained are then scrutinized and analyzed to identify the compounds and elemental constituents within the soil. The output obtained is analyzed using the X’pert Highscore plus software version 5.1b, and the results are tabulated in Table 2. Table 2 shows the minerals observed in each location with their proportion. The notations used in the table for minerals are IO: Iron Oxide; Mc: Microcline; CC: Calcite; AO: Aluminum Oxide; Vmt: Vermiculite; Fo: Forsterite; Bt: Biotite; Ms: Muscovite; Dzt: Dozyite; Gb: Gibbsite; Sill: Sillimanite; Ort: Orthoclase; Mu: Mullite; Ka: Kaolinite; Ill: Illite; Qtz: Quartz; Mnt: Montmorillonite.
The EDS analysis and SEM analysis are used to confirm the mineral compounds observed through XRD analysis. Typical XRD, EDS and SEM analyses of the Shiroor sample are shown in Figure 10. Figure 10a presents SEM images of sheet minerals, such as vermiculite or biotite, as EDS analyses (Figure 10b) to confirm the presence of magnesium with potassium, alumina and silica. Figure 10c,d show the identified minerals present in the Shiroor sample and their quantifications, respectively [25].

3.3. Correlation of Geotechnical and Mineralogical Properties

A statistical correlation analysis is conducted in the SPSS statistical tool using Spearman correlation to identify the correlation between geotechnical parameters and minerals observed in the soil samples. In this case, a positive Spearman correlation implies that the other variable tends to increase along with the level of the first, whereas a negative Spearman correlation shows that the other variable tends to fall along with the level of the first.
The correlation table (Table 3) presents the relationships between various soil properties and minerals, offering valuable insights into their interdependence. Microcline—a type of feldspar—shows a positive correlation with the friction angle, indicating that higher levels of microcline are associated with an increase in the friction angle. Calcite exhibits a moderate negative correlation with clay content, suggesting that as the calcite content rises, the clay content tends to decrease. On the other hand, calcite has a strong positive correlation with both silt content and optimum moisture content (OMC) in the standard Proctor test, implying that higher levels of calcite are linked to increased silt content and OMC.
Sillimanite—a mineral rich in aluminum and silicon—demonstrates multiple correlations. It is positively correlated with MDD (modified) and sand content, both with a moderate strength, implying that higher levels of sillimanite coincide with increased maximum dry density and sand content. Conversely, sillimanite has strong negative correlations with OMC (modified), liquid limit, plastic limit, cohesion, MDD (standard) and OMC (standard). This indicates that elevated levels of sillimanite are associated with lower values of these soil properties, including optimum moisture content in modified and standard Proctor tests, and maximum dry density in the standard Proctor test. Quartz, on the other hand, is negatively correlated with shrinkage limit, suggesting that higher quartz content is associated with a reduction in shrinkage limit. Overall, the correlations highlighted in Table 3 provide valuable insights for understanding the intricate relationships between minerals and soil properties, which is crucial for soil engineering and geotechnical applications. Sillimanite is an aluminosilicate mineral, which is a denser mineral (density ranging from 3.2 to 3.3 g/cm3); when added to the soil, it increases the overall mass of the soil without significantly increasing the volume, which results in an increase in the dry density of the soil. As the dry density of the soil increases, soil particles become more closely packed together. This reduces the amount of void space available for water, thereby reducing the optimum moisture content [16,26]. As per the correlation study conducted by Mehran et al. [27], the OMC is positively correlated with the liquid limit and plastic limit, and hence negatively correlated with sillimanite.

4. Conclusions

There was a high particle concentration in soil samples, which were taken from every location. It was determined that the soil sample taken from the Ternamakki area is composed of inorganic silts with little to no plasticity. It was determined that soil samples taken from the Kumta, Haladipur and Honnavar areas are inorganic silts with high compressibility. Flexibility was diminished by the high silt concentration. The degrees of plasticity and moisture sensitivity varied among the locations. With a high liquid limit, plastic limit and plasticity index, the Kumta sample stands out as having a high level of plasticity and a high fines content. Notable plasticity may also be found in the Honnavar and Haladipur samples. Due to the inclusion of non-expanding clay minerals, such as kaolinite, illite and gibbsite, the Ternamakki sample may have lower plasticity qualities. Because soil in the Kumta sample contains more fine particles and relatively less sand, its unconfined compressive strength is higher. The minerals muscovite and gibbsite frequently contribute to reduced unconfined compressive strength (UCS) in the soils of Tumbebeela, Ternamakki and Shiroor. The Behalli sample’s unsoaked California bearing ratio (CBR) value is comparatively high, but the sample as a whole has a soaked California bearing ratio (CBR) value of less than 5%. Since the majority of the minerals found in all the locations exhibit a structure resembling a plate, they may have lower compaction and shear strengths, particularly when exposed to water. This could result in lower soaked CBR values. A particular kind of feldspar called microcline has a positive association with the friction angle, meaning that higher microcline levels are linked to higher friction angles. In the standard Proctor test, calcite shows a strong positive connection with optimum moisture content and a moderate negative correlation with clay content, suggesting a relationship between greater calcite levels and higher silt content and OMC. A moderate-strength positive correlation was shown between sillimanite and both maximum dry density (modified) and sand content, suggesting that higher sillimanite levels are associated with higher maximum dry density and sand content. Conversely, there is a negative correlation between the shrinkage limit and quartz, indicating that a higher concentration of quartz is linked to a lower shrinkage limit. By combining it with appropriate stabilizers or ground improvement procedures, such as reinforcement, the qualities of lithomargic clay to be utilized for subgrades and foundations can be significantly improved. Road embankments require appropriate drainage systems and erosion control techniques in order to maintain a safe slope angle.

Author Contributions

Conceptualization, D.N.; methodology, D.N., P.G.S. and H.N.U.; validation, B.S.M., D.N. and H.N.U.; formal analysis, D.N. and M.P.K.; investigation, D.N., P.G.S. and B.S.M.; resources, D.N., H.N.U. and B.S.M.; data curation, D.N., P.G.S. and H.N.U.; writing—original draft preparation, D.N.; writing—review and editing, D.N., P.G.S. and H.N.U.; visualization, D.N. and P.G.S.; supervision, P.G.S., H.N.U. and B.S.M.; project administration, D.N. and P.G.S. All authors have read and agreed to the published version of the manuscript.

Funding

This research received no external funding.

Data Availability Statement

All data analyzed in this study is included in this published article.

Conflicts of Interest

The authors declare that they have no known competing financial interests or personal relationships, which could appear to have influenced the work reported in this paper. The authors declare no conflicts of interest.

References

  1. Khandali, S.D.; Devaraju, T.C. Laterite-bauxite of Paduvari plateau, South Kanara, Karnataka State. J. Geol. Soc. India 1987, 30, 255–266. [Google Scholar]
  2. Nayak, D.; Sarvade, P.G.; Udaya Shankara, H.N.; Pai, J.B. Mineralogical Characterization of Lithomargic Clay Deposits along the Coastal Belt of Udupi Region of South India. J. Compos. Sci. 2023, 7, 170. [Google Scholar] [CrossRef]
  3. Bhagyashree; Udayashankar, H.N.; Sarvade, P.G.; Kavyashree. Correlation of Mineralogical and Geotechnical Properties of Laterite Soils of Coastal Karnataka, India. Civ. Eng. Archit. 2023, 11, 3334–3346. [Google Scholar] [CrossRef]
  4. Lakkimsetti, B.; Nayak, S. Experimental Investigation and Performance Evaluation of Lithomargic Clay Stabilized with Granulated Blast Furnace Slag and Calcium Chloride. Int. J. Geosynth. Ground Eng. 2022, 8, 12. [Google Scholar] [CrossRef]
  5. Amulya, S.; Ravi Shankar, A.U.; Praveen, M. Stabilisation of lithomargic clay using alkali-activated fly ash and ground granulated blast furnace slag. Int. J. Pavement Eng. 2020, 21, 1114–1121. [Google Scholar] [CrossRef]
  6. Nayak, S.; Sarvade, P.G. Effect of Cement and Quarry Dust on Shear Strength and Hydraulic Characteristics of Lithomargic Clay. Geotech. Geol. Eng. 2012, 30, 419–430. [Google Scholar] [CrossRef]
  7. Budihal, R.; Pujar, G. Major and trace elements geochemistry of laterites from the Swarnagadde plateau, Uttar Kannada district, Karnataka, India. J. Geosci. Geomat. 2018, 6, 12–20. Available online: http://pubs.sciepub.com/jgg/6/1/2 (accessed on 30 January 2024).
  8. Sekhar, D.C.; Nayak, S.; Preetham, H.K. Influence of Granulated Blast Furnace Slag and Cement on the Strength Properties of Lithomargic Clay. Indian Geotech. J. 2017, 47, 384–392. [Google Scholar] [CrossRef]
  9. Thomas, B.C.; Shivashankar, R.; Jacob, S.; Varghese, M.S. Erosion Studies on Lithomargic Clays. Indian Geotech. J. 2020, 50, 142–156. [Google Scholar] [CrossRef]
  10. Sarvade, P.G.; Nayak, D.; Sharma, A.; Gogoi, R.; Madhukar, S. Strength characteristics of randomly distributed coconut coir reinforced lithomargic clay. Int. J. Civ. Eng. Technol. 2017, 8, 1122–1134. [Google Scholar]
  11. Sarvade, P.G.; Nayak, D.; Sharma, A.; Gogoi, R.; Madhukar, S. Evaluation of strength characteristics of coconut coir mat reinforced lithomargic clay. Int. J. Civ. Eng. Technol. 2018, 9, 1168–1179. [Google Scholar]
  12. Narloch, P.; Woyciechowski, J.; Kotowski, J.; Wójcik, E. The effect of soil mineral composition on the compressive strength of cement stabilized rammed earth. Materials 2020, 13, 324. [Google Scholar] [CrossRef] [PubMed]
  13. Mason, B.; Carleton, B.M. Principles of Geochemistry; John Wiley & Sons: New York, NY, USA, 1982. [Google Scholar]
  14. Nayak, D.; Udayashankar, H.N.; Sarvade, P.G. Geotechnical Characterization of Lithomargic Clays of Uttara Kannada District, Karnataka. J. Xi’an Univ. Archit. Technol. 2021, 13, 1–21. [Google Scholar]
  15. Momade, F.; Gawu, S. Geochemical and Mineralogical Characteristics of Lithomargic Clay Types from Awaso Bauxite Deposit, Ghana: Implications for Possible Industrial Utilization. J. Sci. Technol. 2009, 29, 96–106. [Google Scholar] [CrossRef]
  16. Mitchell, J.K.; Soga, K. Fundamentals of Soil Behaviour; John Wiley & Sons: New York, NY, USA, 2005; Volume 3. [Google Scholar]
  17. El Swaify, S.A.; Ahmed, S.; Swindale, L.D. Effects of adsorbed cations on physical properties of tropical red earths and tropical black earths. J. Soil Sci. 1970, 21, 188–198. [Google Scholar] [CrossRef]
  18. Smiles, D.E.; Smith, C.J. A survey of the cation content of piggery effluents and some consequences of their use to irrigate soils. Soil Res. 2004, 42, 231–246. [Google Scholar] [CrossRef]
  19. IS 2720 Part-4; Grain Size Analysis. Bureau of Indian Standards: New Delhi, India, 1985.
  20. IS 2720, Part-5; Determination of Liquid Limit and Plastic Limit. Bureau of Indian Standards: New Delhi, India, 1985.
  21. IS 2720, Part-3; Determination of Specific Gravity. Bureau of Indian Standards: New Delhi, India, 1980.
  22. IS 2720, Part-7; Determination of Water Content-Density Relation Using Light Compaction. Bureau of Indian Standards: New Delhi, India, 1980.
  23. IS 2720, Part-6; Determination of Shrinkage Factors. Bureau of Indian Standards: New Delhi, India, 1972.
  24. Mshali, M.R.; Visser, A.T. Influence of mica on unconfined compressive strength of a cement-treated weathered granite gravel. J. S. Afr. Inst. Civ. Eng. 2012, 54, 71–77. [Google Scholar]
  25. Nayak, D.; Sarvade, P.G.; Udaya Shankara, H.N.; Kumar, M.P. Mineralogical Analysis of Lithomargic Clay Deposits along the Coastal Belt of Uttara Kannada Region in South India. J. Adv. Res. Appl. Sci. Eng. Technol. 2024, 39, 117–134. [Google Scholar] [CrossRef]
  26. Kurnaz, T.F.; Kaya, Y. The Performance Comparison of the Soft Computing Methods on the Prediction of Soil Compaction Parameters. Arab. J. Geosci. 2020, 13, 159. [Google Scholar] [CrossRef]
  27. Karimpour-Fard, M.; Machado, S.L.; Falamaki, A.; Carvalho, M.F.; Tizpa, P. Prediction of Compaction Characteristics of Soils from Index Test’s Results. Iran. J. Sci. Technol. 2019, 43, 231–248. [Google Scholar] [CrossRef]
Figure 1. Soil samples: (a) Lithomargic clay sample from Shiroor; (b) Location of all the samples.
Geosciences 14 00092 g001
Figure 2. Grain size analysis of soil samples.
Geosciences 14 00092 g002
Figure 3. Consistency limits of soil samples.
Geosciences 14 00092 g003
Figure 4. Variation in MDD and OMC with sand content.
Geosciences 14 00092 g004
Figure 5. Variation in compaction characteristics with sand content.
Geosciences 14 00092 g005
Figure 6. Variation in UCS with sand content.
Geosciences 14 00092 g006
Figure 7. Variation in soaked and unsoaked CBR with sand content.
Geosciences 14 00092 g007
Figure 8. Variation in the angle of internal friction with sand content.
Geosciences 14 00092 g008
Figure 9. Variation in cohesion with silt and clay content.
Geosciences 14 00092 g009
Figure 10. Mineralogical analysis of the Shiroor sample: (a) SEM image; (b) Spectrum image; (c) XRD analysis; (d) Quantification of compounds.
Geosciences 14 00092 g010
Table 1. Basic properties of soil samples.
LocationSpecific Gravity (-)Dry Unit Weight (kN/m3)Field Moisture Content (%)
Shiroor2.4314.8118.13
Behalli2.3814.7118.20
Bhatkal2.4014.9119.90
Shirali2.3414.8126.44
Ternamakki2.4815.2012.63
Tumbebeela2.3914.6115.33
Manki2.4514.5221.07
Honnavar2.4314.0324.42
Haladipur2.5114.1223.38
Kumta2.5914.4232.10
Table 2. Quantification of the minerals observed in various sample locations.
LocationIOMcCCAOVmtFoBtMsDztGbSillOrtMuKaIllQtzMnt
Shiroor-21128281144362101116
Behalli113.91310.927.99.95434210.99.938.9
Bhatkal0.313.32215.325.18.26.13.123.1214.312.227.1
Shirali 12.11210.138.16.147.1411.16.19.19.116.1
Ternamakki-14.91251510.9213.96.96.925.913.945
Tumbebeela-10.1217.117.18.1315.26.17.118.114.15.14
Manki18.97.9113.9111.95.928.95.937.95.97.925
Honnavar115.8515.9118.8436.9355.945113.9
Haladipur-1363717172526141835
Kumta110.85.92.912.72.94.96.94.96.925.92.910.89.826.9
Table 3. Correlation of geotechnical and mineralogical properties.
PropertyMineralPositively CorrelatedNegatively CorrelatedStrength
Angle of internal frictionMicroclinePos Moderate
Clay contentCalcite NegModerate
Silt contentCalcitePos Strong
OMC (standard)CalcitePos Strong
MDD (standard)Calcite NegStrong
Sand contentCalcite NegModerate
OMC (modified)Gibbsite NegModerate
MDD (modified)SillimanitePos Moderate
OMC (modified)Sillimanite NegStrong
Liquid limitSillimanite NegModerate
Plastic limitSillimanite NegModerate
CohesionSillimanite NegModerate
Sand contentSillimanitePos Moderate
MDD (standard)SillimanitePos Moderate
OMC (standard)Sillimanite NegModerate
Shrinkage limitQuartz NegModerate
Disclaimer/Publisher’s Note: The statements, opinions and data contained in all publications are solely those of the individual author(s) and contributor(s) and not of MDPI and/or the editor(s). MDPI and/or the editor(s) disclaim responsibility for any injury to people or property resulting from any ideas, methods, instructions or products referred to in the content.

