Article

Effect of Freeze–Thaw and Wetting–Drying Cycles on the Hydraulic Conductivity of Modified Tailings

1
Institute of Geotechnical Engineering, College of Civil Engineering and Architecture, Zhejiang University, Hangzhou 310058, China
2
MOE Key Laboratory of Soft Soils and Geoenvironmental Engineering, Zhejiang University, Hangzhou 310058, China
3
BGRIMM Technology Group, Beijing 100160, China
4
Department of Civil and Environmental Engineering, The Hong Kong University of Science and Technology, Kowloon, Hong Kong 999077, China
*
Author to whom correspondence should be addressed.
Geosciences 2024, 14(4), 93; https://doi.org/10.3390/geosciences14040093
Submission received: 16 December 2023 / Revised: 20 March 2024 / Accepted: 22 March 2024 / Published: 25 March 2024

Abstract

:
Mine tailings have shown viability as the fine–grained layer in a capillary barrier structure for controlling acid mine drainage in a circular economy. Their saturated hydraulic conductivities (ksat) under wetting–drying cycles and freeze–thaw cycles remain unexplored. In this study, modified tailings with a weight ratio of 95:5 (tailings/hydrodesulfurization (HDS) clay from waste–water treatment) and an initial water content of 12% were used. The ksat of specimens was measured after up to 15 wetting–drying cycles, each lasting 24 h, with a drying temperature of 105 °C. The ksat for wetting–drying cycles decreased from 3.9 × 10⁻⁶ m/s to 9.5 × 10⁻⁷ m/s in the first three cycles and then stabilized in the subsequent wetting–drying cycles (i.e., 5.7 × 10⁻⁷ m/s–6.3 × 10−7 m/s). Increased fine particles due to particle breakage are the primary mechanism for the ksat trend. In addition, the migration of fines and their preferential deposition near the pore throat area may also promote this decreasing trend through the shrinking and potentially clogging–up of pore throats. This could be explained by the movement of the meniscus, increased salinity, and, subsequently, the shrinkage of the electrical diffuse layer during the drying cycle. Similar specimens were tested to measure ksat under up to 15 freeze–thaw cycles with temperatures circling between −20 °C and 20 °C at 12 h intervals. Compared to the untreated specimen (i.e., 3.8 × 10⁻⁶ m/s), the ksat after three freeze–thaw cycles decreased by 77.6% (i.e., 8.5 × 10⁻⁷ m/s) and then remained almost unchanged (i.e., 5.6 × 10⁻⁷ m/s–8.9 × 10−7 m/s) in subsequent freeze–thaw cycles. The increased fine grain content (i.e., 3.1%) can be used to explain the decreased ksat trend. Moreover, the migration of fines toward the pore throat area, driven by the advancing and receding of ice lens fronts and subsequent deposition at the pore throat, may also contribute to this trend.

1. Introduction

Mine waste rocks containing sulfur (e.g., waste of copper mine), which can significantly damage the environment and human health through acid mine drainage (AMD), are widely distributed and deposited in open–air fields worldwide [1,2,3,4]. AMD, produced by the chemical reaction of sulfide minerals with water and oxygen, is characterized by high concentrations of hydrogen ions and dissolved metals [2,3,5]. Recently, capillary barriers (e.g., a two–layer capillary barrier, as shown in Figure 1) have proven effective as a source control method in preventing water infiltration into waste rocks, thereby avoiding AMD [2,4]. The two–layer capillary barrier consists of a fine–grained layer and a coarse–grained layer. According to previous studies [2,4,6,7,8,9,10], the typical thicknesses of the fine–grained layer and coarse–grained layer are 0.4–1.0 m and 0.2–0.5 m, respectively (Table 1). The mechanism of the capillary barrier is based on the difference in unsaturated hydraulic conductivities (kusat) between fine and coarse particles [2,4,6,7,8,9,10]. As a key state of kusat [7,8,9], the ksat of the upper fine–grained layer is significantly affected by freeze–thaw cycles and wetting–drying cycles during climatic change [11,12,13]. Mine tailings are commonly used for the fine–grained layer of the mining capillary barrier (Figure 1) due to their remote location and cost [2,4]. So far, the ksat under wetting–drying cycles and freeze–thaw cycles of mine tailings remain unexplored.
Many previous studies have focused on the ksat of soils, which are widely used in engineering practices under freeze–thaw and wetting–drying cycles [14,15,16,17,18,19]. For the freeze–thaw cycles, Kim and Daniel (1992) [14] studied the effects of compaction degree and water content on the ksat of clay after 0 and 5 freeze–thaw cycles. The results showed that the ksat on both the dry side and wet side of optimum water content after cycles increased by two to six times and one hundred times, respectively, compared to the untreated specimen, primarily due to increased pore volume. Tang and Yan (2015) [17] measured the ksat of soft soil by the one–dimensional freeze–thaw setup. A similar increasing trend in ksat was also observed following freeze–thaw cycles in this study, with differences attributed to an increased average pore diameter caused by aggregation. Shen et al. (2022) [20] compared the microstructure of saline soil with different compaction degrees. Both coarse particle breakage and fine particle aggregation were observed following freeze–thaw cycles, thereby altering the soil structure types. For the wetting–drying cycles, Albrecht and Benson (2001) [15] compared the ksat of eight clayey soils used as clay liners and covers after wetting–drying cycles. An increase in ksat was observed due to the volumetric shrinkage strain induced by the increased clay content. Thyagaraj and Julina (2019) [18] reported that the ksat of compacted clay increased with the rise in pore fluid concentrations and the number of wetting–drying cycles. Xu et al. (2023) [19] studied compacted loess with 15% bentonite after wetting–drying cycles, finding that the ksat initially increased and then stabilized after five cycles. It should be pointed out that the ksat of modified tailings, subjected to freeze–thaw cycles and wetting–drying cycles, has not been deliberately studied, although it is crucial for water infiltration and the barrier effect of the capillary barrier structure.
This study aims to investigate the effects of freeze–thaw cycles and wetting–drying cycles on the ksat of modified tailings. Two series of infiltration tests were conducted to measure ksat on modified tailings after selected cycles. Mineralogical composition and particle size changes in the modified tailings were measured through X–ray diffraction (XRD) and laser particle size analyzer tests to unveil the fundamental mechanisms at the particulate level. More importantly, as a key indicator, the changes in ksat subjected to freeze–thaw cycles and wetting–drying cycles play a crucial role in the kusat of materials. This study could provide guidance for designing and maintaining mining capillary barriers.

2. Experimental Program

Two series of infiltration tests were carried out with modified tailings after several freeze–thaw cycles and wetting–drying cycles. The first series of tests was designed to study the effect of freeze–thaw cycles on the ksat of modified tailings, including five infiltration tests after different freeze–thaw cycles, respectively. Each infiltration test included a specimen with a dry density of 1.50 g/cm3, corresponding to the 85% degree of compaction. The five specimens prepared for the infiltration tests underwent freeze–thaw cycles of 0, 3, 6, 9, and 15 times, respectively. In the second series of tests, five infiltration tests were conducted on specimens similar to those in the first series, except that wetting–drying cycles were used. More details of the test programs and soil states are summarized in Table 2.
In addition, to interpret the above ksat results, the mineralogical compositions and particle size distributions were analyzed using the X–ray diffraction (XRD) and laser particle size analyzer, respectively. For XRD tests, the mineralogical compositions of the tailings and HDS clay in their natural states and after the 15th cycle were tested and analyzed. For the particle size distributions, similar specimens from the infiltration tests were prepared using oedometer rings. After that, the specimens, subjected to the ordered freeze–thaw cycles and wetting–drying cycles, were tested.

3. Soil Properties and Specimen Preparation

3.1. Soil Properties

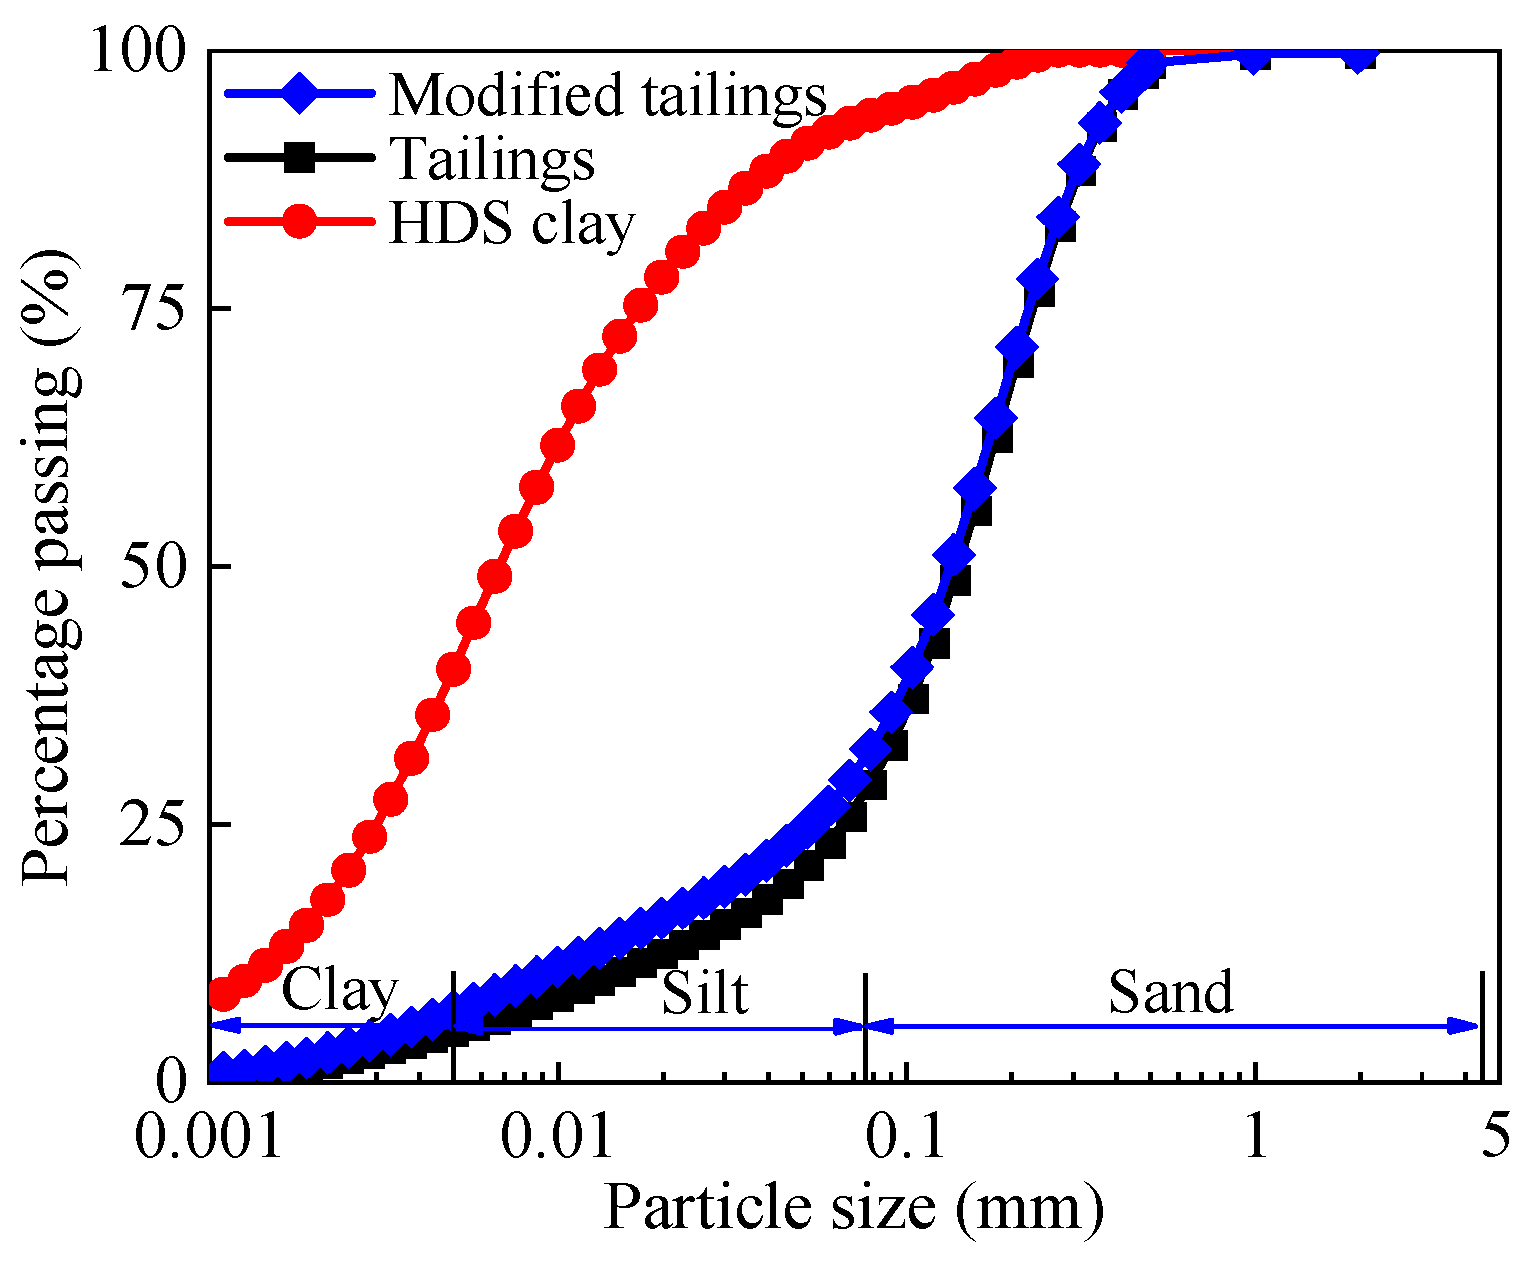
Copper mine waste (i.e., tailings and HDS clay) was collected at the Copper Mine of Dexing, Jiangxi province, China (i.e., dotted lines in Figure 2b,c). After being oven–dried and sieved through a 2 mm standard sieve, the modified tailings were prepared by mixing at a weight ratio of 95:5 for tailings to HDS clay. According to the recommended guidelines for the fine–grained layer and coarse–grained layer of capillary cover [4,21,22], this mixing ratio satisfied the criteria for the cooperative properties of the coarse–grained layer (i.e., waste rock), which was proved by Xia et al. (2023) [4]. The particle size distributions of the modified tailings, tailings and HDS clay were measured by the laser particle size analyzer (APA2000, Malvern, UK). The fractions of sand, silt and clay in the modified tailings were 69.2%, 24.2% and 6.6%, respectively (Figure 3). Following ASTM D4318–10 (2010) [23], the liquid and plastic limits of the modified tailings were determined to be 22.4% and 3.8%, respectively. According to the Unified Soil Classification System [24], the modified tailings were classified as silty sand with the group symbol of SM, widely used for the fine–grained soil layer of the capillary cover system [2,4,25]. Furthermore, the maximum dry densities and optimum water content for the modified tailings were 1.73 g/cm3 and 13.9%, respectively. Details of the physical properties of modified tailings, tailings and HDS clay are summarized in Table 3.

3.2. Specimen Preparations

Ten compacted specimens were prepared for the infiltration tests. Following the compaction parameters of Xia et al. (2023) [4], the target dry density and water content were 1.50 g/cm3 and 12%, corresponding to 85% of the maximum dry densities and optimum water content, respectively. The de–aired water was evenly sprayed and mixed with the modified tailings to gradually increase its water content to the target value. After approximately 48 h of moisture equalization, the mixture in a sealed plastic bag was compacted into oedometer rings (i.e., 7.2 cm in diameter and 5.2 cm in height) using the static compaction method. The measured dry density and water content for the prepared specimens were 1.50 g/cm3 and 11.8%, respectively, closely matching the target values.
For the XRD specimens, the powder that passed through a 0.075 mm standard sieve was collected using a McCrone Micronising mill, mixing ethyl alcohol with air–dried materials (i.e., tailings and HDS clay). To reduce the influence of preferred orientation [26], the razor–tamped surface method was used to prepare the specimens. For the particle size distributions, specimens that underwent the wetting–drying and freeze–thaw cycle tests were collected using similar oedometer rings to the infiltration tests. After that, the specimens were oven–dried and passed the 2 mm standard sieve prior to laser particle size analyzer tests.

4. Test Apparatuses and Procedures

4.1. Test Apparatuses

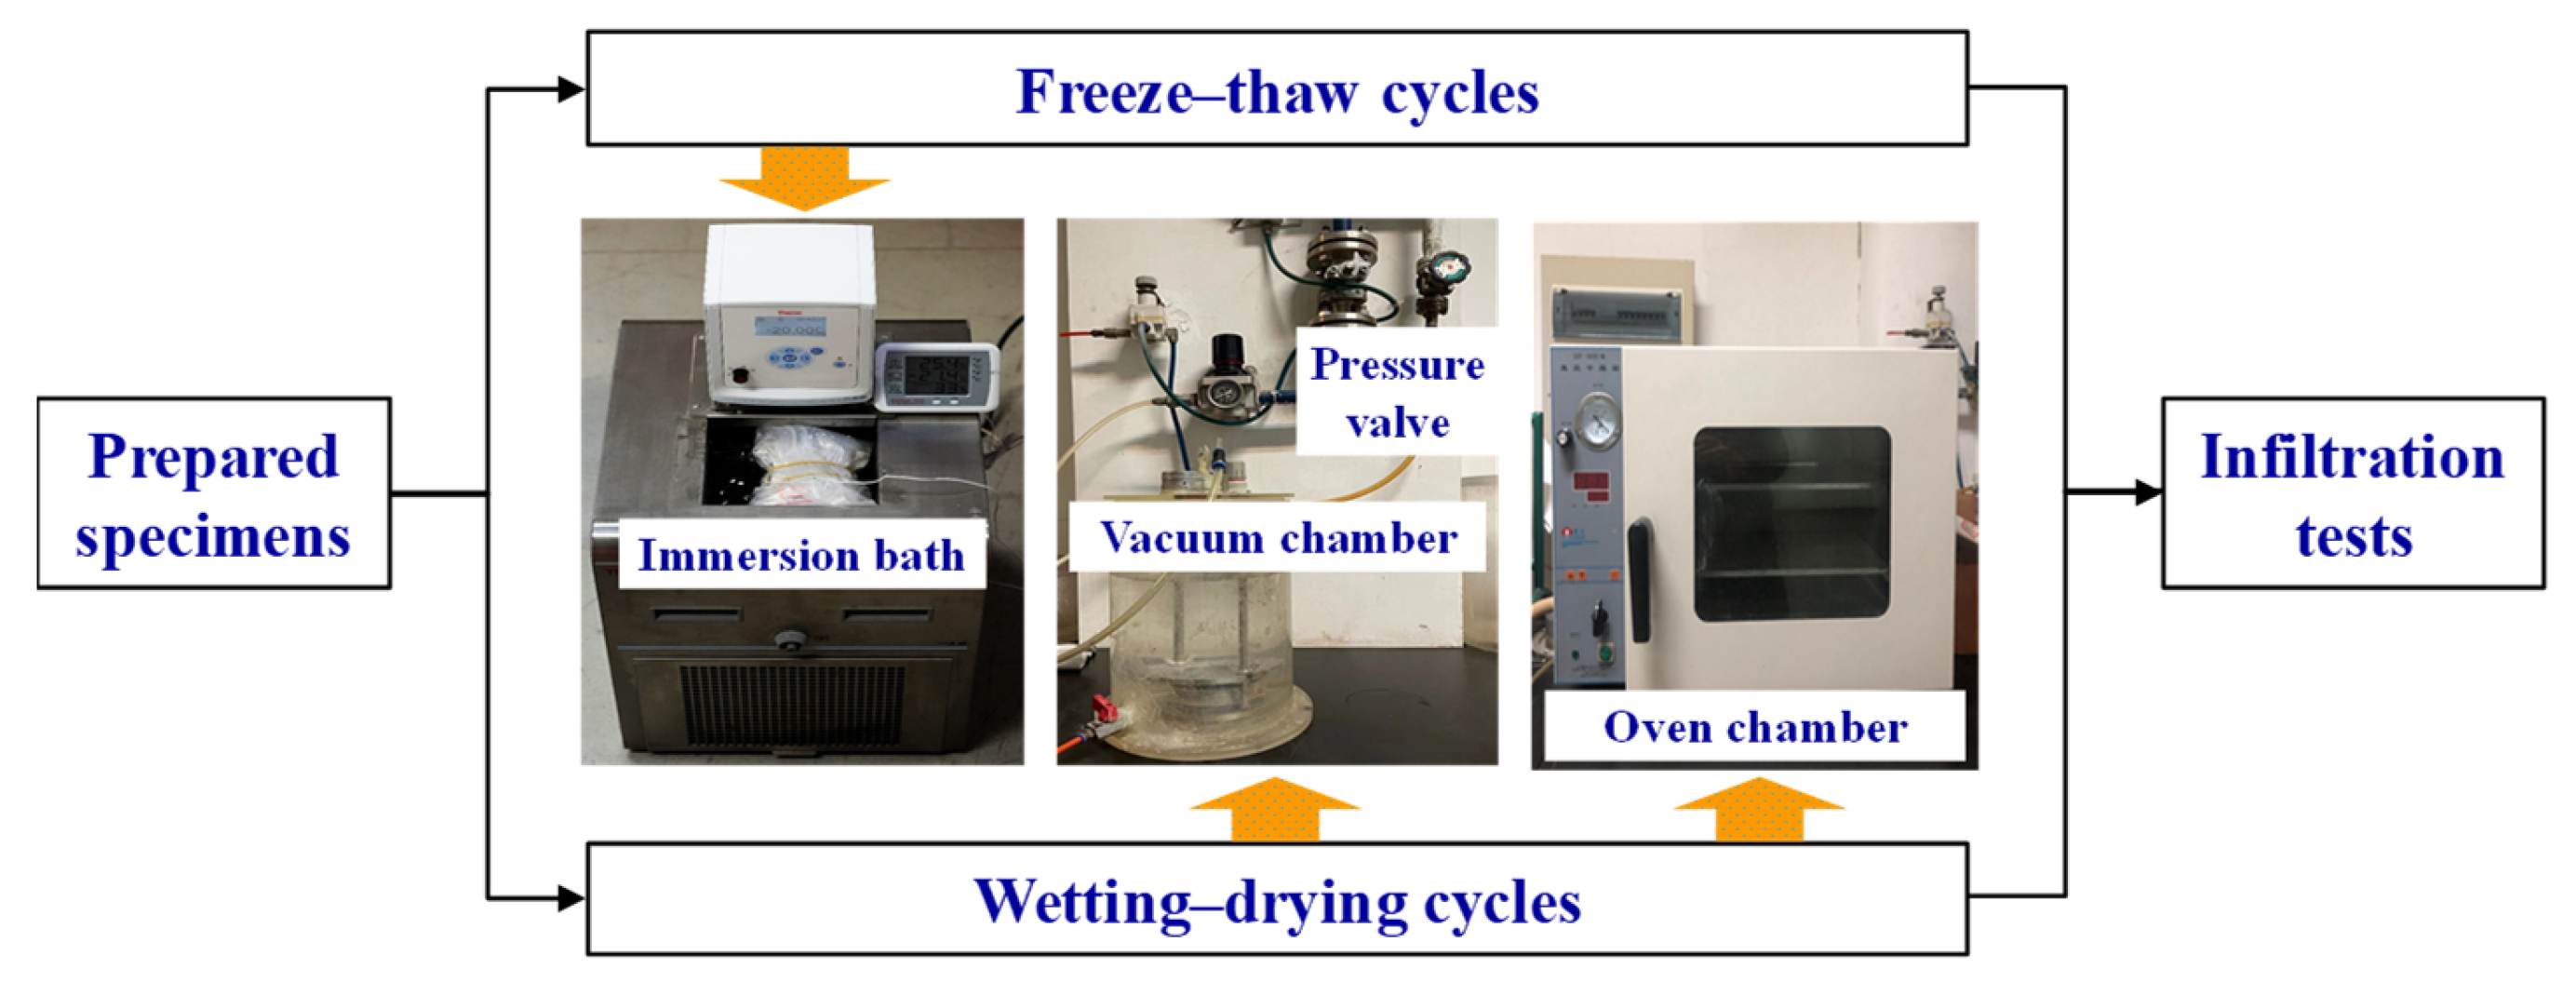
For the freeze–thaw cycle tests, the Thermo Haake ARCTIC AC200 A40 immersion bath circulator with a Neslab RTE740 Digital Plus Replacement (Figure 4) was used to control the temperature and cycle time. The apparatus has a temperature range of −40 °C to 200 °C and includes a 12 L stainless steel immersion bath. The wetting–drying cycles were carried out by the combination of the vacuum saturator (−100–0 kPa) and air–blowing thermostatic oven (20–300 °C) (Figure 4). Considering the saturation degree and extreme conditions in the field (e.g., wildfires), the pore water pressure and drying temperature were limited to −80 kPa and 105 °C in this study, respectively. For the infiltration tests, the variable–head permeameter was used to measure the ksat.
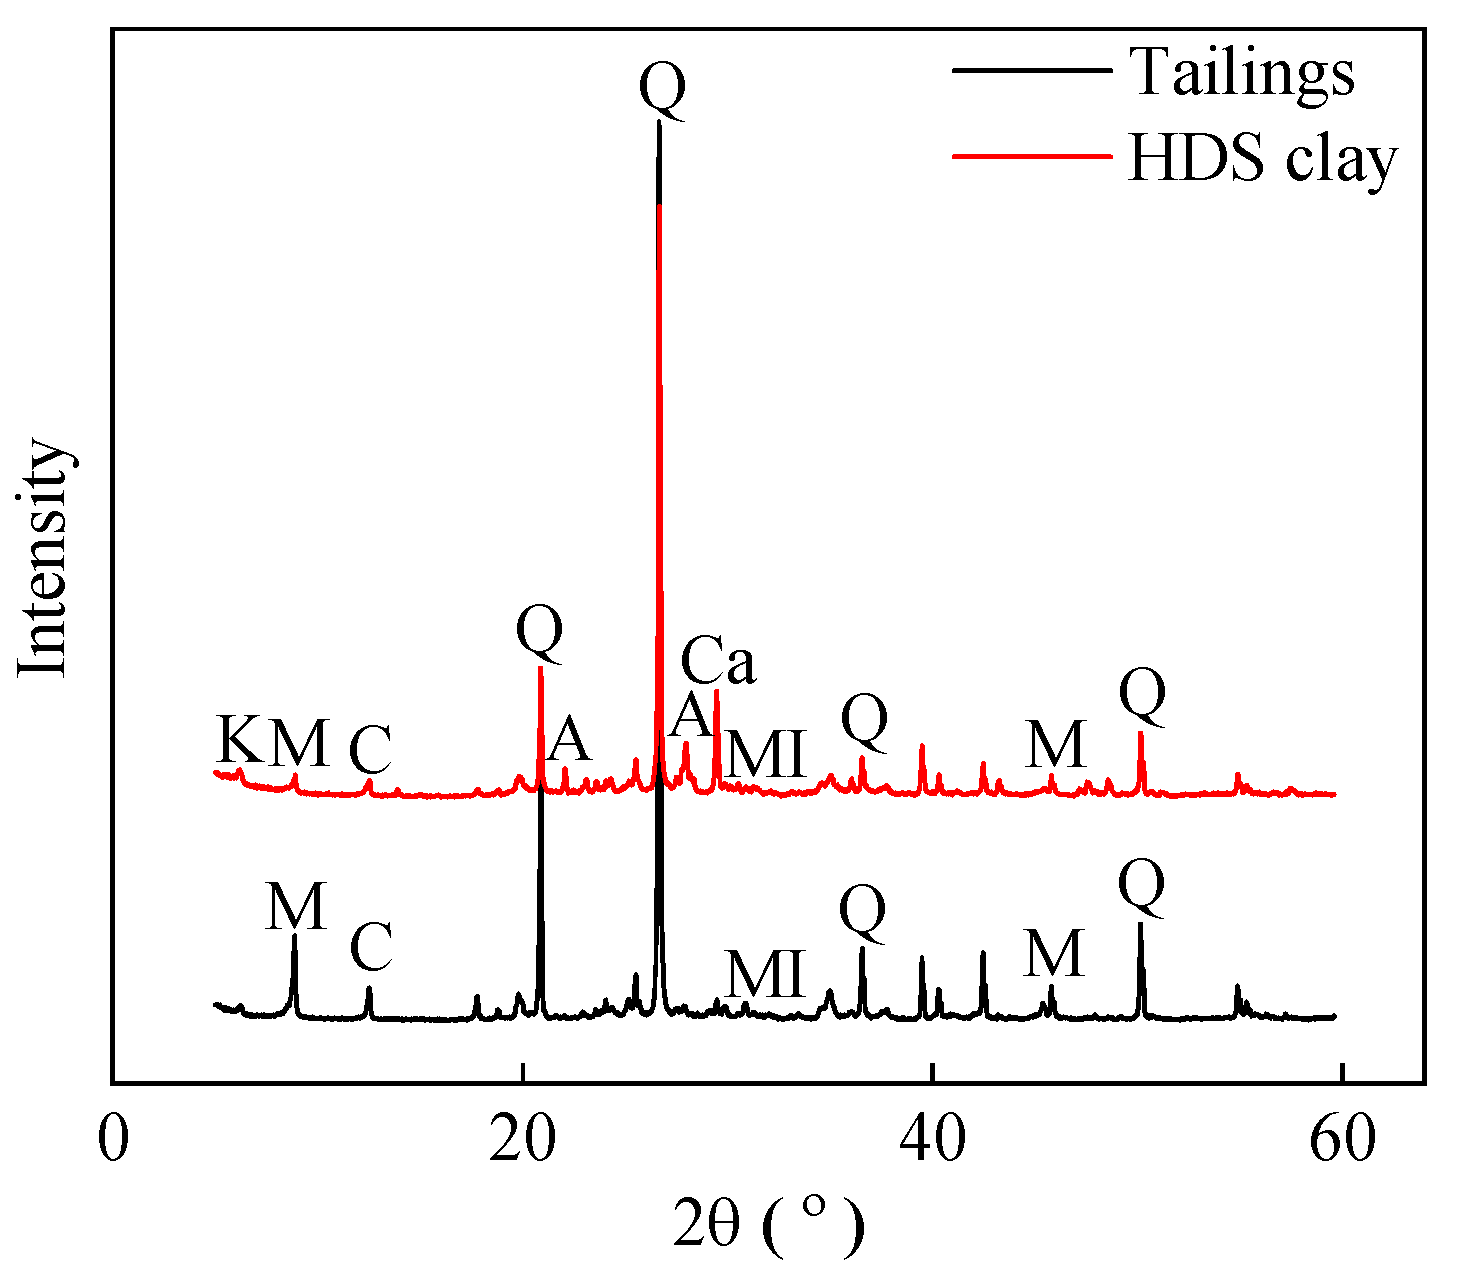
The XRD patterns of tailings and HDS clay were measured with the range from 5 to 60°2θ by the Bruker D8 Advance–X. During the test, the step size and time per step were set at 0.1°2θ and 2 s in this study, respectively. Furthermore, the mineralogical compositions were qualitatively identified by the Jade 9 Program.

4.2. Test Procedures

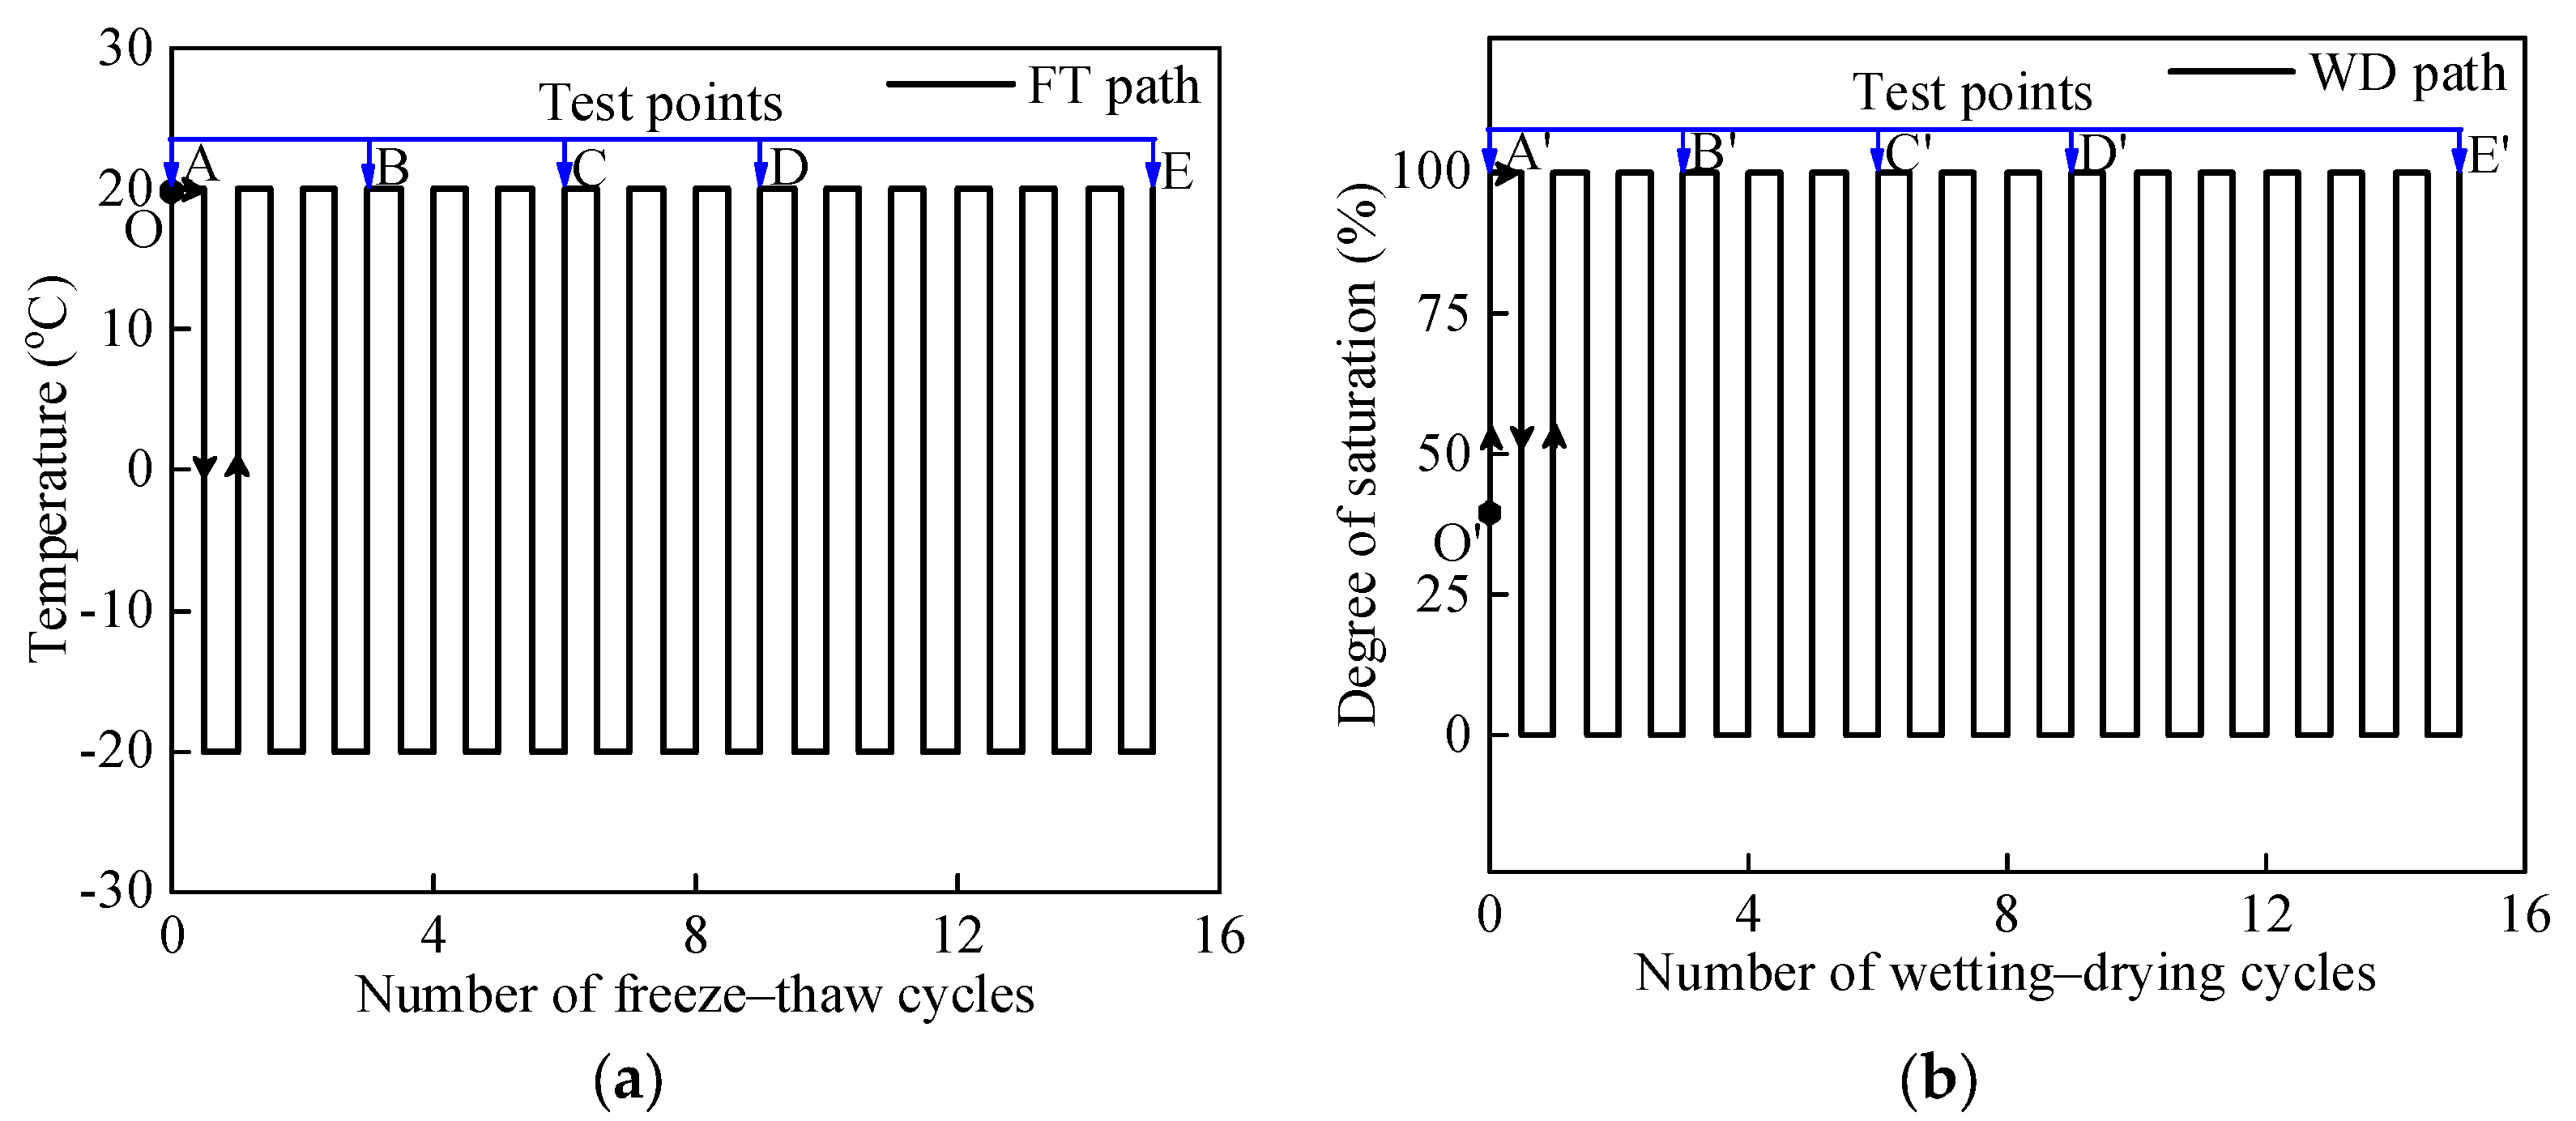
For the first series of tests, a freeze–thaw cycle is defined as keeping the specimen in the container at 20 °C and −20 °C for 12 h, respectively [27]. The test paths of the freeze–thaw cycle tests are shown in Figure 5a. After specimen preparation, the initial state of the modified tailings is represented by point O. Subsequently, the specimens underwent the ordered freeze–thaw cycles before the infiltration tests (i.e., O→A, O→B, O→C, O→D, O→E), corresponding to 0, 3, 6, 9, and 15 cycles, respectively. After the freeze–thaw cycles, the specimens were saturated by the vacuum saturator for 12 h. The saturated specimens were then carefully placed in the variable–head permeameter. During the ksat tests, the pressure head, water temperature and time were recorded. In addition, the ksat of specimens was tested five times, and the average value was used.
For the second series of tests, a wetting–drying cycle is defined as keeping the specimen in the vacuum saturator and the air–blowing thermostatic oven for 12 h, respectively (Figure 5b). The pore water pressure and drying temperature were maintained at −80 kPa and 105 °C, respectively. The initial state (i.e., O’) and the sequenced wetting–drying cycles (i.e., O’→A’, O’→B’, O’→C’, O’→D’, O’→E’) follow a pattern similar to that of the freeze–thaw cycle tests. After the wetting–drying cycle tests, the variable–head permeameter is also utilized to measure the ksat of the modified tailings.

5. Interpretations of Experimental Results

5.1. Mineralogical Analysis of Tailings and HDS Clay

The XRD patterns of tailings and HDS clay are shown in Figure 6. For the tailings, the non–clay minerals, including quartz, albite, and microcline, were identified, while the clay minerals mainly consisted of muscovite and clinochlore. Compared to the mineralogical compositions of the tailings, calcite and kaolinite were additionally identified in the HDS clay as non–clay and clay minerals, respectively. Among the mineral compositions, muscovite, clinochlore, kaolinite and calcite are minerals with low hardness, whereas quartz, albite and microcline have high hardness. According to previous studies [28,29], minerals with low hardness are susceptible to physical weathering (i.e., disintegration and breakage). In addition, based on the studies of Garcia Giménez et al. (2012) [30], Liu et al. (2016) [31], and Yao et al. (2019) [32], muscovite and calcite are predominantly coarse–grained minerals, with the latter also being prone to chemical weathering due to its chemical composition. It is worth noting that the X–ray diffraction patterns after the freeze–thaw and wetting–drying cycles showed similar peaks to those observed before the cycles (i.e., peaks at natural states), thereby owning the identical mineralogical composition. Consequently, only the X–ray diffraction patterns before the cycles are shown in Figure 2. Similar results in soils and rocks (e.g., loess and slate rock) were also observed in previous studies [33,34,35,36].

5.2. Freeze–Thaw Cycles

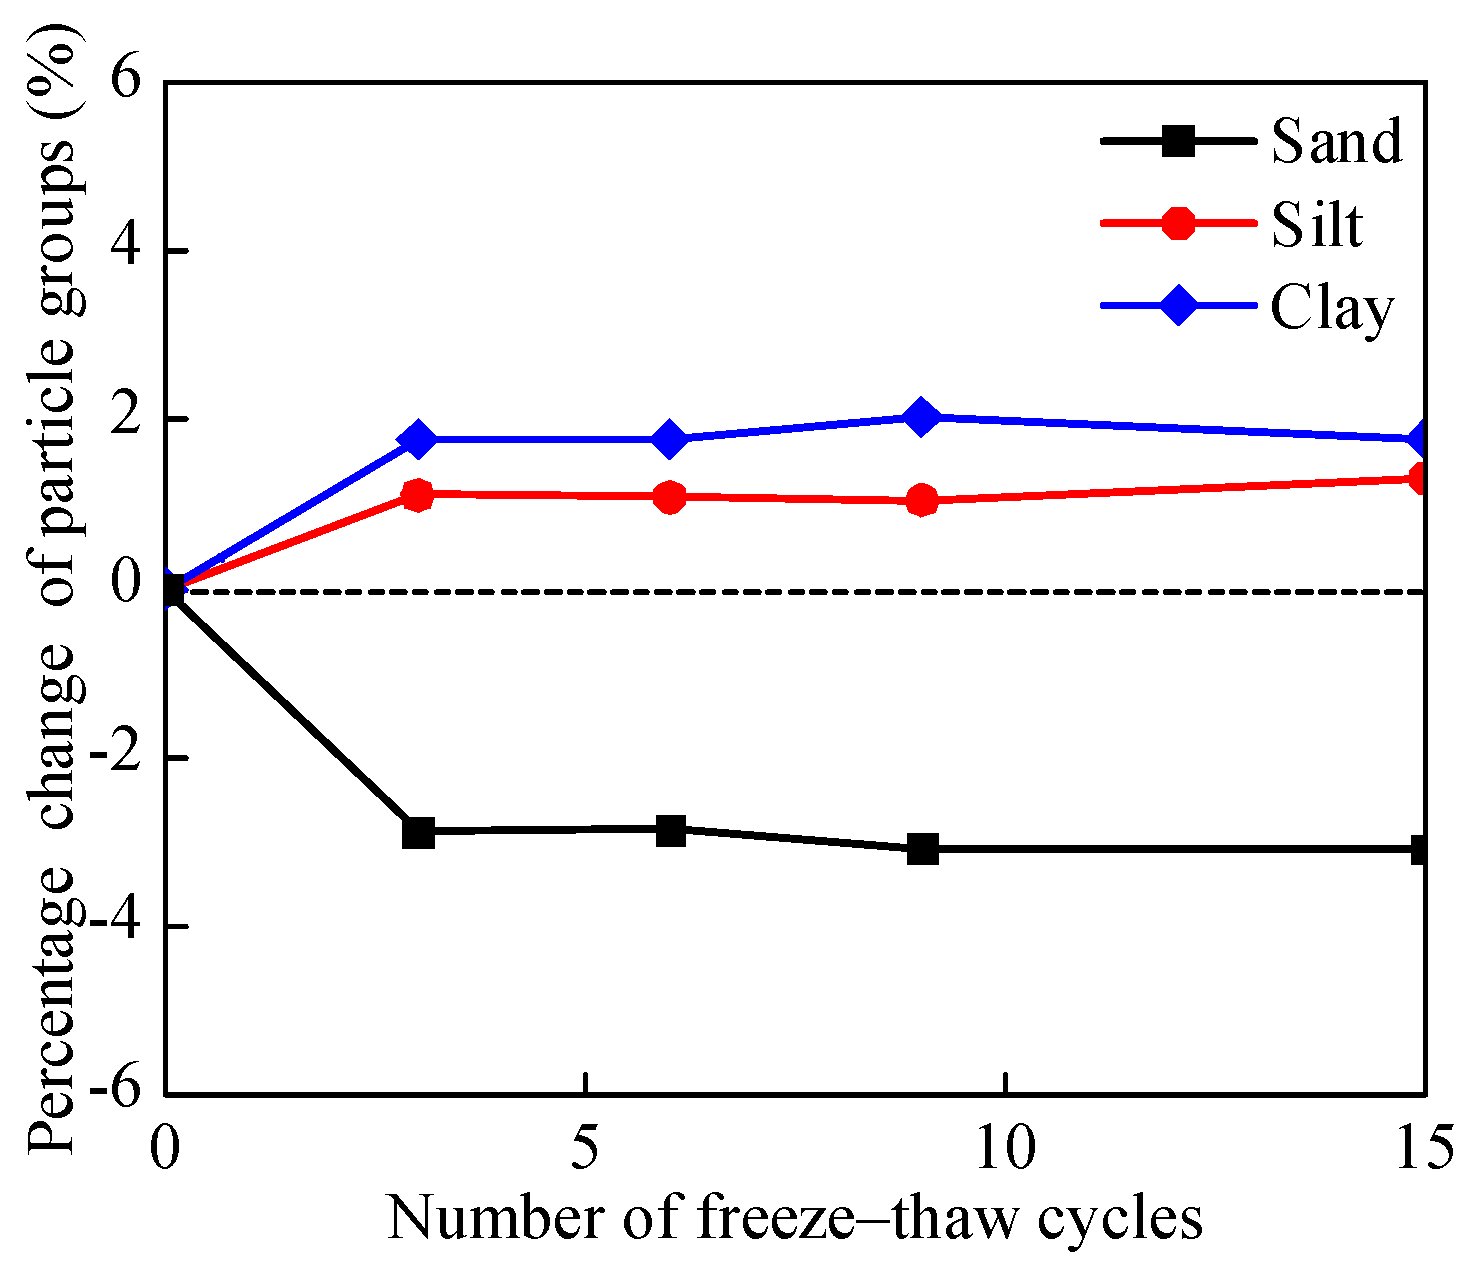
The fraction changes in clay, silt and sand in the modified tailings after freeze–thaw cycles are shown in Figure 7. The dotted line is used as reference line for the percentage change in particle groups. With the increasing number of freeze–thaw cycles, the fractions of clay and silt initially increased and then stabilized, while the fraction of sand decreased correspondingly. The fractions of clay and silt rose by 1.7% and 1.1% after three freeze–thaw cycles, corresponding to 25.8% and 4.5% of the initial content, respectively. The fractions of clay and silt both changed to less than ± 0.3% after the third freeze–thaw cycle. As shown in the XRD results, minerals with low hardness and coarse grains (i.e., muscovite and calcite) were likely fractured by the ice lens during the initial three freeze–thaw cycles [29,33]; meanwhile, the ice lenses had little effect on the high–hardness minerals with coarse grains.
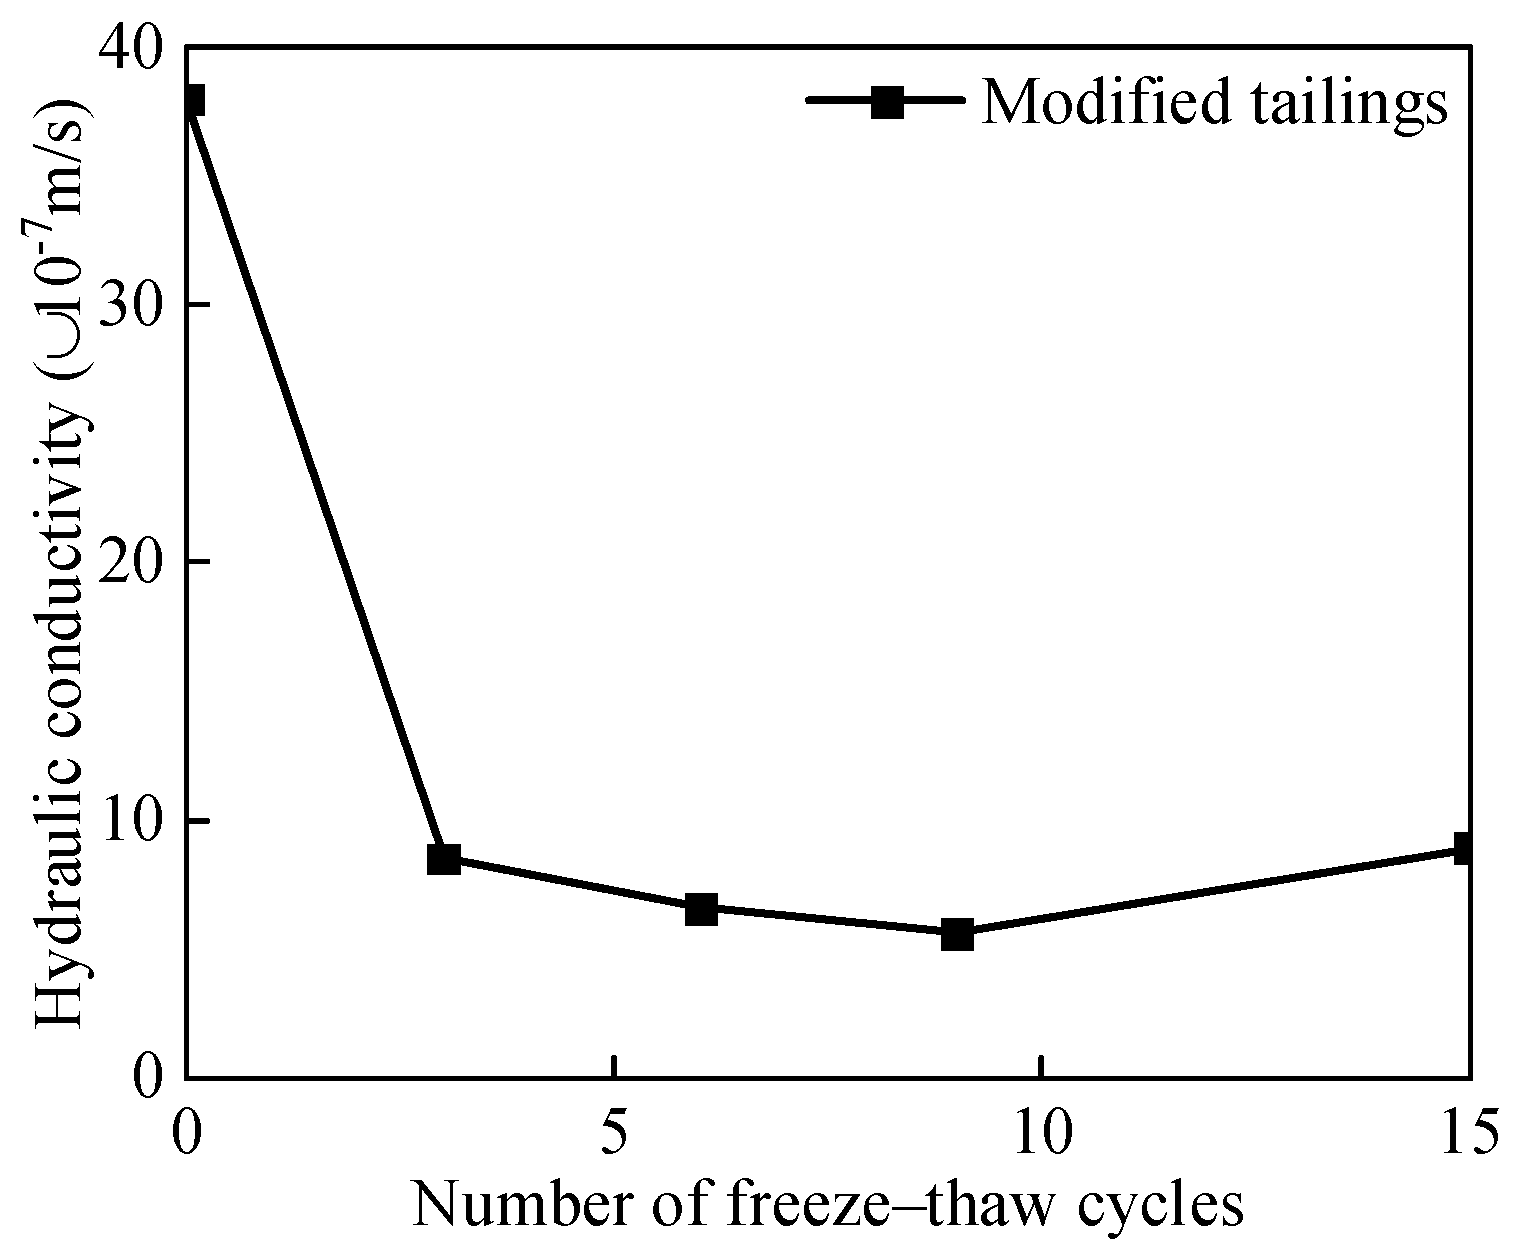
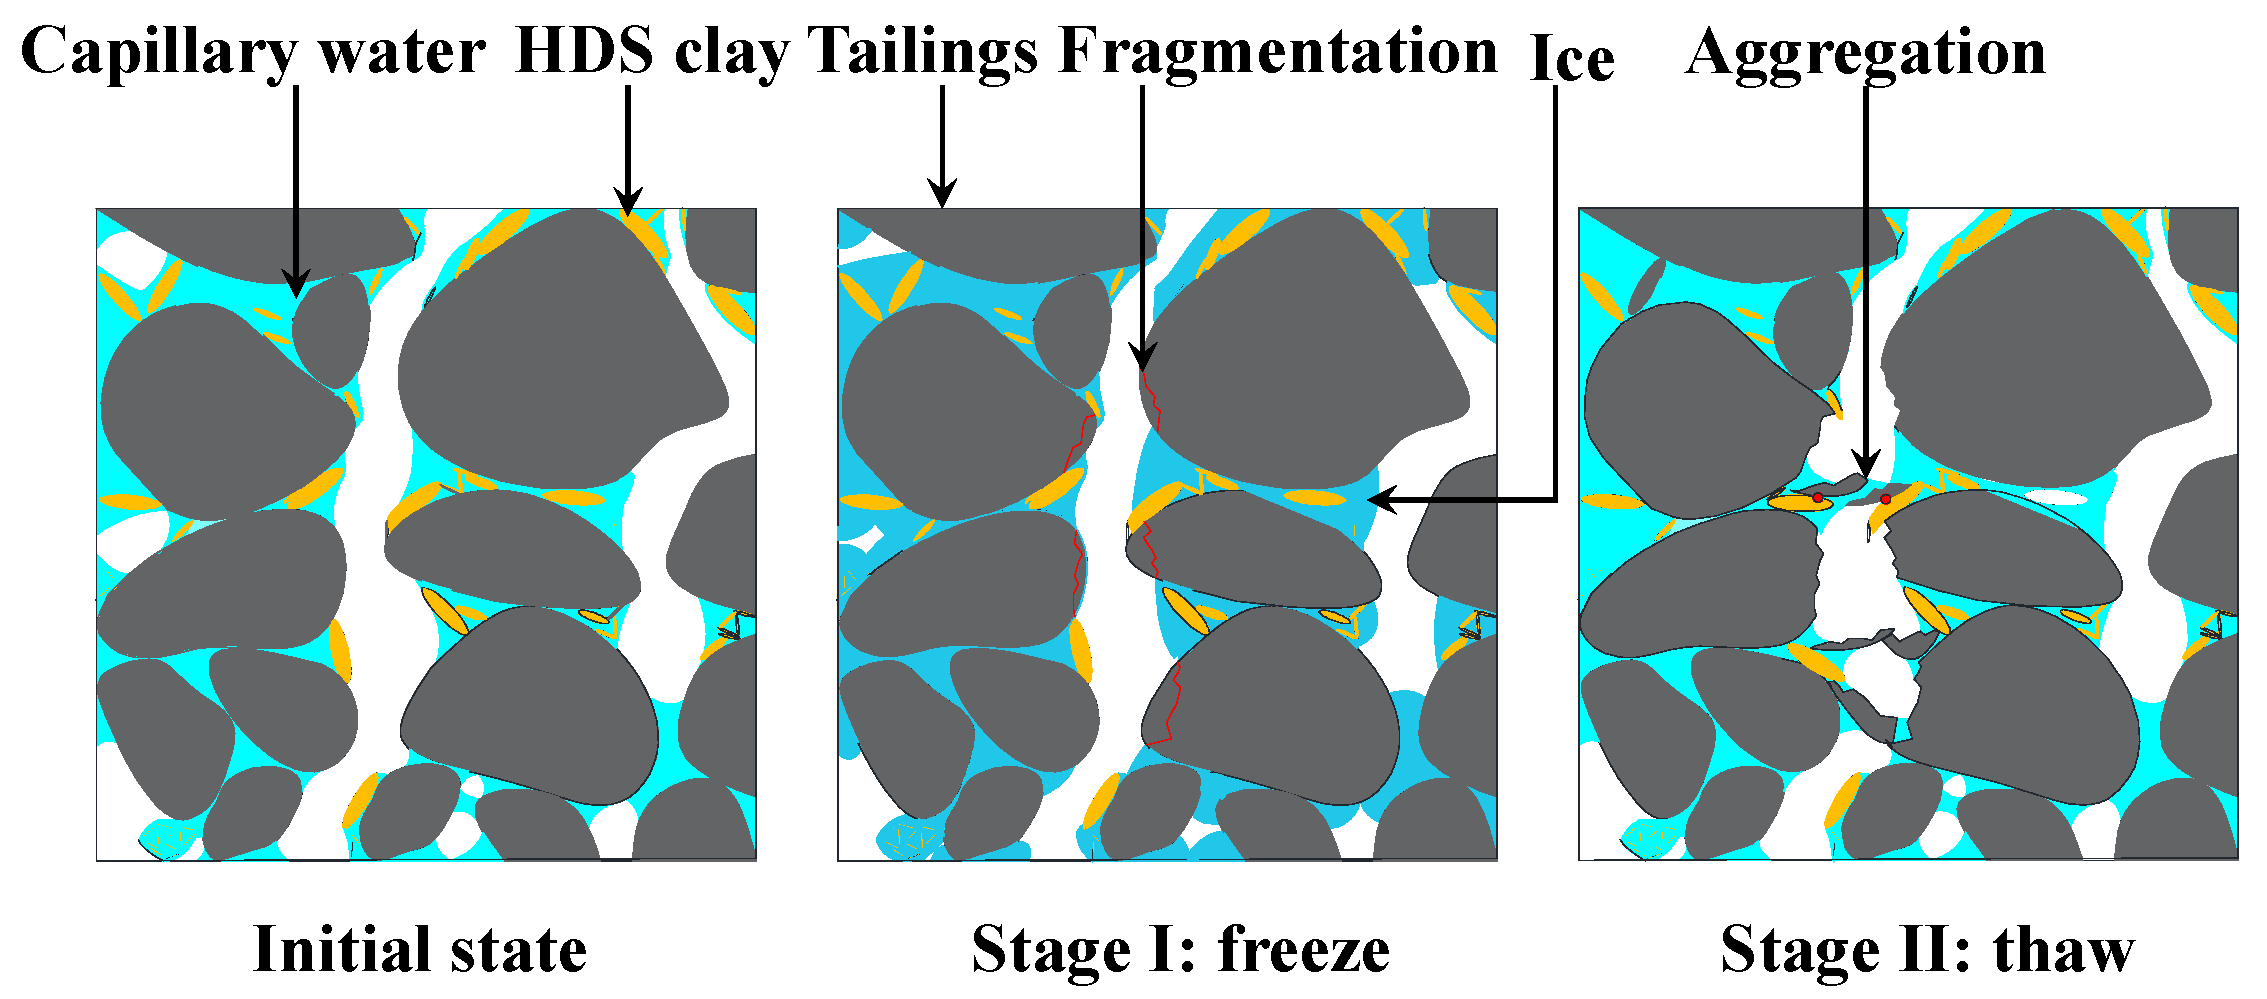
The ksat of modified tailings subjected to freeze–thaw cycles is shown in Figure 8. Similar to the changes in sand content, the ksat of modified tailings initially decreased and then stabilized. Compared to the initial ksat (i.e., 3.8 × 10⁻⁶ m/s), the value after three freeze–thaw cycles decreased by 77.6% (i.e., 8.5 × 10⁻⁷ m/s) and then remained nearly unchanged (i.e., 5.6 × 10⁻⁷ m/s–8.9 × 10−7 m/s) in subsequent cycles. This is attributed to the aforementioned increase in the fine grain content (3.1%), which decreases the ksat of porous materials [15,20,37]. In addition, the potential clogging of pore throats by these fines may further decrease ksat [37] (e.g., schematic drawing in Figure 9). During freeze–thaw cycles, the capillary water at the initial state (Sr = 39.6%) is the source for ice phase generation. The growing ice lens can generate surface pressure (100–460 kPa), potentially causing the breakage of coarse grains and the creation of fine grains [20]. Both the redistribution of capillary water during subsequent thawing and the effects of stress (e.g., gravity and electrical forces) contribute to the migration of fine grains toward the pore throat area [20]. Subsequently, deposition and potentially clogging occur near pore throats.

5.3. Wetting–Drying Cycles

The evolution of clay, silt and sand fractions in the modified tailings during 15 wetting–drying cycles is shown in Figure 10. The dotted line is used as reference line for the percentage change in particle groups. During the initial nine cycles, the fractions of clay and silt increased by 1.8% and 2.1%, respectively, and then stabilized (±0.3%). The sand fraction decreased by (3.9%) during the first nine cycles and then subsequently stabilized (±0.3%). The stabilization of particle group changes induced by wetting–drying cycles took longer than that of freeze–thaw cycles, mainly because of their different physical processes [38]. The fragmentation, denudation, dissolution–reprecipitation and aggregation occur during the wetting–drying cycles [11,31,34], while the freeze–thaw cycle process mainly involves fragmentation [33,39]. Consequently, a more prolonged stabilization process is needed for the wetting–drying cycles.
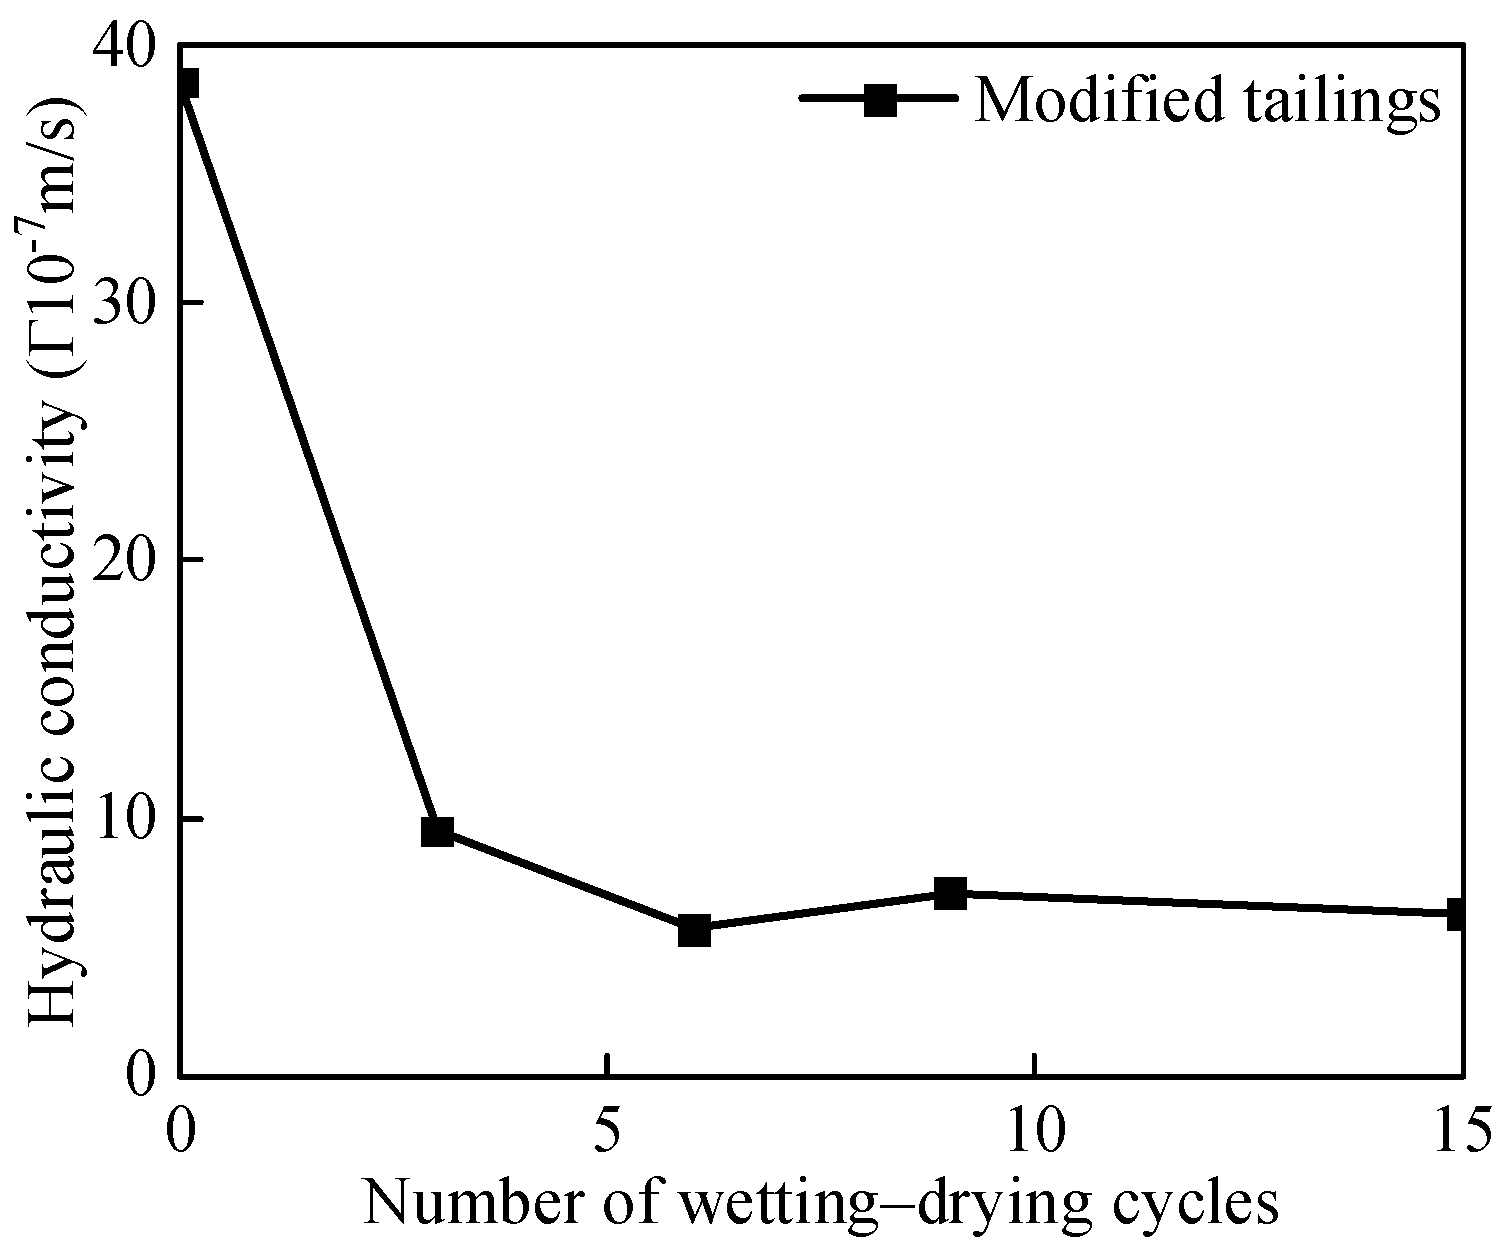
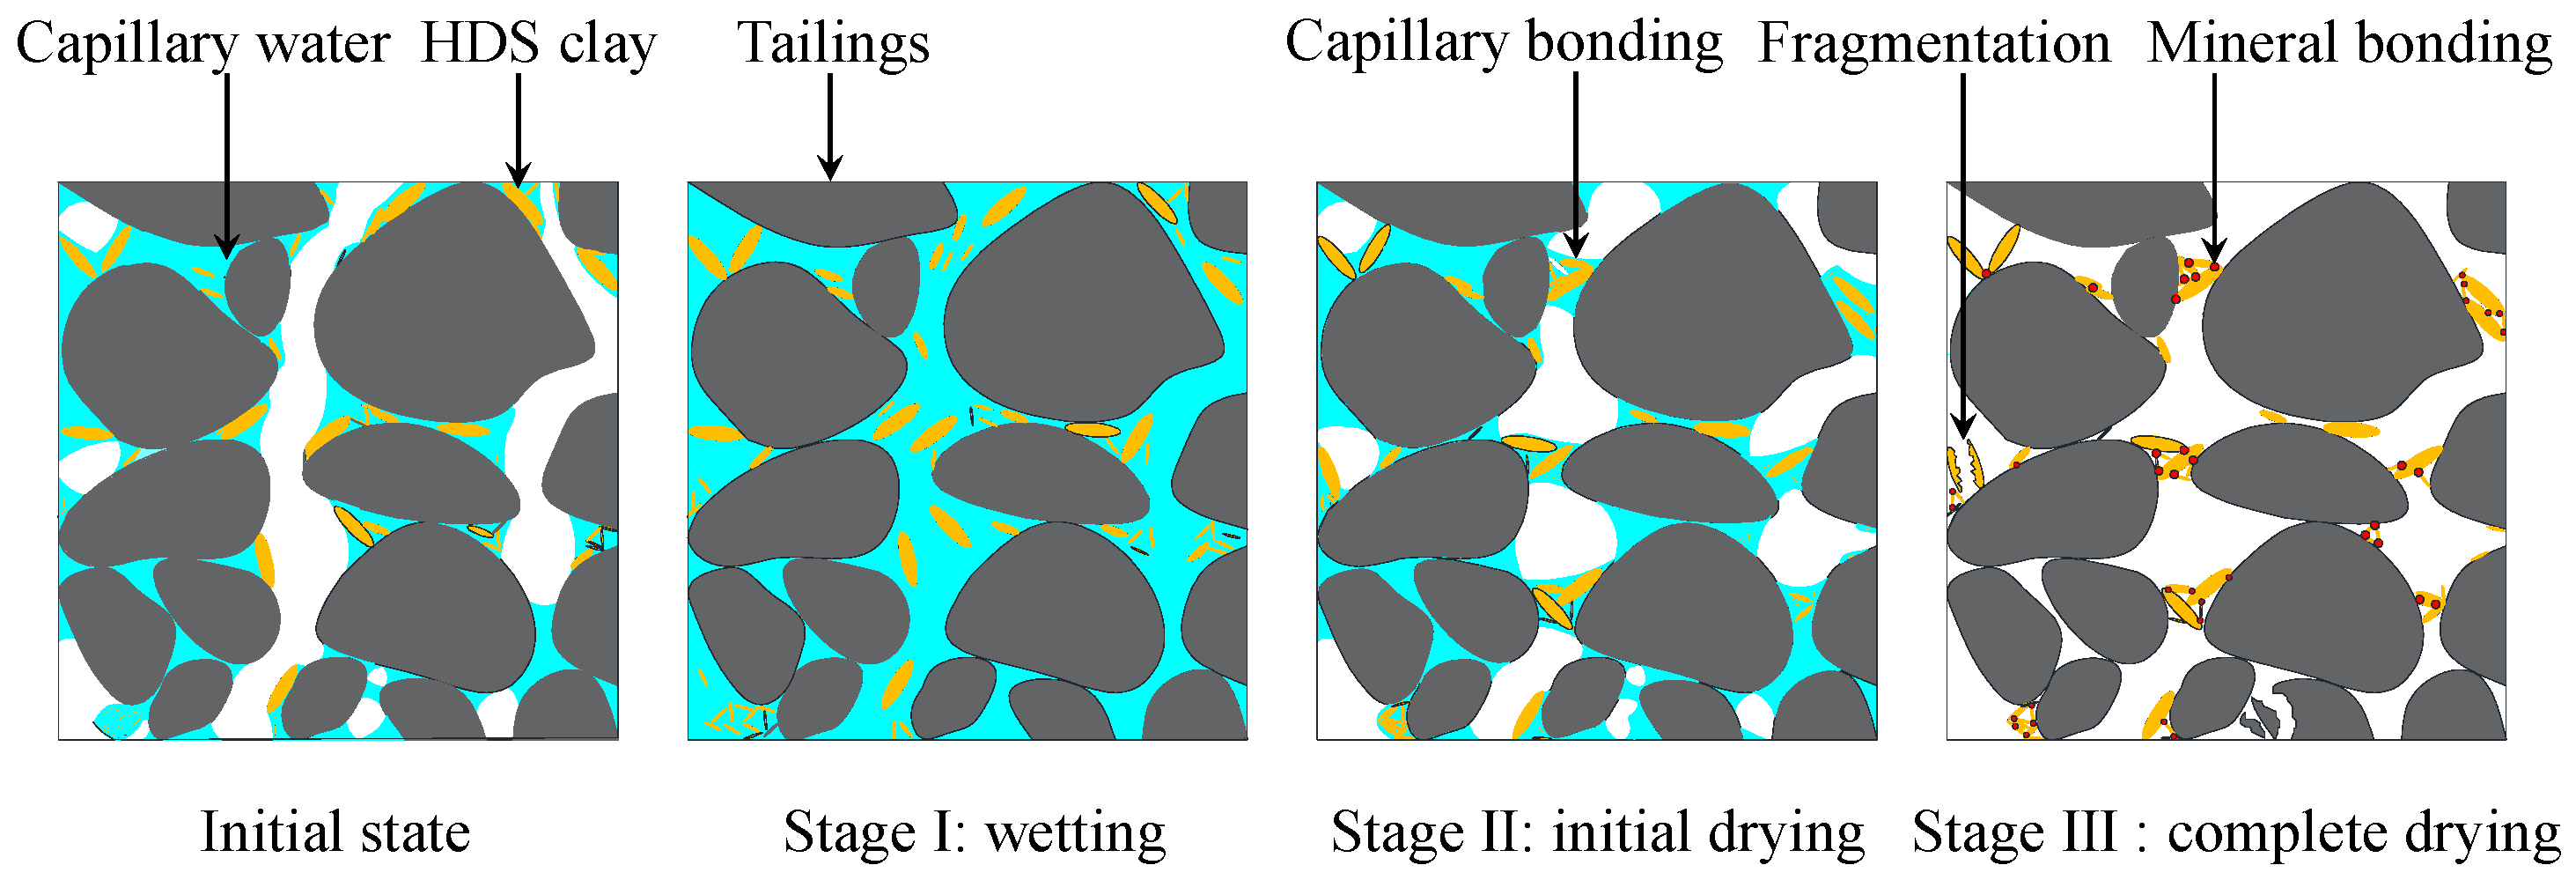
For the infiltration tests after wetting–drying cycles, the ksat of modified tailings is shown in Figure 11. The ksat decreased from 3.9 × 10⁻⁶ m/s to 9.5 × 10⁻⁷ m/s after three freeze–thaw cycles, corresponding to a 25.0% drop from the initial value. After that, the ksat stabilized within the range of 5.7 × 10⁻⁷ m/s to 6.3 × 10⁻⁷ m/s. The increase in fine grain content (3.8%) contributed to the decrease in ksat. In addition, the fines, the preferred deposition of which is near the pore throat area, may further exacerbate this decreasing trend through the narrowing and potential clogging of pore throats [11,13,40,41,42] (e.g., schematic drawing in Figure 12). During wetting–drying cycles, the fine portion (i.e., clay and silt) of the modified tailings at the initial state is fully hydrated upon saturation. In the subsequent drying process, the fine portion tends to accumulate at water–air interface (meniscus) and migrates with the receding meniscus. During drying, the meniscus preferentially resides near pore throats due to high matric suction (Laplace equation). Meanwhile, the fine portion accumulates and deposits near the pore throat area, driven by favorable attractive interparticle forces, namely van der Waals interactions and the Coulomb attraction. This could be explained by the shrinkage of the electrical diffuse layer at reduced water content and increased salinity.

5.4. Future Outlook

In this study, the ksat of modified tailings was tested after specified freeze–thaw cycles and wetting–drying cycles. However, the mechanism of the capillary barrier is based on the kusat of different materials, which is controlled by the water retention behavior and ksat. According to previous studies [43,44,45], the water retention behaviors of soils (e.g., sand, silt and clay) are significantly changed by freeze–thaw cycles and wetting–drying cycles. Mu et al. (2020) [43] reported that both the air–entry value and degree of hysteresis of loess decreased with the increase in wetting–drying cycles. Zhao et al. (2021) [45] summarized that the water retention capacity of clay was reduced in the low suction range and remained unchanged after the 10th freeze–thaw cycle. It is clear that the parameters of water retention curves (e.g., air–entry value and degree of hysteresis) constitute the other critical aspect of this work. Consequently, the water retention behavior of modified tailings, subjected to the ordered freeze–thaw and wetting–drying cycles, is essential to future work.

6. Conclusions

Two–series infiltration tests, conducted after 0, 3, 6, 9, and 15 freeze–thaw cycles and wetting–drying cycles, were carried out in this study to investigate the ksat of modified tailings. The following conclusions were drawn:
(1)
For the changes in particle groups during freeze–thaw cycles, the fractions of clay and silt initially increased by 1.7% and 1.1% after three cycles and then changed by less than ± 0.3% in the subsequent cycles. As shown in the XRD results, this is probably because minerals with low hardness and coarse grains (i.e., muscovite and calcite) were broken by ice lenses during the initial several tests.
(2)
Compared to the initial ksat (i.e., 3.8 × 10⁻⁶ m/s) of modified tailings, the value after three freeze–thaw cycles decreased by 77.6% and then remained nearly unchanged in subsequent cycles. This is attributed to the increased fine content caused by ice lenses during freeze–thaw cycles. In addition, the potential clogging of pore throats by these fines may further reduce ksat through the redistribution of capillary water upon thawing and the effect of stress (e.g., gravity and electrical forces).
(3)
For the wetting–drying cycles, the fraction changes in clay and silt gradually stabilized (i.e., 1.8% and 2.1%) until the ninth wetting–drying cycle. The stabilization of particle group changes induced by wetting–drying cycles took longer than those from freeze–thaw cycles, mainly because of the more complex physical processes of the former.
(4)
The ksat first decreased after three wetting–drying cycles (i.e., 3.9 × 10⁻⁶ m/s to 9.5 × 10⁻⁷ m/s) and then almost remained unchanged. The increase in fines and their preferential deposition near the pore throat area are certainly and possibly the governing mechanisms for this decreasing trend, respectively. Furthermore, the trends of ksat in wetting–drying cycles are similarly observed during freeze–thaw cycles, despite the longer stabilization process of particle groups for the former. This is probably because fragmentation is the main influencing factor for ksat, regardless of the type of cycle.
(5)
As another critical aspect of the present study, in further work, the water retention behavior of modified tailings will be investigated under different freeze–thaw cycles and wetting–drying cycles. The parameters of water retention curves (e.g., air–entry value and degree of hysteresis) will be discussed in detail.

Author Contributions

Conceptualization, L.X., L.M. and B.B.; Methodology, L.X., L.M. and B.B.; Validation, L.M.; Investigation, L.X. and L.M.; Data curation, L.M. and M.X.; Writing—original draft, L.M.; Writing—review and editing, L.M., M.X., S.N., J.C., W.W., A.D., H.G. and B.B. All authors have read and agreed to the published version of the manuscript.

Funding

This research was funded by the Ministry of Science and Technology of China, grant number 2019YFC1805002, the National natural Science Foundation of China, grant number 42177118, and the Basic Science Center Program for Multiphase Evolution in Hypergravity of the National Natural Science Foundation of China, grant number 51988101.

Data Availability Statement

Data sharing not applicable.

Acknowledgments

We would like to express our sincere gratitude to the anonymous reviewers for their feedback and constructive criticism, which have greatly improved the quality of this manuscript. We would also like to acknowledge the contributions of all those who have supported this research project.

Conflicts of Interest

The authors declare no conflicts of interest.

References

  1. Zhan, G.S.; Keller, J.; Milczarek, M.; Giraudo, J. 11 years of evapotranspiration cover performance at the AA leach pad at Barrick Goldstrike Mines. Mine Water Environ. 2014, 33, 195. [Google Scholar] [CrossRef]
  2. Bossé, B.; Bussière, B.; Hakkou, R.; Maqsoud, A.; Benzaazoua, M. Field experimental cells to assess hydrogeological behaviour of store-and-release covers made with phosphate mine waste. Can. Geotech. J. 2015, 52, 1255–1269. [Google Scholar] [CrossRef]
  3. Dong, Y.B.; Liu, Z.R.; Liu, W.; Lin, H. A new organosilane passivation agent prepared at ambient temperatures to inhibit pyrite oxidation for acid mine drainage control. J. Environ. Manag. 2022, 320, 115835. [Google Scholar] [CrossRef]
  4. Xia, L.X.; Chen, J.K.; Yang, Y.X.; Zhao, H.F.; Zhan, L.T.; Bate, B. Hydrogeochemical Responses of MTMS-Coated Capillary Cover Under Heavy Rainfalls. Sustainability 2023, 15, 6667. [Google Scholar] [CrossRef]
  5. Chen, J.K.; Xia, L.X.; Yang, Y.X.; Mulati, D.; Zhang, S.; Zhan, L.T.; Chen, Y.M.; Bate, B. Polymer-modified bentonites with low hydraulic conductivity and improved chemical compatibility as barriers for Cu2+ containment. Acta Geotech. 2023, 18, 1629–1649. [Google Scholar]
  6. Maqsoud, A.; Bussiere, B.; Aubertin, M.; Chouteau, M.; Mbonimpa, M. Field investigation of a suction break designed to control slope-induced desaturation in an oxygen barrier. Can. Geotech. J. 2022, 48, 53–71. [Google Scholar] [CrossRef]
  7. Harnas, F.R.; Rahardjo, H.; Leong, E.C.; Wang, J.Y. Experimental study on dual capillary barrier using recycled asphalt pavement materials. Can. Geotech. J. 2014, 51, 1165–1177. [Google Scholar] [CrossRef]
  8. Ng, C.W.; Coo, J.L.; Chen, Z.K.; Chen, R. Water infiltration into a new three-layer landfill cover system. J. Environ. Manag. 2016, 142, 04016007. [Google Scholar] [CrossRef]
  9. Zhan, L.T.; Li, G.Y.; Jiao, W.G.; Wu, T.; Lan, J.W.; Chen, Y.M. Field measurements of water storage capacity in a loess–gravel capillary barrier cover using rainfall simulation tests. Can. Geotech. J. 2017, 54, 1523–1536. [Google Scholar] [CrossRef]
  10. Ng, C.W.W.; Guo, H.W.; Ni, J.J.; Chen, R.; Xue, Q.; Zhang, Y.M.; Feng, Y.; Chen, Z.K.; Feng, S.; Zhang, Q. Long-term field performance of non-vegetated and vegetated three-layer landfill cover systems using construction waste without geomembrane. Géotechnique 2022, 74, 155–173. [Google Scholar] [CrossRef]
  11. Mu, Q.Y.; Dong, H.; Liao, H.J.; Zhou, C.; Li, S.B.; Zhang, J.W. Effects of in situ wetting–drying cycles on the mechanical behaviour of an intact loess. Can. Geotech. J. 2022, 59, 1281–1284. [Google Scholar] [CrossRef]
  12. Azizi, A.; Musso, G.; Jommi, C. Effects of repeated hydraulic loads on microstructure and hydraulic behaviour of a compacted clayey silt. Can. Geotech. J. 2020, 57, 100–114. [Google Scholar] [CrossRef]
  13. Mu, Q.Y.; Meng, L.L.; Shen, Y.Q.; Zhou, C.; Gu, Z.L. Effects of clay content on the desiccation cracking behavior of low-plasticity soils. Bull. Eng. Geol. Environ. 2023, 82, 317. [Google Scholar] [CrossRef]
  14. Kim, W.H.; Daniel, D.E. Effects of freezing on hydraulic conductivity of compacted clay. J. Geotech. Geoenviron. 1992, 118, 1083–1097. [Google Scholar] [CrossRef]
  15. Albrecht, B.A.; Benson, C.H. Effect of desiccation on compacted natural clays. J. Geotech. Geoenviron. 2001, 127, 67–75. [Google Scholar] [CrossRef]
  16. Ng, C.W.W.; Wong, H.N.; Tse, Y.M.; Pappin, J.W.; Sun, H.W.; Millis, S.W.; Leung, A.K. A field study of stress-dependent soil–water characteristic curves and permeability of a saprolitic slope in Hong Kong. Geotechnique 2011, 61, 511–521. [Google Scholar] [CrossRef]
  17. Tang, Y.Q.; Yan, J.J. Effect of freeze–thaw on hydraulic conductivity and microstructure of soft soil in Shanghai area. Environ. Earth Sci. 2015, 73, 7679–7690. [Google Scholar] [CrossRef]
  18. Thyagaraj, T.; Julina, M. Effect of pore fluid and wet-dry cycles on structure and hydraulic conductivity of clay. Geotech. Lett. 2019, 9, 348–354. [Google Scholar] [CrossRef]
  19. Xu, J.; Li, Y.F.; Wang, B.; Wang, Z.F.; Wang, S.H. Microstructure and Permeability of Bentonite-Modified Loess after Wetting–Drying Cycles. Int. J. Geomech. 2023, 23, 04023052. [Google Scholar] [CrossRef]
  20. Shen, J.J.; Wang, Q.; Chen, Y.T.; Han, Y.; Zhang, X.D.; Liu, Y.W. Evolution process of the microstructure of saline soil with different compaction degrees during freeze-thaw cycles. Eng. Geol. 2022, 304, 106699. [Google Scholar] [CrossRef]
  21. Smesrud, J.K.; Selker, J.S. Effect of soil-particle size contrast on capillary barrier performance. J. Geotech. Geoenviron. Eng. 2001, 127, 885–888. [Google Scholar] [CrossRef]
  22. Parent, S.-É.; Cabral, A. Design of inclined covers with capillary barrier effect. Geotech. Geol. Eng. 2006, 24, 689–710. [Google Scholar] [CrossRef]
  23. ASTM D4318-10; Standard Test Methods for Liquid Limit, Plastic Limit, and Plasticity Index of Soils. ASTM International: West Conshohocken, PA, USA, 2010.
  24. ASTM D2487-11; Standard Practice for Classification of Soils for Engineering Purposes (Unified Soil Classification System). ASTM International: West Conshohocken, PA, USA, 2011.
  25. Scarfone, R.; Wheeler, S.J.; Smith, C.C. Numerical modelling of the application of capillary barrier systems for prevention of rainfall-induced slope instability. Acta Geotech. 2023, 18, 355–378. [Google Scholar] [CrossRef]
  26. Zhang, G.P.; Germaine, J.T.; Martin, R.T.; Whittle, A.J. A simple sample-mounting method for random powder X-ray diffraction. Clays Clay Miner. 2003, 51, 218–225. [Google Scholar] [CrossRef]
  27. Liu, Z.Y.; Liu, J.K.; Li, X.; Fang, J.H. Experimental study on the volume and strength change of an unsaturated silty clay upon freezing. Cold Reg. Sci. Technol. 2019, 157, 1–12. [Google Scholar] [CrossRef]
  28. Villagran, X.S.; Poch, R.M. A new form of needle-fiber calcite produced by physical weathering of shells. Geoderma 2014, 213, 173–177. [Google Scholar] [CrossRef]
  29. Wild, B.; Daval, D.; Guyot, F.; Knauss, K.G.; Pollet-Villard, M.; Imfeld, G. pH dependent control of feldspar dissolution rate by altered surface layers. Chem. Geol. 2016, 442, 148–159. [Google Scholar] [CrossRef]
  30. Garcia Giménez, R.; Vigil de la Villa, R.; González Martín, J.A. Characterization of loess in central Spain: A microstructural study. Environ. Earth Sci. 2012, 65, 2125–2137. [Google Scholar] [CrossRef]
  31. Liu, Z.; Liu, F.Y.; Ma, F.L.; Wang, M.; Bai, X.H.; Zheng, Y.L.; Yin, H.; Zhang, G.P. Collapsibility, composition, and microstructure of loess in China. Can. Geotech. J. 2016, 53, 673–686. [Google Scholar] [CrossRef]
  32. Yao, G.; Zang, H.; Wang, J.X.; Wu, P.; Qiu, J.; Lyu, X.J. Effect of mechanical activation on the pozzolanic activity of muscovite. Clays Clay Miner. 2019, 67, 209–216. [Google Scholar] [CrossRef]
  33. Zhai, J.B.; Zhang, Z.; Melnikov, A.; Zhang, M.Y.; Yang, L.Z.; Jin, D.D. Experimental study on the effect of freeze-thaw cycles on the mineral particle fragmentation and aggregation with different soil types. Minerals 2021, 11, 913. [Google Scholar] [CrossRef]
  34. Zhou, W.; Cheng, J.L.; Zhang, G.K.; Li, H.B.; Cheng, Y.G.; Ma, G.; Ji, X. Effects of wetting–drying cycles on the breakage characteristics of slate rock grains. Rock Mech. Rock Eng. 2021, 54, 6323–6337. [Google Scholar] [CrossRef]
  35. Li, X.M.; Di, S.J.; Shi, L.; Zhang, Y.; Huang, P.; Mu, Q.Y. Effects of in-situ drying–wetting cycles on the stress-dependent water retention behavior of intact loess. Adv. Civ. Eng. 2023, 2023, 2994986. [Google Scholar] [CrossRef]
  36. Khanlari, G.; Abdilor, Y. Influence of wet–dry, freeze–thaw, and heat–cool cycles on the physical and mechanical properties of Upper Red sandstones in central Iran. Bull. Eng. Geol. Environ. 2015, 74, 1287–1300. [Google Scholar] [CrossRef]
  37. Xu, W.S.; Li, K.S.; Chen, L.X.; Kong, W.H.; Liu, C.X. The impacts of freeze–thaw cycles on saturated hydraulic conductivity and microstructure of saline–alkali soils. Sci. Rep. 2021, 11, 18655. [Google Scholar] [CrossRef] [PubMed]
  38. Zhao, G.T.; Han, Z.; Zou, W.L.; Wang, X.Q. Evolution of mechanical behaviours of an expansive soil during drying-wetting, freeze–thaw, and drying-wetting-freeze–thaw cycles. Bull. Eng. Geol. Environ. 2021, 80, 8109–8121. [Google Scholar] [CrossRef]
  39. Eigenbrod, K.D. Effects of cyclic freezing and thawing on volume changes and permeabilities of soft fine-gained soils. Can. Geotech. J. 1996, 33, 529–537. [Google Scholar] [CrossRef]
  40. Liu, P.F.; Nie, S.K.; Wang, W.Y.; Zhang, S.; Bate, B.; Chen, Y. CFD-DEM study on transport and retention behaviors of nZVI-clay colloids in porous media. J. Hazard. Mater. 2023, 465, 133048. [Google Scholar] [CrossRef]
  41. Valdes, J.R.; Santamarina, J.C. Particle clogging in radial flow: Microscale mechanisms. Spe J. 2006, 11, 193–198. [Google Scholar] [CrossRef]
  42. Liu, Q.; Zhao, B.; Santamarina, J.C. Particle migration and clogging in porous media: A convergent flow microfluidics study. J. Geophys. Res. Solid Earth. 2019, 124, 9495–9504. [Google Scholar] [CrossRef]
  43. Mu, Q.Y.; Dong, H.; Liao, H.J.; Dang, Y.J.; Zhou, C. Water-retention curves of loess under wetting−drying cycles. Geotech. Lett. 2020, 10, 135–140. [Google Scholar] [CrossRef]
  44. Ng, C.W.W.; Peprah-Manu, D. Pore structure effects on the water retention behaviour of a compacted silty sand soil subjected to drying-wetting cycles. Eng. Geol. 2023, 313, 106963. [Google Scholar] [CrossRef]
  45. Zhao, G.T.; Zou, W.L.; Han, Z.; Wang, D.X.; Wang, X.Q. Evolution of soil-water and shrinkage characteristics of an expansive clay during freeze-thaw and drying-wetting cycles. Cold Reg. Sci. Technol. 2021, 186, 103275. [Google Scholar] [CrossRef]
Figure 1. Schematic of the inclined two–layer mining capillary barrier system.
Geosciences 14 00093 g001
Figure 2. Copper mine waste: (a) waste rock; (b) tailings; (c) HDS clay (photo courtesy of Dr. Qiong Wang).
Geosciences 14 00093 g002
Figure 3. Particle size distributions of mining materials.
Geosciences 14 00093 g003
Figure 4. Schematic of the test apparatuses.
Geosciences 14 00093 g004
Figure 5. Test paths: (a) Freeze–thaw cycles; (b) wetting–drying cycles.
Geosciences 14 00093 g005
Figure 6. X–ray diffraction patterns of tailings and HDS clay (K: kaolinite; M: muscovite; C: clinochlore; Q: quartz; A: albite; Ca: calcite; and MI: microcline).
Geosciences 14 00093 g006
Figure 7. Percentage change in particle groups of modified tailings under freeze–thaw cycles.
Geosciences 14 00093 g007
Figure 8. The ksat of modified tailings under freeze–thaw cycles.
Geosciences 14 00093 g008
Figure 9. Conceptual illustration of the micro–particles of modified tailings under freeze–thaw cycles.
Geosciences 14 00093 g009
Figure 10. Percentage change in particle groups of modified tailings under wetting–drying cycles.
Geosciences 14 00093 g010
Figure 11. The ksat of modified tailings under wetting–drying cycles.
Geosciences 14 00093 g011
Figure 12. Conceptual illustration of the micro–particles of modified tailings under wetting–drying cycles.
Geosciences 14 00093 g012
Table 1. Typical thickness of capillary barrier system in the literature.
ReferencesLayer Thickness (m)
Fine–Grained LayerCoarse–Grained Layer
Maqsoud et al. (2011) [6]0.80.2
Harnas et al. (2014) [7]0.50.5
Bossé et al. (2015) [2]0.5–1.00.3
Ng et al. (2016) [8]0.40.2
Zhan et al. (2017) [9]0.60.3
Ng et al. (2022) [10]0.60.4
Xia et al. (2023) [4]0.60.4
Table 2. Test programs and soil states in each test series.
SeriesTest IDMaterial TypeInitial State after Specimen Preparation
ρd (g/cm3)w0 (%)Sr0 (%)
I
(Infiltration tests after freeze–thaw cycles)
FT–0Tailings/HDS clay (95:5)1.5011.839.6
FT–3Tailings/HDS clay (95:5)1.5011.839.6
FT–6Tailings/HDS clay (95:5)1.5011.839.6
FT–9Tailings/HDS clay (95:5)1.5011.839.6
FT–15Tailings/HDS clay (95:5)1.5011.839.6
II
(Infiltration tests after wetting–drying cycles)
WD–0Tailings/HDS clay (95:5)1.5011.839.6
WD–3Tailings/HDS clay (95:5)1.5011.839.6
WD–6Tailings/HDS clay (95:5)1.5011.839.6
WD–9Tailings/HDS clay (95:5)1.5011.839.6
WD–15Tailings/HDS clay (95:5)1.5011.839.6
Note: w0, gravimetric water content; ρd, dry density; Sr0, degree of saturation.
Table 3. Physical properties of mining materials.
ParameterModified TailingsTailingsHDS Clay
pH6.76.77.9
Specific gravity2.712.732.37
Particle size distribution
Sand (0.075–4.75 mm, %)69.272.56.6
Silt (0.005–0.075 mm, %)24.222.653.5
Clay (≤0.005 mm, %) 6.64.939.9
Atterberg limits
Liquid limit (%)22.420.561.6
Plastic limit (%)3.81.840.4
Compaction parameters
Standard maximum dry density (g/cm3)1.731.771.16
Optimum water content (%)13.912.447.5
Unified soil classification
(ASTM D 2487–11, 2011)
SMSMMH
Disclaimer/Publisher’s Note: The statements, opinions and data contained in all publications are solely those of the individual author(s) and contributor(s) and not of MDPI and/or the editor(s). MDPI and/or the editor(s) disclaim responsibility for any injury to people or property resulting from any ideas, methods, instructions or products referred to in the content.