

Observation of the Preparation Phase Associated with Mw = 7.2 Haiti Earthquake on 14 August 2021 from a Geophysical Data Point of View


Independent Researcher, 00145 Rome, Italy
Geosciences 2024, 14(4), 96; https://doi.org/10.3390/geosciences14040096
Submission received: 10 February 2024
/
Revised: 17 March 2024
/
Accepted: 26 March 2024
/
Published: 30 March 2024
(This article belongs to the Special Issue Lithosphere-Atmosphere-Ionosphere Coupling during Earthquake Preparation: Recent Advances and Future Perspectives)
Abstract
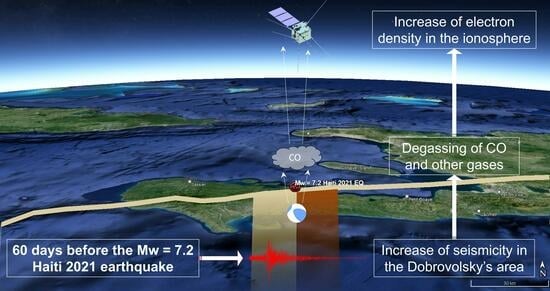
:On 14 August 2021, an earthquake of moment magnitude Mw = 7.2 hit Haiti Island. Unfortunately, it caused several victims and economic damage to the island. While predicting earthquakes is still challenging and has not yet been achieved, studying the preparation phase of such catastrophic events may improve our knowledge and pose the basis for future predictions of earthquakes. In this paper, the six months that preceded the Haiti earthquake are analysed, investigating the lithosphere (by seismic catalogue), atmosphere (by climatological archive) and ionosphere by China Seismo-Electromagnetic Satellite (CSES-01) and Swarm satellites, as well as Total Electron Content (TEC) data. Several anomalies have been extracted from the analysed parameters using different techniques. A comparison, especially between the different layers, could increase or decrease the probability that a specific group of anomalies may be (or not) related to the preparation phase of the Haiti 2021 earthquake. In particular, two possible coupling processes have been revealed as part of the earthquake preparation phase. The first one was only between the lithosphere and the atmosphere about 130 days before the mainshock. The second one was about two months before the seismic event. It is exciting to underline that all the geo-layers show anomalies at that time: seismic accumulation of stress showed an increase of its slope, several atmospheric quantities underline abnormal atmospheric conditions, and CSES-01 Ne depicted two consecutive days of ionospheric electron density. This suggested a possible coupling of lithosphere–atmosphere and ionosphere as a sign of the increased stress, i.e., the impending earthquake.
1. Introduction
This paper applies a multilayer geophysical investigation to the recent earthquake that occurred on 14 August 2021 in Haiti Island. Earthquakes are potentially one of our planet’s most significant natural phenomena, releasing huge amounts of energy in a few seconds. While most earthquakes are due to the known tectonic movements of plates on the Earth, their time, location and magnitude of occurrence are uncertain [1]. In fact, predicting an earthquake means providing, in advance, space–time coordinates and the magnitude of an incoming event [2]. It is still debated whether the prediction of an earthquake would ever be possible, but that is not the topic of this paper. However, it is pretty unrealistic that such a large natural event could suddenly occur without influencing the geo-system. In fact, for several decades, many reports have claimed pre-earthquake phenomena called precursors [3,4]. In some cases, abnormal animal behaviour has also been reported, for example, before the Mw = 6.2 L’Aquila (Italy) 2009 devasting seismic event [5]. The abnormal behaviour of the animals could be due to the perception of some substances or properties (such as electrical or magnetic fields) that humans cannot depict but the instrumentation could monitor. Consequently, efforts have been made to study the properties of the lithosphere, atmosphere and ionosphere before the earthquakes.
In addition, on 2 February 2018, China launched a satellite in partnership with Italy, entirely dedicated to investigating possible effects in the ionosphere induced by the earthquake: China Seismo-Electromagnetic Satellite (CSES-01) and planning the launch of the second satellite in the current year [6]. The satellite provides excellent results in different geophysical topics, including the study of geomagnetic field, geomagnetic storms and ionospheric pulsations as Pi2 [7,8,9,10,11,12].
Research on the study of the preparation of earthquakes has been dedicated, for example, to the investigation of seismic acceleration before the earthquake in the approach known as accelerated moment release [13,14,15]. The atmospheric parameters have been explored using multiple techniques. For example, the Robust Satellite Technique (RST) showed the appearance of thermal infrared anomalies with a statistically significant number of earthquakes [16,17,18,19] or other parameters, such as ozone [20]. Tronin [21] provided a review of different parameters retrieved from remote sensing data. Electromagnetic precursors have been searched historically from ground geomagnetic observatories in different areas of the world [22,23,24,25,26,27] and, more recently, from space satellites [28,29,30,31,32]. Comprehensive recent reviews of seismo-electromagnetic phenomena have been provided by Chen et al. [33] and Hayakawa et al. [34,35]. A comparison between surface and land temperature values and Swarm magnetic anomalies has been supplied by Ghamry et al. [36]. Several studies proved that Swarm and CSES-01 electromagnetic anomalies statistically preceded several shallow M5.5+ earthquakes [37,38,39,40]. A recent study by Chen et al. [41] investigated the relationship between space–time distance and magnitude of the incoming earthquake for the first four years of CSES-01 Ne satellite data. Alterations of the ionosphere before the earthquakes are also commonly investigated using Total Electron Content (TEC), which can be retrieved from different instruments, generally the Ground Global Navigational Satellite System (GNSS) detectors [42,43,44,45]. Other ways of investigating ionosphere include the study of ionosonde and Very Low-Frequency (VLF) transmitter–receiver alterations for changing the altitude of vertical reflection of the ionosphere’s electromagnetic signals [46,47,48,49,50,51].
The Mw = 7.2 Haiti earthquake occurred on 14 August 2021 at 12:29:08 Universal Time (UT). Its hypocentre was localised at a depth of about 10 km, and the inverse solution of its moment is compatible with a strike–slip focal mechanism with a small thrust component. The approximate fault plane interested in the slip was more than 70 km long along the strike and more than 40 km deep along the fault dip. The maximum slip overpassed 2.5 m at a depth of about 10 km and for a length of about 15 km. Unfortunately, there were at least 2,248 victims, 12,763 injured and 329 missing persons and huge economic losses as reported by USGS (https://earthquake.usgs.gov/earthquakes/eventpage/us6000f65h, last access 9 February 2024).
The location of the Mw = 7.2 Haiti 2021 earthquake, together with tectonic settings, is shown in the map in Figure 1. The represented active fault system of the Caribbean and Central American area has been retrieved in the dataset [52] developed by Styron et al. [53]. Some geological information reported in the map has been acquired from [54,55,56]. In particular, the place of the earthquake is well located in the strike-slip Enriquillo–Plantain Garden (EPGFZ) fault, which crossed Jamaica Island, the offshore section and the Southern side of Haiti/Hispaniola Island.
A previous work on this earthquake was conducted by Akhoondzadeh [57], which analysed 75 days before up to 15 days after the Mw = 7.2 Haiti 2021 earthquake using CSES-01, Swarm Alpha Bravo and Charlie satellites and atmospheric data from the Giovanni web-portal. He identified an increase in anomalies in the last 20 days before the earthquake, similar to the result of the recent catastrophic earthquake in Turkey [58]. Another work by Khan et al. [59] used a machine learning technique to analyse satellite atmospheric data 30 days before and up to 15 days after the mainshock. They identified an anomaly increase ten days before the mainshock. Chen et al. [60] analysed GNSS TEC data from 17 days before up to 7 days after the mainshock, claiming possible seismo-induced anomalies 13 days before the earthquake. However, those studies analysed a limited time before the earthquake, which is selected equal to 6 months in the present paper. A possible LAIC related to the Haiti 2021 earthquake was investigated by D’Angelo et al. [61], but the investigation was focused on the co-seismic effect detecting Acoustic Gravity Waves produced by the shaking induced by the seismic event. This phenomenon has been theorised and detected in several cases [62,63,64] and even identified before several earthquakes [65,66,67] with a source mechanism based on a thermal gradient as proposed by Hayakawa [68].
2. Materials and Methods
In this paper, we applied several methods to investigate the lithosphere, atmosphere and ionosphere, following the approach we had successfully used before several earthquakes and some volcano eruptions. These cases include among all, the Mw = 6.7 Lushan (China) 2013 [69], Mw = 7.8 Ecuador 2016 [70], Mw = 6.0 and Mw = 6.5 Amatrice-Norcia 2016 [71], Mw = 7.5 Indonesia 2018 [72], Mw = 7.2 Kermadec Islands (New Zealand) 2019 [73] and Mw = 7.8 and Mw 7.5 Turkey 2023 [58] earthquakes. In all of these mentioned cases, a possible lithosphere–atmosphere and ionosphere coupling (LAIC) has been identified in the form of a chain of anomalies and, in some cases (as Lushan 2013), even more possible couplings with different physical mechanisms have been proposed by Zhang et al. [69]. A sort of confutation analysis showed a lack of lithosphere–atmosphere and ionosphere coupling before a small earthquake, such as the ML = 3.3 Guidonia (Rome, Italy) 2023 event [74]. Still, a seismic acceleration before such a small earthquake has been clearly detected, supporting the concept that LAIC requires a higher magnitude. Still, seismological analyses may be effective even in lower magnitude events depending on the characteristics of the specific fault.
A period of six months before the Mw = 7.2 Haiti 2021 earthquake was selected. The time period to search for possible precursors is likely to increase with earthquake magnitude, as proposed by Rikitake [75,76] and Scholz et al. [77]. In addition, recent work on satellite data confirmed such a relationship initially developed for ground observations [37,38]. All of these relationships affirm that the logarithm of the anticipation time in days of the precursor is directly proportional to the magnitude of the incoming earthquake:
where “a” and “b” are two coefficients that, according to Rikitake [75,76], are different for each precursor. However, he tried to classify them into macro-categories with common anticipation time but great dispersion of the coefficient. For example, for an earthquake of magnitude 7.2 (like Haiti) and geophysical precursors of the quasi-first kind, the anticipation would be about 72 days. If all the disciplines are involved, the same calculus can bring it to about 1400 days. A part of this, there is another important consideration, i.e., the recharge on the fault is a very long process (see Appendix C, where the time between two events of magnitude greater or equal to 7.2 has been estimated as two decades and this is much less than recharge time of a single fault). In addition, the preparation phase of the earthquake is considered a process that involves different stages according to the “Dilatancy Model” of Scholz [77,78]. Considering this, the investigated time before the earthquake affects the explored stages. From a practical point of view, another seismicity in the area must be checked, excluding other large (or even larger) seismic events and the eventual time to recover from seismic sequence. In fact, for the case study of this earthquake, a large earthquake occurred on 28 January 2020, not so far (closer to Jamaica), with magnitude 7.7. Finally, a time of six months for this case study is a balance of these considerations, and it is expected to cover medium and short-term precursors [79]. The following briefly illustrates the datasets used and their processing methods.
2.1. Data and Methods for Lithosphere
The lithosphere has been investigated using the USGS earthquake catalogue. All the events localised six months before the Haiti earthquake and inside Dobrovolsky’s area (see yellow circle in Figure 1) have been retrieved. The Dobrovolsky’s area defined by Dobrovolsky’s radius (R[km] = 100.43×Mw) [80] is an estimation of the possible area of preparation for the earthquake under study. It scales exponentially with the moment magnitude (Mw) of the same event. Only earthquakes with a magnitude greater or equal to the completeness magnitude have been selected. The completeness magnitude has been estimated with the ZMap software, version 7.1 [81] with the “best fit” option, and more details are provided in Appendix C. In addition, only events with a depth equal to or less than 50 km have been selected, and their epicentres are shown in Figure 1 as coloured filled dots. The colour indicates the occurrence time according to the colour bar. The cumulated Benioff stress S(t) has been estimated using the following equation:
where “Mi” is the magnitude of the i-th event that occurred before time “t”.
2.2. Data and Methods for Atmosphere
The atmosphere has been investigated using the climatological archive MERRA-2 provided by NASA with data from 1980 to the present [82]. The dataset is based on real observation from the ground and remote sensing (satellites, airborne, aviation, etc.), constituting the input of a chemical–physical model of the atmosphere with a space resolution of 0.625° longitude, 0.5° latitude and 1 h of time resolution. The analysis has been conducted with the “MErra-2 ANalysis to search Seismic precursors” (MEANS) algorithm developed for the first time to study volcano eruptions and subsequently applied to several earthquakes [69,71,72,83] and, recently, La Palma 2021 volcano eruption [84]. Some improvements to the method have been applied over the years. The selected version was previously used to analyse the Lushan (China) 2013 earthquake [69]. In particular, global warming is removed from all the parameters as a linear fit shown in Figure 2. It is interesting to note that SO2 showed a high peak in 1991 due to Pinatubo’s great volcano eruption (Volcano Explosive Index = 6).
For each day, the data closer to the local midnight were selected, and the spatial average in the investigated areas was computed. The historical value was characterised as a function of mean and standard deviations of the same day for other years, excluding the year of the earthquake occurrence (i.e., as an example, the typical value of 15 February, the first day of the time series is the mean of 15 February 1980, 15 February 1981, … 15 February 2019, 15 February 2020, 15 February 2022). The atmospheric analyses were performed in two distinct areas: a square box centred on the epicentre and 3° side and a rectangular area of 2.2° longitude and 1.6° latitude drawn around the seismic displacement. Finally, the year of the earthquake (in this case, 2021) was compared with the typical values and the one outside the two standard deviations were classified as anomalous.
Regarding methane, data was directly acquired by the Atmospheric INfrared Sounder (AIRS) dataset of the AQUA satellite. For the first time in this approach, the version 7.0 dataset has been explored instead of version 6.0. For this reason, Appendix A shows the analysis of the previous version, 6.0, for comparison. In particular, the whole time series of the available values at a maximum distance of 3.0° from the epicentre from 2002 up to 2023 has been shown in Figure 3a. A linear fit and an “exponential–linear” one were calculated and overplotted on the time series. The data were normalised, removing the exponential–linear fit but maintaining the same absolute value. The histogram of the distribution of the values before and after the detrending is plotted in Figure 3b. It is possible to note that the dispersion of the values was reduced after detrending them as expected. The multi-year trend is likely due to global warming produced by increased methane concentration in the atmosphere.
In atmospheric analyses, years after the earthquake (2022 and 2023 for methane) are used to improve the background definition. In fact, the scope of this work is still not to predict the earthquake but to understand as much as possible what happened before the event.
2.3. Data and Methods for the Ionosphere
2.3.1. CSES-01, Ne
Several methodologies have been applied to the data of CSES-01 and Swarm satellites to investigate the ionosphere. In particular, the data of electron density (Ne) of CSES-01 recorded in the Dobrovolsky’s area in the six months preceding the Mw = 7.2 Haiti 2021 earthquake have been collected, and the daily mean values have been estimated separately for night-time (2 A.M.) and daytime (2 P.M.). The time series was detrended by seasonal variation by a polynomial fit. The values outside the median plus or minus 1.5 times the interquartile ranges were classified as anomalous. The technique has already been applied to Mw = 7.6 Papua New Guinea 2019 [85].
A second investigation compares the identical orbit that CSES-01 flies every five days. Figure 4 shows the two selected orbits for day and night times as the closest to the epicentre of the Mw = 7.2 Haiti 2021 earthquake. The method, already applied to La Palma 2021 volcano eruption [84], compares the complete latitudinal profiles of Ne of CSES-01 acquired in geomagnetic quiet conditions (|Dst| ≤ 20 nT and ap ≤ 10 nT). It then characterises the distribution of the Ne samples in windows of 1 degree of latitude in terms of interquartile range and outliers, i.e., the values that are 1.5 times the interquartile range out of the upper or lower percentiles (25% and 75%), i.e., the whiskers. The outlier values for each data distribution are marked with a red cross in the graph. If the phenomena occurred at the latitude of the incoming earthquake, it is further discussed as possibly caused by the seismic event.
2.3.2. Swarm, Magnetic Field
The three Swarm satellites (Alpha Bravo and Charlie) have been analysed by the MASS (MAgnetic Swarm anomaly detection by Spline analysis) algorithm, widely utilised to investigate single earthquakes [28,70,72,74,86], as well as large statistical studies [37,38]. The MASS algorithm first removed the main field by a numerical derivative of the signal and subtracting a cubic spline. For the residuals, it compared the root mean square (rms) inside a moving window of 3° latitude within the Root Mean Square (RMS) of the whole track between −50° and +50° geomagnetic latitude. If the rms > kt × RMS, the window is defined as anomalous. This approach extracts anomalous signals, but they are not necessarily induced by an earthquake. Previous statistical works, in fact, demonstrate that the earthquake likely induces a significant number of these anomalies, but they are a few per cent of the whole ensemble of extracted anomalies [37,38]. So, to further discriminate possible pre-earthquake signals, the approach proposed for the Ridgecrest 2019 [53] earthquake has been followed here. It is supposed to compare the research area with a comparison one at the same magnetic latitude and a similar ratio between land and sea. In this case, a comparison area at longitude 15.69° W has been selected. Only the anomalies that exclusively appear in the earthquake area are further discussed as possibly related to the incoming seismic event.
2.3.3. TEC
The Global Ionospheric Maps (GIMs) of Total Electron Content (TEC) have been investigated using a method previously applied to volcano eruption and earthquake occurrence [69,84]. GIM-TEC has a space resolution of 5° longitude and 2.5° latitude and a time resolution of 2 h. The method selects the four nearest neighbour values for the previous and following UT available hours. Firstly, a bidimensional cubic interpolation of the value above the epicentre is calculated, and then a linear interpolation at the selected local time (LT in this paper is set as 2 A.M.) is performed for each day in the six months before the mainshock. For each year, the yearly median TEC is calculated and linearly fitted versus the mean Sunspot number. The median is generally preferred over the mean in ionospheric studies with TEC and ionosonde to avoid the effect of the outliers and intrinsic strong variability [87,88]. The normalised TEC is calculated by dividing the time series of each year by the value obtained by the previous fit. After this passage, the background, i.e., the typical TEC value for the specific day, is calculated as the median, the median and interquartile range of the yearly values and thresholds to extract anomalies defined as the median ± 1.5 times interquartile range. The value of the year of the earthquake (2021, excluded from the background) is graphically superposed to check if any of the values are outside the thresholds, i.e., anomalous. A second threshold (represented as green horizontal lines) was calculated as the median and interquartile range of the 2021 normalised TEC values. The values that are outside such a threshold are anomalous for 2021. Still, if inside the previous background, they can be considered inside the historical variation of TEC at the epicentre location, so they are not strictly anomalous.
3. Results
3.1. Lithosphere
The analysis of the earthquake catalogue is presented in Figure 5. A combined fit of a sigmoidal curve with a linear growth has been performed (green line).
The investigation of the cumulate of released strain underlined a trend variation 66 days before the mainshock (x0 parameter of sigmoidal fit). This means that from a tectonic point of view, Dobrovolsky’s area experienced higher seismicity about two months before the Haiti 2021 earthquake. In addition, the ES parameter defined by Hattori [23,89] has been estimated and reported in Figure 6. The cited papers considered the region as active when ES ≥ 108. This occurred twice: 171 and 130 days before the Mw = 7.2 Haiti 2021 earthquake.
3.2. Atmosphere
Various atmospheric physical and chemical parameters extracted from MERRA2 were analysed six months before the Mw = 7.2 Haiti 2021 earthquake. The time series of Aerosol (as Aerosol Optical Thickness-AOT), the surface concentration of Carbon Monoxide (CO), the surface mass concentration of Dimethyl Sulphide and the surface mass concentration of Sulphur Dioxide (SO2) have been plotted in Figure 7, Figure 8, Figure 9, Figure 10 and Figure 11. Each parameter is analysed in a 3° side square area centred on the epicentre (above) and a rectangular box of 2.2° longitude and 1.6° latitude drawn around seismic displacement (below). Using the area that included the seismic displacement information generally provides more reliable pre-earthquake anomalies. In fact, this analysis aims to discriminate among all atmospheric anomalies, which ones have more chances of being induced by seismic activity. Consequently, the anomalies confirmed by this investigation are marked with red circles, while the others with orange circles are excluded for further consideration in the discussion section.
Specific humidity, surface air temperature and surface latent heat flux have also been investigated, and their time series are presented in Supplementary Materials. For Specific humidity, according to the LAIC model of Pulinets and Ouzounov [90], only a reduction (decrease) of humidity has been considered. In fact, the hydration of aerosol particles in the atmosphere is considered the cause of the drop in humidity, as further explained in the recent book by the same authors and colleagues [91].
In addition to the previous atmospheric parameters from the MERRA-2 climatological archive, the methane measured by AIRS has been investigated and shown in Figure 11.
Figure 12 shows a couple of maps of two anomalous days for aerosol content: 13 June and 14 July 2021. In the first map, the aerosol concentration is quite close and unique to the epicentre; overall, it is aligned with the main plate boundary. This supports a possible release of some substances, such as radon, from the active fault due to increased stress from the impending earthquake. On the second map on 14 July 2021, aerosol concentration is not unique to the epicentre, so some doubt exists about a possible link with seismic activity. It cannot be excluded that more phenomena coexist at the same time. For example, the large concentration in Colombia/Venezuela was surely not due to the preparation phase of the Haiti earthquake. However, it seems clear that South American aerosol emissions are a separate phenomenon from the concentration in the Caribbean Sea. Consequently, considering the close-to-epicentre aerosol concentration as a possible pre-earthquake phenomenon cannot be wholly excluded or confirmed.
3.3. Ionosphere
The ionosphere has been investigated by two satellite missions: CSES and Swarm. Figure 13 presents the time series of CSES-01 Ne values acquired in Dobrovoslky’s area six months before the Mw = 7.2 Haiti 2021 earthquake during geomagnetic quiet conditions.
It is possible to note that there are more CSES Ne anomalies as the earthquake approaches. In addition, two consecutive anomalous days with a similar amount of high Ne appeared about two months (64 days) before the earthquake. In some of the previous research on pre-earthquake phenomena, the persistence or duration of the anomaly is considered (and statically proved) to be more effective [92,93].
Another analysis with CSES-01 Ne nighttime data is presented in Figure 14. In this case, only one orbit is selected, and its values are characterised in geomagnetic quiet conditions, and eventual outliers (marked as red crosses) are extracted. To select the most probable anomalies that may be related to the preparation for the earthquake, I focused on the latitude of the earthquake. The other part of the profile can be used as a comparison to see if the phenomena are local or affect the entire orbit, making it less likely to be associated with seismic activity. The most anomalous increase in electron density occurred on 29 July 2021, 16 days before the mainshock. The peak is slightly North of the incoming epicentre, well inside the Dobrovoslky’s area. Another important increase in electron density occurred on 4 June 2021, 71 days before the Mw = 7.2 Haiti 2021 earthquake. It is worth noting that almost at the same time, the seismic trend accelerates, supporting a possible coupling between the lithosphere and the ionosphere. The corresponding analysis with CSES-01 Ne daytime data is reported in Appendix B.
The Swarm magnetic Y-East component has been objectively analysed in the area of a 3.32° radius around the epicentre, according to a previous study [86]. All the tracks that have at least one 3° latitude window with a root mean square (rms) greater or equal to 3.5 times the rms of the whole track (between −50° and +50° geomagnetic latitude) are counted as anomalous, and their cumulative trend is shown in Figure 15a. The same approach was applied to a comparison area shown in Figure 15d centred at a longitude of 22.5° W and the same magnetic latitude of the epicentre, obtaining the cumulative trend plotted in Figure 15b. Finally, the difference between the two trends has been estimated in Figure 15e. Whenever such a trend is positively increasing, it means that in the epicentral area, more anomalies are recorded than in the comparison area. Especially 80 days before the Mw = 7.2 Haiti 2021 earthquake, a higher rate of anomalous tracks were recorded in the epicentral area. However, at this time, the trend also increased in the comparison area. A combination of a global geomagnetic phenomenon that interacted with an altered electromagnetic field at the epicentral area cannot be excluded, for example, due to the release of positive charges (p-holes) for the increase of the seismic stress as proposed by Freund [94,95].
In addition to the previous investigation, the TEC at 2 a.m. local time has been estimated, interpolating spatially and temporarily the values reported by Global Ionospheric Maps of Total Electron Content (GIM-TEC). The chosen local time is the one of night-time passages of the CSES-01 satellite to allow a better comparison. The same technique was already applied to La Palma 2021 volcano eruption [84] and the Lushan 2013 earthquake [69] with a slightly different approach to take into account the cyclic variation of TEC due to solar activity. The first work used a sinusoidal fit of TEC over 20 years, while the second one performed an exponential fit with the Sun Spot Number (SSN). The advantage of using SSN is to consider that each cycle of solar activity has a specific intensity both in minimum and maximum value, and SSN is one of the indices that can measure this feature that directly influences the ionisation of Earth’s environment, so TEC. This work uses the SSN again, and a linear fit between TEC and SSN is performed. Then, the TEC values for each year are normalised versus the mean SSN value in the analysed six months. Despite the implemented normalisation, it is necessary to note that 2021 is a year of particularly low solar activity, which may affect the extraction of anomalies. In fact, as you can see from Figure 16, there are only two anomalous days, which are 1 and 2 July 2021, i.e., about 44 and 43 days before the mainshock. At that time, the geomagnetic conditions were quiet, as underlined by the following indexes: Dst = −8 nT, ap = 5 nT and AE = ~107 nT.
4. Discussion
Atmospheric and ionospheric analyses depicted several anomalies. Regarding the investigation of the atmospheric parameter, if the broken segment by the incoming earthquake is considered, there is an improvement in the results. However, this point is more important for larger-magnitude events, as the approximation of the source as a point is more accurate for smaller-magnitude events.
An external and occasional hazard that may affect the results, especially atmospheric analyses, is the eventual presence of extreme weather events, such as storms or hurricanes. In the literature, the identified pre-earthquake anomalies have been compared with hurricanes to exclude the ones probably not induced by earthquakes [96]. In the investigated time, NOAA reported several storms and hurricanes in the Atlantic Ocean sector (https://www.nhc.noaa.gov/data/tcr/index.php?season=2021&basin=atl, last access 10 March 2024) as reported in the following list.
- Tropical Storm ANA from 22 to 23 May 2021. This storm affected the North-Center Atlantic Ocean, which is very far from the investigated area.
- Tropical Storm BILL from 14 to 15 June 2021. This storm was generated in the North Atlantic Ocean and arrived close to the Northern coast of Florida, which is still far from the investigated area, affecting the results of this work.
- Tropical Storm CLAUDETTE from 19 to 22 June 2021. This storm was generated in the North Atlantic Ocean, close to the Nova Scotia (Canada) coast, travelled inside the USA and ended in the Gulf of Mexico. Despite passing around the investigated area, it was completely outside the Dobrovoslkys’s area.
- Tropical Storm DANNY from 27 to 29 June 2021. This storm was generated in the Central Atlantic Ocean and arrived at the coast border between Florida and Georgia States. It was far from the investigated area.
- Hurricane ELSA from 30 June to 9 July 2021. This hurricane passed in the investigated area, which is further discussed below.
- Tropical Storm FRED from 11 to 17 August 2021. This storm passed inside the investigated area, which is further discussed below.
- Hurricane GRACE from 13 to 21 August 2021. This hurricane crossed the investigated area, but mainly after the Haiti 2021 earthquake.
Considering the above list, three events are selected as potentially affecting the analyses of this paper: Hurricane Elsa [97], Tropical Storm Fred [98] and Hurricane Grace [99]. The positions of the centre of Elsa and Grace hurricanes and Fred storm are reported in Figure 17, along with the date reported by the National Hurricane Center [97,98,99].
Some atmospheric anomalies in carbon monoxide in the days immediately following the extreme weather events may be related to the increase of using power generators as emergency recovery solutions, as reported in previous cases dealing with a higher risk of CO poisoning for this reason [100]. Sulphur dioxide increase due to the same reason was reported in the aftermath of the previous Hurricane Maria, which hit Puerto Rico in 2017 [101].
Figure 18 provides a summary of all the identified anomalies in the atmosphere and ionosphere compared with the seismicity inside Dobrovolsky’s area. Several possible interactions could be inferred by analysing the different trends in geo-layers, which are underlined by red ellipses and dashed red arrows. The four numbers in grey circles indicate important moments that these analyses can depict.
- High seismicity in the Dobrovolsky area 171 days before the mainshock.
- Increased ionospheric anomalies from 88 to 77 days before the mainshock. This group of anomalies is detected mainly by the Swarm magnetic field, but CSES-01 Ne also depicted some anomalies. It is the most abundant increase in ionospheric anomalies before the Mw = 7.2 Haiti 2021 earthquake, but it is not preceded by significant anomalies in the lithosphere or ionosphere, so its link with the incoming earthquake is uncertain.
- Increased seismic rate from about 80 to 60 days before the mainshock, synchronous with anomalies in the atmosphere and two consecutive days of CSES-01 Ne anomalies. This is a possible complete coupling between the lithosphere–atmosphere and ionosphere. It is still possible to describe it with the Pulinets and Ouzounov LAIC model, as in addition to carbon monoxide release, there are also aerosol anomalies and higher concentrations of surface SO2, which may also be released due to the stress increase. The first atmospheric anomalous parameter in this time range (−80 days) was methane, which could have acted as a gas carrier to bring radioactive substances into the atmosphere, inducing ionisation, as proposed by Etiope and Martinelli [104]. This may lead to an increase of Ne recorded by CSES-01, as simulated by Kuo [105]. This is also somehow compatible with the LAIC theory of Pulinets and Ouzonouv [90], despite the lack of evidence (such as missing OLR, humidity drop, etc.) to confirm this explanation. This may be due to particular local conditions or observation limitations, especially for ground instrumentation.
A specific list of anomalies with the values of the investigated parameters is provided in Table 1. The value is the absolute one and not the exceedance of the threshold.
Comparing the results of this work with previous ones [57,59,60], it is possible to confirm the presence of sparse anomalies in the last weeks and days before the earthquake, but it is possible to depict more interesting periods with higher anticipation time not investigated in previous work. This is not surprising, considering that a single fault’s seismic recharge time could be hundreds or thousands of years [106].
Comparing the hurricanes and storms with the list and location of the anomalies, it is possible to note that the CO anomaly recorded on 4 July 2021 is likely caused by the Elsa hurricane that crossed the atmospheric investigation area exactly on the same day. The same hurricane is likely the source of the two TEC anomalies on 1st and 2nd July 2021 and the CSES-01 Ne anomaly recorded on 5 July 2021 inside the Dobrovolsky area. The anomaly of CO recorded on 10 August 2021 could be due to tropical storm Fred, but on the same day, the storm was still far from the area of investigation for atmospheric anomalies. On the other hand, the CSES-01 Ne anomalies recorded on 9 August 2021 (the last one before the earthquake) could be due to the starting of the perturbation of the tropical storm Fred on the same day. The presence of anomalies likely associated with the Elsa Hurricane may still be a sign of possible geophysical coupling induced by the strong weather, especially the ionospheric perturbation in Ne and its vertically integrated quantity TEC identified from CSES-01 and Global Navigation Satellite System (GNSS) detectors. LAIC induced by other natural hazards has also been proposed, but it is beyond the scope of this paper [90,107,108,109].
In Supplementary Materials, a comparison of electron density measured by Swarm satellites and CSES-01 is provided during two nights with anomalous features close to the epicentre. Figure S4 represents Ne on 5 July 2021 and Figure S5 on August 2021, i.e., 40 and 8 days before the Mw = 7.2 Haiti 2021 earthquake, respectively. Despite the fact that an increase in electron density seems present inside Dobrovoslky’s area, the tracks acquired at the same local time eastward and outside the earthquake preparation area also show high electron density values. In the electron density profile of 6 August 2021, a double peak above and symmetric to the epicentre is present, as visible in Figure S5, which is the ochre colour track. This track is close to the TEC anomaly extracted by Chen et al. [60] (1 August 2021). A similar result was presented in the analysis of Mw = 7.2 Kermadec Island (New Zealand) 2019 earthquake [73] in Figure 11 of the cited paper, with the same problem as the present work, i.e., the Eastward track outside Dobrovolsky’s area also shows the high value of Ne. The comparison is interesting as the magnitude is the same for both earthquakes, but the tectonic context and region differ. Unfortunately, due to the unclearness of the results, it is not easy to draw any conclusions.
Previous works identified an important feature: the spatial organisation of the anomalies before the earthquake [69,110], identifying a pattern that started far from the epicentre and gradually approached the incoming earthquake. However, in this work, only some considerations about the seismic patterns of Figure 1 can be discussed, as the anomalies in the atmosphere and ionosphere have been extracted in areas closer to the epicentre than the entire Dobrovolsky area. An important difference between the cited works and the present one is that they analysed continental earthquakes (Mw6.7 Lushan, China, 2013 and Mw = 7.8 Nepal 2015) while Mw = 7.2 Haiti 2021 epicentre is surrounded by the Caribbean Sea. The sea and the great variability of the area could make it more difficult to extract pre-earthquake anomalies far from the epicentre (still inside Dobrovolsky’s area) due to contamination of other phenomena. However, regarding the seismicity, it is possible to note that the first earthquakes six months before Mw = 7.2 Haiti 2021 occurred close to the future mainshock. Then, several seismicities were recorded far in the three months before the earthquake gradually approached the incoming earthquake, leaving a gap in the middle at the mainshock future location. This is a well-known phenomenon that, from a seismological point of view, can be explained as the seismogenic fault being locked before greater earthquakes [111]. Some simulations of this phenomenon, also known as seismic gap theory, have been performed in the literature [112].
5. Conclusions
In this paper, the lithosphere (earthquake catalogue), atmosphere (climatological dataset MERRA2 and AIRS methane data) and ionosphere (CSES and Swarm missions + TEC) geo-layers have been investigated in the six months before the Mw = 7.2 Haiti 2021 earthquake. Geomagnetic disturbed time has been skipped to avoid confusing external source ionospheric anomalies with a possible seismo-induced phenomenon. In addition, extreme weather events have been scrutinised, and some anomalies have been identified as possibly caused by such events. Several anomalies have been extracted by applying specific methods for the particular parameter, and finally, they have been discussed together. Here, an approach of separating the geo-layer is preferred to the one that combines all the anomalies in one (used, for example, for Ridgecrest 2019, New Zealand 2019 and a previous one about Haiti 2021 [57,73,83]) because, in this way, possible transfer of anomalies from bottom layers to the upper ones can be inferred. In particular, a coupling between the lithosphere and atmosphere may occur 130 days before the mainshock, and another one between the lithosphere, atmosphere and ionosphere may occur 80 to 60 days before the mainshock. Both require some days of propagation from one geo-layer to the next and are compatible with the LAIC model of Pulinets and Ouzonov [90]. These results cannot be used directly to make predictions or directly implement in a prediction system. Still, they provide crucial knowledge that is necessary but insufficient to make a scientifically reliable prediction of an earthquake. However, this further confirms that this method of studying multiple layers and parameters permits the depiction of alteration of the geosystem possibly associated with the preparation phase of the earthquake and supports possible LAIC and specific models. Further studies are necessary, especially to discuss why the patterns of anomalies are often different case by case and also to statistically assess the validity of an identified pattern on a large number of medium/large earthquakes. The final stage of constructing a prediction system may be building a platform based on the accumulated knowledge to be tested in a forward way and from an independent organisation.
Supplementary Materials
The following supporting information can be downloaded at: https://www.mdpi.com/article/10.3390/geosciences14040096/s1, Figure S1: Atmospheric analysis of humidity; Figure S2: Atmospheric analysis of temperature; Figure S3: Atmospheric analysis of OLR; Figure S4: Swarm Bravo and CSES-01 on the night of 5 July 2021; Figure S5: Swarm Alpha and CSES-01 on the night of 6 August 2021.
Funding
This research received no external funding.
Data Availability Statement
The earthquake catalogue has been retrieved from the USGS free archive (https://earthquake.usgs.gov/earthquakes/search/ last access 26 January 2024). MERRA-2 data can be downloaded from https://disc.gsfc.nasa.gov/datasets?project=MERRA-2 (last accessed 23 July 2022) with Earth Observation NASA free credential. Swarm data are freely available via ftp and http at swarm-diss.eo.esa.int server (last accessed 27 July 2022). China Seismo Electromagnetic Satellite data are freely available at https://www.leos.ac.cn/#/home (last access on 8 March 2024, a warning about “not secure” website could appear in certain browsers) upon registration and approval.
Acknowledgments
The author acknowledges ISSI/ISSI-BJ for supporting the International Team 553 “CSES and Swarm Investigation of the Generation Mechanisms of Low Latitude Pi2 Waves” led by Essam Ghamry and Zeren Zhima, and International Team 23-583 (57) “Investigation of the Lithosphere Atmosphere Ionosphere Coupling (LAIC) Mechanism before the Natural Hazards” led by Dedalo Marchetti and Essam Ghamry. A special acknowledgement to Guido Ventura, Essam Ghamry, Xuhui Shen, Rui Yan, Zeren Zhima, Alessandro Piscini, Loredana Perrone, Saioa Arquero Campuzano, Francisco Javier Pavón-Carrasco, Maurizio Soldani, Angelo De Santis, Yiqun Zhang, Ting Wang, Wenqi Chen, Donghua Zhang and Hanshuo Zhang, for re-use of some codes and discussions.
Conflicts of Interest
The author declares no conflicts of interest. The funders had no role in the design of the study; in the collection, analyses or interpretation of data; in the writing of the manuscript; or in the decision to publish the results.
Appendix A. Analysis of Methane Data Version 6 of AIRS
Here, the results are presented using the previous methane data version, 6.0, from AIRS. In addition, the original data before and after detrending are shown in Figure A1 as a time series (a) and histogram (b). It is possible to note, comparing the same figure in the manuscript (see Figure 3), that the time series of the new version 7 is a bit changed with a more accentuated global warming trend. The CH4 anomalies using this version are shown in Figure A2. This trend and the extracted anomalies are compatible with the ones obtained with the new version, even though some minor differences exist. As the new version is provided as a revised and improved data calibration from the team mission, it is also considered more reliable for investigating the study of possible methane emissions before earthquake occurrence.
Figure A1.
Methane (CH4) version 6 data in the form of time series (a) and histogram (b) before and after the global warming detrending.
Figure A1.
Methane (CH4) version 6 data in the form of time series (a) and histogram (b) before and after the global warming detrending.
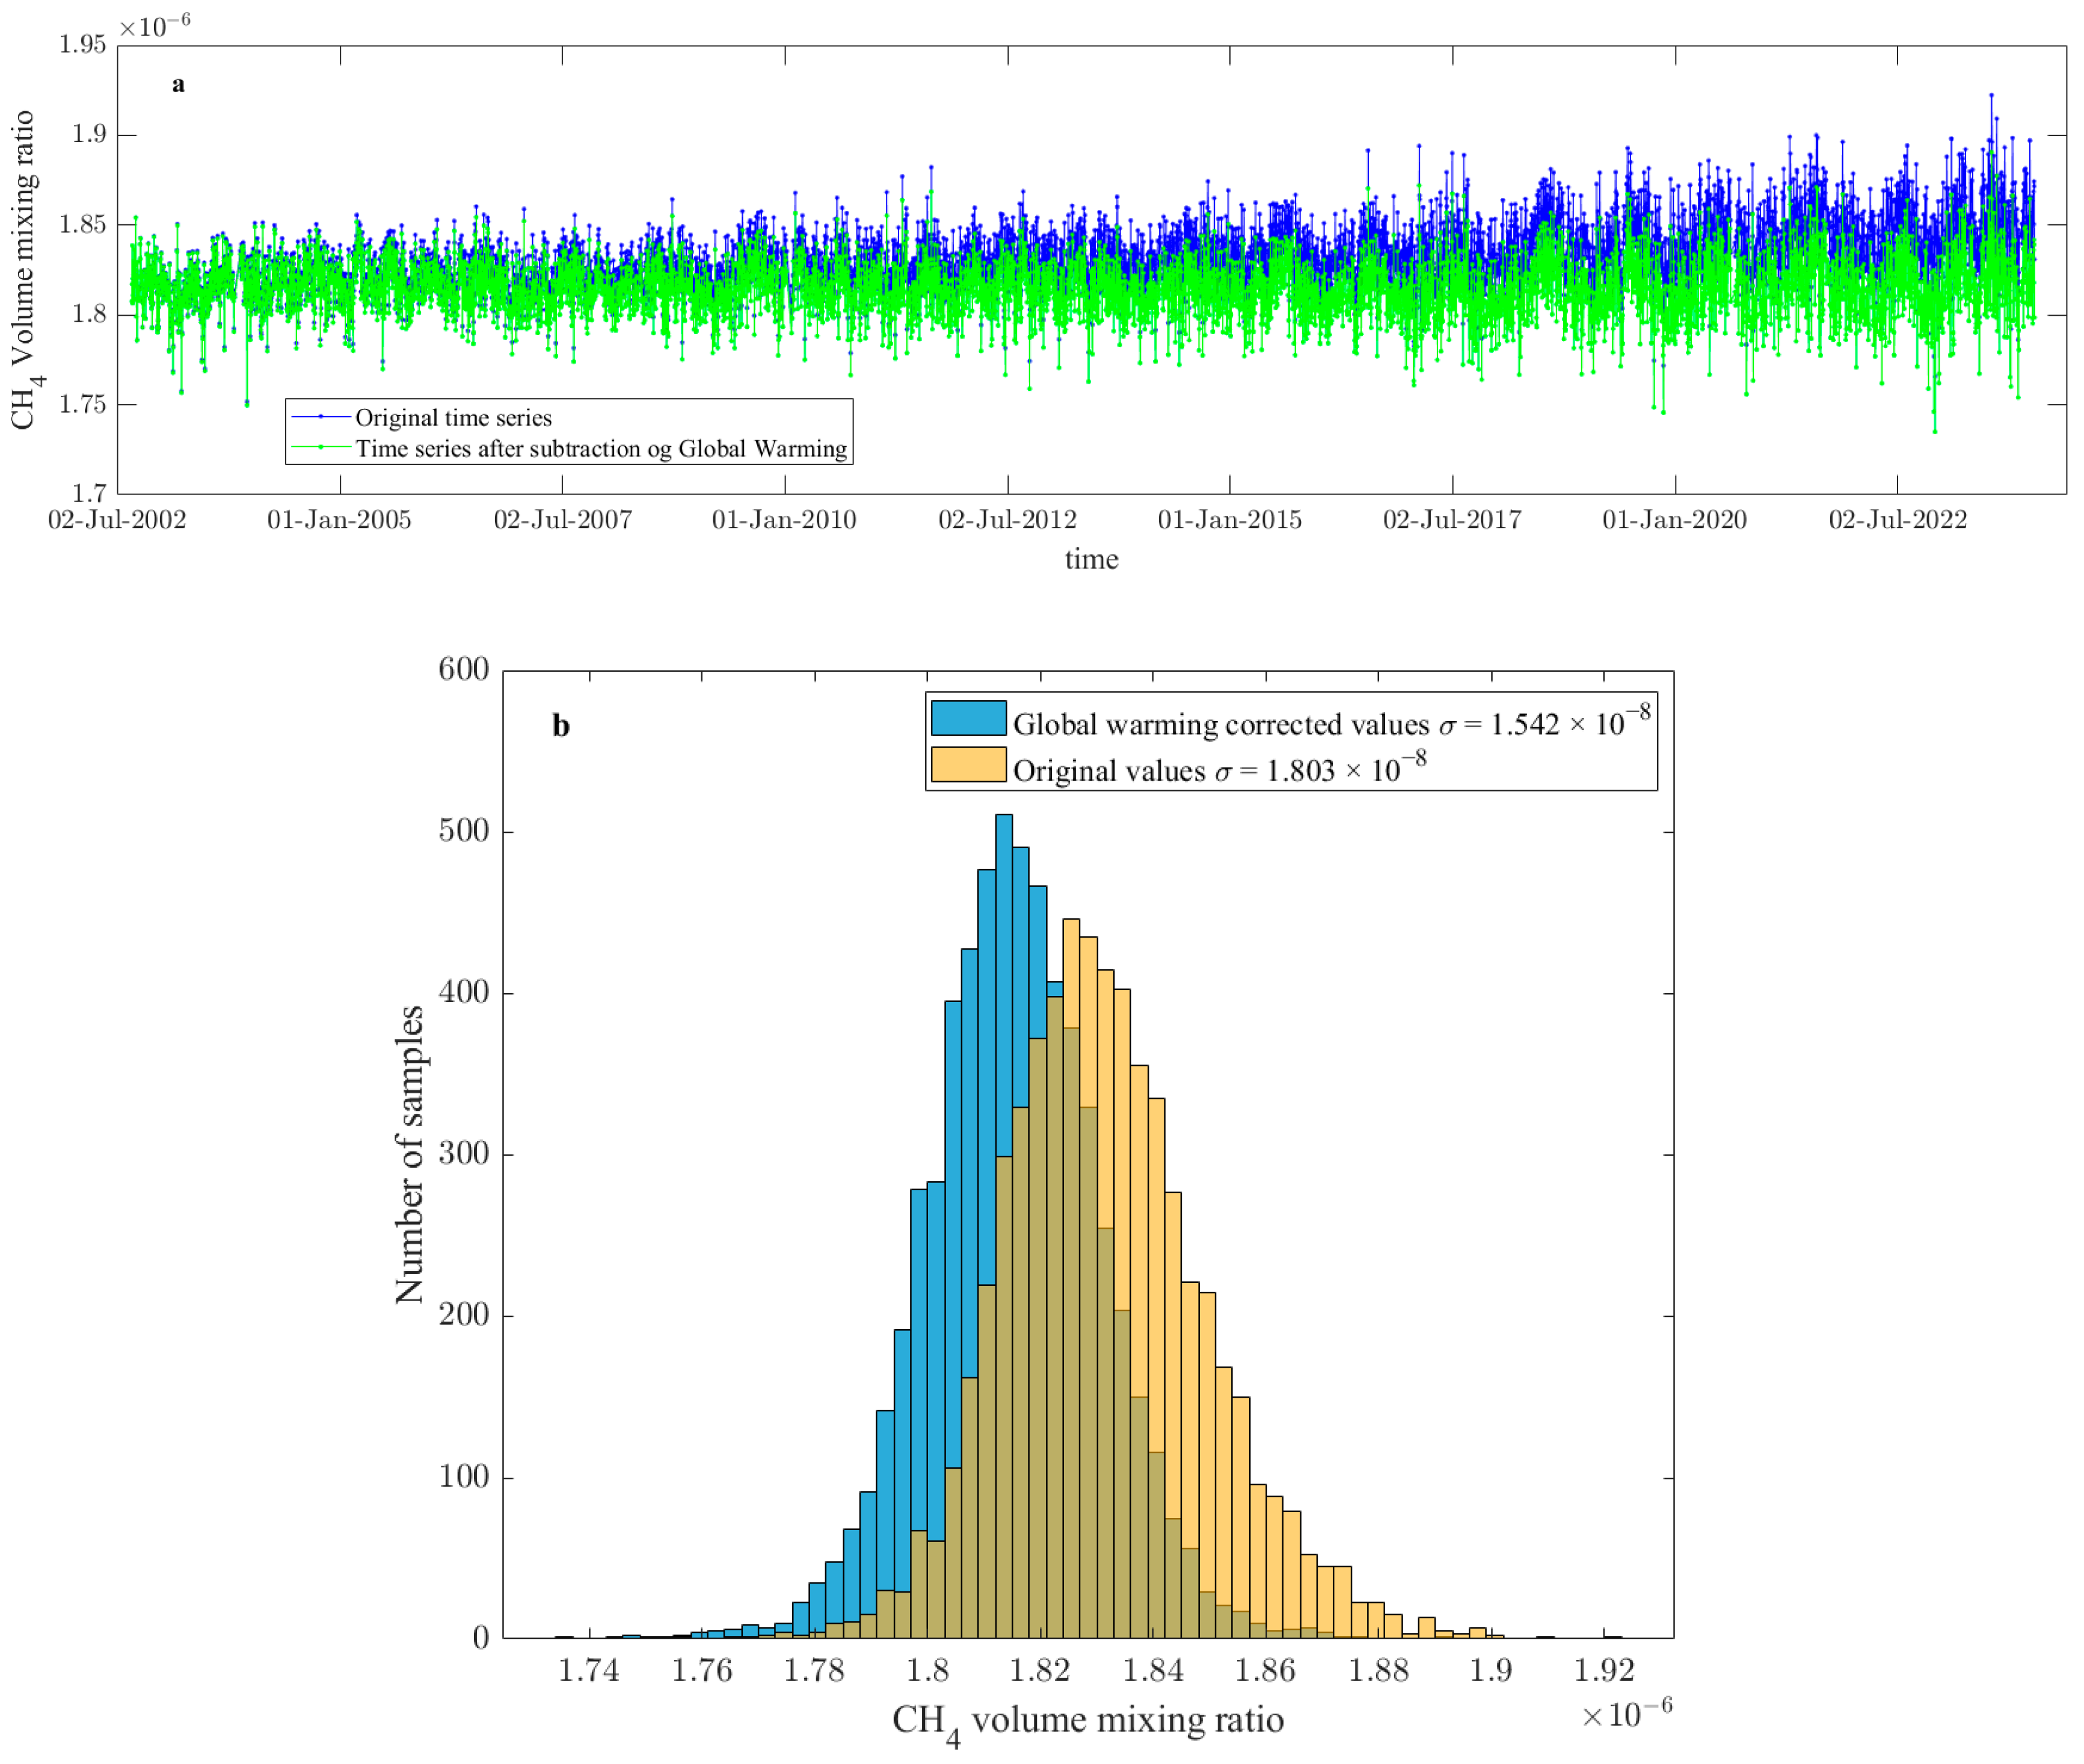
Figure A2.
Methane (CH4) version 6 investigation in the six months before the Haiti 2021 earthquake. The data source is AISR instrument, and so the background has been calculated on a shorter time period (from 2002 to 2023, excluding the year of the earthquake–2021). Red circles underline anomalies.

Appendix B. CSES-01 Ne Daytime Analysis
In this appendix, the analysis of CSES-01 Ne daytime data is presented. In particular, all of the same orbits (see Figure 4) acquired during geomagnetic quiet conditions are superposed and visualised in Figure A3. The general shape is the typical one for the altitude of the satellite (~510 km) with only one Equatorial Ionospheric Anomaly (EIA) peak. Some outliers are depicted as such peaks that are significantly higher for some specific orbits. There is also an orbit with lower Ne values detected as an outlier (2 February 2021). At the latitude of the Haiti 2021 earthquake, no anomalous values were extracted. Despite some theories proposing the variations of EIA as one of the pre-earthquake phenomena [113], in this case, it looks more like ionospheric intrinsic variability, especially due to the very long anticipation time. However, it is quite interesting to note that on 19 March 2021, double EIA peaks were formed, with maximum values on 24 March 2021. These anomalous tracks with double EIA peaks preceded from 18 to 8 days, the highest seismic day in the area (excluding the Haiti event) according to the ES parameter (ES = 3.0 × 10⁹ J/km2 on 6 April 2021).
Figure A3.
CSES-01 Ne daytime latitudinal profiles acquired in geomagnetic quiet time. The blue boxes and dashed black lines represent the standard ranges of the values for each degree of latitude. The red crosses indicate the outlier values of Ne. The latitude of the Haiti earthquake (EQ) is represented as a vertical black line.

Appendix C. Magnitude of Completeness of Earthquake Catalogue
In this appendix, the magnitude of completeness of the USGS earthquake catalogue in the investigated area and time is checked. It was noted that the catalogue seems to have a geographical area (Dominican Republic) with higher completeness, probably due to a dense network of seismic stations. So, the completeness was separately checked into two distinct areas represented in Figure A4.
Figure A4.
Map of the two selected areas (red circles) marked with numbers “1” and “2”. The earthquakes are represented as black boxes and the Mw = 7.2 Haiti 2021 earthquake epicentre as yellow star. Main plate boundaries are depicted with bold dark blue lines.
Figure A4.
Map of the two selected areas (red circles) marked with numbers “1” and “2”. The earthquakes are represented as black boxes and the Mw = 7.2 Haiti 2021 earthquake epicentre as yellow star. Main plate boundaries are depicted with bold dark blue lines.
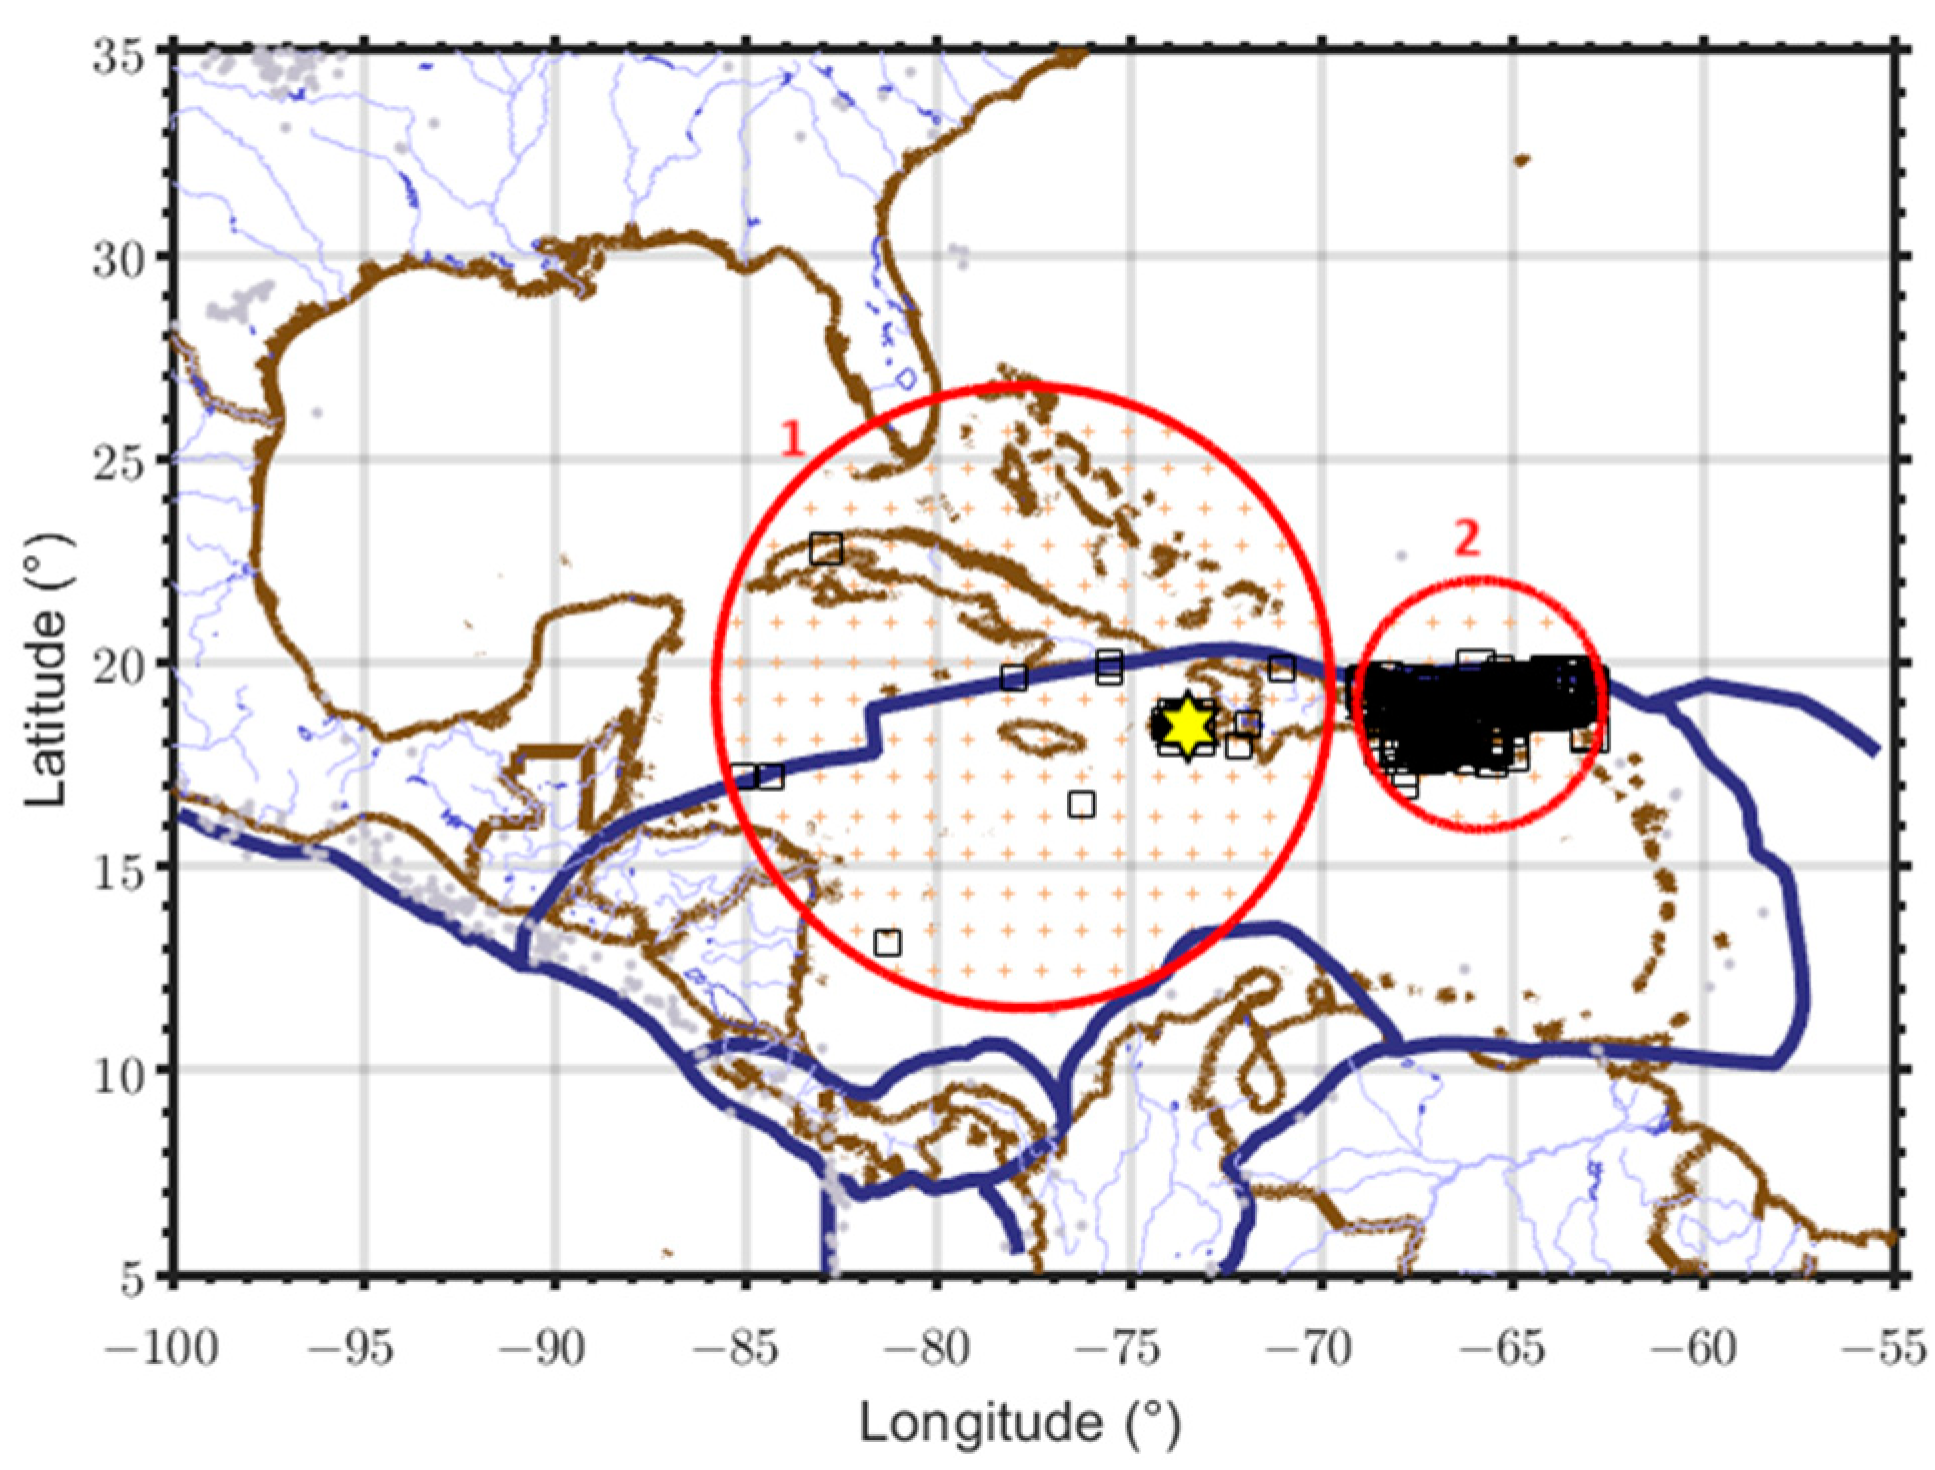
The Gutenberg–Richter (G-R) [114] distribution into the two selected areas is shown in Figure A5 “a” and “b”. The graph shows the number of events as a function of earthquake magnitude. Both the binned value (grey box) and cumulative values of the number of earthquakes with magnitude equal to or greater than the corresponding value on the abscissa are shown by white boxes. It is possible to confirm that in Area 2, the completeness magnitude Mc is better and equal to 2.6. However, in Area 1, the Mc = 4.2. Consequently, to be sure not to lose events in the whole of Dobrovolsky’s area, the most conservative value of Mc = 4.2 was selected. Using this value and selecting the two years of the earthquake catalogue before the Mw = 7.2 Haiti 2021 earthquake, the G-R distribution is calculated again and shown in Figure A5c. Using such a final solution, it is possible to calculate how many events of magnitude equal or greater than 7.2 occurred in this area by simply using the a and b coefficient of best fit:
The inverse of the above number represents the mean interseismic time τ of occurrence of events equal to or greater than magnitude 7.2 in the area:
It is possible to say that statistically, the time between an earthquake of at least magnitude 7.2 in this area is of the order of two decades. This time must not be taken as rigorous, considering that the empirical distribution of interseismic times is generally considered to follow a Poissonian statistic, even though some debate about this assumption exists [115,116,117].
Figure A5.
Gutenberg–Richter distributions in (a) selected Area 1 of Figure A4; (b) selected Area 2 and (c) the Dobrovolsky’s area. The last case considers two years of data before the Haiti earthquake.
Figure A5.
Gutenberg–Richter distributions in (a) selected Area 1 of Figure A4; (b) selected Area 2 and (c) the Dobrovolsky’s area. The last case considers two years of data before the Haiti earthquake.

References
- Ze, Z.; Guojie, M.; Xiaoning, S.; Jicang, W.; Xiaojing, L.J. Global Crustal Movement and Tectonic Plate Boundary Deformation Constrained by the ITRF2008. Geod. Geodyn. 2012, 3, 40–45. [Google Scholar] [CrossRef]
- Geller, R.J. Earthquake Prediction: A Critical Review. Geophys. J. Int. 1997, 131, 425–450. [Google Scholar] [CrossRef]
- Conti, L.; Picozza, P.; Sotgiu, A. A Critical Review of Ground Based Observations of Earthquake Precursors. Front. Earth Sci. 2021, 9, 676766. [Google Scholar] [CrossRef]
- Picozza, P.; Conti, L.; Sotgiu, A. Looking for Earthquake Precursors From Space: A Critical Review. Front. Earth Sci. 2021, 9, 676775. [Google Scholar] [CrossRef]
- Fidani, C.; Freund, F.; Grant, R. Cows Come Down from the Mountains before the (Mw = 6.1) Earthquake Colfiorito in September 1997; A Single Case Study. Animals 2014, 4, 292–312. [Google Scholar] [CrossRef] [PubMed]
- Shen, X.; Zong, Q.-G.; Zhang, X. Introduction to Special Section on the China Seismo-Electromagnetic Satellite and Initial Results. Earth Planet. Phys. 2018, 2, 439–443. [Google Scholar] [CrossRef]
- Ghamry, E.; Marchetti, D.; Yoshikawa, A.; Uozumi, T.; De Santis, A.; Perrone, L.; Shen, X.; Fathy, A. The First Pi2 Pulsation Observed by China Seismo-Electromagnetic Satellite. Remote Sens. 2020, 12, 2300. [Google Scholar] [CrossRef]
- Yang, Y.; Hulot, G.; Vigneron, P.; Shen, X.; Zhima, Z.; Zhou, B.; Magnes, W.; Olsen, N.; Tøffner-Clausen, L.; Huang, J.; et al. The CSES Global Geomagnetic Field Model (CGGM): An IGRF-Type Global Geomagnetic Field Model Based on Data from the China Seismo-Electromagnetic Satellite. Earth Planets Space 2021, 73, 45. [Google Scholar] [CrossRef]
- Yang, Y.-Y.; Zhima, Z.-R.; Shen, X.-H.; Chu, W.; Huang, J.-P.; Wang, Q.; Yan, R.; Xu, S.; Lu, H.-X.; Liu, D.-P. The First Intense Geomagnetic Storm Event Recorded by the China Seismo-Electromagnetic Satellite. Space Weather 2020, 18, e2019SW002243. [Google Scholar] [CrossRef]
- Yan, R.; Zhima, Z.; Xiong, C.; Shen, X.; Huang, J.; Guan, Y.; Zhu, X.; Liu, C. Comparison of Electron Density and Temperature From the CSES Satellite With Other Space-Borne and Ground-Based Observations. J. Geophys. Res. Space Phys. 2020, 125, e2019JA027747. [Google Scholar] [CrossRef]
- Zhou, B.; Cheng, B.; Gou, X.; Li, L.; Zhang, Y.; Wang, J.; Magnes, W.; Lammegger, R.; Pollinger, A.; Ellmeier, M.; et al. First In-Orbit Results of the Vector Magnetic Field Measurement of the High Precision Magnetometer Onboard the China Seismo-Electromagnetic Satellite. Earth Planets Space 2019, 71, 119. [Google Scholar] [CrossRef]
- Gou, X.; Li, L.; Zhou, B.; Zhang, Y.; Xie, L.; Cheng, B.; Feng, Y.; Wang, J.; Miao, Y.; Zhima, Z.; et al. Electrostatic Ion Cyclotron Waves Observed by CSES in the Equatorial Plasma Bubble. Geophys. Res. Lett. 2023, 50, e2022GL101791. [Google Scholar] [CrossRef]
- Mignan, A. The Stress Accumulation Model: Accelerating Moment Release and Seismic Hazard. In Advances in Geophysics; Elsevier: Amsterdam, The Netherlands, 2008; Volume 49, pp. 67–201. ISBN 978-0-12-374231-5. [Google Scholar]
- De Santis, A.; Cianchini, G.; Di Giovambattista, R. Accelerating Moment Release Revisited: Examples of Application to Italian Seismic Sequences. Tectonophysics 2015, 639, 82–98. [Google Scholar] [CrossRef]
- Kato, A.; Fukuda, J.; Kumazawa, T.; Nakagawa, S. Accelerated Nucleation of the 2014 Iquique, Chile Mw 8.2 Earthquake. Sci. Rep. 2016, 6, 24792. [Google Scholar] [CrossRef] [PubMed]
- Filizzola, C.; Corrado, A.; Genzano, N.; Lisi, M.; Pergola, N.; Colonna, R.; Tramutoli, V. RST Analysis of Anomalous TIR Sequences in Relation with Earthquakes Occurred in Turkey in the Period 2004–2015. Remote Sens. 2022, 14, 381. [Google Scholar] [CrossRef]
- Tramutoli, V.; Cuomo, V.; Filizzola, C.; Pergola, N.; Pietrapertosa, C. Assessing the Potential of Thermal Infrared Satellite Surveys for Monitoring Seismically Active Areas: The Case of Kocaeli (İzmit) Earthquake, August 17, 1999. Remote Sens. Environ. 2005, 96, 409–426. [Google Scholar] [CrossRef]
- Tramutoli, V.; Bello, G.D.; Pergola, N.; Piscitelli, S. Robust Satellite Techniques for Remote Sensing of Seismically Active Areas. Ann. Geophys. 2001, 44, 295–312. [Google Scholar] [CrossRef]
- Genzano, N.; Filizzola, C.; Hattori, K.; Pergola, N.; Tramutoli, V. Statistical Correlation Analysis Between Thermal Infrared Anomalies Observed From MTSATs and Large Earthquakes Occurred in Japan (2005–2015). J. Geophys. Res. Solid Earth 2021, 126, e2020JB020108. [Google Scholar] [CrossRef]
- Jing, F.; Singh, R.P. Changes in Tropospheric Ozone Associated With Strong Earthquakes and Possible Mechanism. IEEE J. Sel. Top. Appl. Earth Obs. Remote Sens. 2021, 14, 5300–5310. [Google Scholar] [CrossRef]
- Tronin, A.A. Remote Sensing and Earthquakes: A Review. Phys. Chem. Earth Parts A/B/C 2006, 31, 138–142. [Google Scholar] [CrossRef]
- Molchanov, O.A.; Hayakawa, M.; Rafalsky, V.A. Penetration Characteristics of Electromagnetic Emissions from an Underground Seismic Source into the Atmosphere, Ionosphere, and Magnetosphere. J. Geophys. Res. 1995, 100, 1691. [Google Scholar] [CrossRef]
- Han, P.; Hattori, K.; Hirokawa, M.; Zhuang, J.; Chen, C.-H.; Febriani, F.; Yamaguchi, H.; Yoshino, C.; Liu, J.-Y.; Yoshida, S. Statistical Analysis of ULF Seismomagnetic Phenomena at Kakioka, Japan, during 2001–2010: Ulf Seismo-Magnetic Phenomena at Kakioka. J. Geophys. Res. Space Phys. 2014, 119, 4998–5011. [Google Scholar] [CrossRef]
- Cianchini, G.; De Santis, A.; Barraclough, D.R.; Wu, L.X.; Qin, K. Magnetic Transfer Function Entropy and the 2009 Mw = 6.3 L’Aquila Earthquake (Central Italy). Nonlin. Process. Geophys. 2012, 19, 401–409. [Google Scholar] [CrossRef]
- Fidani, C.; Orsini, M.; Iezzi, G.; Vicentini, N.; Stoppa, F. Electric and Magnetic Recordings by Chieti CIEN Station During the Intense 2016–2017 Seismic Swarms in Central Italy. Front. Earth Sci. 2020, 8, 536332. [Google Scholar] [CrossRef]
- Fraser-Smith, A.C.; Bernardi, A.; McGill, P.R.; Ladd, M.E.; Helliwell, R.A.; Villard, O.G. Low-Frequency Magnetic Field Measurements near the Epicenter of the Ms 7.1 Loma Prieta Earthquake. Geophys. Res. Lett. 1990, 17, 1465–1468. [Google Scholar] [CrossRef]
- Uyeda, S.; Hayakawa, M.; Nagao, T.; Molchanov, O.; Hattori, K.; Orihara, Y.; Gotoh, K.; Akinaga, Y.; Tanaka, H. Electric and Magnetic Phenomena Observed before the Volcano-Seismic Activity in 2000 in the Izu Island Region, Japan. Proc. Natl. Acad. Sci. USA 2002, 99, 7352–7355. [Google Scholar] [CrossRef] [PubMed]
- De Santis, A.; Balasis, G.; Pavón-Carrasco, F.J.; Cianchini, G.; Mandea, M. Potential Earthquake Precursory Pattern from Space: The 2015 Nepal Event as Seen by Magnetic Swarm Satellites. Earth Planet. Sci. Lett. 2017, 461, 119–126. [Google Scholar] [CrossRef]
- Christodoulou, V.; Bi, Y.; Wilkie, G. A Tool for Swarm Satellite Data Analysis and Anomaly Detection. PLoS ONE 2019, 14, e0212098. [Google Scholar] [CrossRef] [PubMed]
- Xie, T.; Chen, B.; Wu, L.; Dai, W.; Kuang, C.; Miao, Z. Detecting Seismo-Ionospheric Anomalies Possibly Associated With the 2019 Ridgecrest (California) Earthquakes by GNSS, CSES, and Swarm Observations. JGR Space Phys. 2021, 126, e2020JA028761. [Google Scholar] [CrossRef]
- Athanasiou, M.A.; Anagnostopoulos, G.C.; Iliopoulos, A.C.; Pavlos, G.P.; David, C.N. Enhanced ULF Radiation Observed by DEMETER Two Months around the Strong 2010 Haiti Earthquake. Nat. Hazards Earth Syst. Sci. 2011, 11, 1091–1098. [Google Scholar] [CrossRef]
- Ouyang, X.Y.; Parrot, M.; Bortnik, J. ULF Wave Activity Observed in the Nighttime Ionosphere Above and Some Hours Before Strong Earthquakes. J. Geophys. Res. Space Phys. 2020, 125, e2020JA028396. [Google Scholar] [CrossRef]
- Chen, H.; Han, P.; Hattori, K. Recent Advances and Challenges in the Seismo-Electromagnetic Study: A Brief Review. Remote Sens. 2022, 14, 5893. [Google Scholar] [CrossRef]
- Hayakawa, M. Seismo Electromagnetics and Earthquake Prediction: History and New Directions. IJEAR 2019, 6, 1–23. [Google Scholar] [CrossRef]
- Hayakawa, M.; Schekotov, A.; Izutsu, J.; Nickolaenko, A.P.; Hobara, Y. Seismogenic ULF/ELF Wave Phenomena: Recent Advances and Future Perspectives. Open J. Earthq. Res. 2023, 12, 45–113. [Google Scholar] [CrossRef]
- Ghamry, E.; Mohamed, E.K.; Abdalzaher, M.S.; Elwekeil, M.; Marchetti, D.; De Santis, A.; Hegy, M.; Yoshikawa, A.; Fathy, A. Integrating Pre-Earthquake Signatures From Different Precursor Tools. IEEE Access 2021, 9, 33268–33283. [Google Scholar] [CrossRef]
- De Santis, A.; Marchetti, D.; Pavón-Carrasco, F.J.; Cianchini, G.; Perrone, L.; Abbattista, C.; Alfonsi, L.; Amoruso, L.; Campuzano, S.A.; Carbone, M.; et al. Precursory Worldwide Signatures of Earthquake Occurrences on Swarm Satellite Data. Sci. Rep. 2019, 9, 20287. [Google Scholar] [CrossRef]
- Marchetti, D.; De Santis, A.; Campuzano, S.A.; Zhu, K.; Soldani, M.; D’Arcangelo, S.; Orlando, M.; Wang, T.; Cianchini, G.; Di Mauro, D.; et al. Worldwide Statistical Correlation of Eight Years of Swarm Satellite Data with M5.5+ Earthquakes: New Hints about the Preseismic Phenomena from Space. Remote Sens. 2022, 14, 2649. [Google Scholar] [CrossRef]
- He, Y.; Zhao, X.; Yang, D.; Wu, Y.; Li, Q. A Study to Investigate the Relationship between Ionospheric Disturbance and Seismic Activity Based on Swarm Satellite Data. Phys. Earth Planet. Inter. 2022, 323, 106826. [Google Scholar] [CrossRef]
- Zhima, Z.; Yan, R.; Lin, J.; Wang, Q.; Yang, Y.; Lv, F.; Huang, J.; Cui, J.; Liu, Q.; Zhao, S.; et al. The Possible Seismo-Ionospheric Perturbations Recorded by the China-Seismo-Electromagnetic Satellite. Remote Sens. 2022, 14, 905. [Google Scholar] [CrossRef]
- Chen, W.; Marchetti, D.; Zhu, K.; Sabbagh, D.; Yan, R.; Zhima, Z.; Shen, X.; Cheng, Y.; Fan, M.; Wang, S.; et al. CSES-01 Electron Density Background Characterisation and Preliminary Investigation of Possible Ne Increase before Global Seismicity. Atmosphere 2023, 14, 1527. [Google Scholar] [CrossRef]
- Perevalova, N.P.; Sankov, V.A.; Astafyeva, E.I.; Zhupityaeva, А.S. Threshold Magnitude for Ionospheric TEC Response to Earthquakes. J. Atmos. Sol. Terr. Phys. 2014, 108, 77–90. [Google Scholar] [CrossRef]
- Cicerone, R.D.; Ebel, J.E.; Britton, J. A Systematic Compilation of Earthquake Precursors. Tectonophysics 2009, 476, 371–396. [Google Scholar] [CrossRef]
- Lin, J.-W.; Chiou, J.-S. Detecting Total Electron Content Precursors Before Earthquakes by Examining Total Electron Content Images Based on Butterworth Filter in Convolutional Neural Networks. IEEE Access 2020, 8, 110478–110494. [Google Scholar] [CrossRef]
- Liu, J.; Wang, W.; Zhang, X.; Wang, Z.; Zhou, C. Ionospheric Total Electron Content Anomaly Possibly Associated with the April 4, 2010 Mw7.2 Baja California Earthquake. Adv. Space Res. 2022, 69, 2126–2141. [Google Scholar] [CrossRef]
- Perrone, L.; Korsunova, L.P.; Mikhailov, A.V. Ionospheric Precursors for Crustal Earthquakes in Italy. Ann. Geophys. 2010, 28, 941–950. [Google Scholar] [CrossRef]
- Sabbagh, D.; Orlando, M.; Perrone, L.; Cianchini, G.; De Santis, A.; Piscini, A. Analysis of the Ionospheric Perturbations Prior to the 2009 L’Aquila and 2002 Molise Earthquakes from Ground- and Space-Based Observations. URSI Radio Sci. Lett. 2021, 3, 1–4. [Google Scholar] [CrossRef]
- Korsunova, L.P.; Khegai, V.V. Medium-Term Ionospheric Precursors to Strong Earthquakes. Int. J. Geomagn. Aeron. 2006, 6, GI3005. [Google Scholar] [CrossRef]
- Kumar, A.; Kumar, S.; Hayakawa, M.; Menk, F. Subionospheric VLF Perturbations Observed at Low Latitude Associated with Earthquake from Indonesia Region. J. Atmos. Sol. Terr. Phys. 2013, 102, 71–80. [Google Scholar] [CrossRef]
- Hayakawa, M.; Kasahara, Y.; Nakamura, T.; Muto, F.; Horie, T.; Maekawa, S.; Hobara, Y.; Rozhnoi, A.A.; Solovieva, M.; Molchanov, O.A. A Statistical Study on the Correlation between Lower Ionospheric Perturbations as Seen by Subionospheric VLF/LF Propagation and Earthquakes: Seismo-ionospheric perturbations. J. Geophys. Res. 2010, 115, A09305. [Google Scholar] [CrossRef]
- Politis, D.Z.; Potirakis, S.M.; Contoyiannis, Y.F.; Biswas, S.; Sasmal, S.; Hayakawa, M. Statistical and Criticality Analysis of the Lower Ionosphere Prior to the 30 October 2020 Samos (Greece) Earthquake (M6.9), Based on VLF Electromagnetic Propagation Data as Recorded by a New VLF/LF Receiver Installed in Athens (Greece). Entropy 2021, 23, 676. [Google Scholar] [CrossRef]
- Styron, R.; García-Pelaez, J.; Pagani, M. GEM Central America and Caribbean Active Faults Database. 2018. Available online: https://github.com/GEMScienceTools/central_am_carib_faults (accessed on 9 February 2024).
- Styron, R.; García-Pelaez, J.; Pagani, M. CCAF-DB: The Caribbean and Central American Active Fault Database. Nat. Hazards Earth Syst. Sci. 2020, 20, 831–857. [Google Scholar] [CrossRef]
- Burbach, G.V.; Frohlich, C.; Pennington, W.D.; Matumoto, T. Seismicity and Tectonics of the Subducted Cocos Plate. J. Geophys. Res. Solid Earth 1984, 89, 7719–7735. [Google Scholar] [CrossRef]
- Cordani, U.; Ramos, V.; Fraga, L.; Cegarra, M.; Delgado, I.; de Souza, K.G.; Gomes, F.E.; Schobbenhaus, C. Tectonic Map of South America at 1:5,900,000 Scale, 600th ed.; Commission for the Geological Map of the World (CGMW): Paris, France, 2019. [Google Scholar]
- Cediel, F.; Shaw, R.P.; Cáceres, C. Tectonic Assembly of the Northern Andean Block. In The Circum-Gulf of Mexico and the Caribbean: Hydrocarbon Habitats, Basin Formation and Plate Tectonics; Bartolini, C., Buffler, R.T., Blickwede, J.F., Eds.; American Association of Petroleum Geologists: Tulsa, OK, USA, 2003; Volume 79, ISBN 978-1-62981-054-6. [Google Scholar]
- Akhoondzadeh, M. Investigation of the LAIC Mechanism of the Haiti Earthquake (14 August 2021) Using CSES-01 Satellite Observations and Other Earthquake Precursors. Adv. Space Res. 2024, 73, 672–684. [Google Scholar] [CrossRef]
- Akhoondzadeh, M.; Marchetti, D. Study of the Preparation Phase of Turkey’s Powerful Earthquake (6 February 2023) by a Geophysical Multi-Parametric Fuzzy Inference System. Remote Sens. 2023, 15, 2224. [Google Scholar] [CrossRef]
- Khan, M.M.; Ghaffar, B.; Shahzad, R.; Khan, M.R.; Shah, M.; Amin, A.H.; Eldin, S.M.; Naqvi, N.A.; Ali, R. Atmospheric Anomalies Associated with the 2021 Mw 7.2 Haiti Earthquake Using Machine Learning from Multiple Satellites. Sustainability 2022, 14, 14782. [Google Scholar] [CrossRef]
- Chen, D.; Meng, D.; Wang, F.; Gou, Y. A Study of Ionospheric Anomaly Detection before the August 14, 2021 Mw7.2 Earthquake in Haiti Based on Sliding Interquartile Range Method. Acta Geodaetica et Geophysica 2023, 58, 539–551. [Google Scholar] [CrossRef]
- D’Angelo, G.; Piersanti, M.; Battiston, R.; Bertello, I.; Carbone, V.; Cicone, A.; Diego, P.; Papini, E.; Parmentier, A.; Picozza, P.; et al. Haiti Earthquake (Mw 7.2): Magnetospheric–Ionospheric–Lithospheric Coupling during and after the Main Shock on 14 August 2021. Remote Sens. 2022, 14, 5340. [Google Scholar] [CrossRef]
- Rapoport, Y.G.; Gotynyan, O.E.; Ivchenko, V.M.; Kozak, L.V.; Parrot, M. Effect of Acoustic-Gravity Wave of the Lithospheric Origin on the Ionospheric F Region before Earthquakes. Phys. Chem. Earth Parts A/B/C 2004, 29, 607–616. [Google Scholar] [CrossRef]
- Godin, O.A. Finite-Amplitude Acoustic-Gravity Waves: Exact Solutions. J. Fluid Mech. 2015, 767, 52–64. [Google Scholar] [CrossRef]
- Yeh, K.C.; Liu, C.H. Acoustic-Gravity Waves in the Upper Atmosphere. Rev. Geophys. 1974, 12, 193. [Google Scholar] [CrossRef]
- Yang, S.-S.; Hayakawa, M. Gravity Wave Activity in the Stratosphere before the 2011 Tohoku Earthquake as the Mechanism of Lithosphere-Atmosphere-Ionosphere Coupling. Entropy 2020, 22, 110. [Google Scholar] [CrossRef] [PubMed]
- Yang, S.; Asano, T.; Hayakawa, M. Abnormal Gravity Wave Activity in the Stratosphere Prior to the 2016 Kumamoto Earthquakes. JGR Space Phys. 2019, 124, 1410–1425. [Google Scholar] [CrossRef]
- Kundu, S.; Chowdhury, S.; Ghosh, S.; Sasmal, S.; Politis, D.Z.; Potirakis, S.M.; Yang, S.-S.; Chakrabarti, S.K.; Hayakawa, M. Seismogenic Anomalies in Atmospheric Gravity Waves as Observed from SABER/TIMED Satellite during Large Earthquakes. J. Sens. 2022, 2022, 1–23. [Google Scholar] [CrossRef]
- Hayakawa, M.; Kasahara, Y.; Nakamura, T.; Hobara, Y.; Rozhnoi, A.; Solovieva, M.; Molchanov, O.; Korepanov, V. Atmospheric Gravity Waves as a Possible Candidate for Seismo-Ionospheric Perturbations. J. Atmos. Electr. 2011, 31, 129–140. [Google Scholar] [CrossRef]
- Zhang, Y.; Wang, T.; Chen, W.; Zhu, K.; Marchetti, D.; Cheng, Y.; Fan, M.; Wang, S.; Wen, J.; Zhang, D.; et al. Are There One or More Geophysical Coupling Mechanisms before Earthquakes? The Case Study of Lushan (China) 2013. Remote Sens. 2023, 15, 1521. [Google Scholar] [CrossRef]
- Akhoondzadeh, M.; De Santis, A.; Marchetti, D.; Piscini, A.; Cianchini, G. Multi Precursors Analysis Associated with the Powerful Ecuador (MW = 7.8) Earthquake of 16 April 2016 Using Swarm Satellites Data in Conjunction with Other Multi-Platform Satellite and Ground Data. Adv. Space Res. 2018, 61, 248–263. [Google Scholar] [CrossRef]
- Marchetti, D.; De Santis, A.; D’Arcangelo, S.; Poggio, F.; Piscini, A.; Campuzano, S.A.; De Carvalho, W.V.J.O. Pre-Earthquake Chain Processes Detected from Ground to Satellite Altitude in Preparation of the 2016–2017 Seismic Sequence in Central Italy. Remote Sens. Environ. 2019, 229, 93–99. [Google Scholar] [CrossRef]
- Marchetti, D.; De Santis, A.; Shen, X.; Campuzano, S.A.; Perrone, L.; Piscini, A.; Di Giovambattista, R.; Jin, S.; Ippolito, A.; Cianchini, G.; et al. Possible Lithosphere-Atmosphere-Ionosphere Coupling Effects Prior to the 2018 Mw = 7.5 Indonesia Earthquake from Seismic, Atmospheric and Ionospheric Data. J. Asian Earth Sci. 2020, 188, 104097. [Google Scholar] [CrossRef]
- De Santis, A.; Perrone, L.; Calcara, M.; Campuzano, S.A.; Cianchini, G.; D’Arcangelo, S.; Di Mauro, D.; Marchetti, D.; Nardi, A.; Orlando, M.; et al. A Comprehensive Multiparametric and Multilayer Approach to Study the Preparation Phase of Large Earthquakes from Ground to Space: The Case Study of the June 15 2019, M7.2 Kermadec Islands (New Zealand) Earthquake. Remote Sens. Environ. 2022, 283, 113325. [Google Scholar] [CrossRef]
- Marchetti, D.; Zhu, K.; Marchetti, L.; Zhang, Y.; Chen, W.; Cheng, Y.; Fan, M.; Wang, S.; Wang, T.; Wen, J.; et al. Quick Report on the ML = 3.3 on 1 January 2023 Guidonia (Rome, Italy) Earthquake: Evidence of a Seismic Acceleration. Remote Sens. 2023, 15, 942. [Google Scholar] [CrossRef]
- Rikitake, T. Classification of Earthquake Precursors. Tectonophysics 1979, 54, 293–309. [Google Scholar] [CrossRef]
- Rikitake, T. Earthquake Precursors in Japan: Precursor Time and Detectability. Tectonophysics 1987, 136, 265–282. [Google Scholar] [CrossRef]
- Scholz, C.H.; Sykes, L.R.; Aggarwal, Y.P. Earthquake Prediction: A Physical Basis. Science 1973, 181, 803–810. [Google Scholar] [CrossRef] [PubMed]
- Scholz, C.H. Earthquakes and Friction Laws. Nature 1998, 391, 37–42. [Google Scholar] [CrossRef]
- Console, R.; Yamaoka, K.; Zhuang, J. Implementation of Short- and Medium-Term Earthquake Forecasts. Int. J. Geophys. 2012, 2012, 1–2. [Google Scholar] [CrossRef]
- Dobrovolsky, I.P.; Zubkov, S.I.; Miachkin, V.I. Estimation of the Size of Earthquake Preparation Zones. Pageoph 1979, 117, 1025–1044. [Google Scholar] [CrossRef]
- Wiemer, S. A Software Package to Analyze Seismicity: ZMAP. Seismol. Res. Lett. 2001, 72, 373–382. [Google Scholar] [CrossRef]
- Gelaro, R.; McCarty, W.; Suárez, M.J.; Todling, R.; Molod, A.; Takacs, L.; Randles, C.A.; Darmenov, A.; Bosilovich, M.G.; Reichle, R.; et al. The Modern-Era Retrospective Analysis for Research and Applications, Version 2 (MERRA-2). J. Climate 2017, 30, 5419–5454. [Google Scholar] [CrossRef] [PubMed]
- De Santis, A.; Cianchini, G.; Marchetti, D.; Piscini, A.; Sabbagh, D.; Perrone, L.; Campuzano, S.A.; Inan, S. A Multiparametric Approach to Study the Preparation Phase of the 2019 M7.1 Ridgecrest (California, United States) Earthquake. Front. Earth Sci. 2020, 8, 540398. [Google Scholar] [CrossRef]
- Marchetti, D.; Zhu, K.; Zhang, H.; Zhima, Z.; Yan, R.; Shen, X.; Chen, W.; Cheng, Y.; He, X.; Wang, T.; et al. Clues of Lithosphere, Atmosphere and Ionosphere Variations Possibly Related to the Preparation of La Palma 19 September 2021 Volcano Eruption. Remote Sens. 2022, 14, 5001. [Google Scholar] [CrossRef]
- Akhoondzadeh, M.; De Santis, A.; Marchetti, D.; Shen, X. Swarm-TEC Satellite Measurements as a Potential Earthquake Precursor Together With Other Swarm and CSES Data: The Case of Mw7.6 2019 Papua New Guinea Seismic Event. Front. Earth Sci. 2022, 10, 820189. [Google Scholar] [CrossRef]
- Marchetti, D.; De Santis, A.; Campuzano, S.A.; Soldani, M.; Piscini, A.; Sabbagh, D.; Cianchini, G.; Perrone, L.; Orlando, M. Swarm Satellite Magnetic Field Data Analysis Prior to 2019 Mw = 7.1 Ridgecrest (California, USA) Earthquake. Geosciences 2020, 10, 502. [Google Scholar] [CrossRef]
- Jakowski, N.; Béniguel, Y.; De Franceschi, G.; Pajares, M.H.; Jacobsen, K.S.; Stanislawska, I.; Tomasik, L.; Warnant, R.; Wautelet, G. Monitoring, Tracking and Forecasting Ionospheric Perturbations Using GNSS Techniques. J. Space Weather Space Clim. 2012, 2, A22. [Google Scholar] [CrossRef]
- Badeke, R.; Borries, C.; Hoque, M.M.; Minkwitz, D. Empirical Forecast of Quiet Time Ionospheric Total Electron Content Maps over Europe. Adv. Space Res. 2018, 61, 2881–2890. [Google Scholar] [CrossRef]
- Hattori, K.; Serita, A.; Gotoh, K.; Yoshino, C.; Harada, M.; Isezaki, N.; Hayakawa, M. ULF Geomagnetic Anomaly Associated with 2000 Izu Islands Earthquake Swarm, Japan. Phys. Chem. Earth Parts A/B/C 2004, 29, 425–435. [Google Scholar] [CrossRef]
- Pulinets, S.; Ouzounov, D. Lithosphere–Atmosphere–Ionosphere Coupling (LAIC) Model–An Unified Concept for Earthquake Precursors Validation. J. Asian Earth Sci. 2011, 41, 371–382. [Google Scholar] [CrossRef]
- Pulinets, S.; Ouzounov, D.; Karelin, A.; Boyarchuk, K. Near-Ground Processes as a Result of Air Ionization. In Earthquake Precursors in the Atmosphere and Ionosphere: New Concepts; Pulinets, S., Ouzounov, D., Karelin, A., Boyarchuk, K., Eds.; Springer: Dordrecht, The Netherlands, 2022; pp. 1–60. ISBN 978-94-024-2172-9. [Google Scholar]
- Piscini, A.; De Santis, A.; Marchetti, D.; Cianchini, G. A Multi-Parametric Climatological Approach to Study the 2016 Amatrice–Norcia (Central Italy) Earthquake Preparatory Phase. Pure Appl. Geophys. 2017, 174, 3673–3688. [Google Scholar] [CrossRef]
- Liu, S.; Cui, Y.; Wei, L.; Liu, W.; Ji, M. Pre-Earthquake MBT Anomalies in the Central and Eastern Qinghai-Tibet Plateau and Their Association to Earthquakes. Remote Sens. Environ. 2023, 298, 113815. [Google Scholar] [CrossRef]
- Freund, F. Pre-Earthquake Signals: Underlying Physical Processes. J. Asian Earth Sci. 2011, 41, 383–400. [Google Scholar] [CrossRef]
- Freund, F.; Ouillon, G.; Scoville, J.; Sornette, D. Earthquake Precursors in the Light of Peroxy Defects Theory: Critical Review of Systematic Observations. Eur. Phys. J. Spec. Top. 2021, 230, 7–46. [Google Scholar] [CrossRef]
- Politis, D.Z.; Potirakis, S.M.; Kundu, S.; Chowdhury, S.; Sasmal, S.; Hayakawa, M. Critical Dynamics in Stratospheric Potential Energy Variations Prior to Significant (M > 6.7) Earthquakes. Symmetry 2022, 14, 1939. [Google Scholar] [CrossRef]
- John, P.C.; Sandy, D.; Robbie, B. Hurricane Elsa; National Hurricane Center Tropical Cyclone Report; National Hurricane Center: Miami, FA, USA, 2022. [Google Scholar]
- Robbie, B. Tropical Storm Fred; National Hurricane Center Tropical Cyclone Report; National Hurricane Center: Miami, FA, USA, 2021. [Google Scholar]
- Brad, J.R.; Amanda, R.; Robbie, B. Hurricane Grace; National Hurricane Center Tropical Cyclone Report; National Hurricane Center: Miami, FA, USA, 2022. [Google Scholar]
- Alfaro, S.; Sen-Crowe, B.; Autrey, C.; Elkbuli, A. Trends in Carbon Monoxide Poisoning Deaths in High Frequency Hurricane States from 2014–19: The Need for Prevention Intervention Strategies. J. Public Health 2023, 45, e250–e259. [Google Scholar] [CrossRef] [PubMed]
- Subramanian, R.; Ellis, A.; Torres-Delgado, E.; Tanzer, R.; Malings, C.; Rivera, F.; Morales, M.; Baumgardner, D.; Presto, A.; Mayol-Bracero, O.L. Air Quality in Puerto Rico in the Aftermath of Hurricane Maria: A Case Study on the Use of Lower Cost Air Quality Monitors. ACS Earth Space Chem. 2018, 2, 1179–1186. [Google Scholar] [CrossRef]
- Chiodini, G.; Cardellini, C.; Amato, A.; Boschi, E.; Caliro, S.; Frondini, F.; Ventura, G. Carbon Dioxide Earth Degassing and Seismogenesis in Central and Southern Italy: Carbon Dioxide Earth Degassing and Seismogenesis. Geophys. Res. Lett. 2004, 31, L07615. [Google Scholar] [CrossRef]
- Chiodini, G.; Cardellini, C.; Di Luccio, F.; Selva, J.; Frondini, F.; Caliro, S.; Rosiello, A.; Beddini, G.; Ventura, G. Correlation between Tectonic CO2 Earth Degassing and Seismicity Is Revealed by a 10-Year Record in the Apennines, Italy. Sci. Adv. 2020, 6, eabc2938. [Google Scholar] [CrossRef] [PubMed]
- Etiope, G.; Martinelli, G. Migration of Carrier and Trace Gases in the Geosphere: An Overview. Phys. Earth Planet. Inter. 2002, 129, 185–204. [Google Scholar] [CrossRef]
- Kuo, C.L.; Lee, L.C.; Huba, J.D. An Improved Coupling Model for the Lithosphere-Atmosphere-Ionosphere System. J. Geophys. Res. Space Phys. 2014, 119, 3189–3205. [Google Scholar] [CrossRef]
- Mirzaee, A.; Estekanchi, H.E.; Vafai, A. Improved Methodology for Endurance Time Analysis: From Time to Seismic Hazard Return Period. Sci. Iran. 2012, 19, 1180–1187. [Google Scholar] [CrossRef]
- Pulinets, S.; Krankowski, A.; Hernandez-Pajares, M.; Marra, S.; Cherniak, I.; Zakharenkova, I.; Rothkaehl, H.; Kotulak, K.; Davidenko, D.; Blaszkiewicz, L.; et al. Ionosphere Sounding for Pre-Seismic Anomalies Identification (INSPIRE): Results of the Project and Perspectives for the Short-Term Earthquake Forecast. Front. Earth Sci. 2021, 9, 610193. [Google Scholar] [CrossRef]
- Pulinets, S.A.; Ouzounov, D. Multi-Instrument Observations and Validation of Laic. American Geophysical Union, Fall Meeting 2014, abstract id NH21C-03. 2014. Available online: https://www.researchgate.net/publication/283515340_Multi-Instrument_Observations_and_Validation_of_Laic (accessed on 29 March 2024).
- Tramutoli, V.; Marchese, F.; Falconieri, A.; Filizzola, C.; Genzano, N.; Hattori, K.; Lisi, M.; Liu, J.-Y.; Ouzounov, D.; Parrot, M.; et al. Tropospheric and Ionospheric Anomalies Induced by Volcanic and Saharan Dust Events as Part of Geosphere Interaction Phenomena. Geosciences 2019, 9, 177. [Google Scholar] [CrossRef]
- Wu, L.; Qi, Y.; Mao, W.; Lu, J.; Ding, Y.; Peng, B.; Xie, B. Scrutinizing and Rooting the Multiple Anomalies of Nepal Earthquake Sequence in 2015 with the Deviation–Time–Space Criterion and Homologous Lithosphere–Coversphere–Atmosphere–Ionosphere Coupling Physics. Nat. Hazards Earth Syst. Sci. 2023, 23, 231–249. [Google Scholar] [CrossRef]
- Ben-Zion, Y.; Zaliapin, I. Localization and Coalescence of Seismicity before Large Earthquakes. Geophys. J. Int. 2020, 223, 561–583. [Google Scholar] [CrossRef]
- Console, R.; Carluccio, R.; Papadimitriou, E.; Karakostas, V. Synthetic Earthquake Catalogs Simulating Seismic Activity in the Corinth Gulf, Greece, Fault System: Corinth Earthquakes Simulations. J. Geophys. Res. Solid Earth 2015, 120, 326–343. [Google Scholar] [CrossRef]
- Parrot, M.; Li, M. Demeter Results Related to Seismic Activity. URSI Radio Sci. Bull. 2015, 2015, 18–25. [Google Scholar] [CrossRef]
- Gutenberg, B. Seismicity of the Earth and Associated Phenomena; Read Books Ltd.: Redditch, UK, 2013. [Google Scholar]
- Gardner, J.K.; Knopoff, L. Is the Sequence of Earthquakes in Southern California, with Aftershocks Removed, Poissonian? Bull. Seismol. Soc. Am. 1974, 64, 1363–1367. [Google Scholar] [CrossRef]
- Peresan, A.; Gorshkov, A.; Soloviev, A.; Panza, G.F. The Contribution of Pattern Recognition of Seismic and Morphostructural Data to Seismic Hazard Assessment. Bull. Geophys. Oceanogr. 2015, 56, 295–328. [Google Scholar] [CrossRef]
- Panza, G.F.; Bela, J. NDSHA: A New Paradigm for Reliable Seismic Hazard Assessment. Eng. Geol. 2020, 275, 105403. [Google Scholar] [CrossRef]
Figure 1.
Geographical and tectonic context of the Mw = 7.2 Haiti 14 August 2021 earthquake. The epicentre is shown as a green star. The yellow circle depicts Dobrovoslky’s area. Blue lines represent the coasts, brown lines represent the active faults (shown only for the Central American and Caribbean regions) and red lines represent the plate borders. Earthquakes of magnitude equal to or greater than 4.2 with a maximum depth of 50 km that occurred in the six months before the Haiti in the Dobrovolsky have been visualised as a filled dot with size proportional to their magnitude and colour to their origin time.

Figure 2.
Yearly average of the selected atmospheric parameters in the investigated six-month period (blue line). The linear fit is shown as a green line and the residual after removing the fit as a red line.
Figure 2.
Yearly average of the selected atmospheric parameters in the investigated six-month period (blue line). The linear fit is shown as a green line and the residual after removing the fit as a red line.
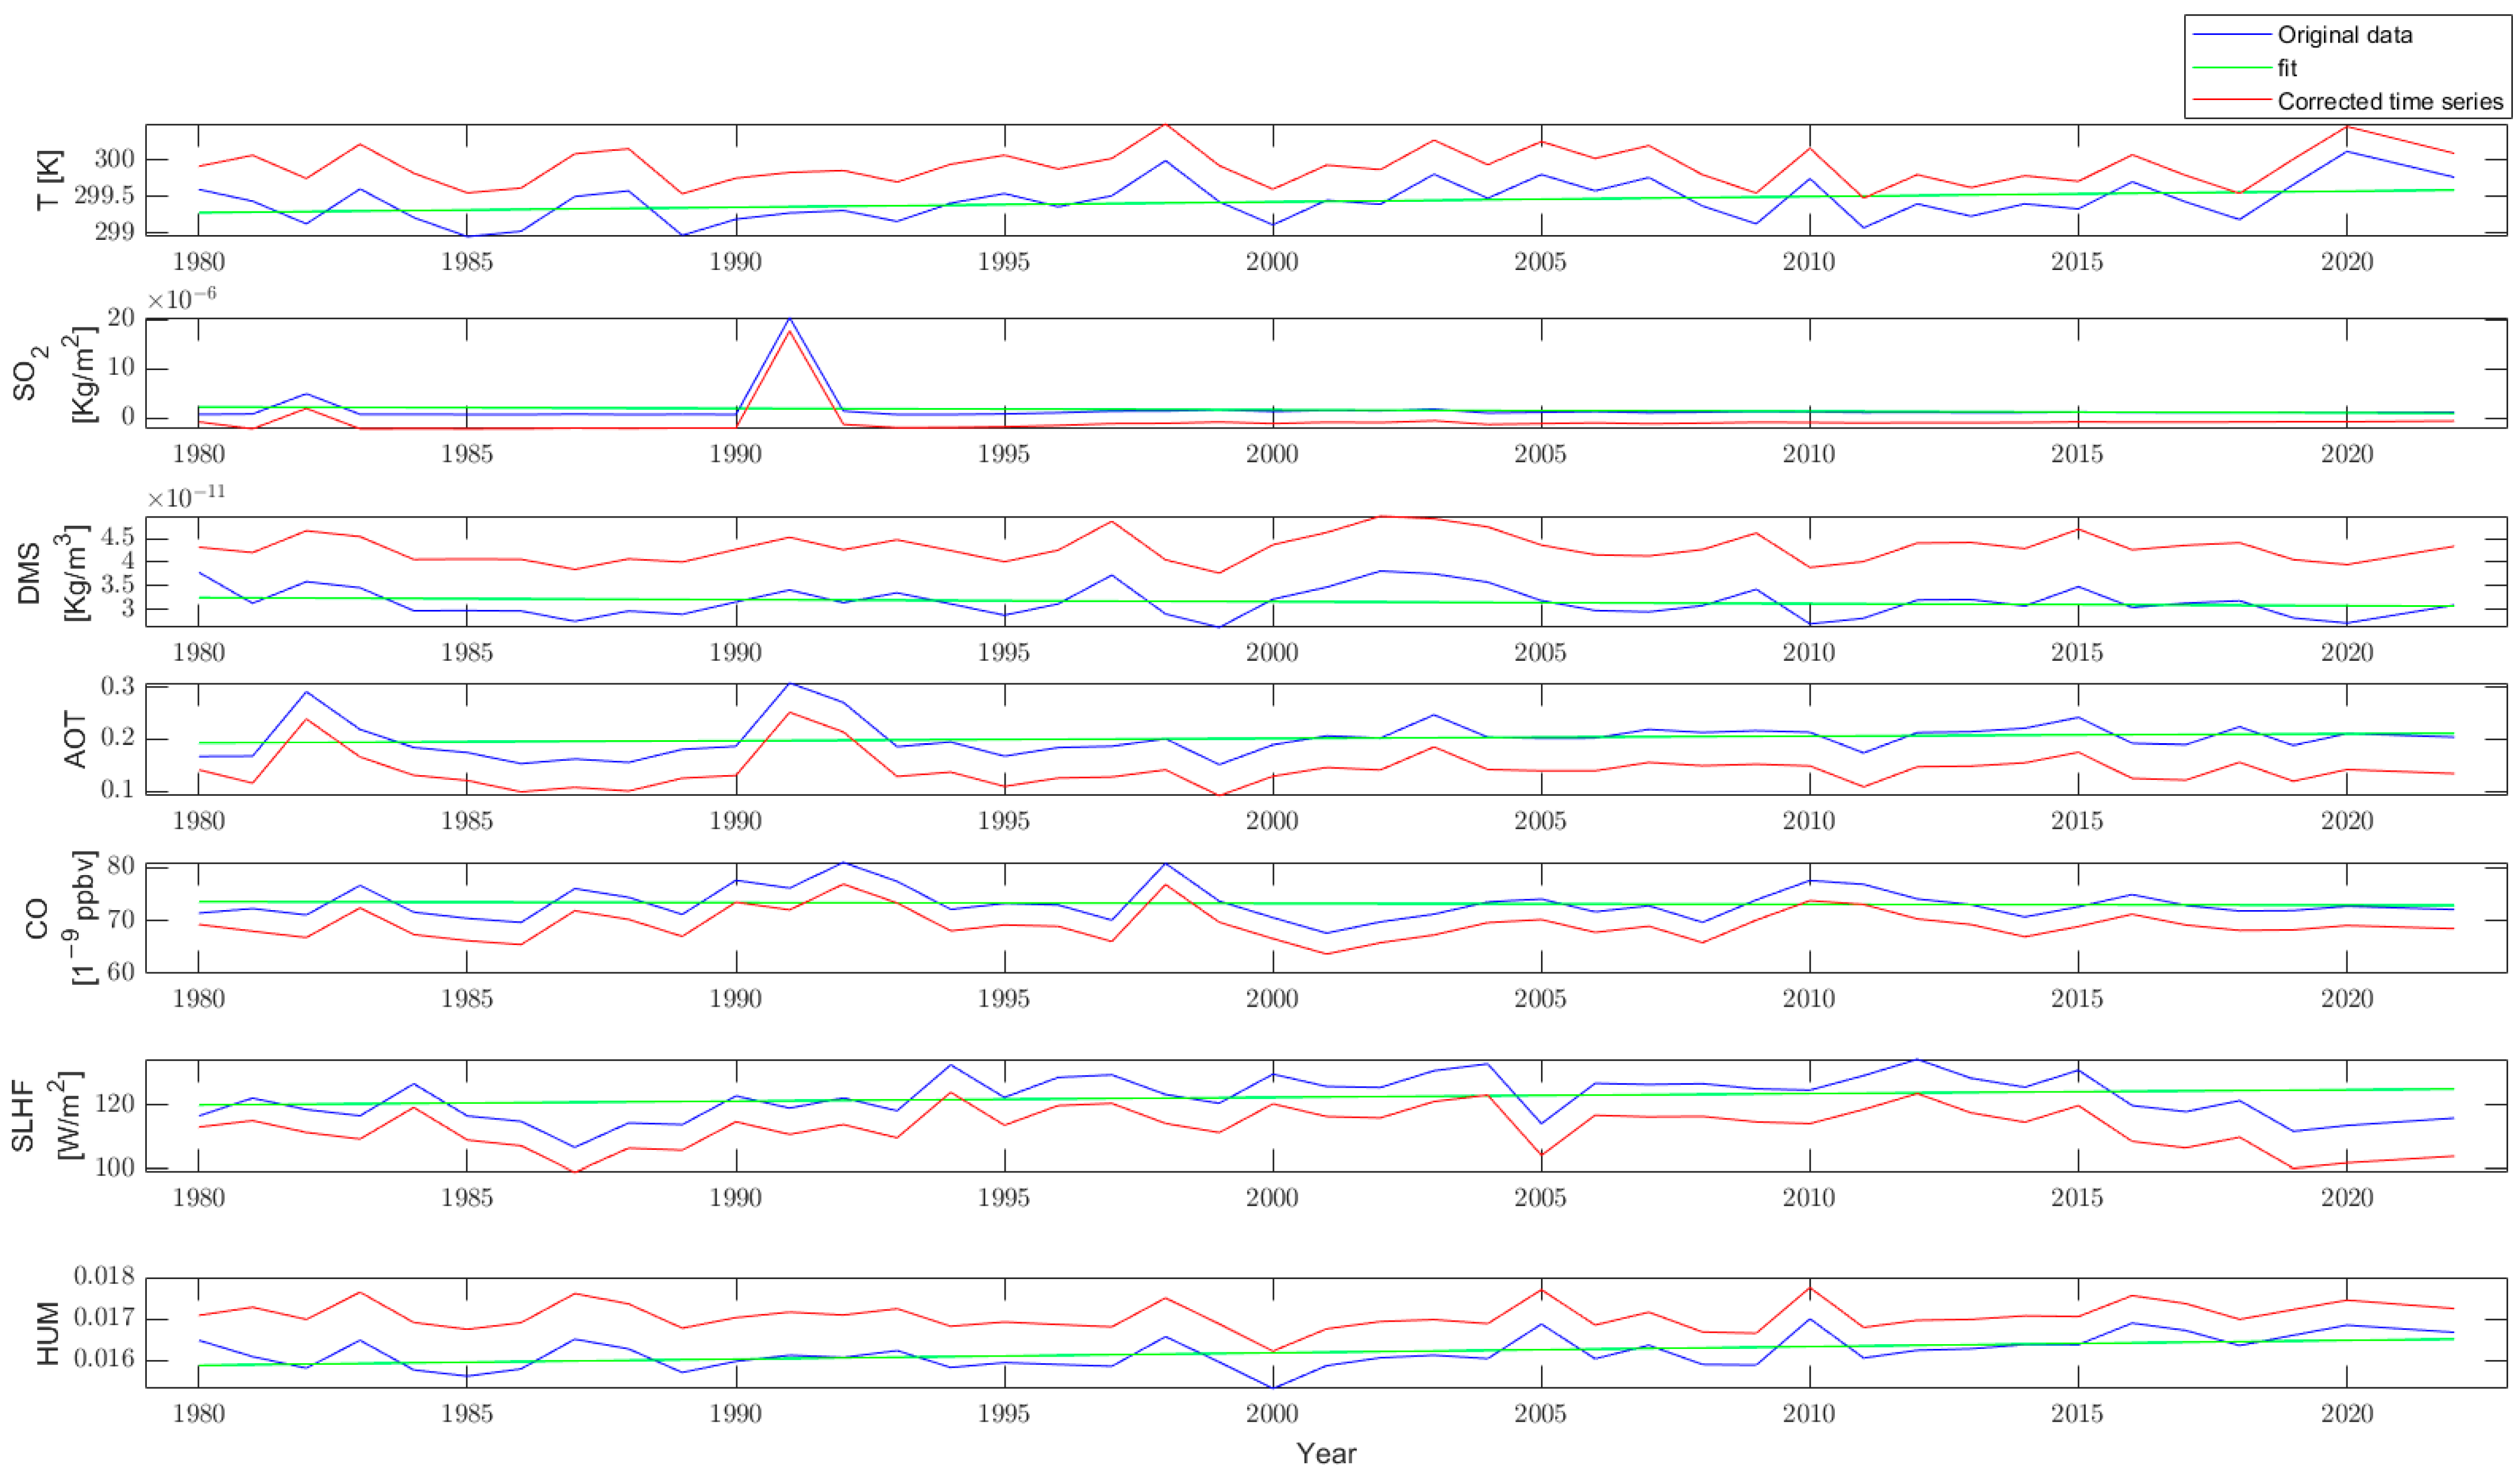
Figure 3.
Time series (a) and histogram (b) of the CH4 values estimated by the instrument AIRS onboard the AQUA satellite provided in version 7.0.
Figure 3.
Time series (a) and histogram (b) of the CH4 values estimated by the instrument AIRS onboard the AQUA satellite provided in version 7.0.
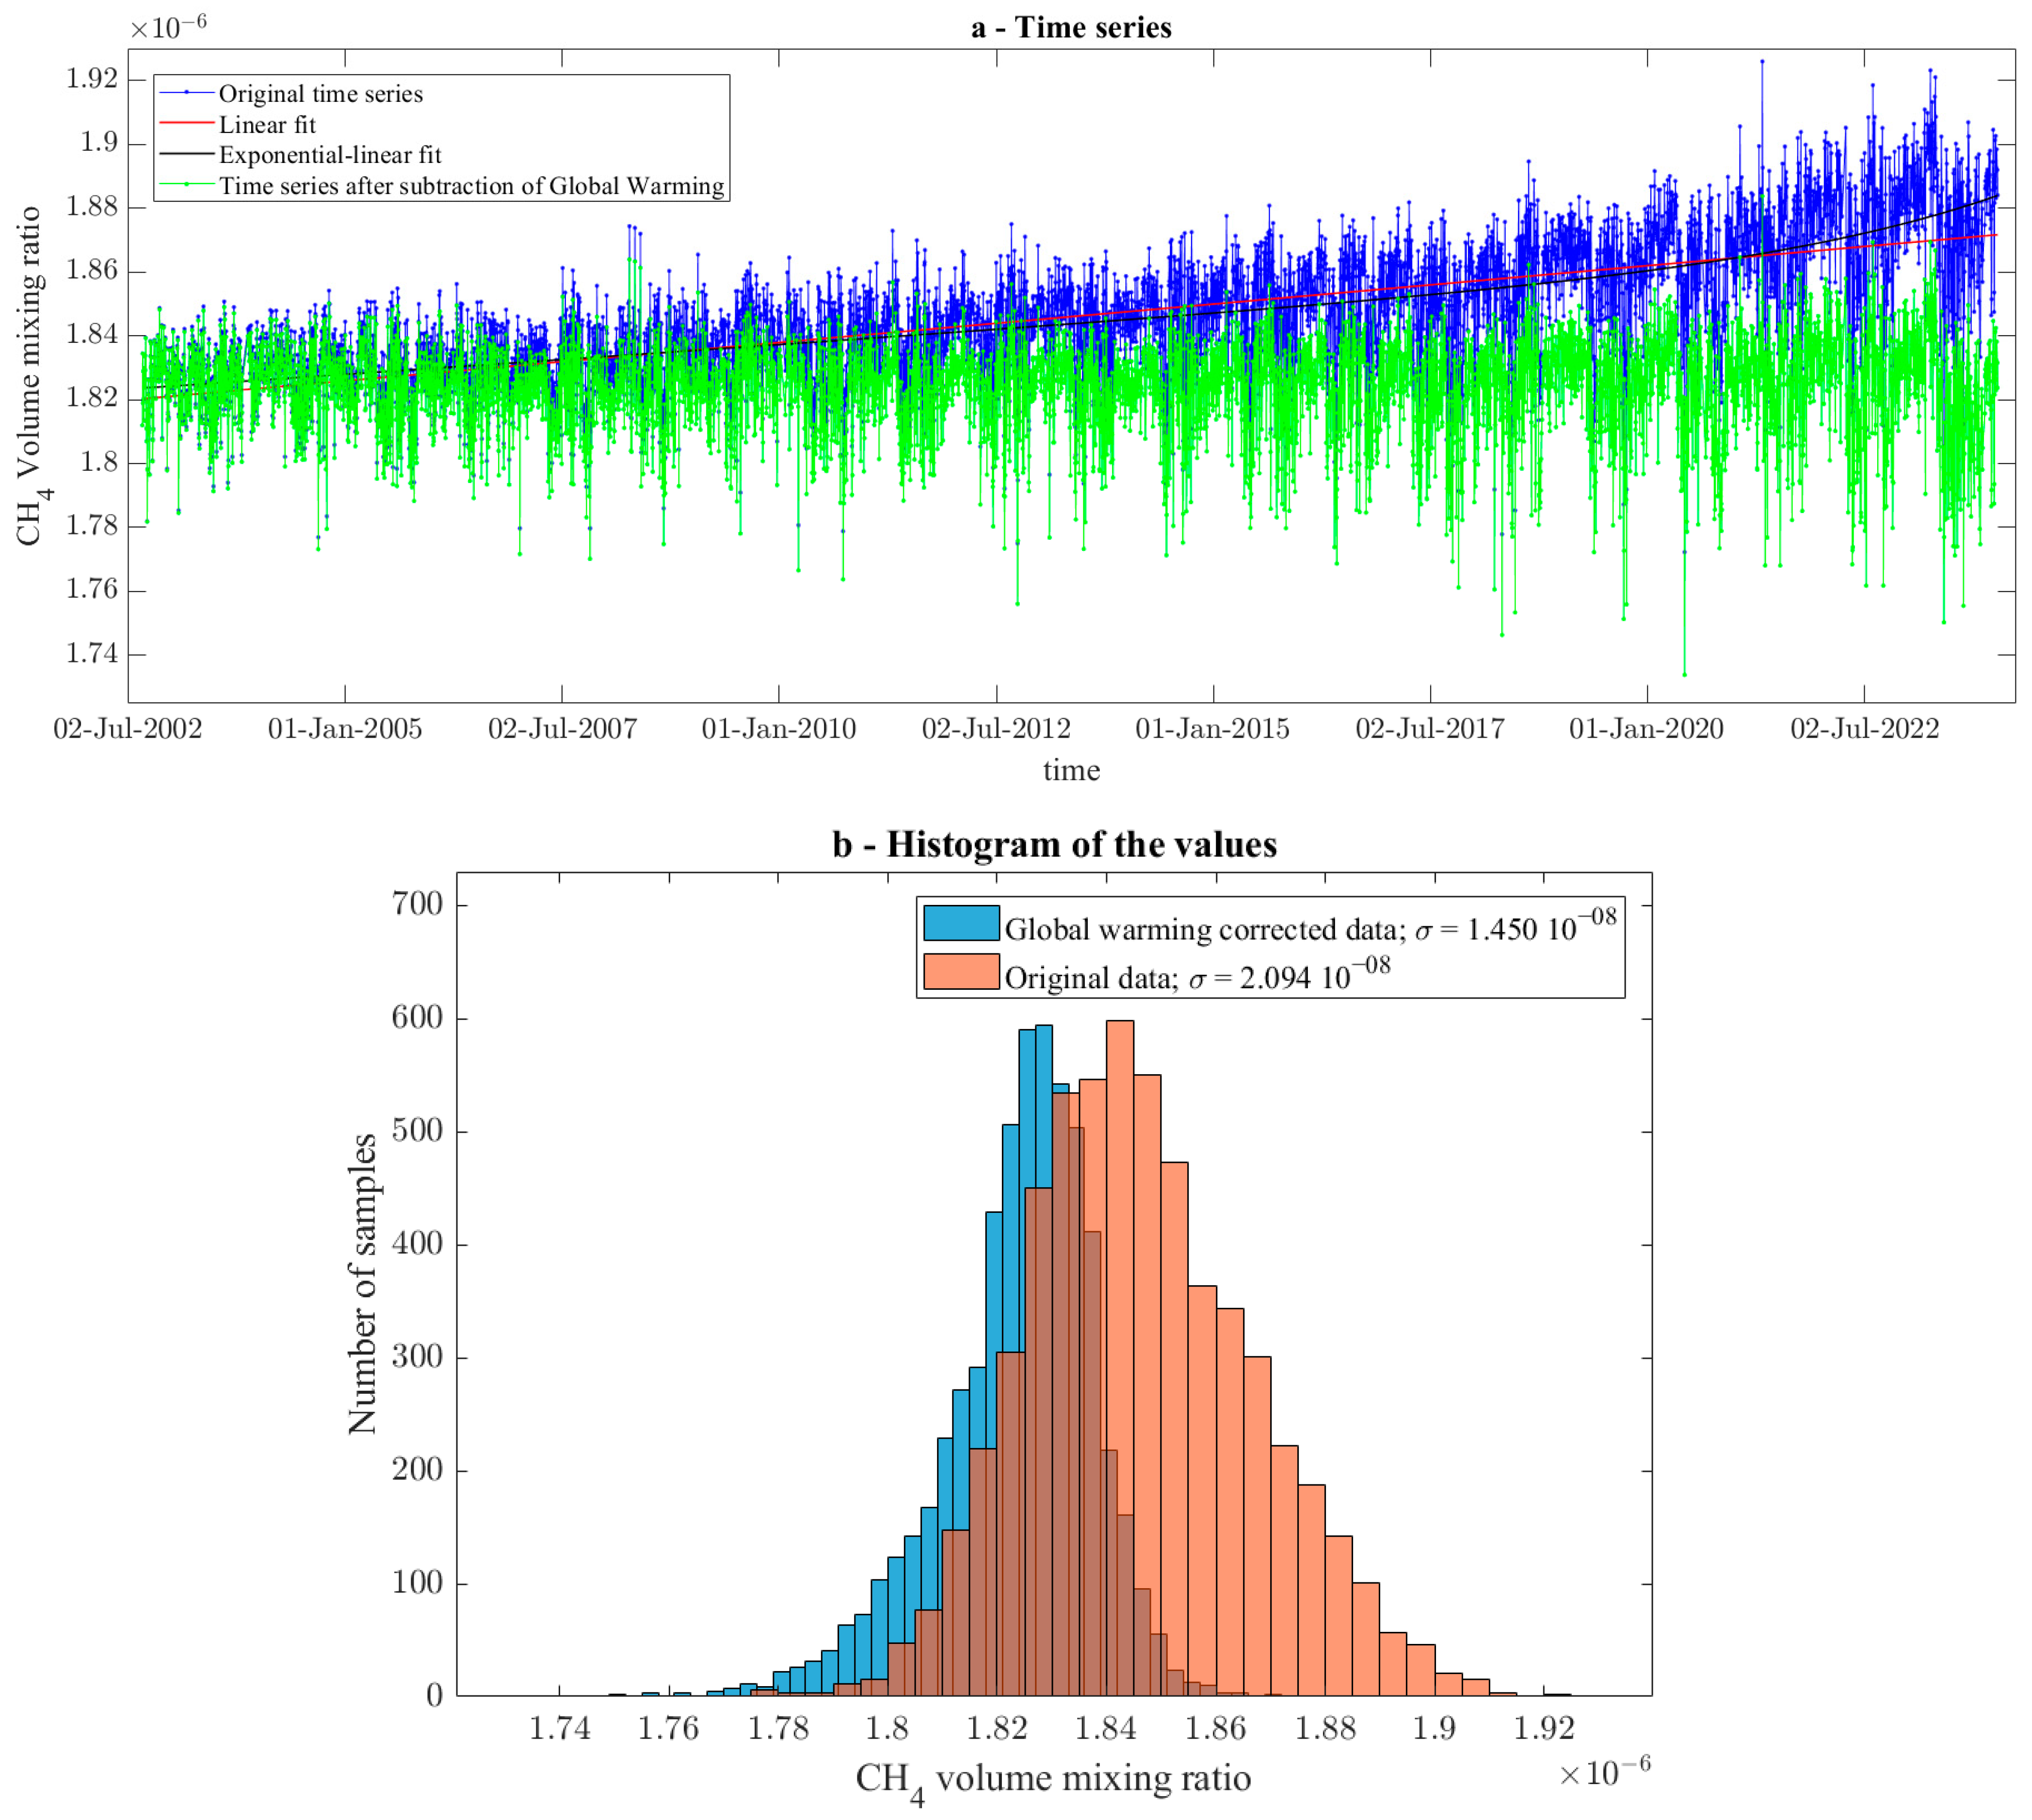
Figure 4.
Selected orbits of CSES-01 as the closest to the Mw = 7.2 Haiti 2021 epicentre.
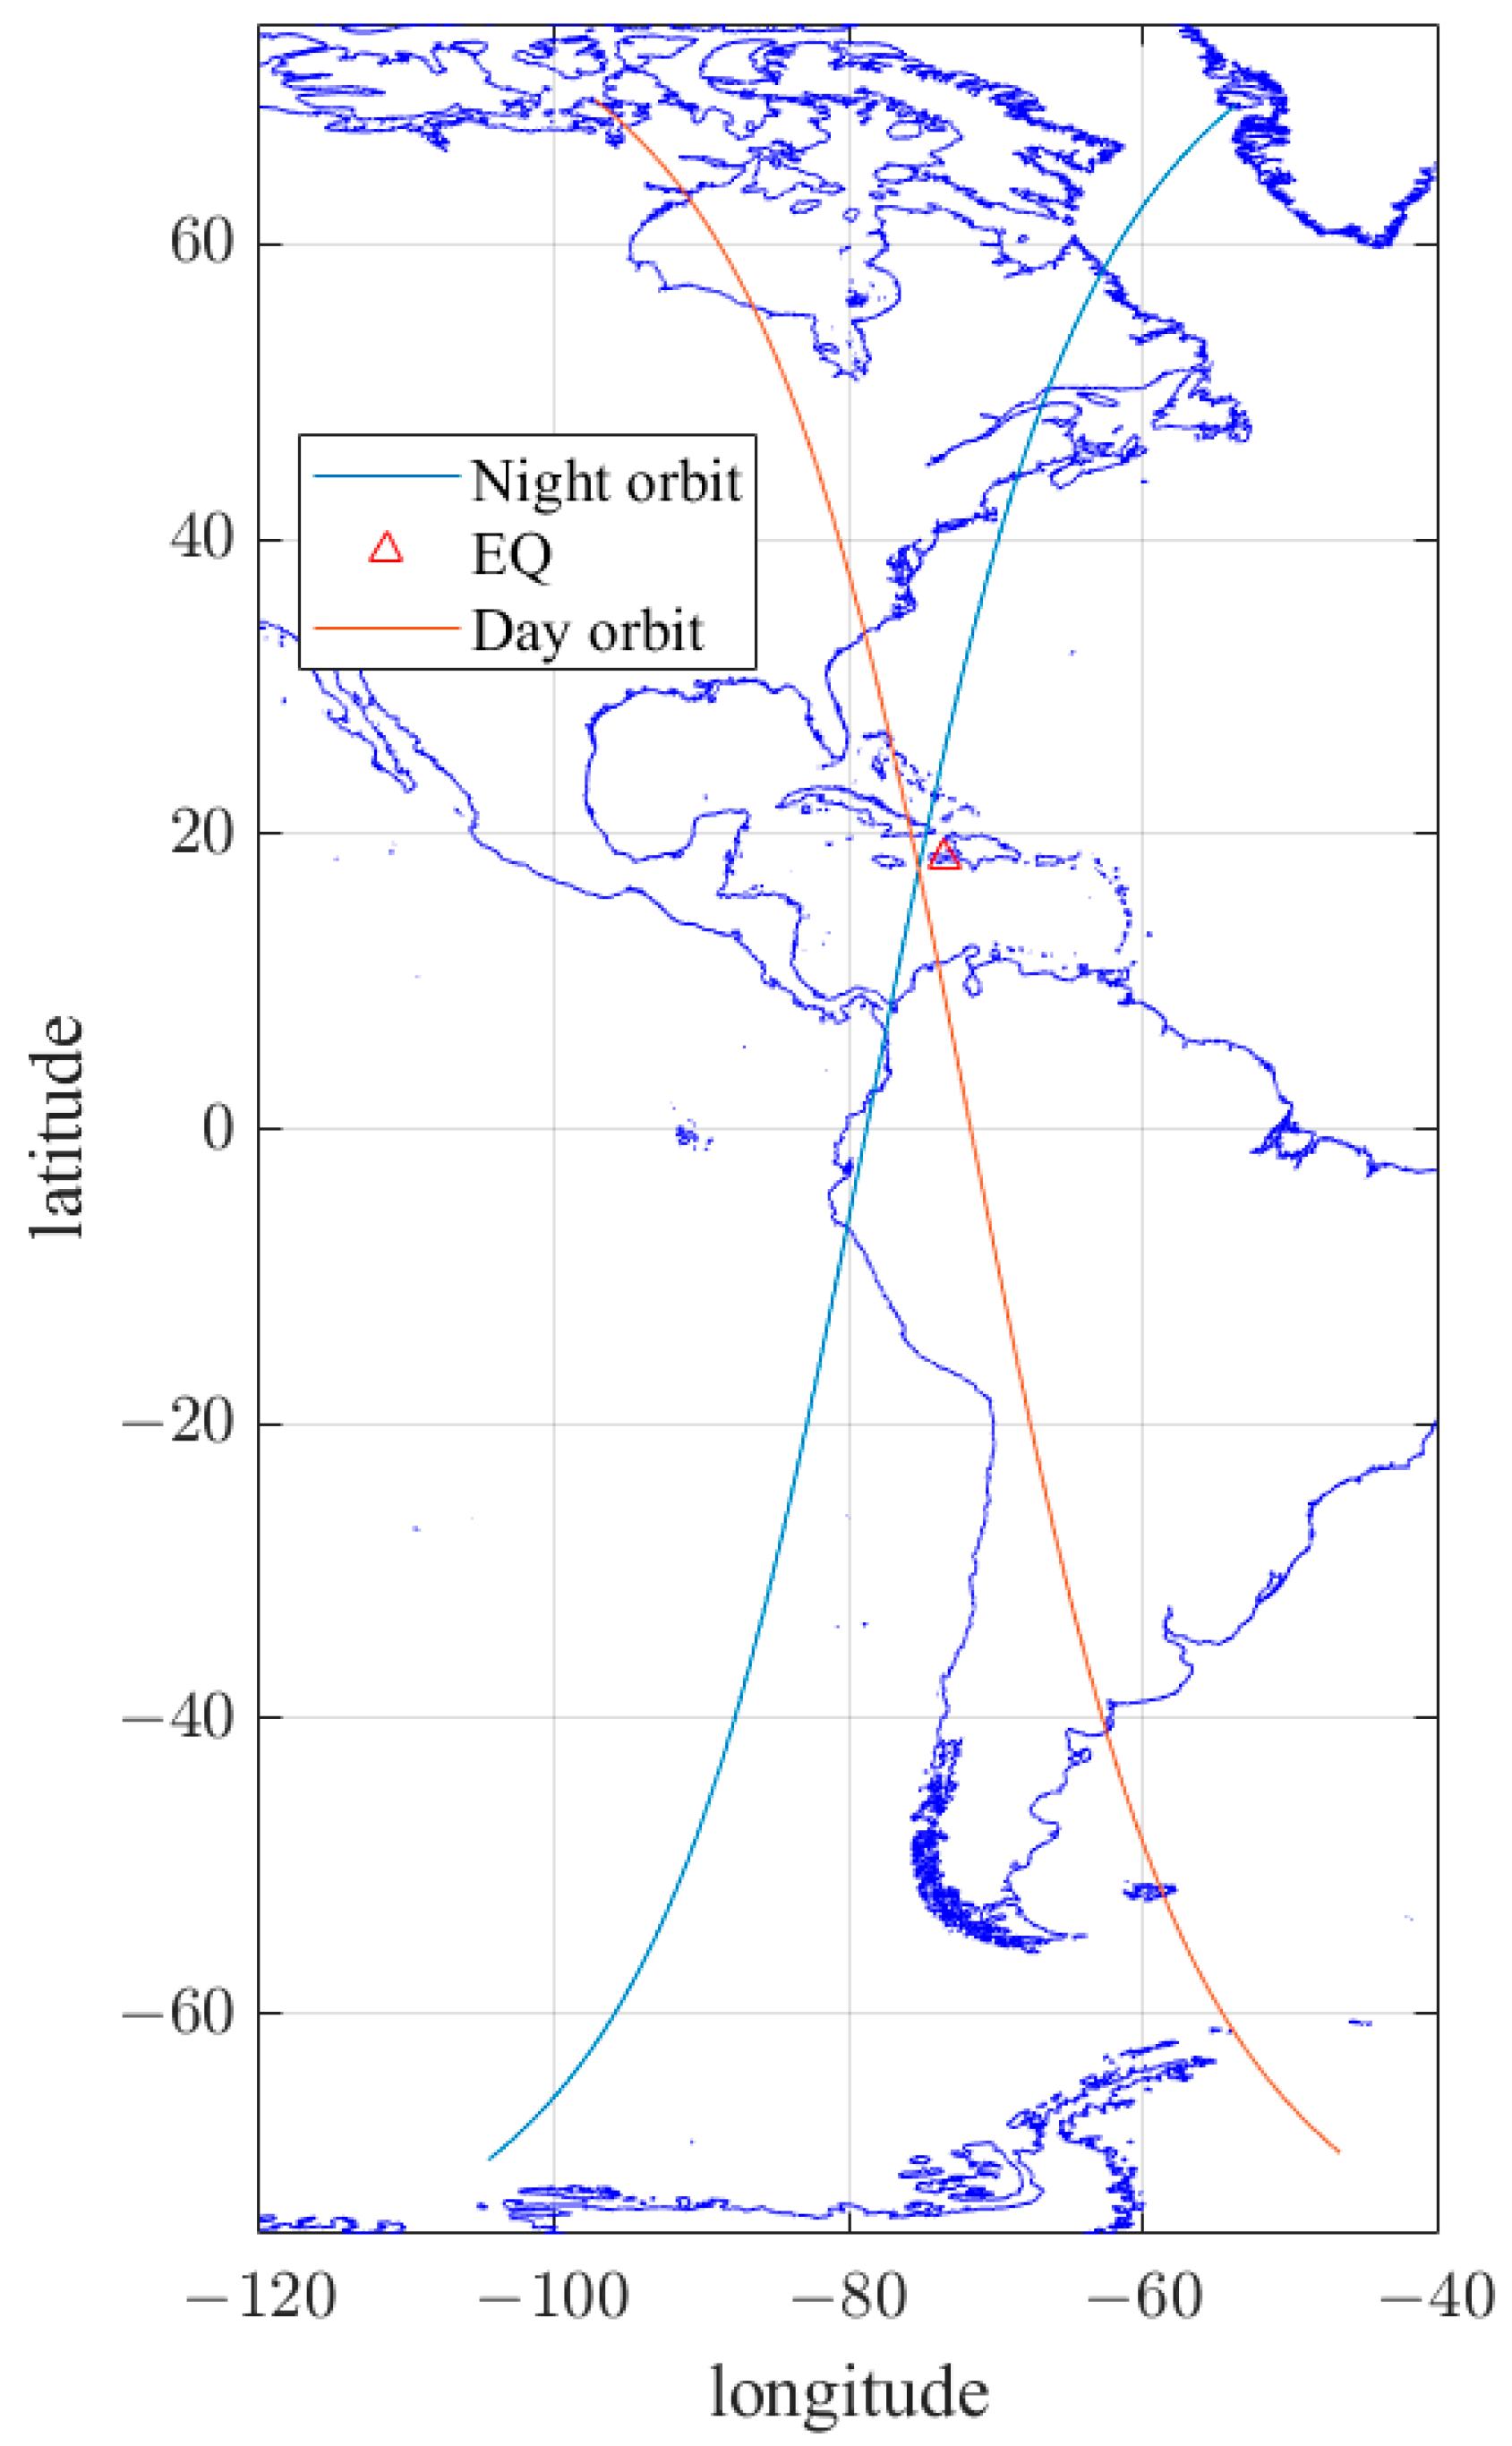
Figure 5.
Cumulative seismic stress calculated with earthquakes in Dobrovolsky’s area and with a magnitude equal to or greater than completeness magnitude 4.3. The fit is shown as a green line, and its coefficients are presented in the box inside the figure (days in the box are counted from 0 to 180 days, in particular, x0 = −65.03 in days with respect to the earthquake day).
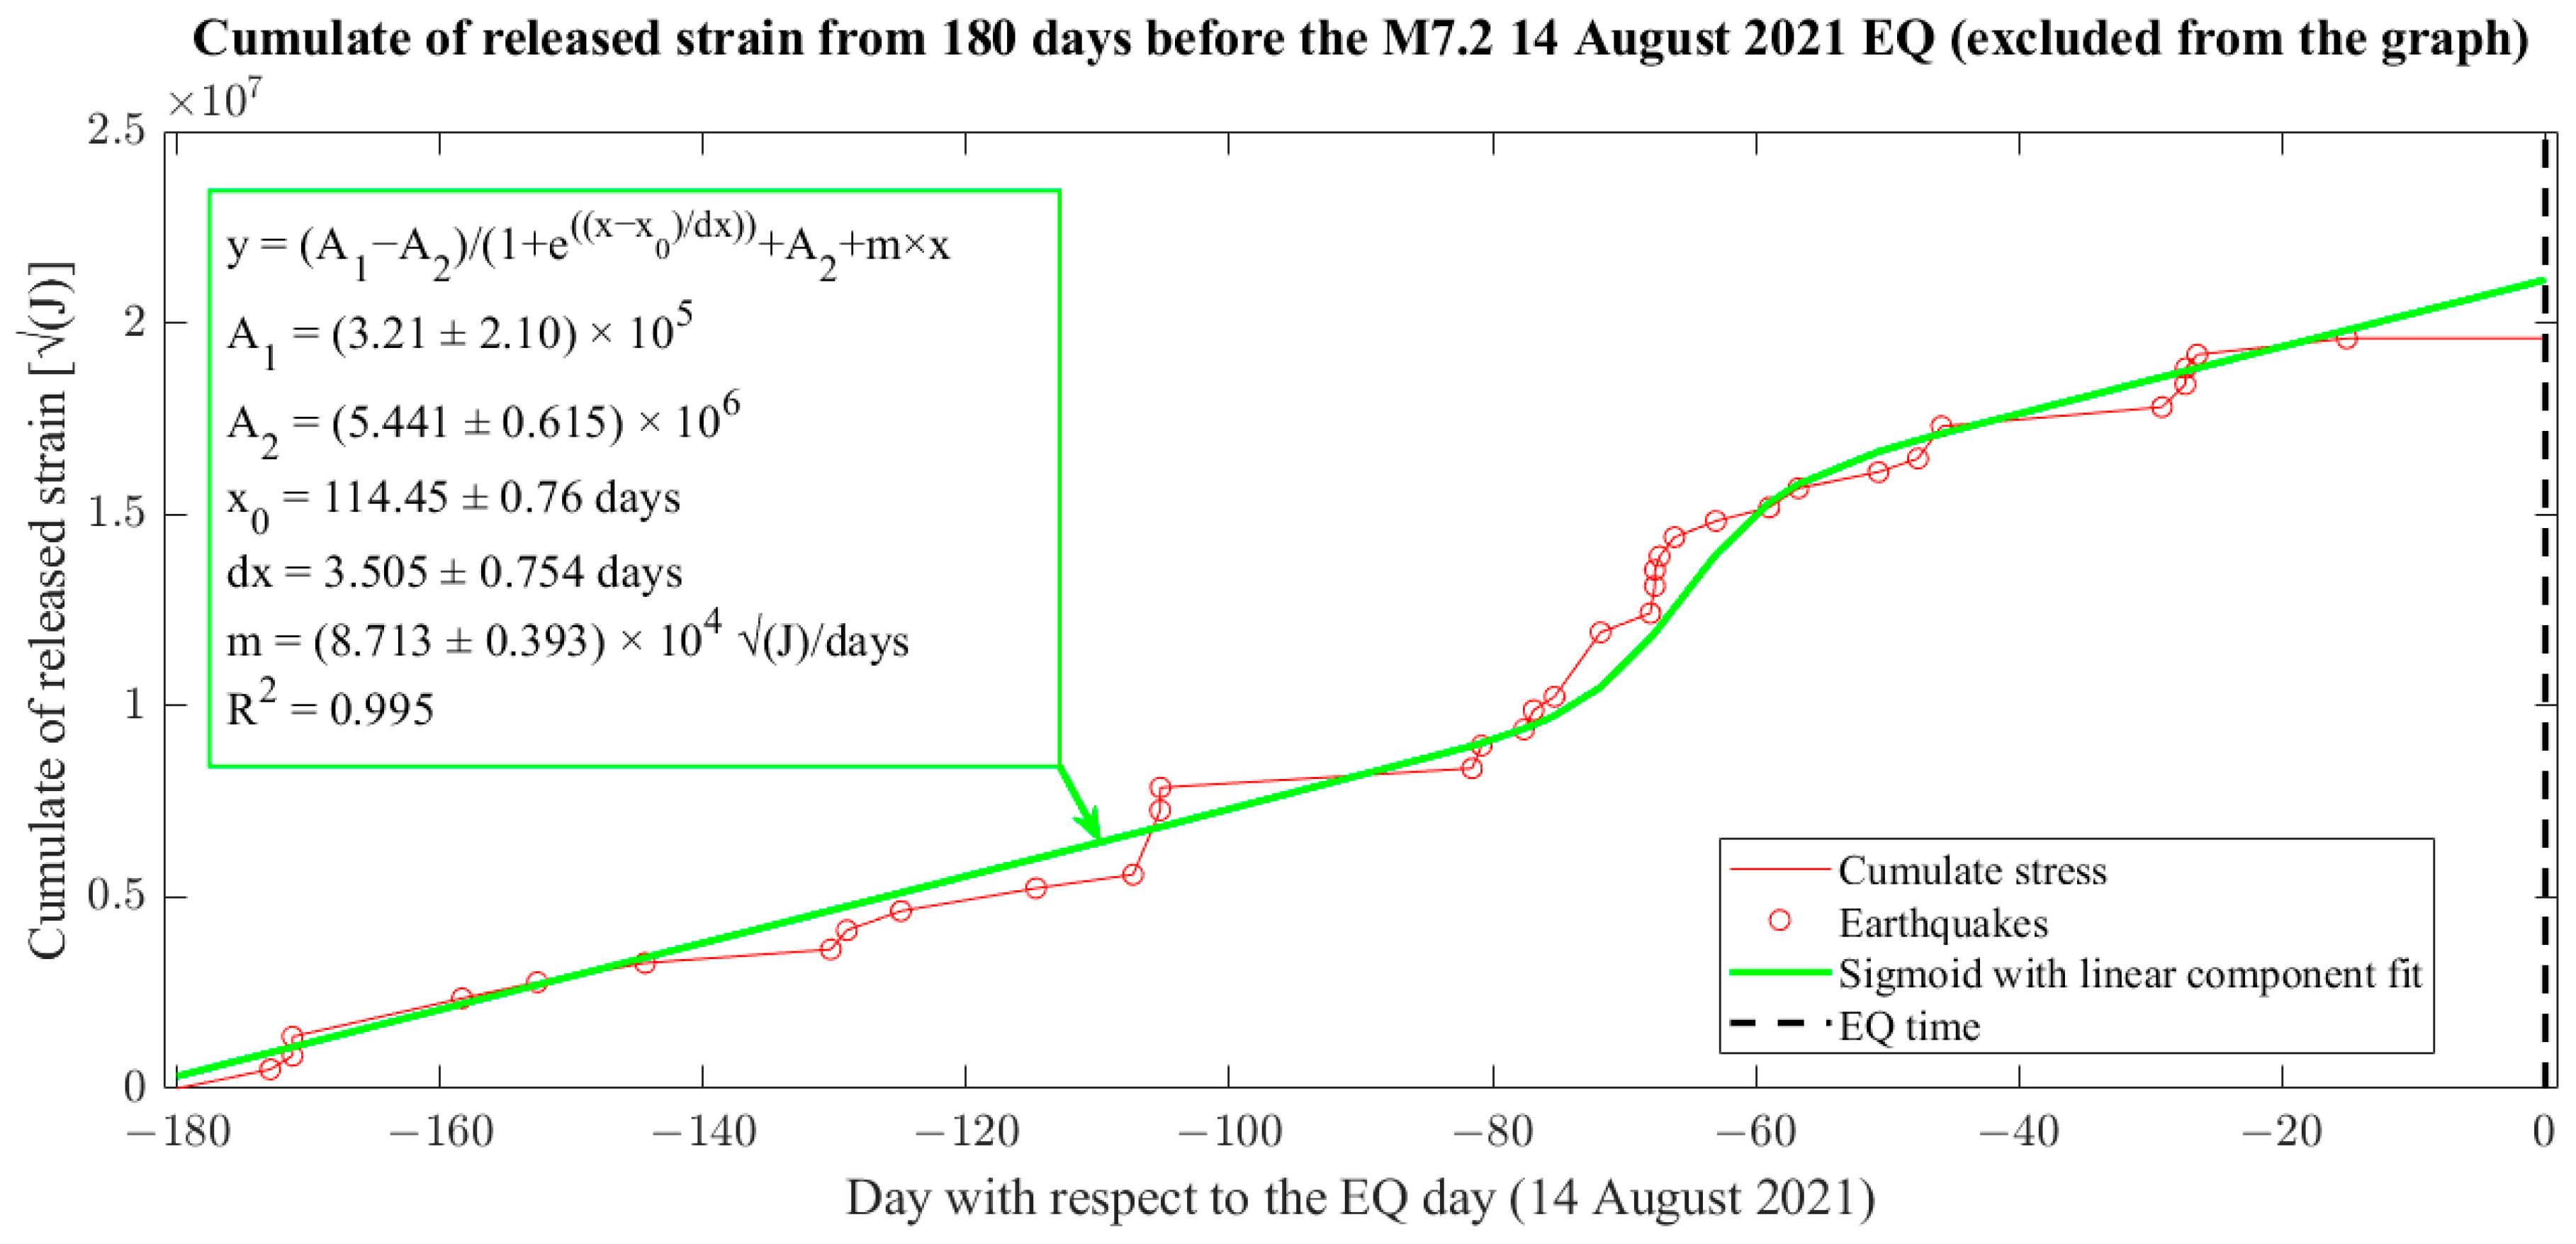
Figure 6.
Daily seismicity analysis made by the daily ES parameter (shown as blue bars). According to the previous literature, the red line represents the threshold to consider active the region on a specific day. The dashed black vertical line indicates the day of Mw = 7.2 Haiti 2021 earthquake.
Figure 6.
Daily seismicity analysis made by the daily ES parameter (shown as blue bars). According to the previous literature, the red line represents the threshold to consider active the region on a specific day. The dashed black vertical line indicates the day of Mw = 7.2 Haiti 2021 earthquake.
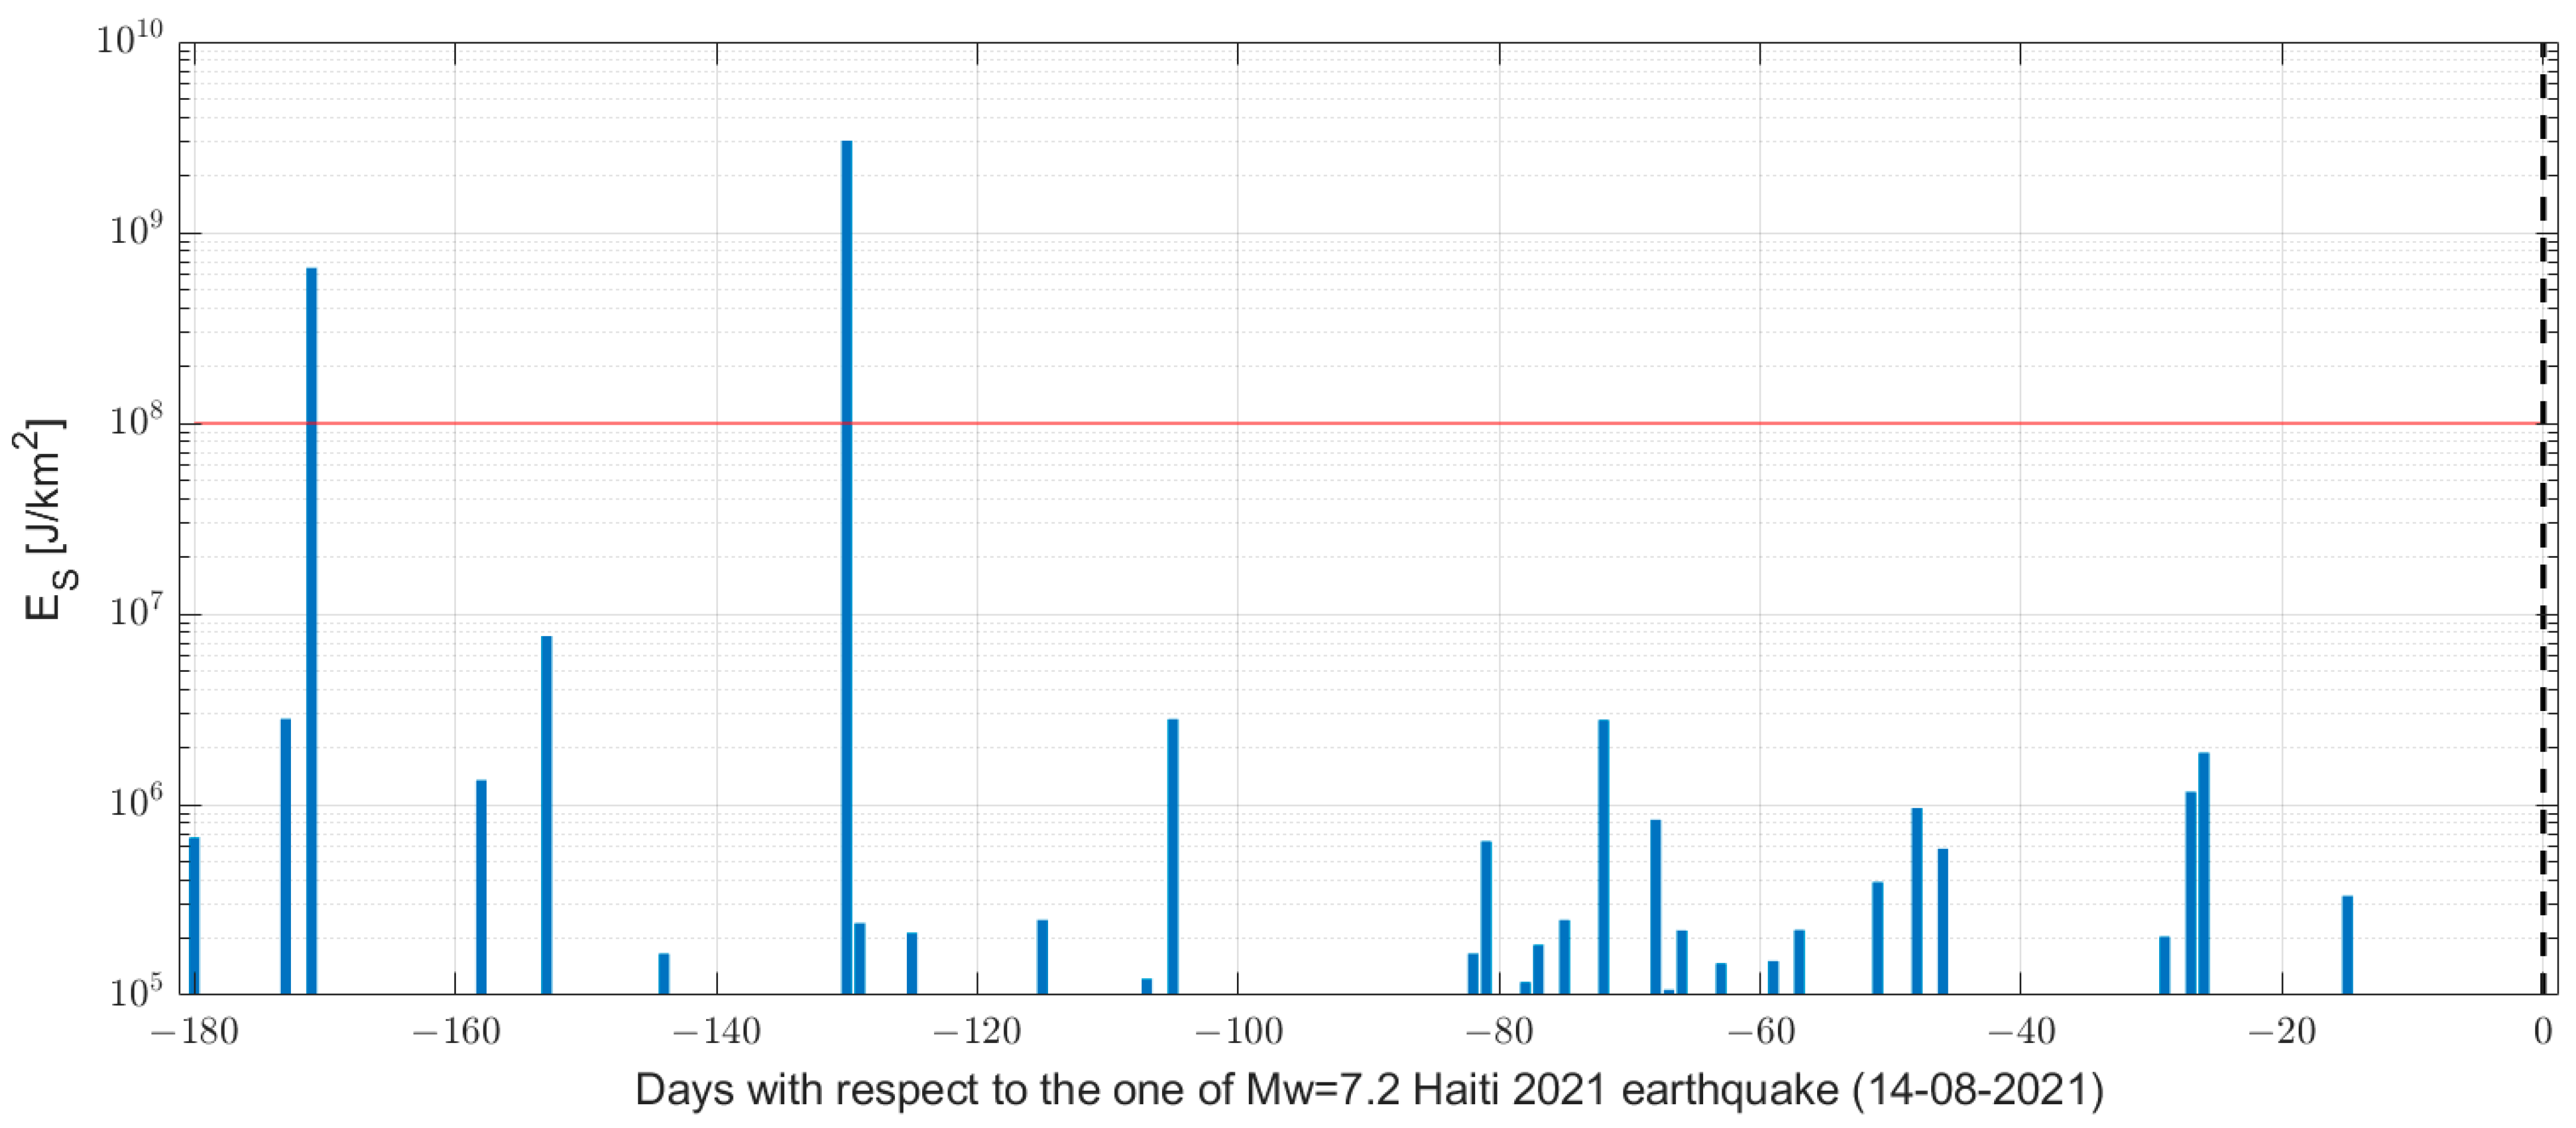
Figure 7.
Aerosol investigation in the six months before the Haiti 2021 earthquake (vertical dashed black line) using (a) a symmetric square area centred on the epicentre or (b) a rectangular area around the seismic displacement. The years 1980 (only a), 1991, 2015 and 2020 have been excluded for outlier values. Red circles underline anomalies in the lower panel and the one in the upper panel, confirmed by investigations in both areas, while orange circles underline anomalies in the upper panel only.
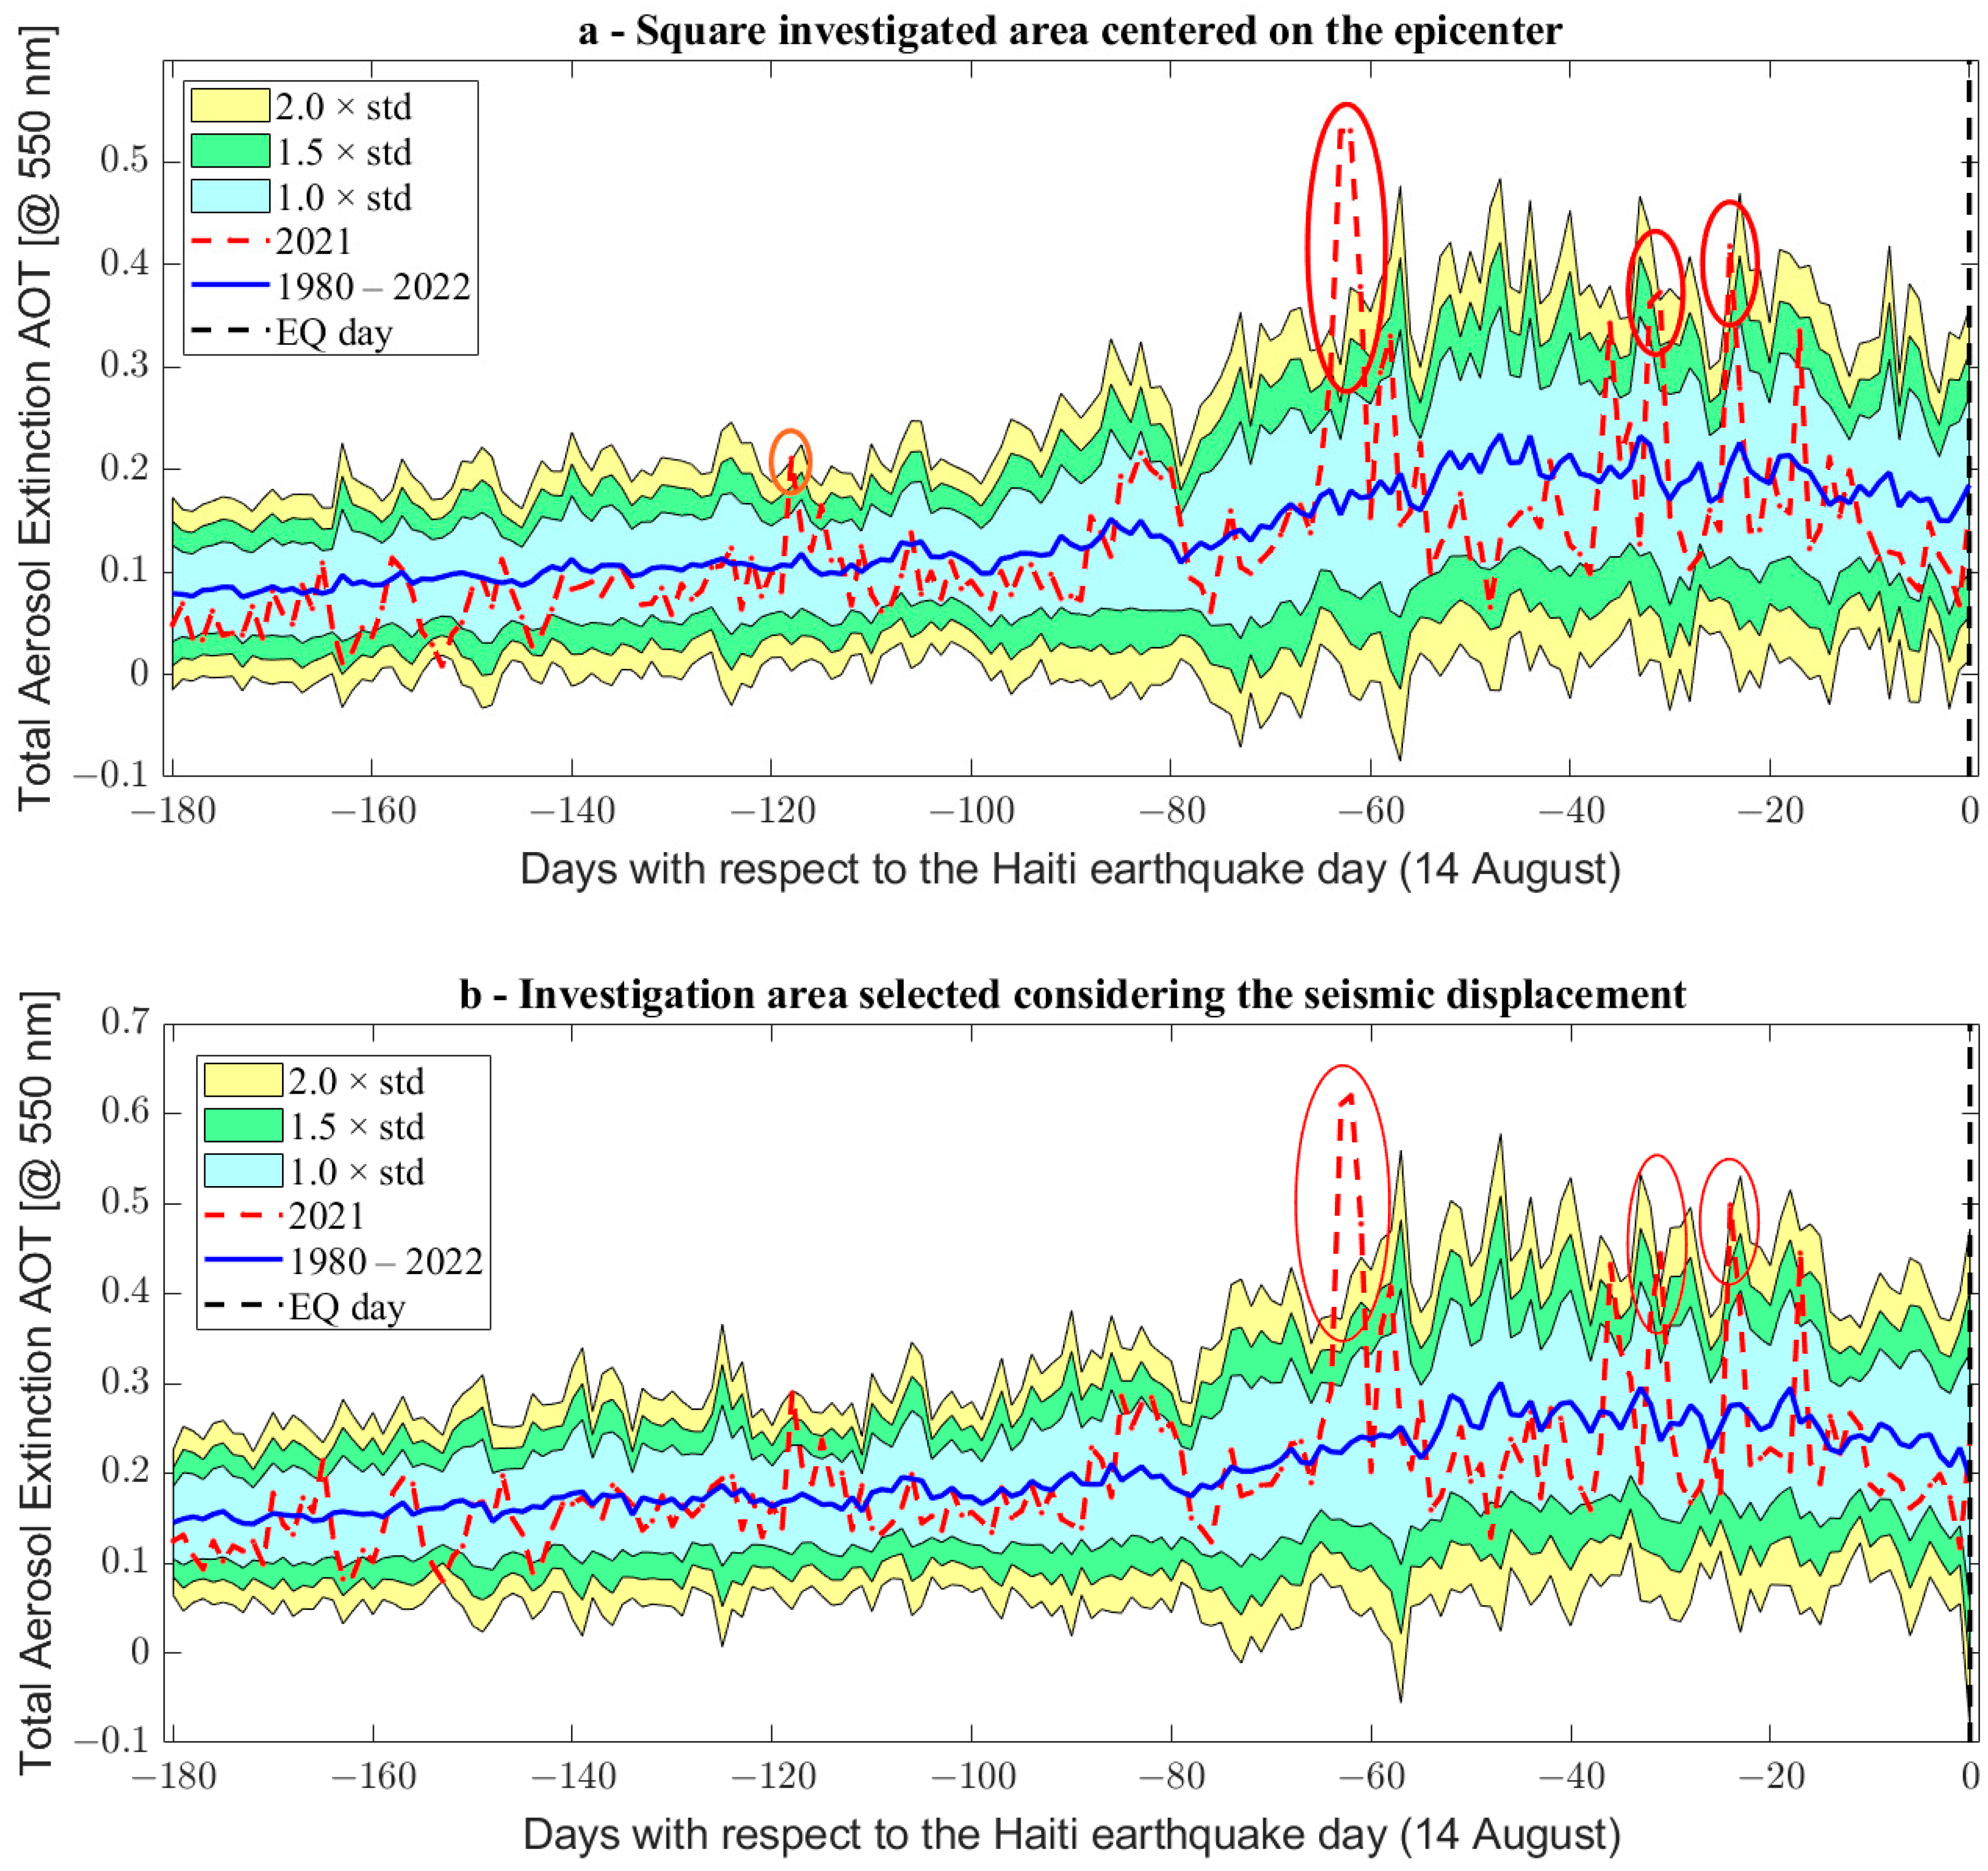
Figure 8.
Carbon monoxide (CO) investigation in the six months before the Haiti 2021 earthquake (vertical dashed black line) using (a) a symmetric square area centred on the epicentre or (b) a rectangular area around the seismic displacement. The years 1981, 1982, 1983, 1989, 1992 (only b) and 1998 have been excluded for outlier values. Red circles underline anomalies in the lower panel and the one in the upper panel, confirmed by investigations in both areas, while orange circles underline anomalies in the upper panel only.
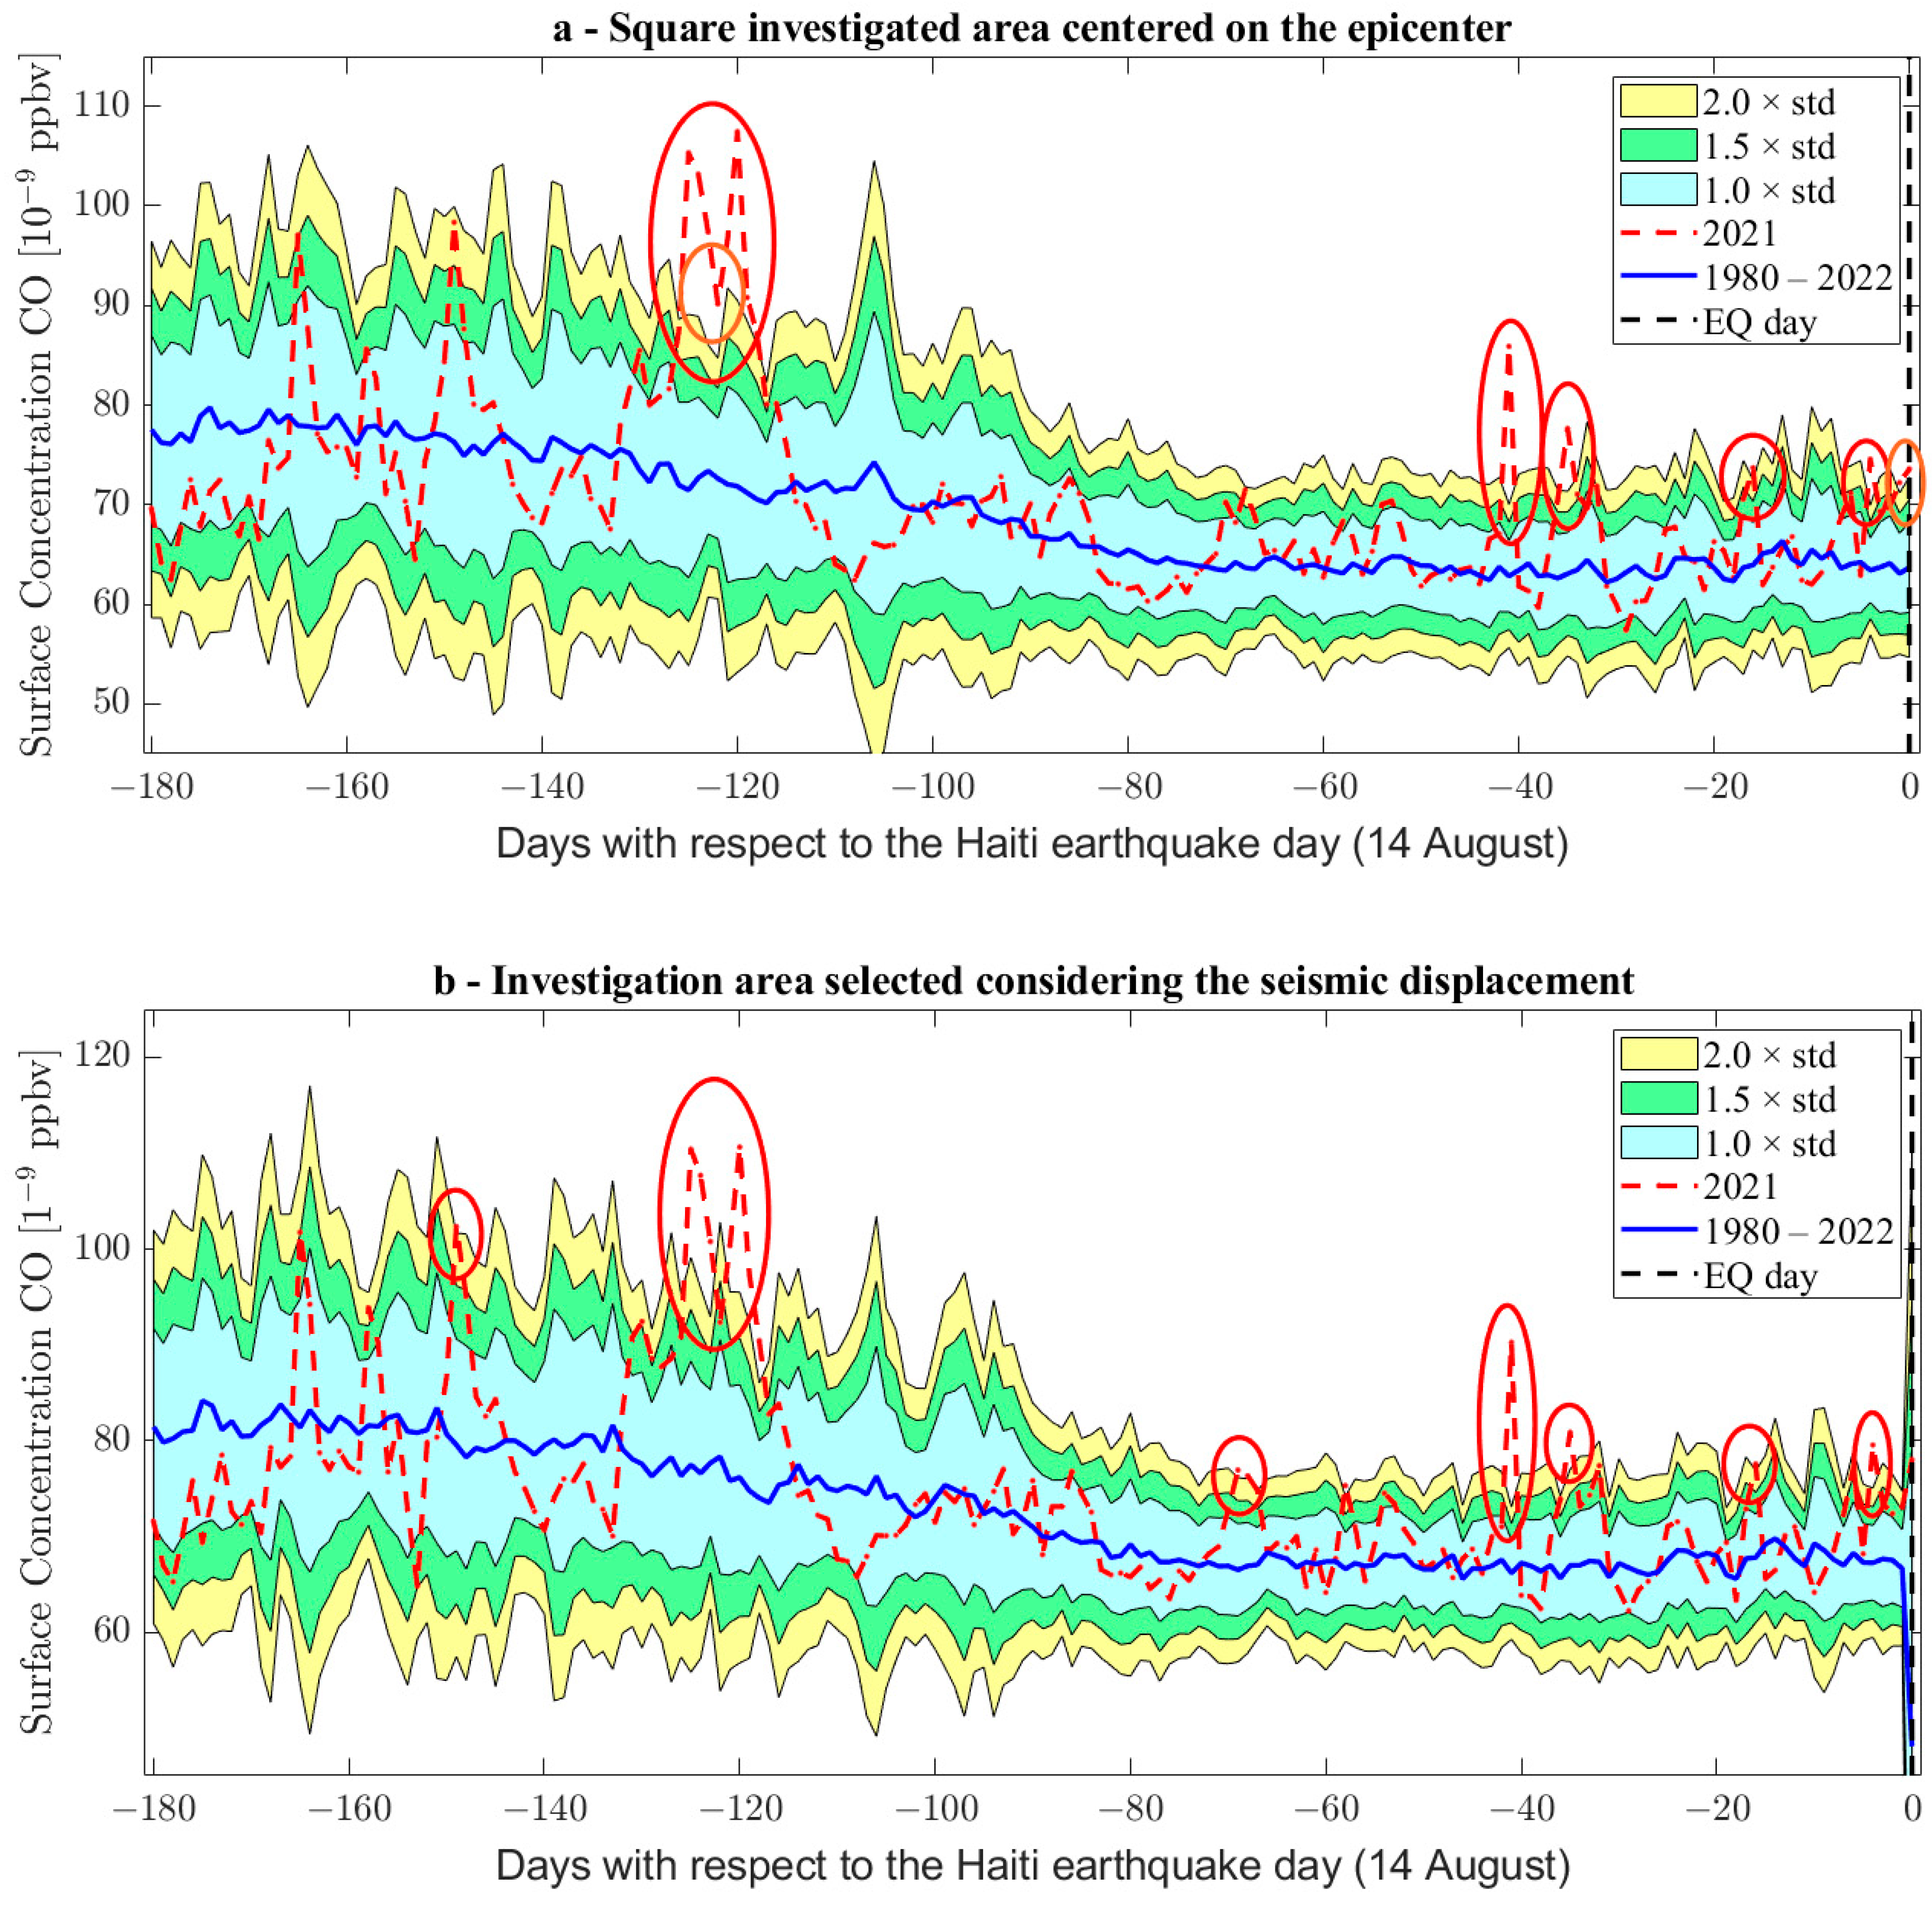
Figure 9.
Dimethyl sulphide (DMS) investigation in the six months before the Haiti 2021 earthquake (vertical dashed black line) using (a) a symmetric square area centred on the epicentre or (b) a rectangular area around the seismic displacement. The years 1980 and 2005 have been excluded for outlier values. Red circles underline positive anomalies, while blue circle underlines a negative anomaly.

Figure 10.
Sulphur dioxide (SO2) investigation in the six months before the Haiti 2021 earthquake (vertical dashed black line) using (a) a symmetric square area centred on the epicentre or (b) a rectangular area around the seismic displacement. The years 1982, 1991, 1992, 2003 (only a) and 2006 (only b) have been excluded for outlier values. Red circles underline anomalies.

Figure 11.
Methane (CH4) investigation in the six months before the Haiti 2021 earthquake (vertical dashed black line). The data source is the AISR instrument, so the background has been calculated over a shorter period (from 2002 to 2023, excluding the earthquake year 2021). Red circles underline anomalies.

Figure 12.
Maps of Aerosol (AOT) on 13 June and on 14 July 2021. A red asterisk marks the epicentre. Dashed grey lines represent the main plate boundaries. The blue lines represent coastlines.
Figure 12.
Maps of Aerosol (AOT) on 13 June and on 14 July 2021. A red asterisk marks the epicentre. Dashed grey lines represent the main plate boundaries. The blue lines represent coastlines.
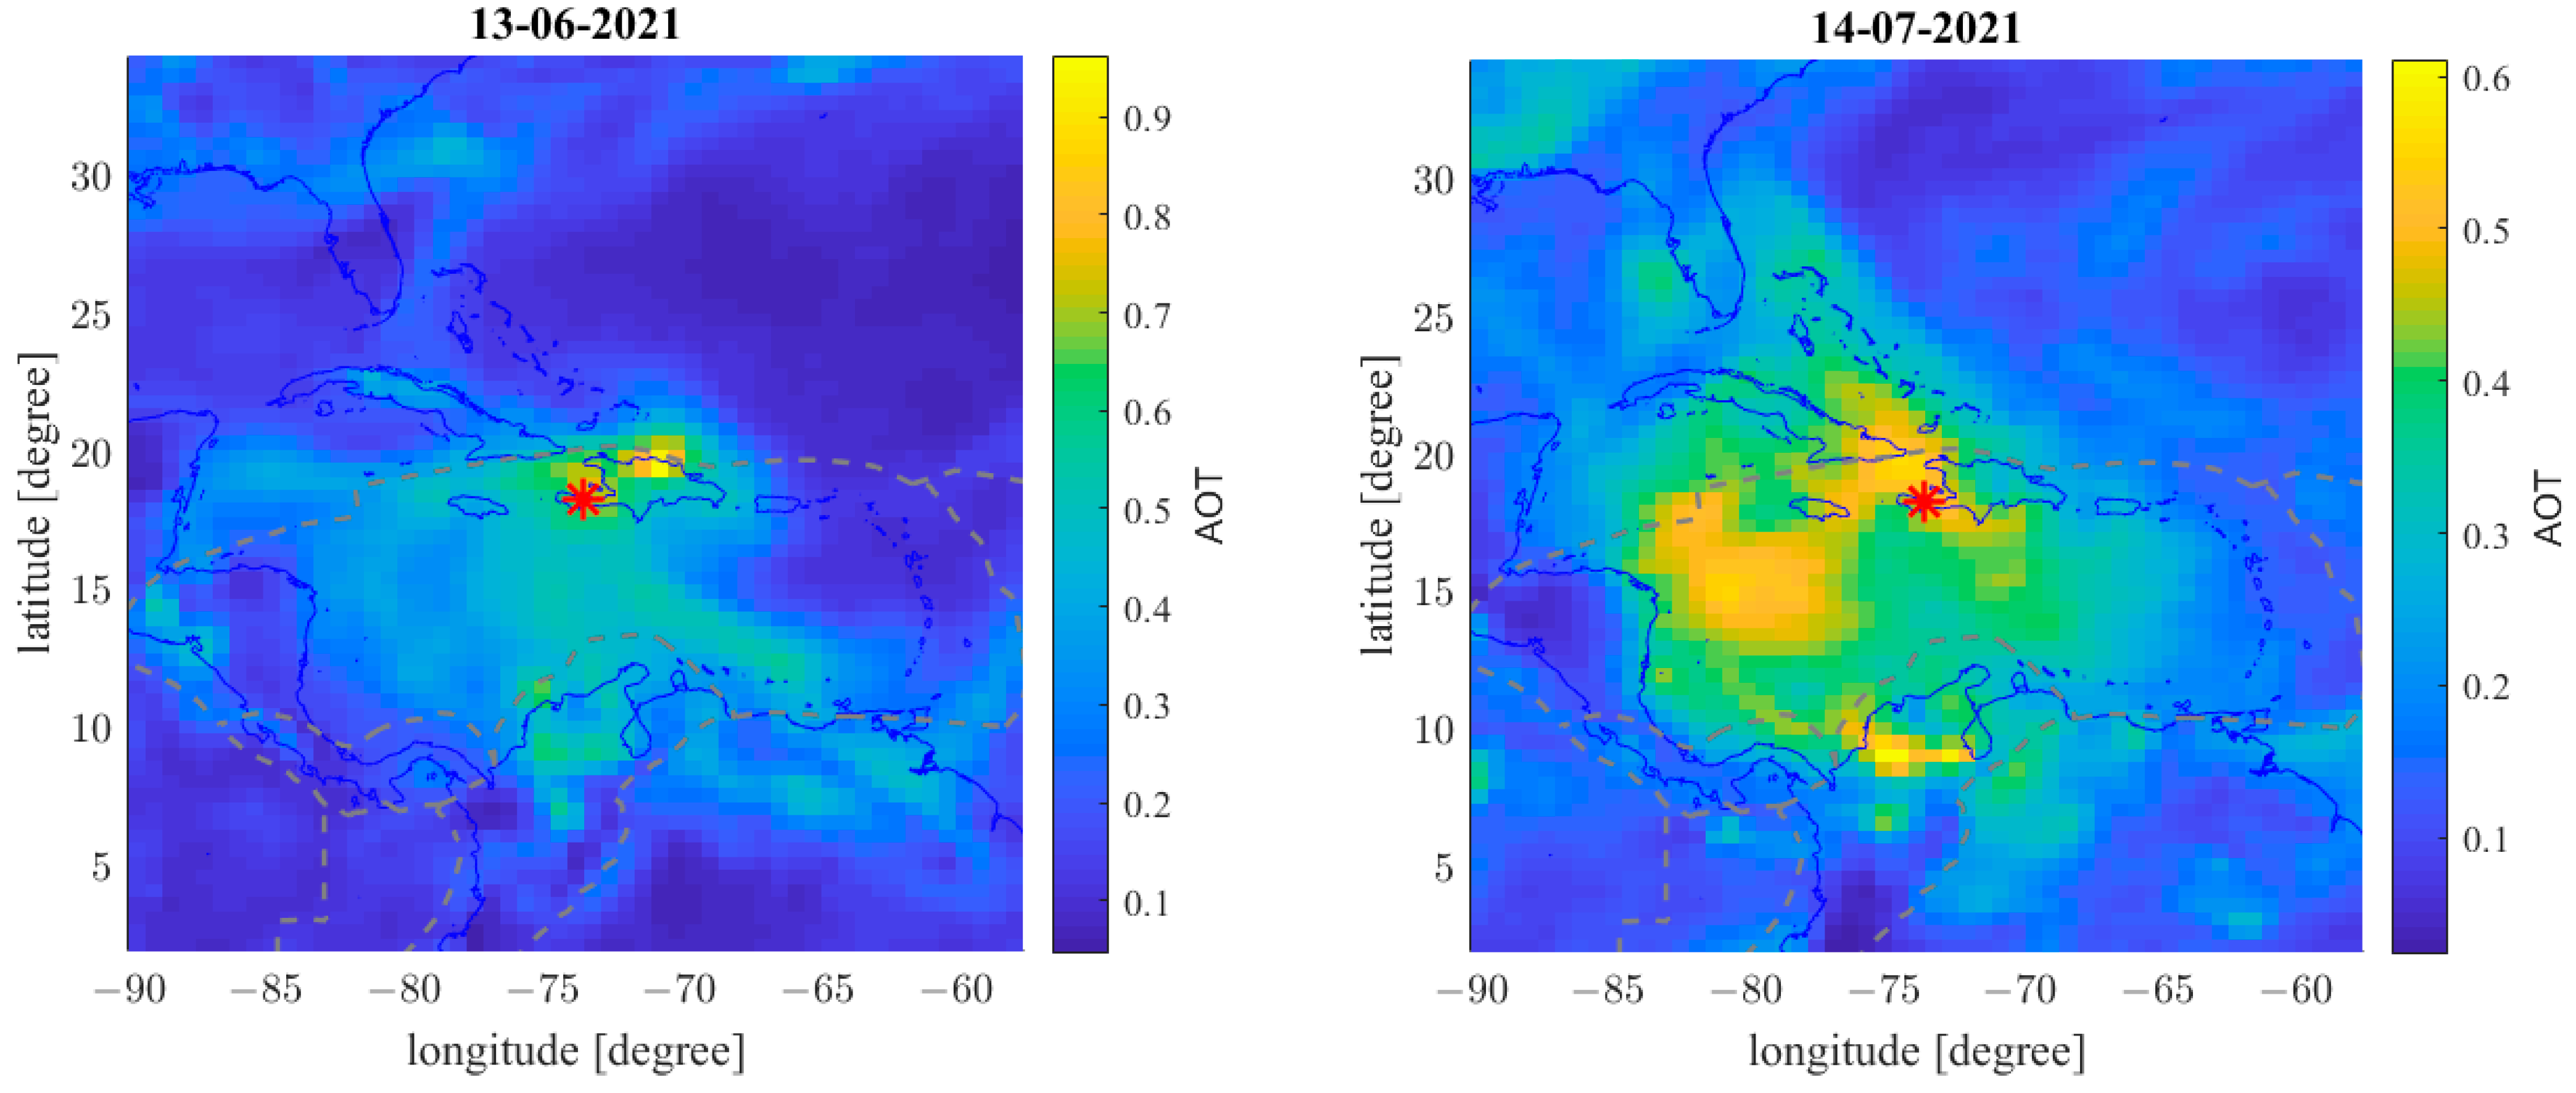
Figure 13.
Time series of CSES-01 Ne night-time values (red dot/line) acquired in the Dobrovolsky’s area in the six months before the Mw = 7.2 Haiti 2021 earthquake (vertical dashed black line). Green lines indicate thresholds to define anomalies based on median (m) and interquartile range (Iqr).
Figure 13.
Time series of CSES-01 Ne night-time values (red dot/line) acquired in the Dobrovolsky’s area in the six months before the Mw = 7.2 Haiti 2021 earthquake (vertical dashed black line). Green lines indicate thresholds to define anomalies based on median (m) and interquartile range (Iqr).

Figure 14.
CSES-01 Ne night-time latitudinal profiles acquired in geomagnetic quiet time. The blue boxes and dashed black lines represent the standard ranges of the values for each degree of latitude. The red crosses indicate the outlier values of Ne. The latitude of the Haiti earthquake (EQ) is represented as a vertical black line.
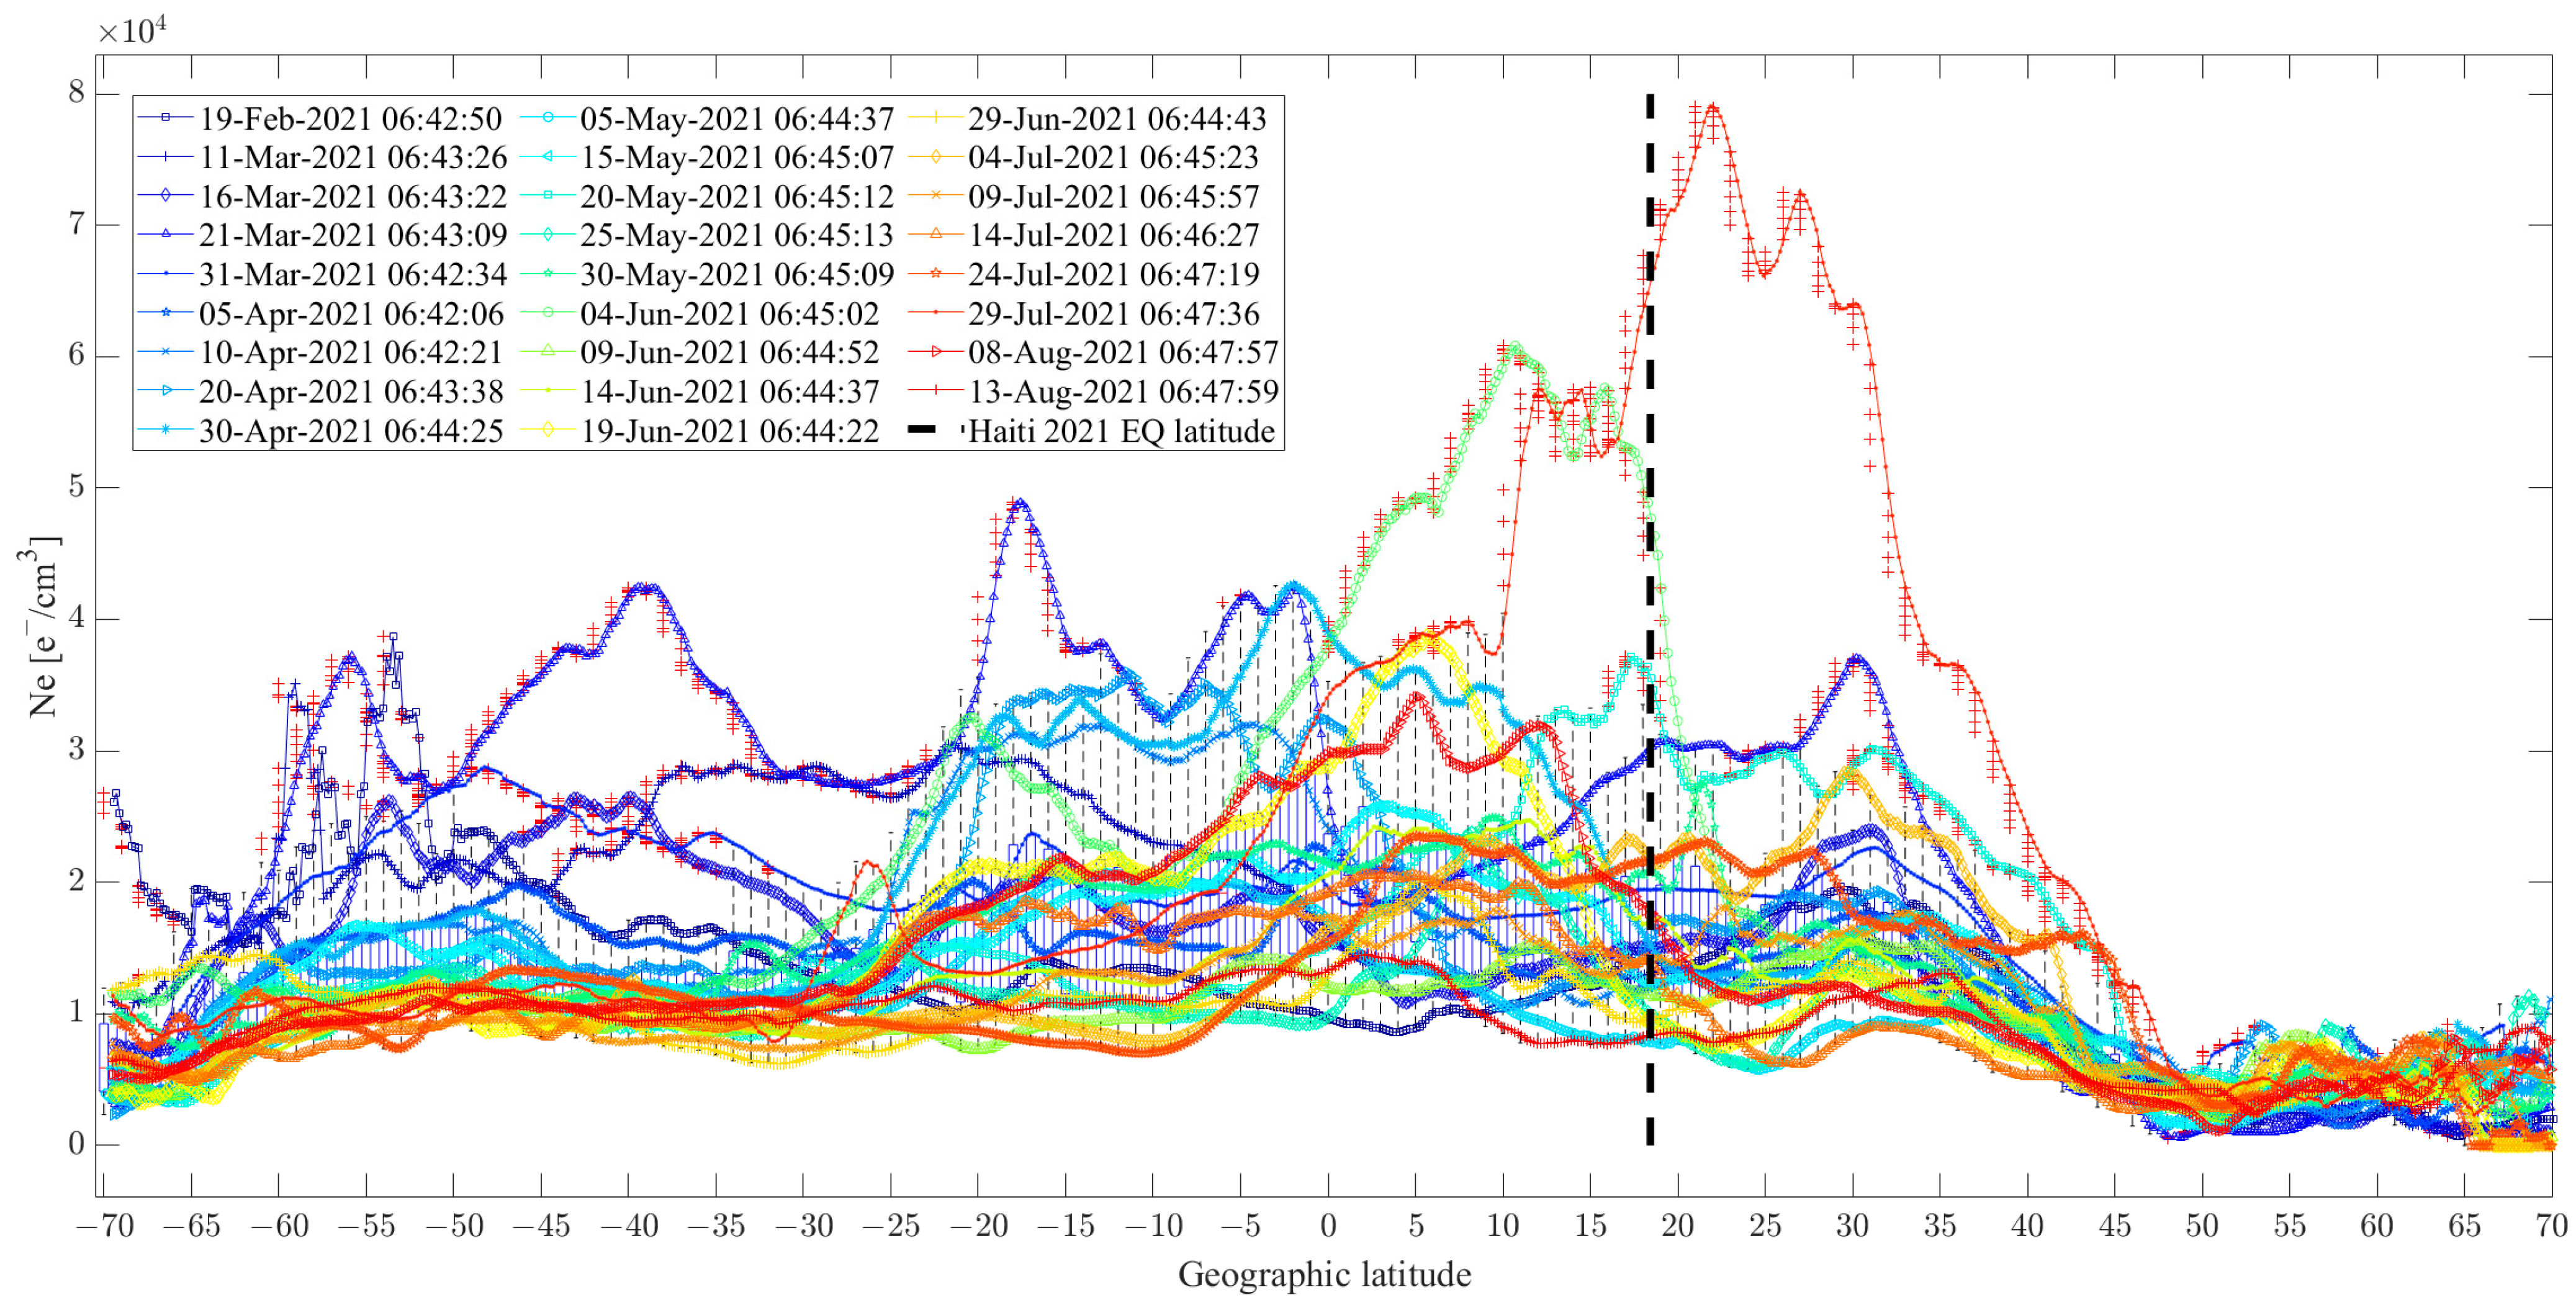
Figure 15.
Cumulate of the Swarm Y-East component of magnetic field anomalies in the six months before Mw = 7.2 Haiti 2021 earthquake in (a) epicentral area shown in (c); (b) in a comparison area shown in (d). A linear fit of the cumulative anomaly trend has been performed and shown as red line in (a,b). The maps in (c,d) of the Dobrovolsky’s and comparison areas underline the sea part with blue patches and land by green patches. The epicentre and centre of comparison area is represented by a red and the investigation areas with yellow circles. (e) Differences in the trends to extract the anomalies are more likely related to the preparation phase of the earthquake.
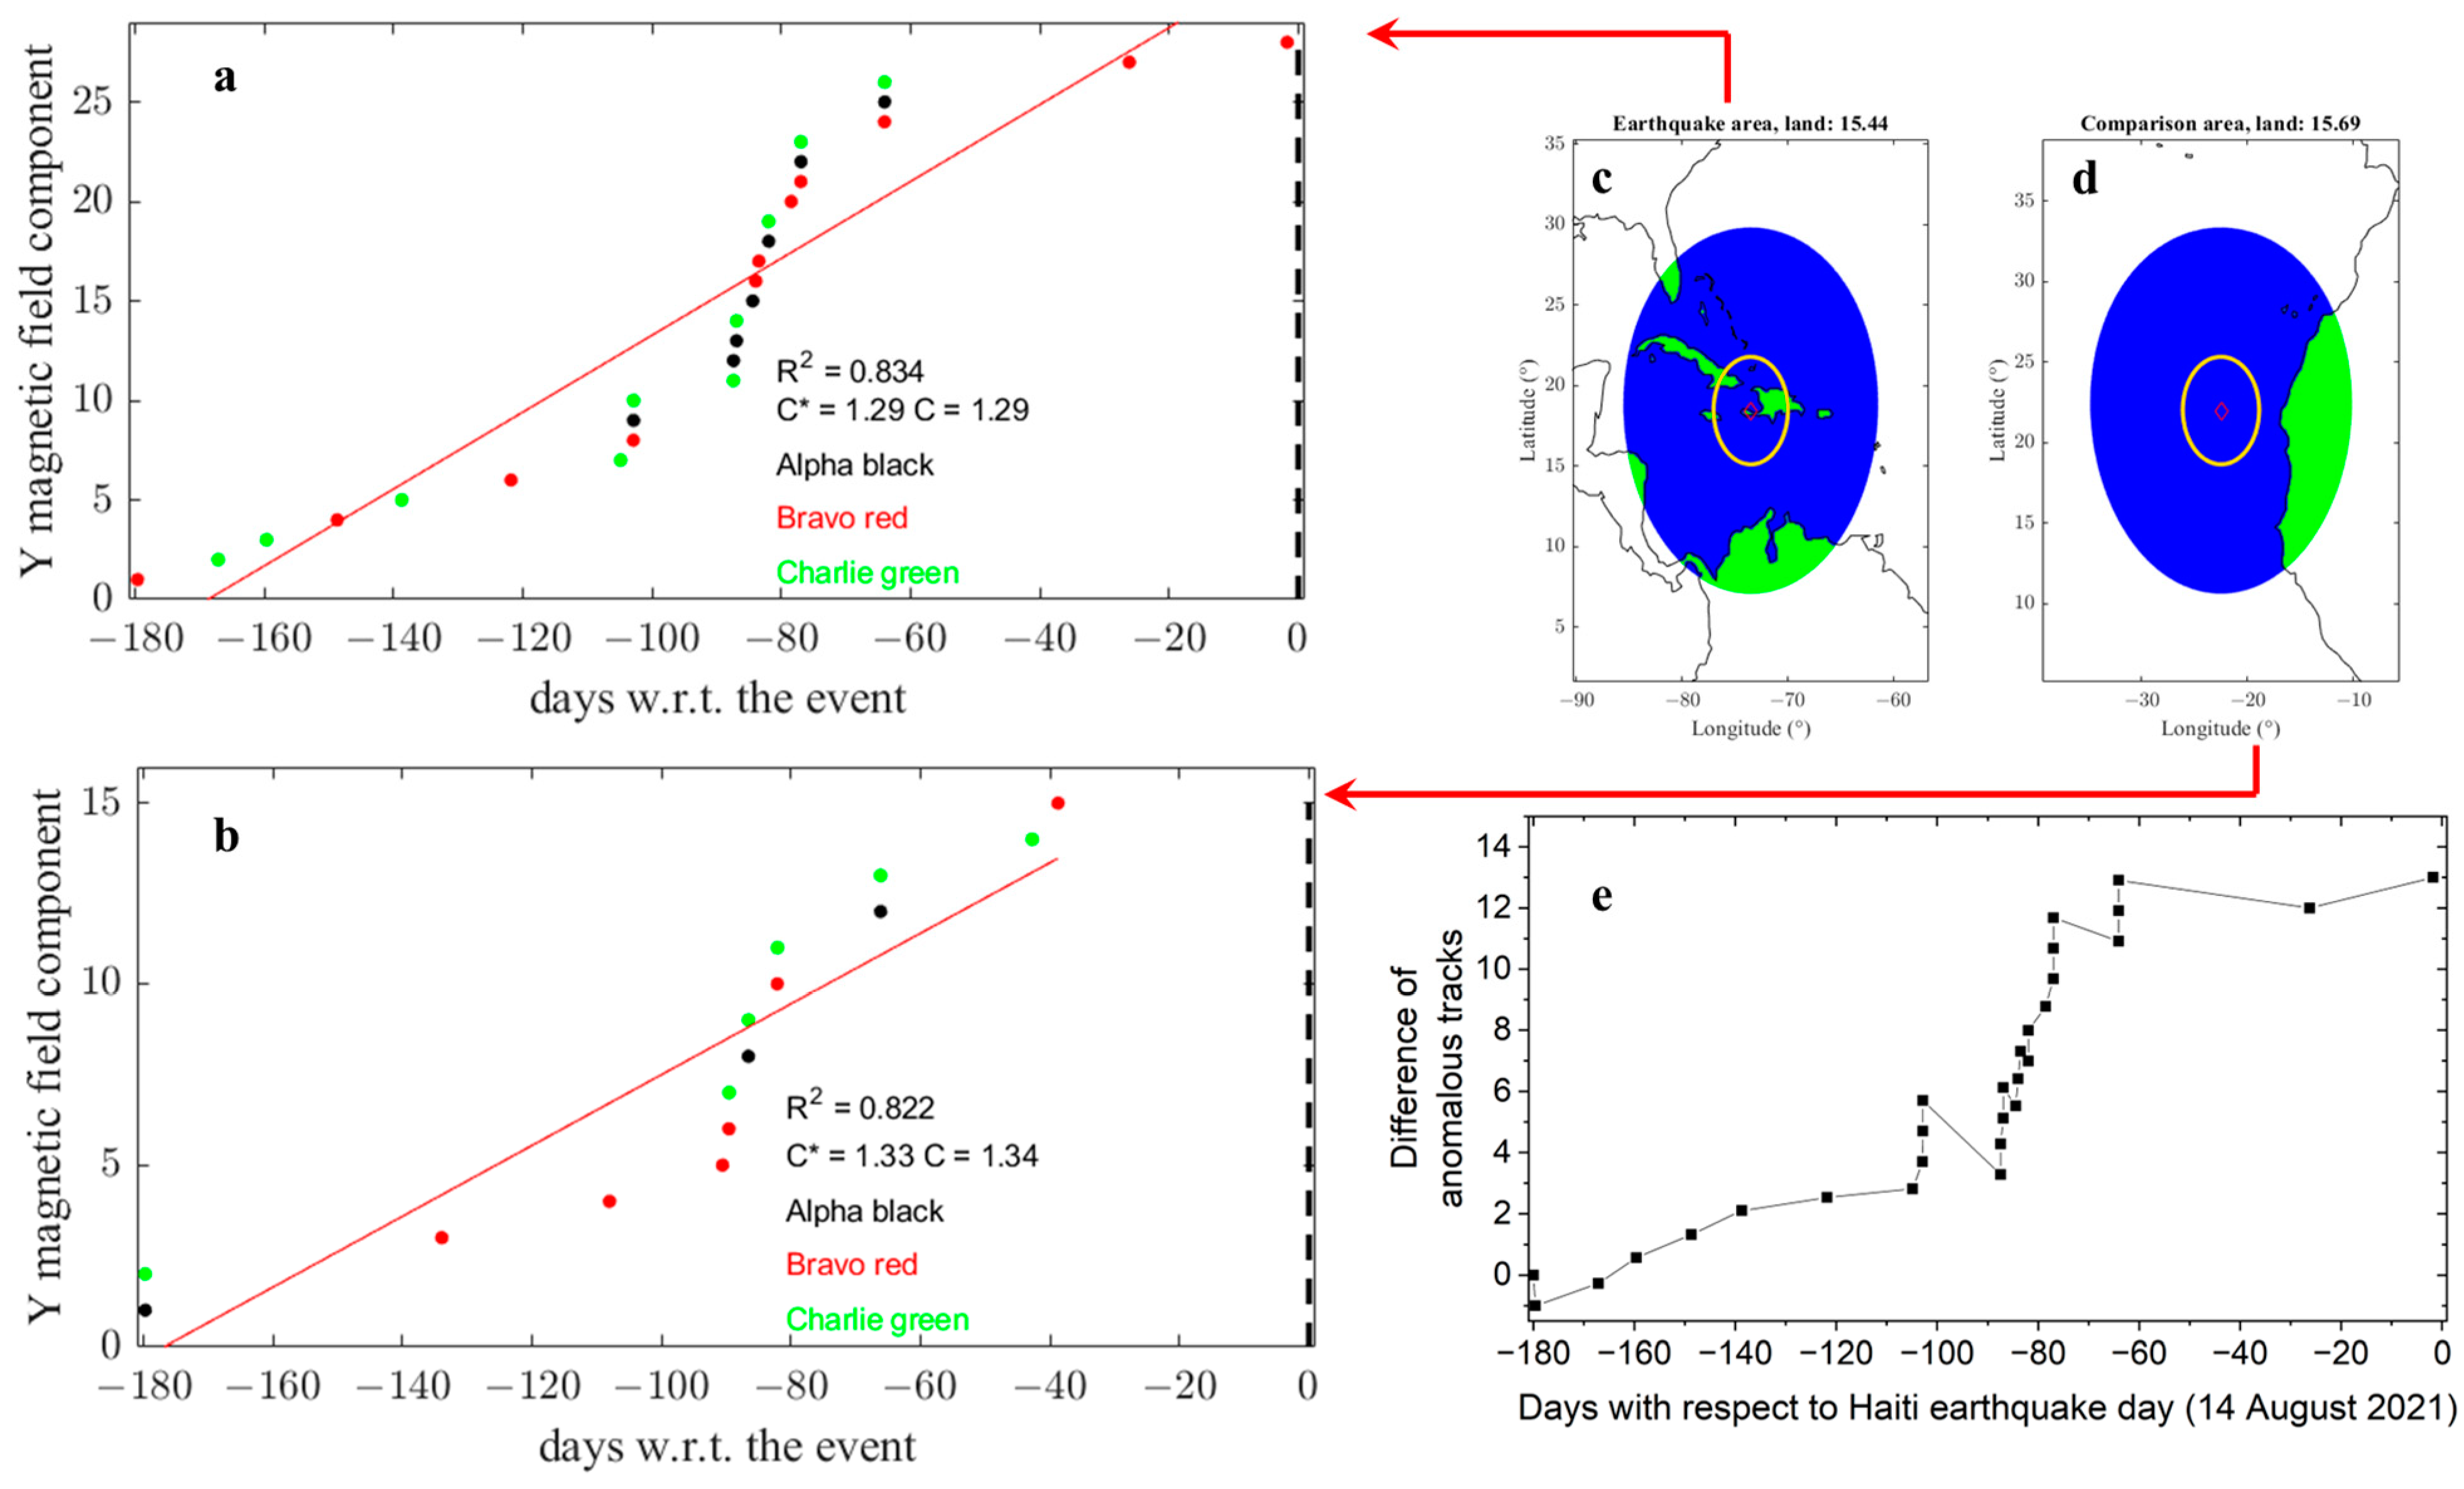
Figure 16.
(A)Time series of the Total Electron Content (TEC) residuals estimated from the Global Ionospheric Maps of Total Electron Content (GIM-TEC) maps and interpolated above the earthquake epicentre and at 2 LT. The green horizontal lines indicate thresholds for anomalous values in the year of the earthquake (2021). (B) Geomagnetic activity represented by Dst (blue line) and ap (orange line) indexes.
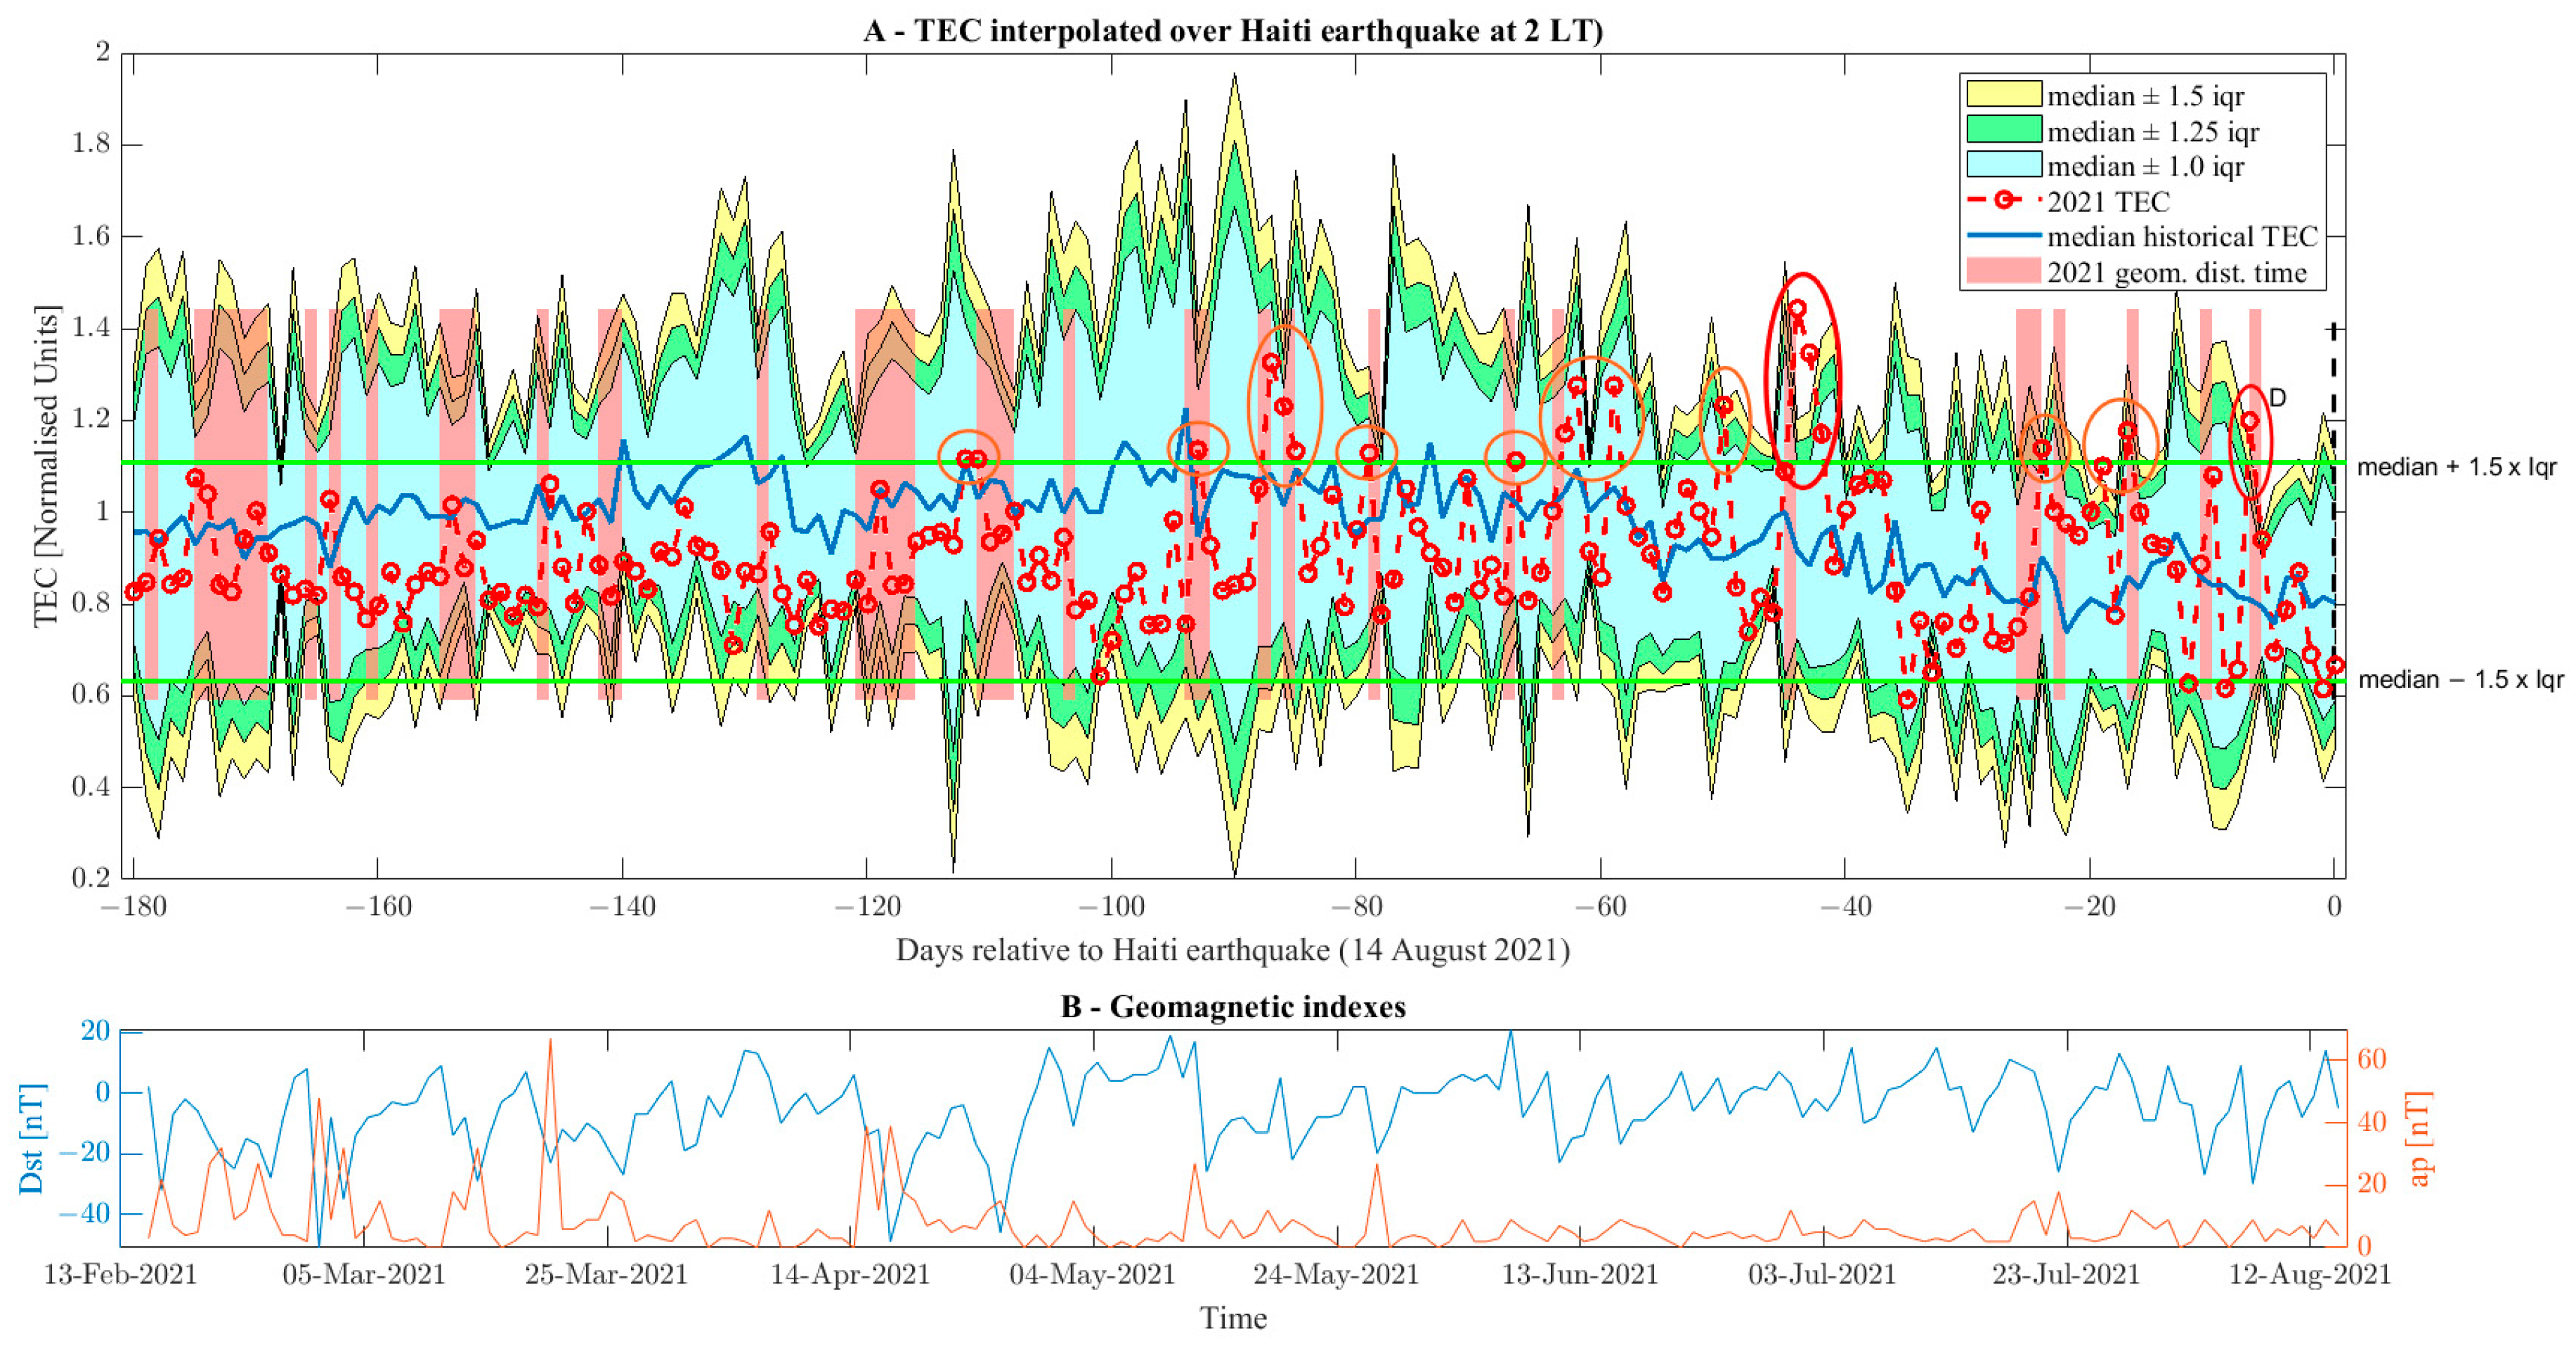
Figure 17.
Map of positions of Elsa and Grace hurricanes and Tropical Storm Fred that crossed the investigated area during the six months before the Haiti 2021 earthquake occurrence. The yellow circle represents the Dobrovolsky’s area and the green boxes shows the atmospheric research areas implemented in MEANS algorithm for this earthquake.
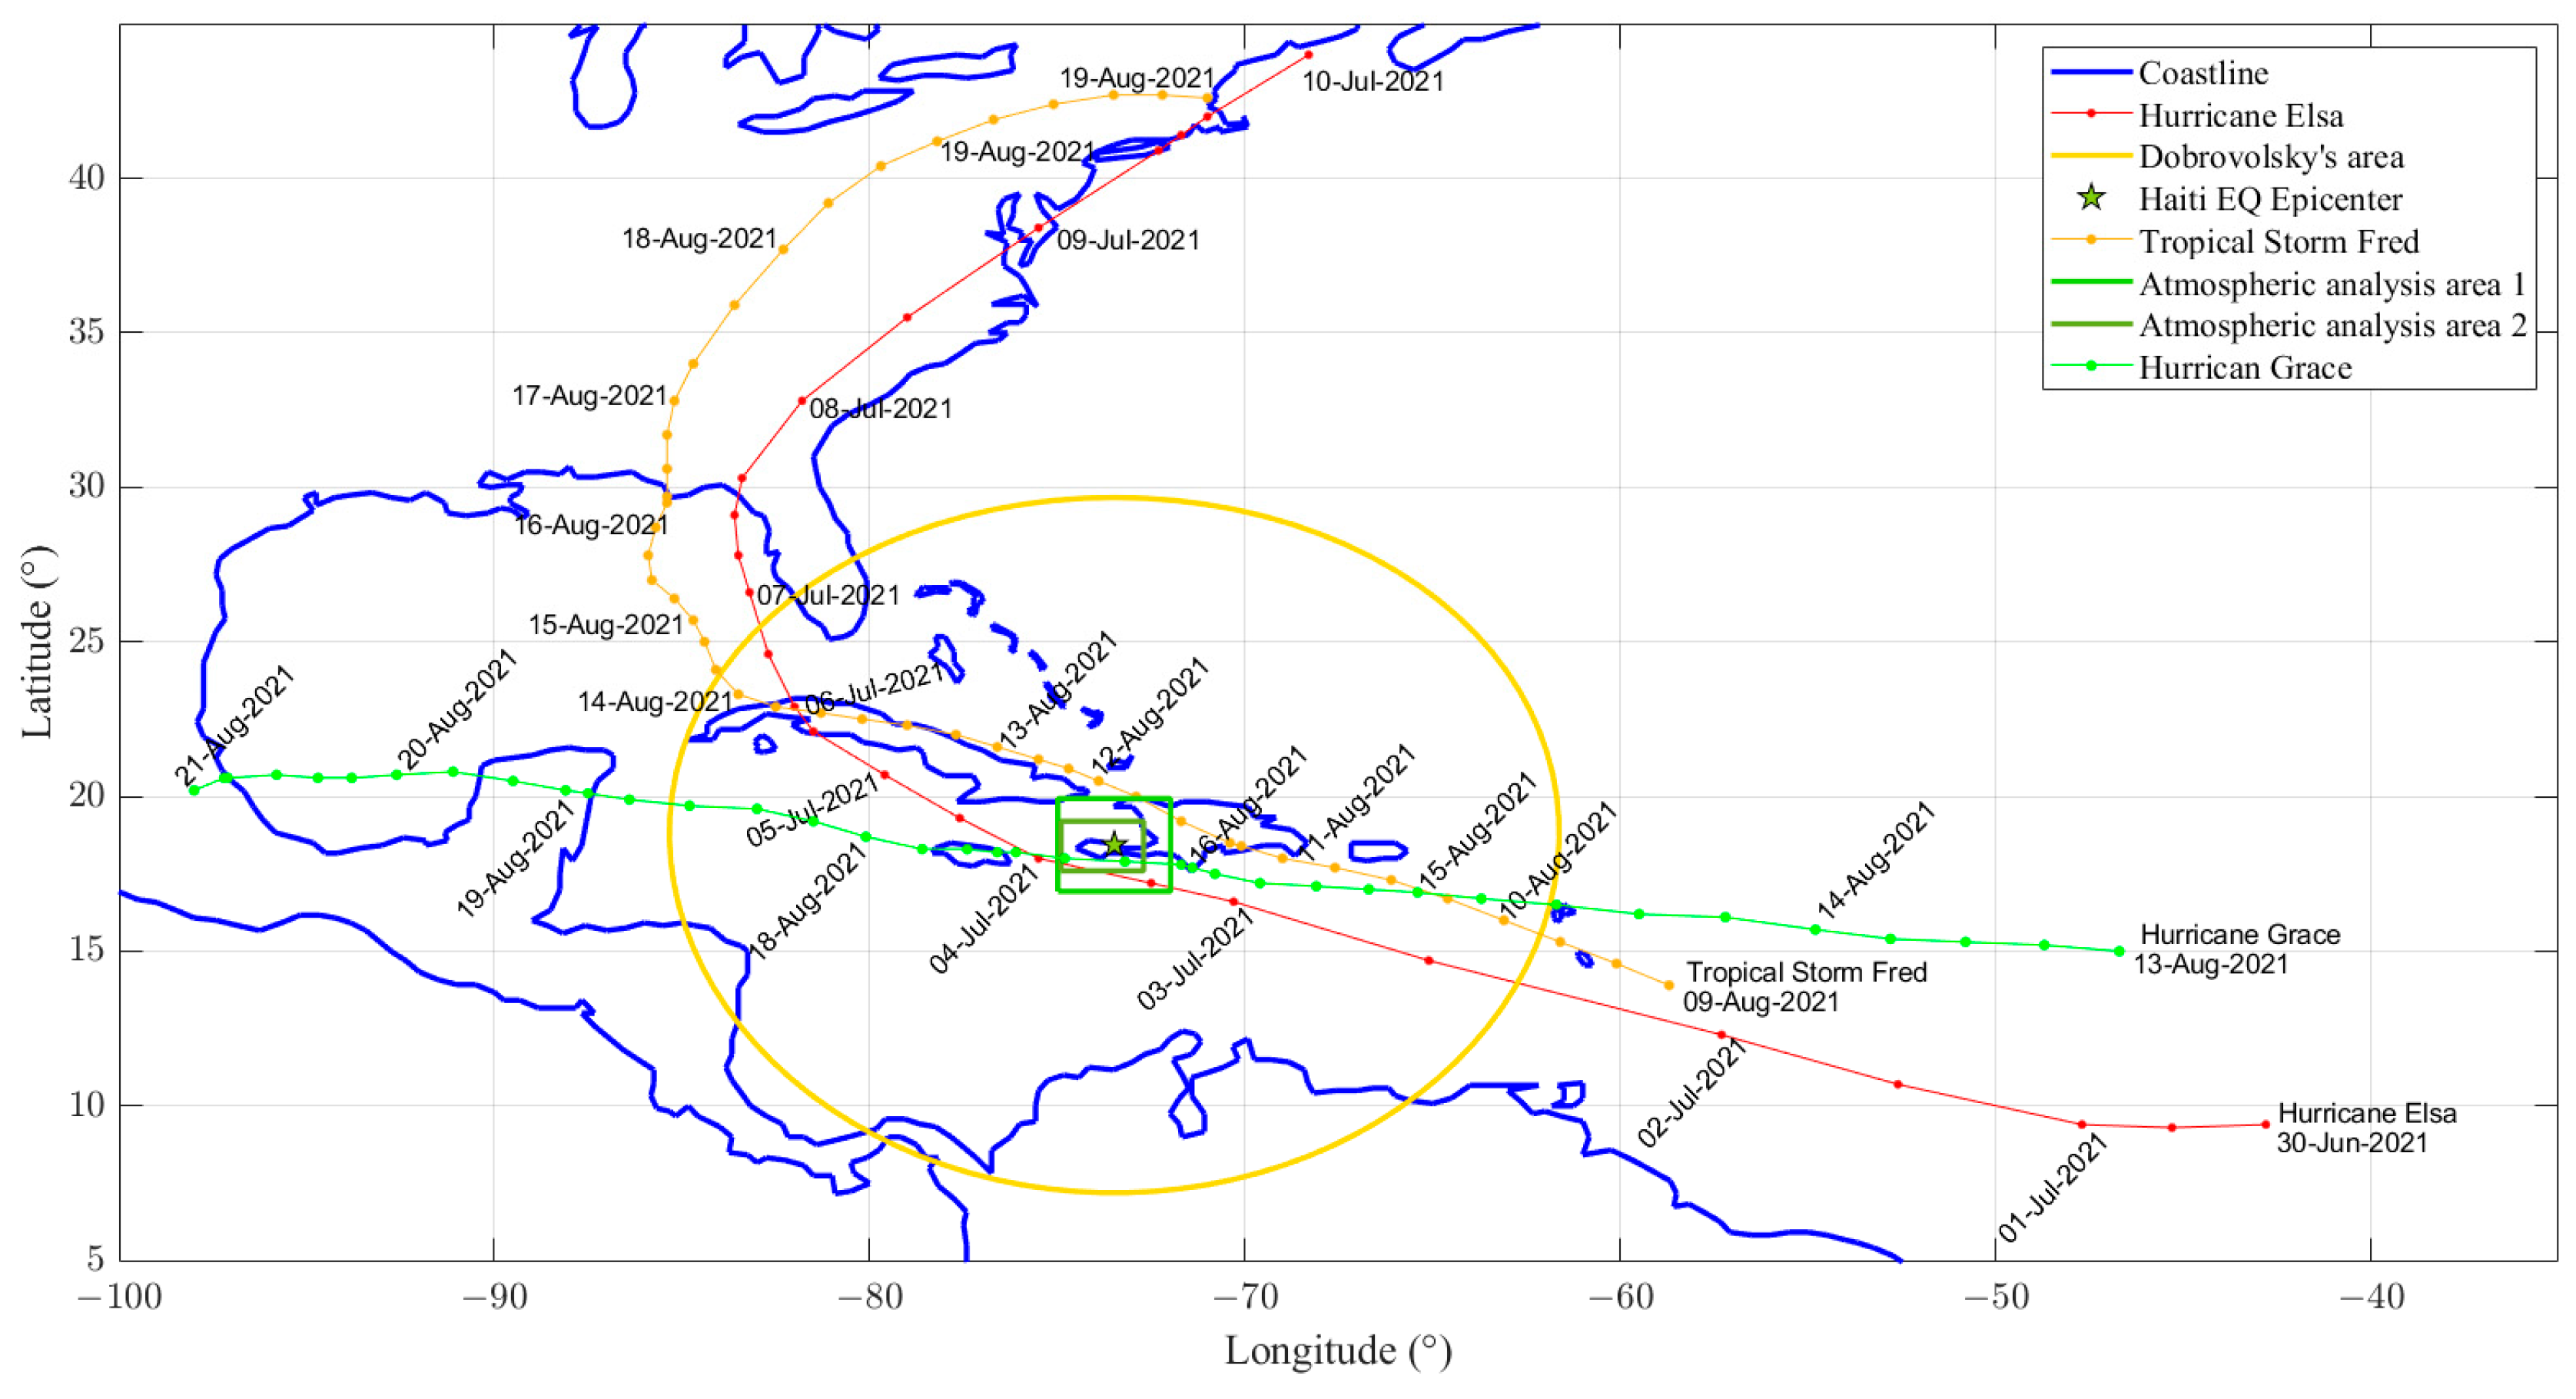
Figure 18.
Cumulative trends in the lithosphere (earthquakes), atmosphere and ionosphere (anomalies). The number inside grey circles indicates the most important stages depicted by this summary graph: (1) particular high seismicity, (2) high seismicity immediately followed by aerosol release, (3) increase of ionospheric anomalies (especially Swarm magnetic field) and (4) variation of seismic trend synchronous to increase of atmospheric anomalies followed by two consecutive days of CSES-01 electron density anomalies. These important group of anomalies possibly related to the incoming earthquake has been underlined by bold red circles. Anomalies possibly related to weather hurricanes and storms have been underlined by dashed red circles.
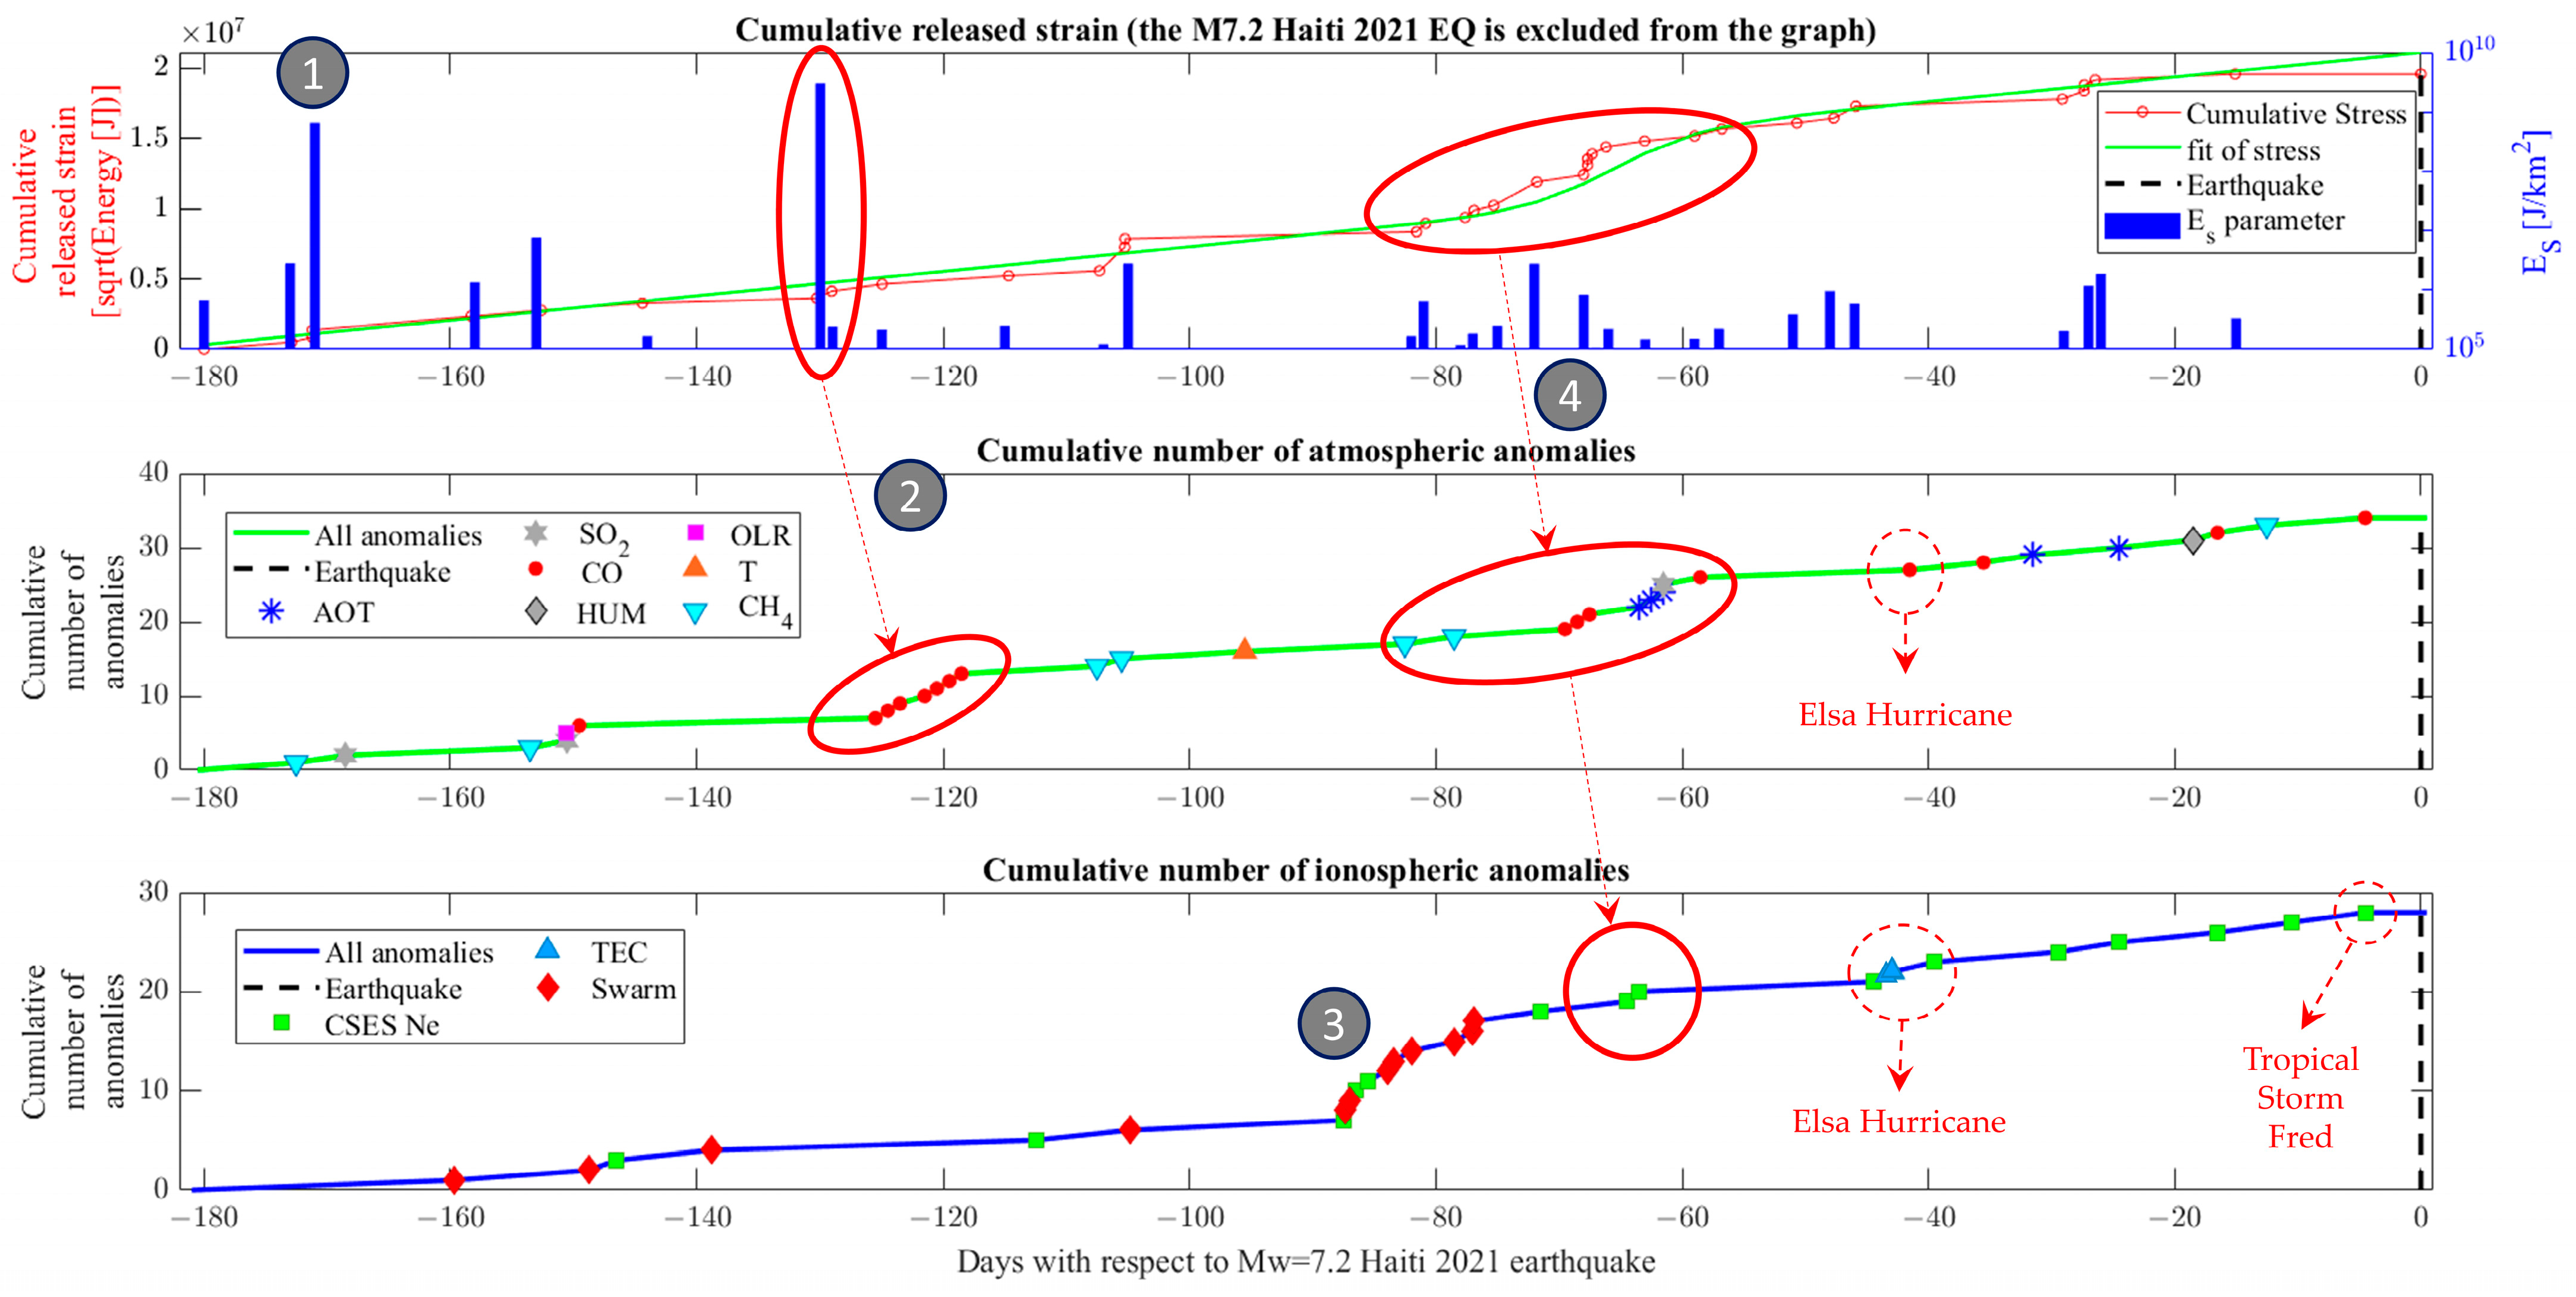

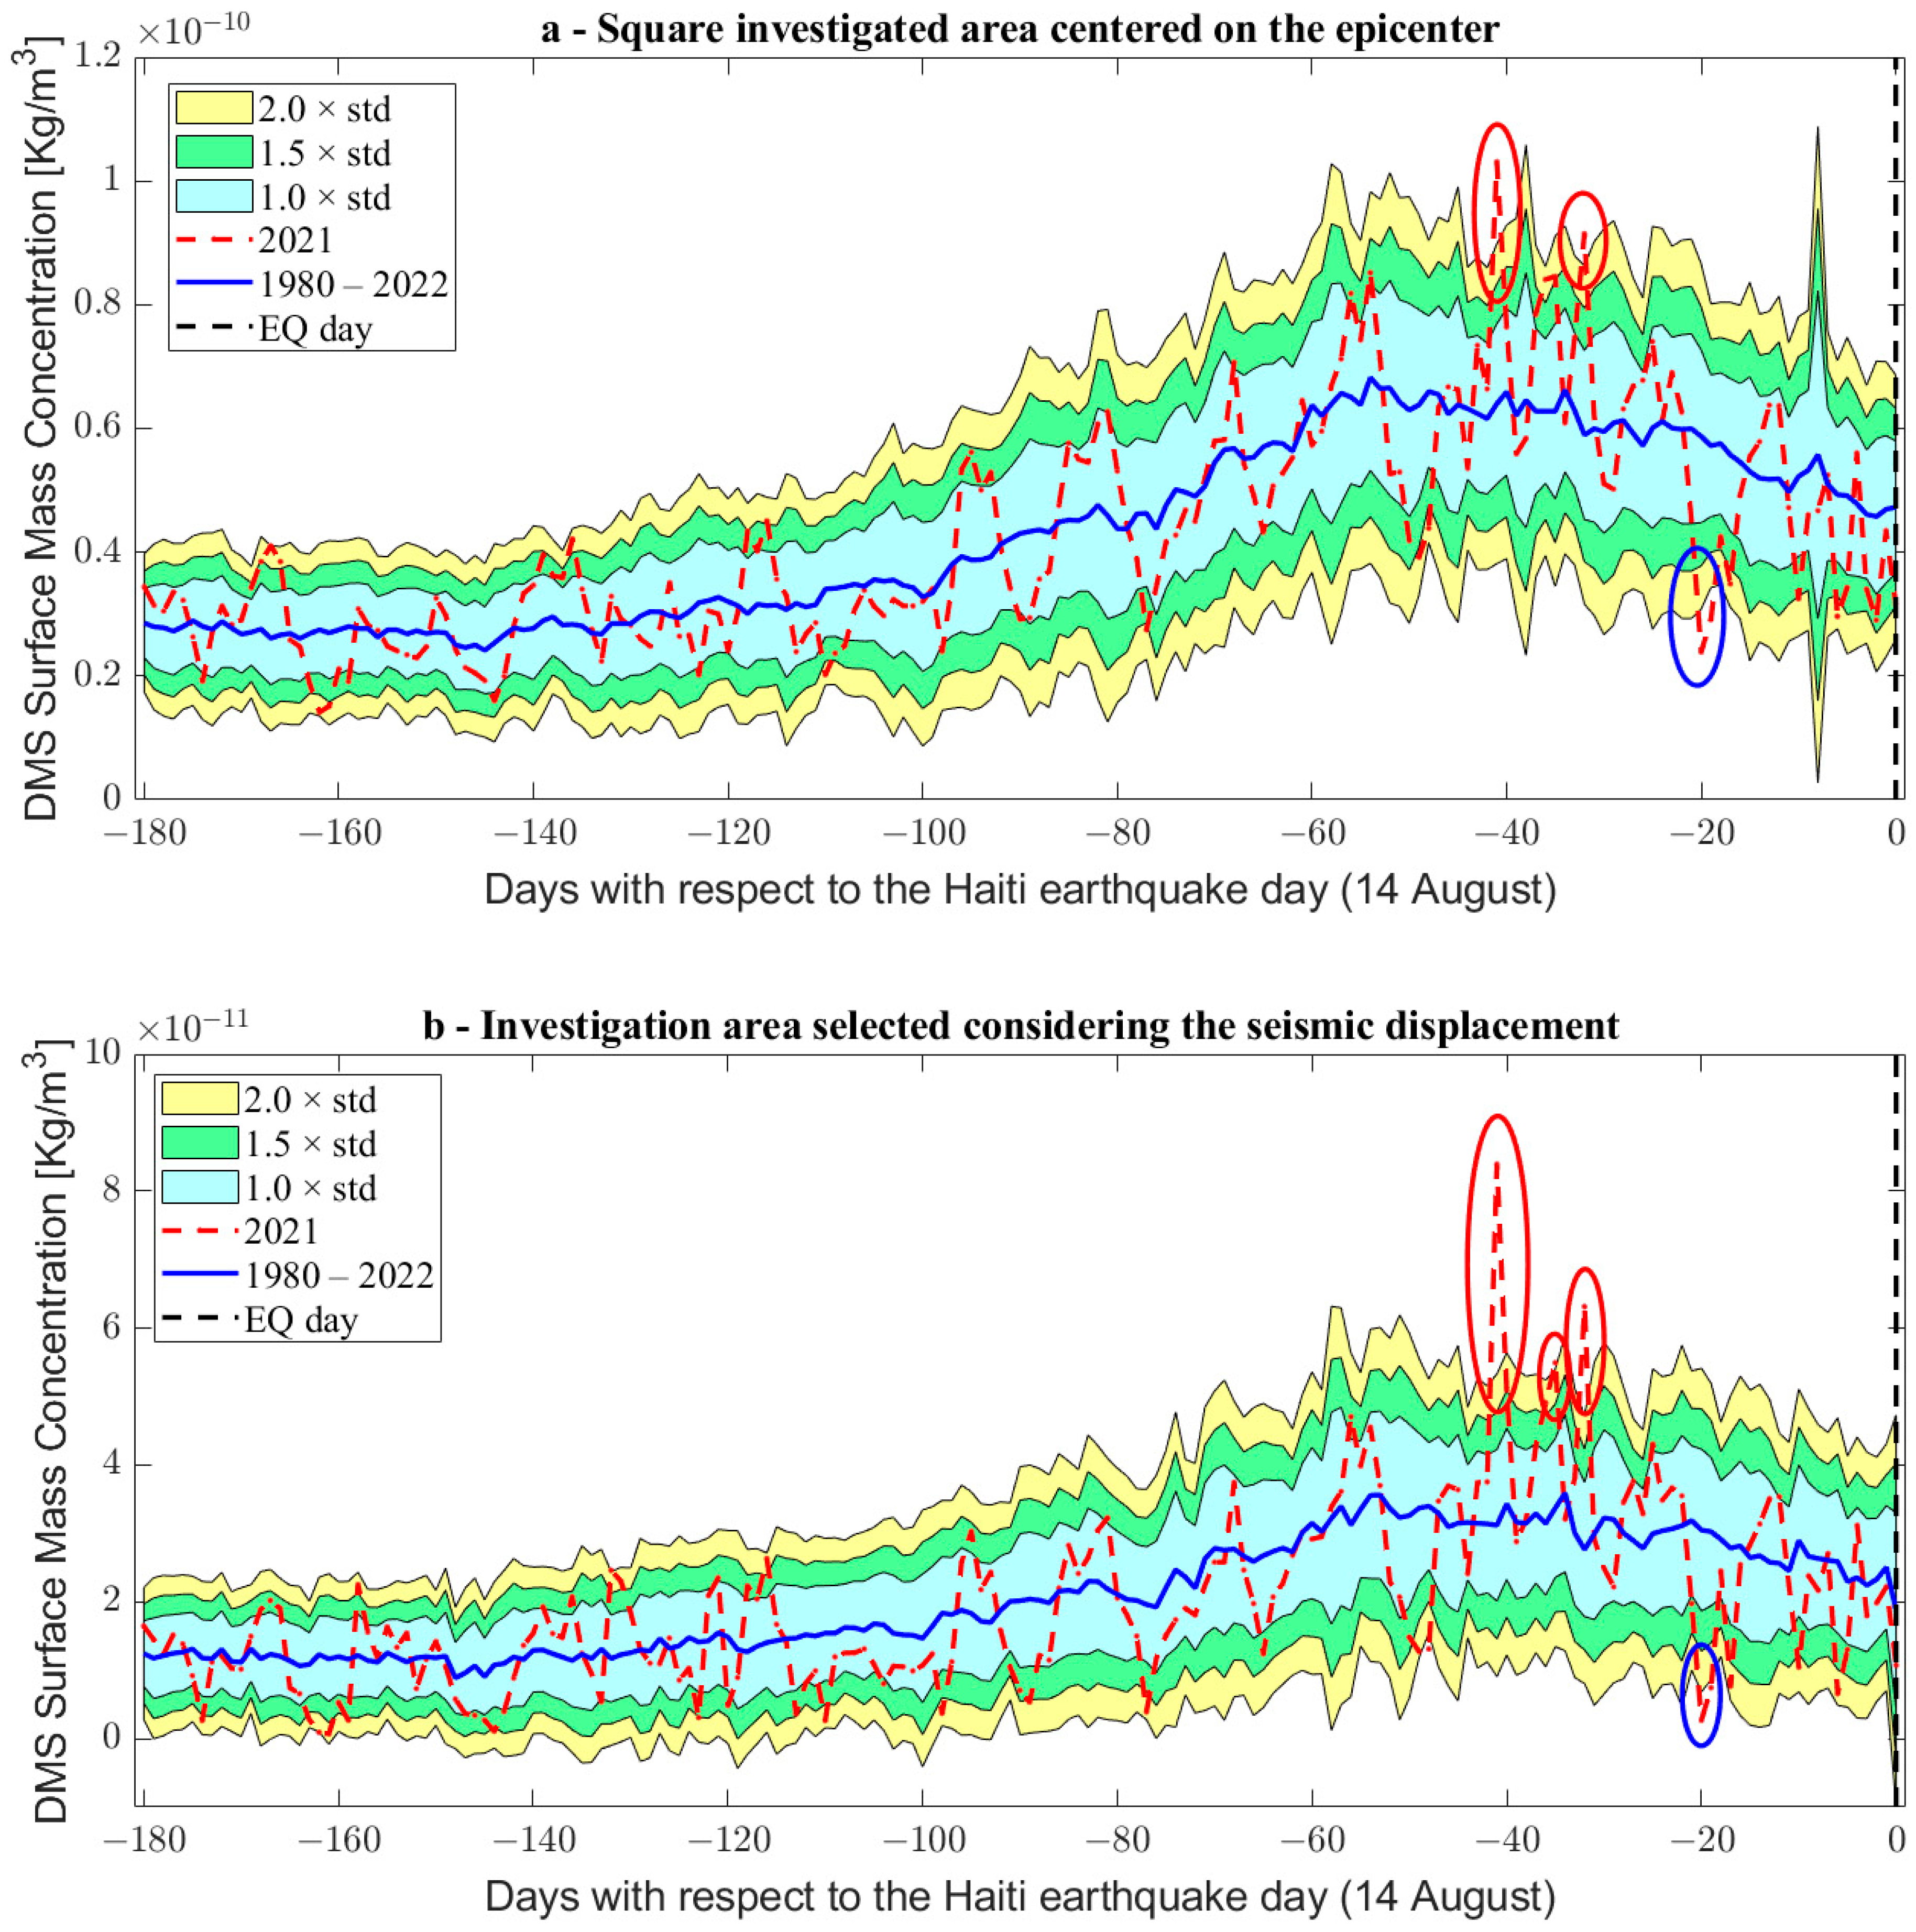
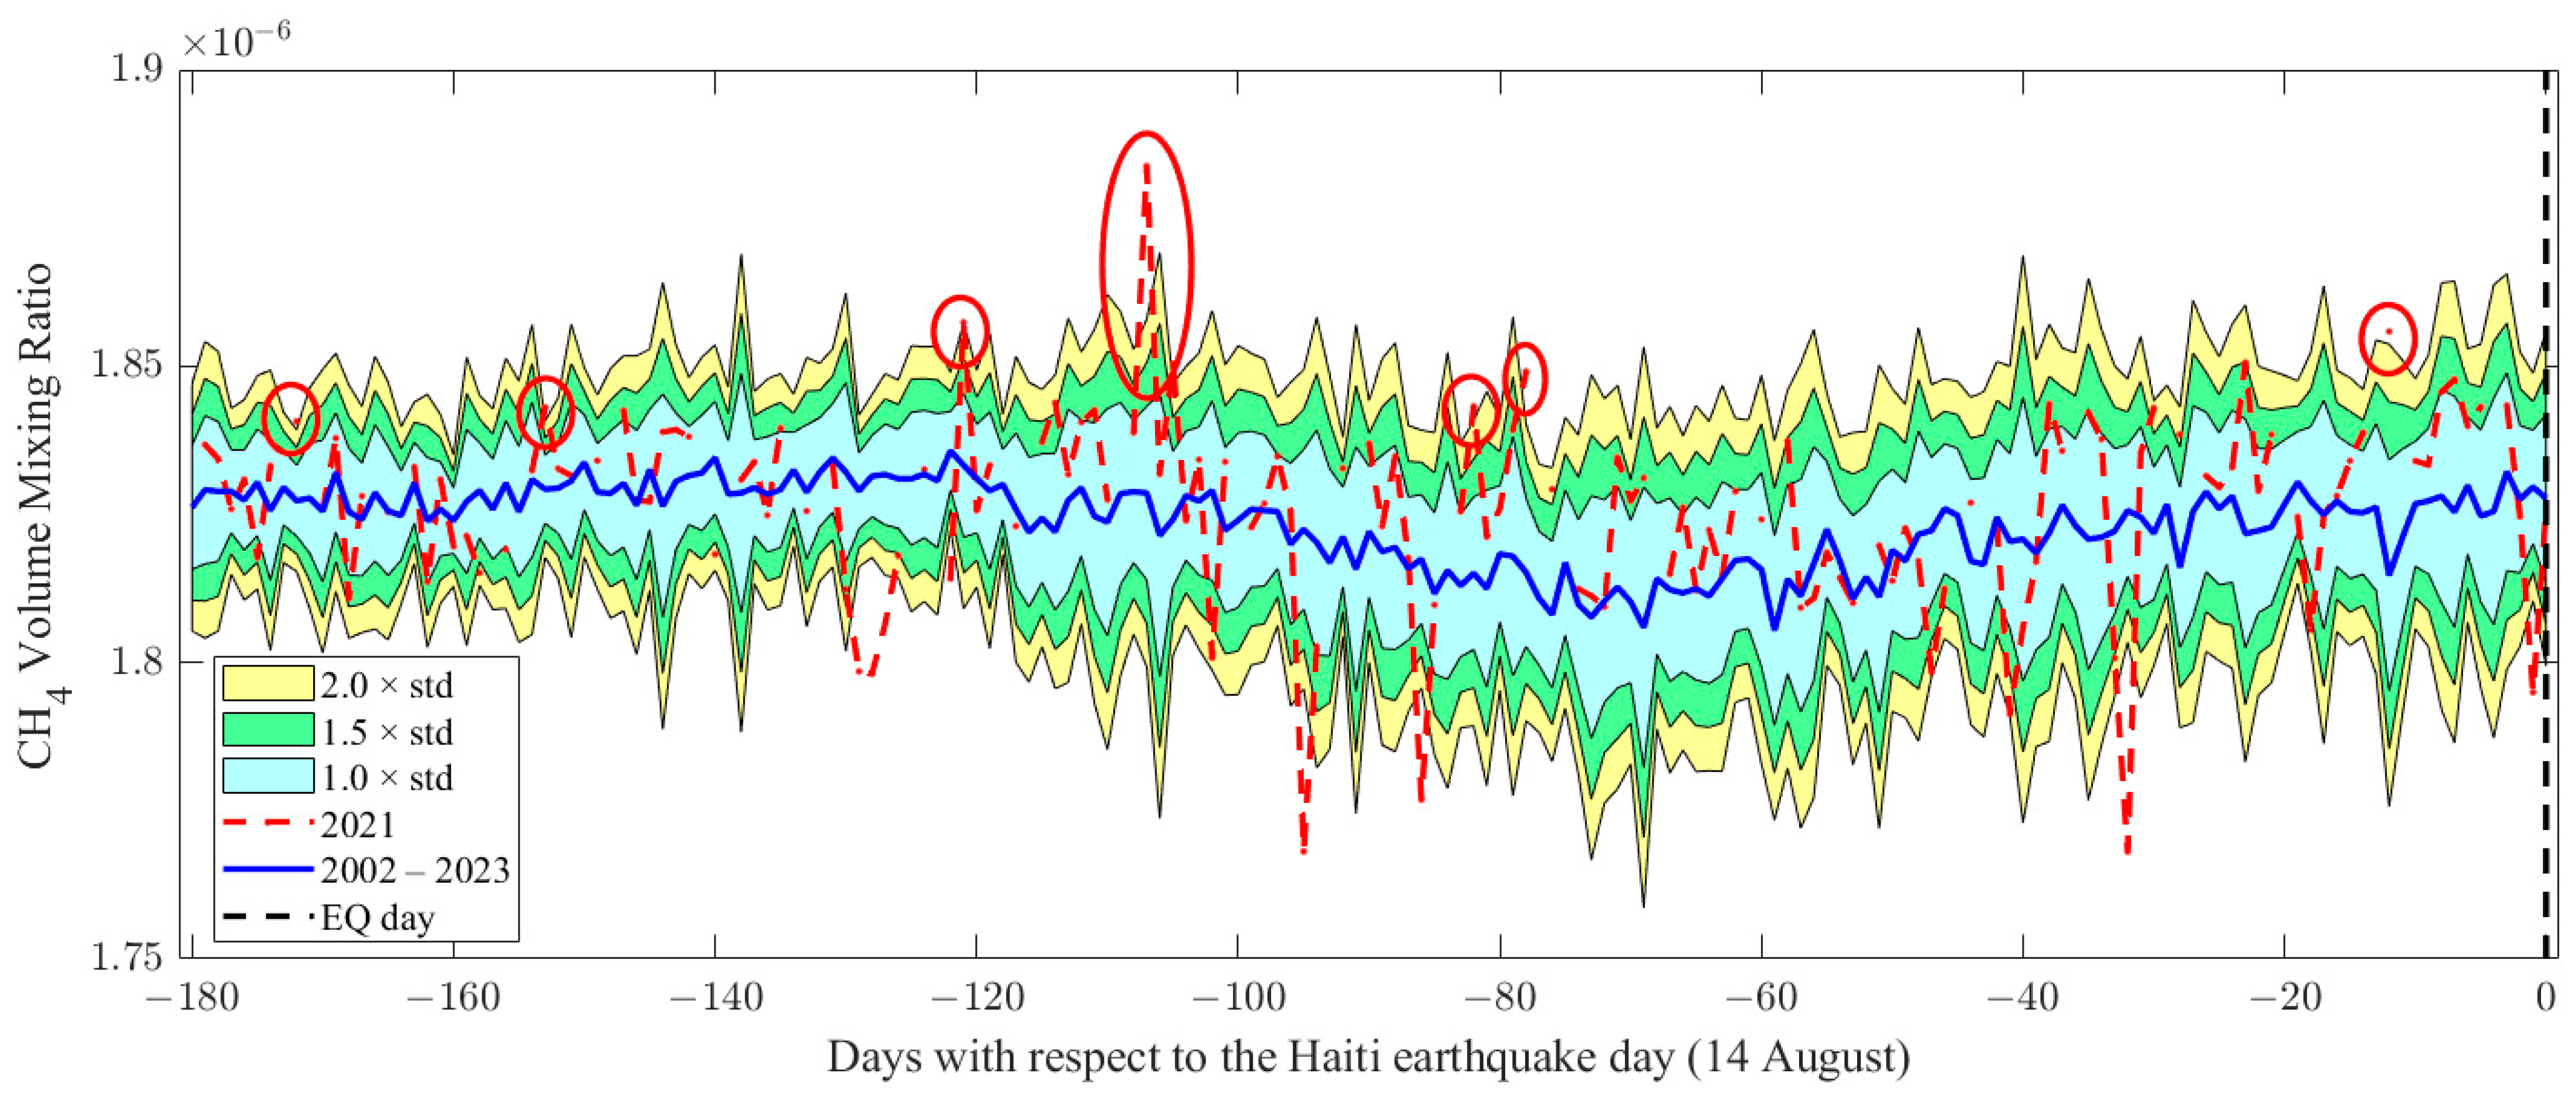
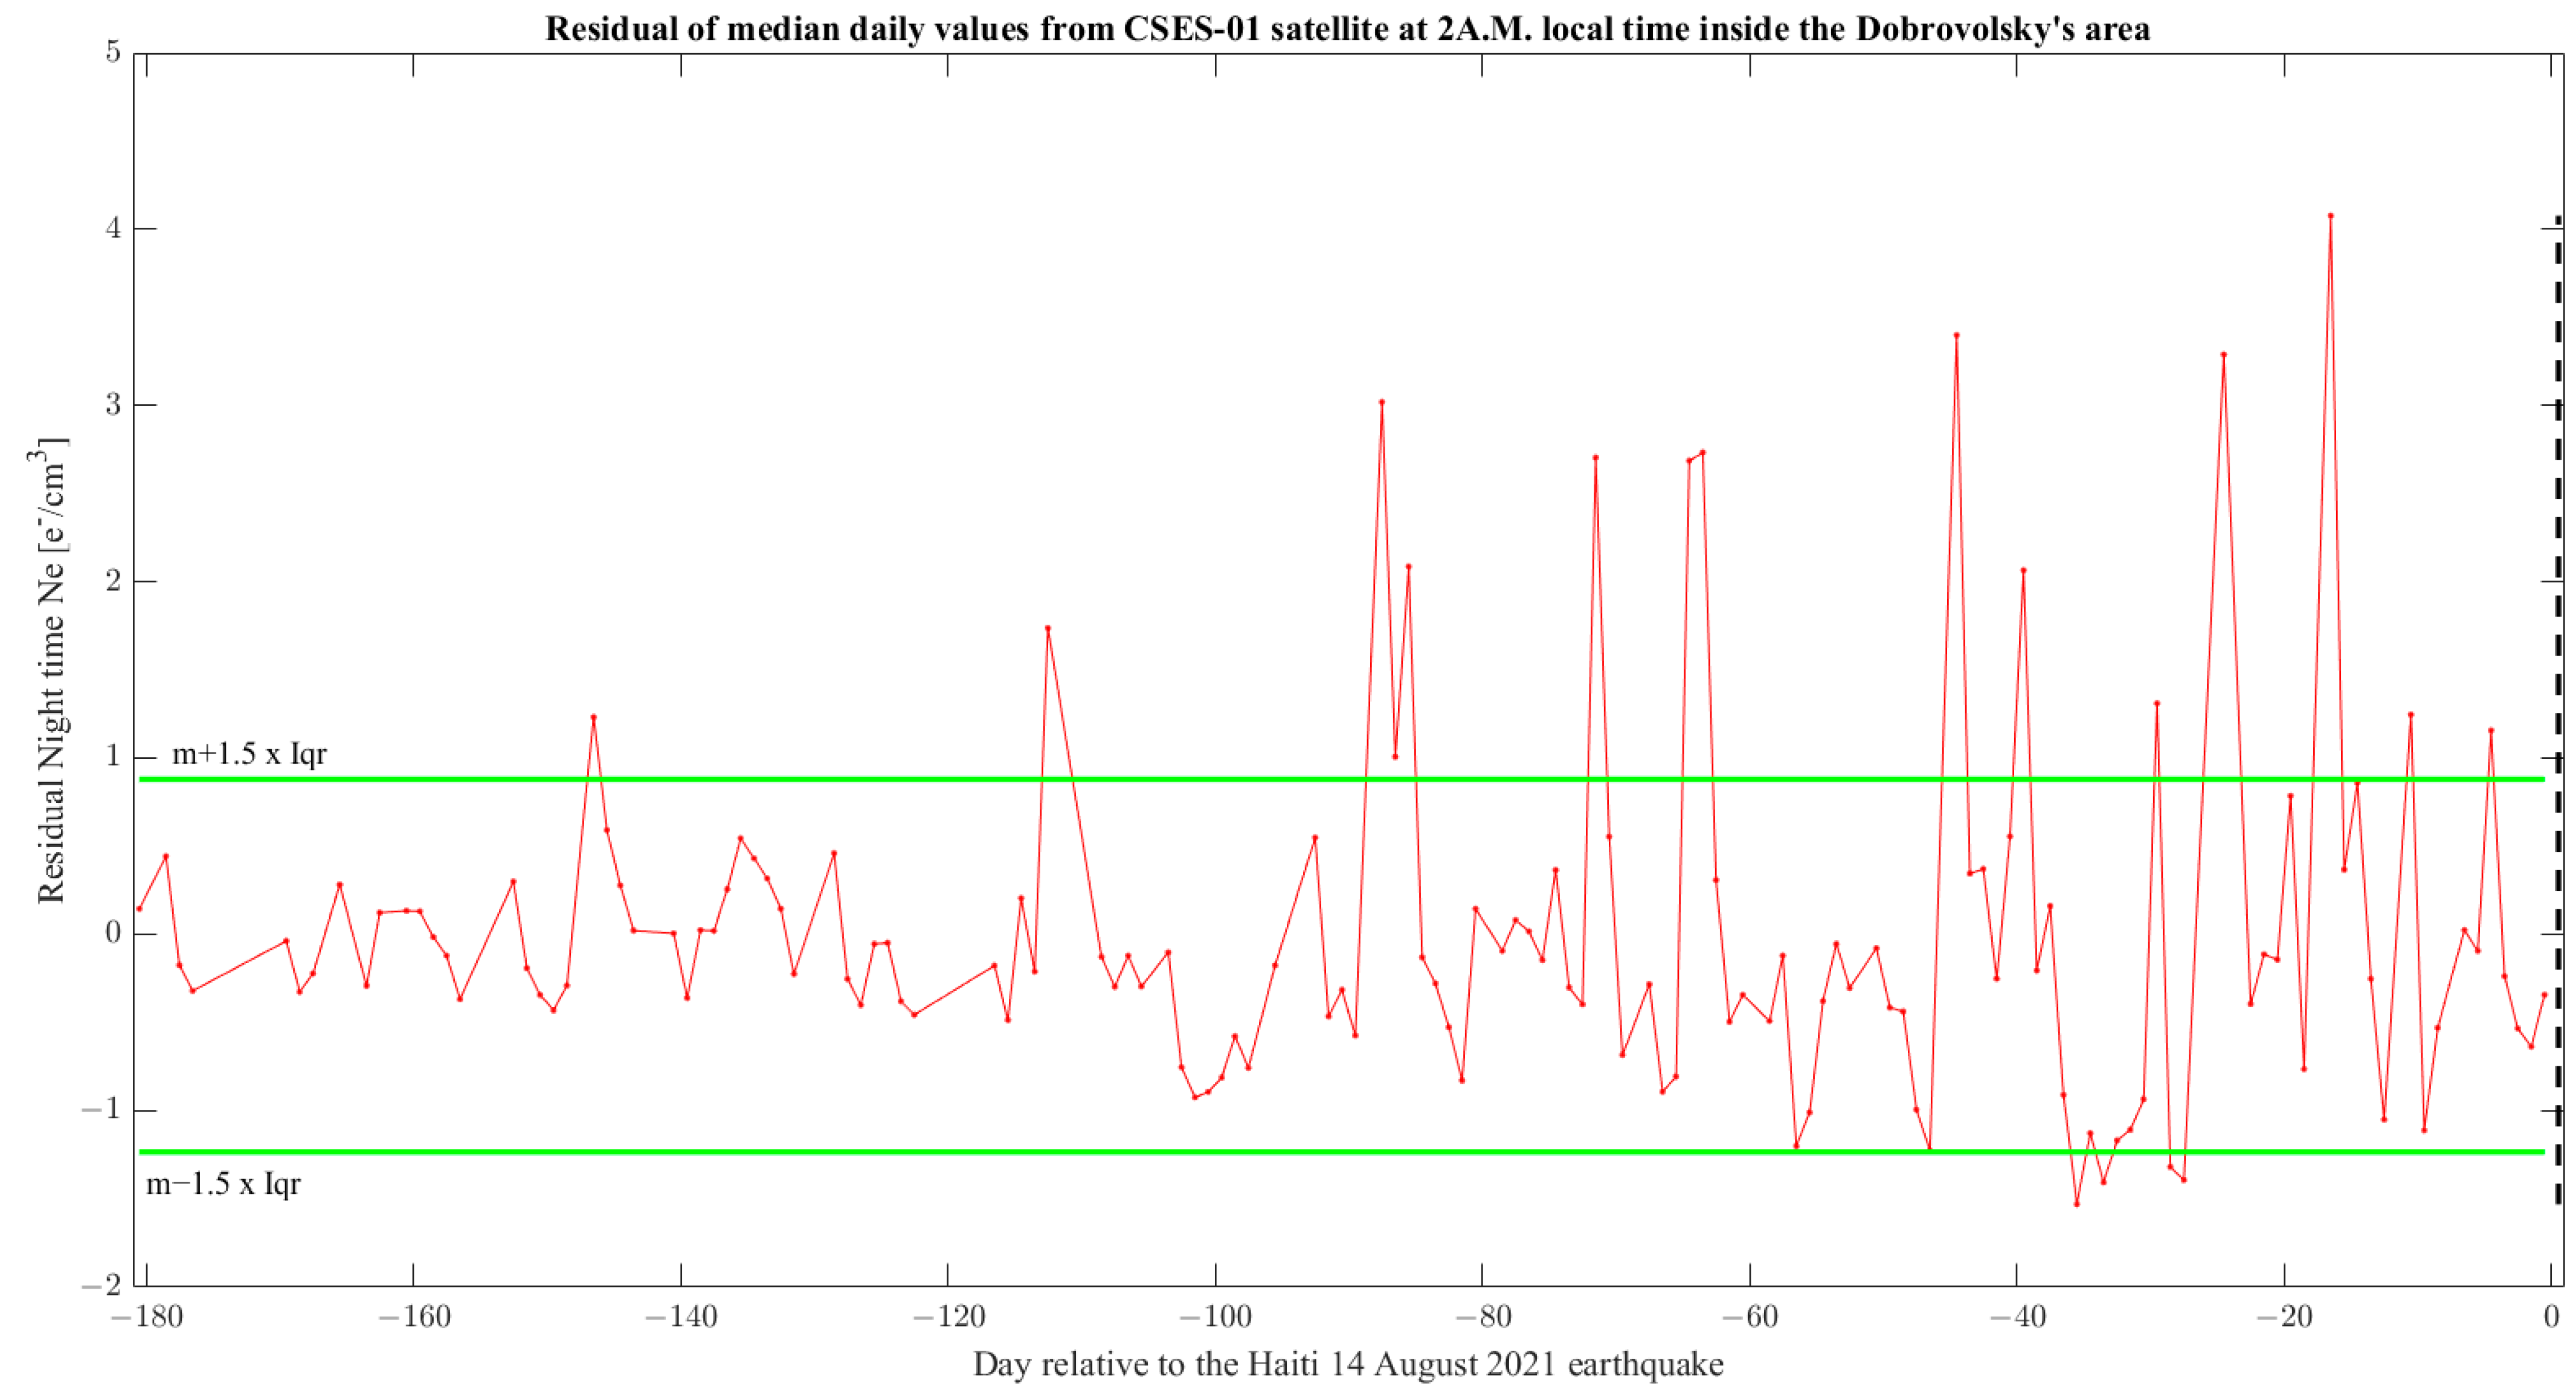
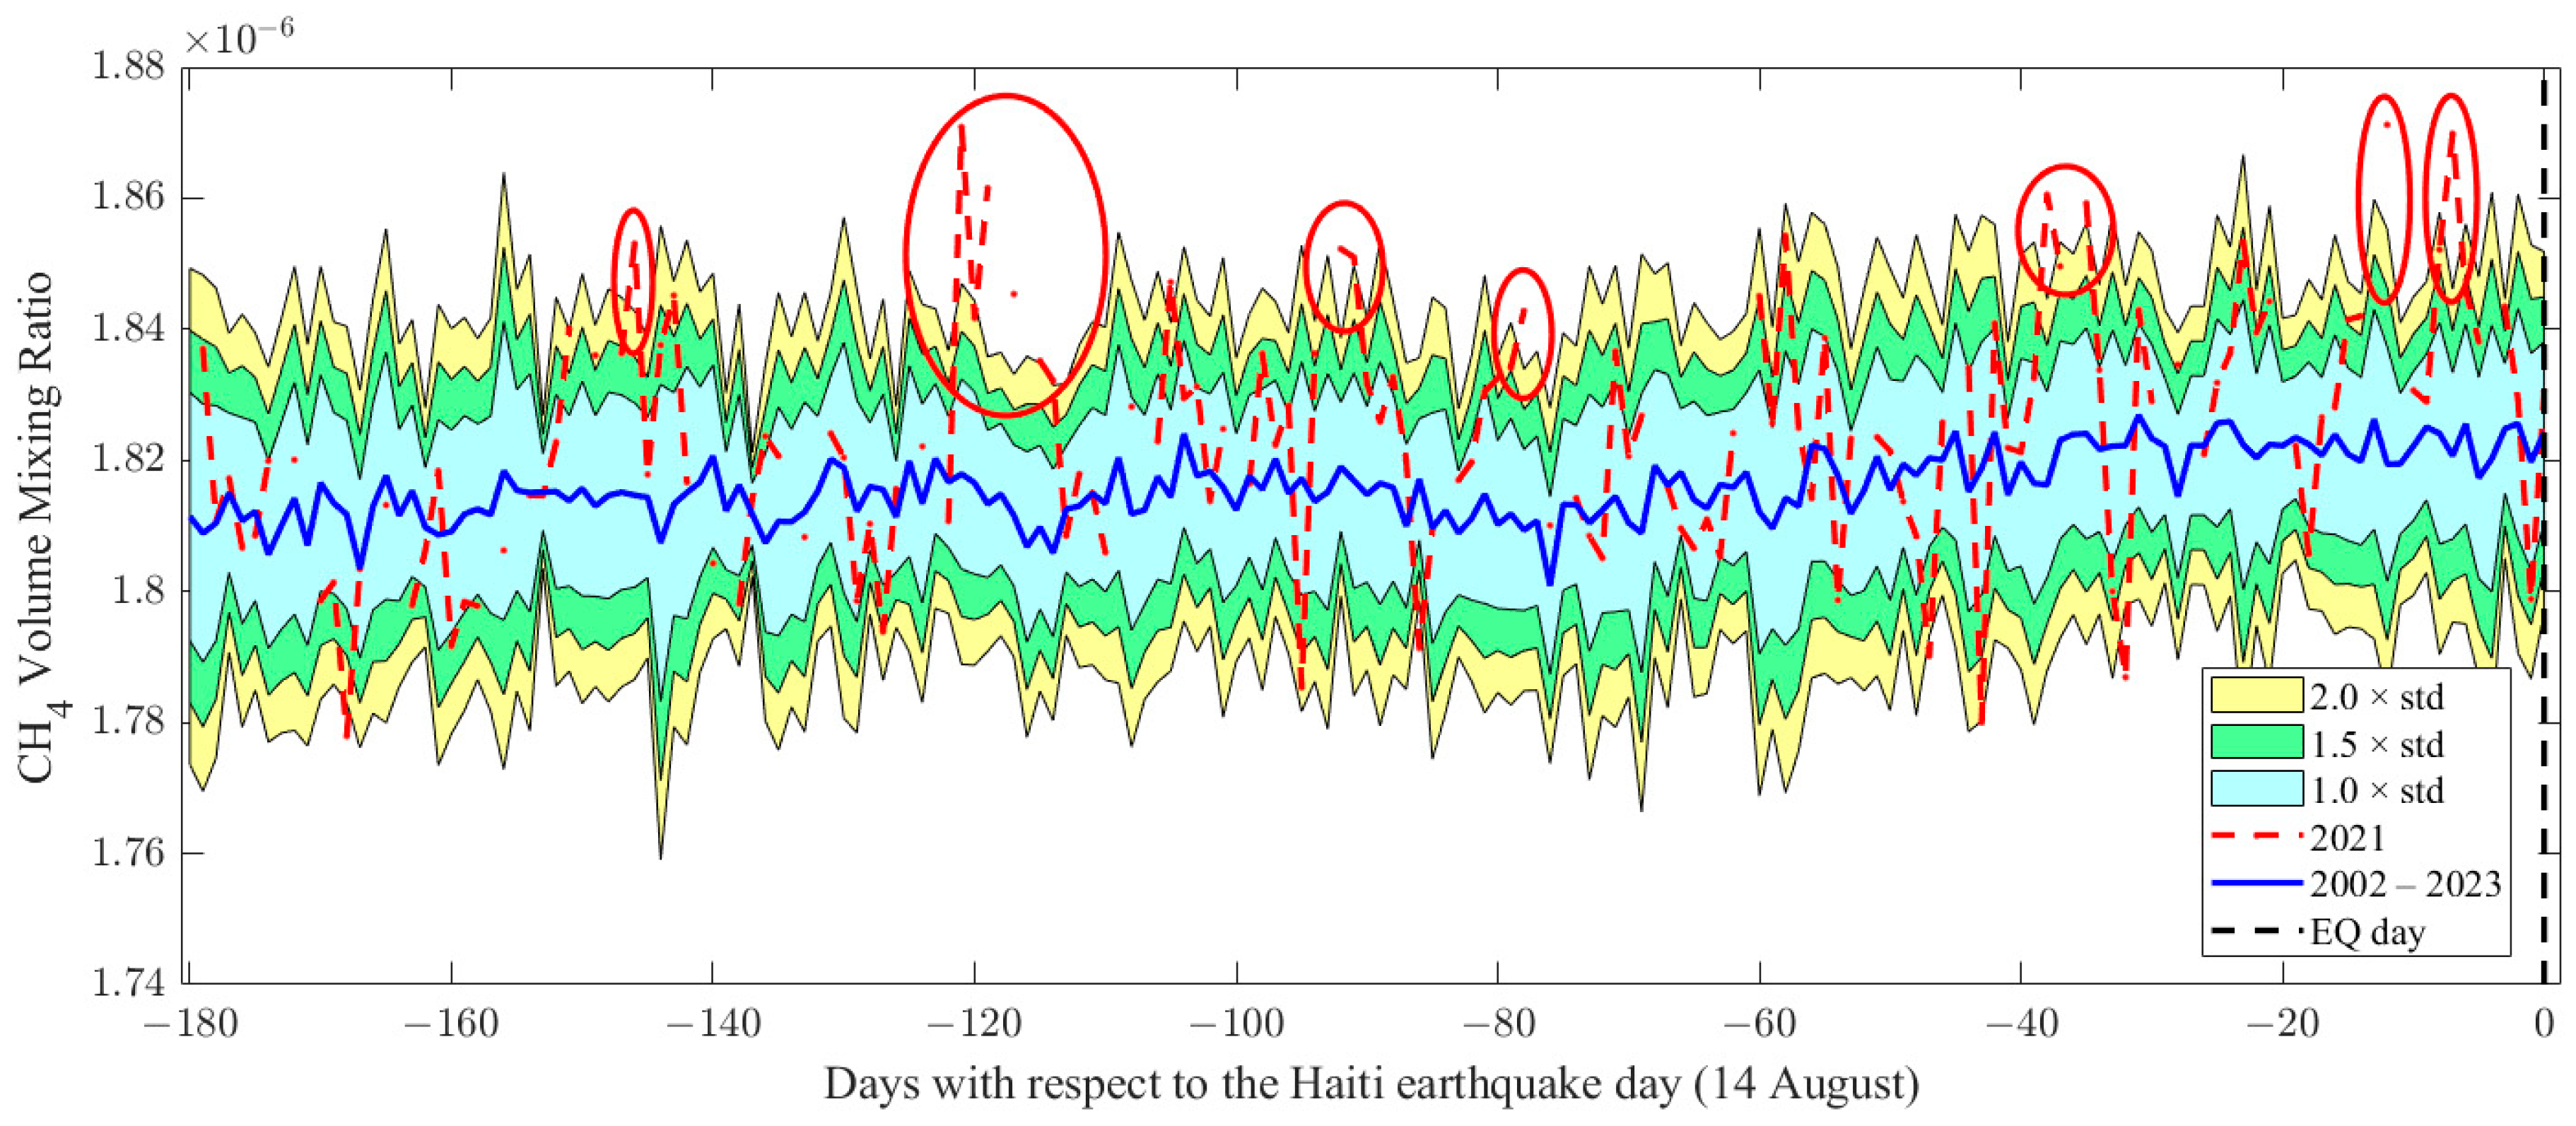
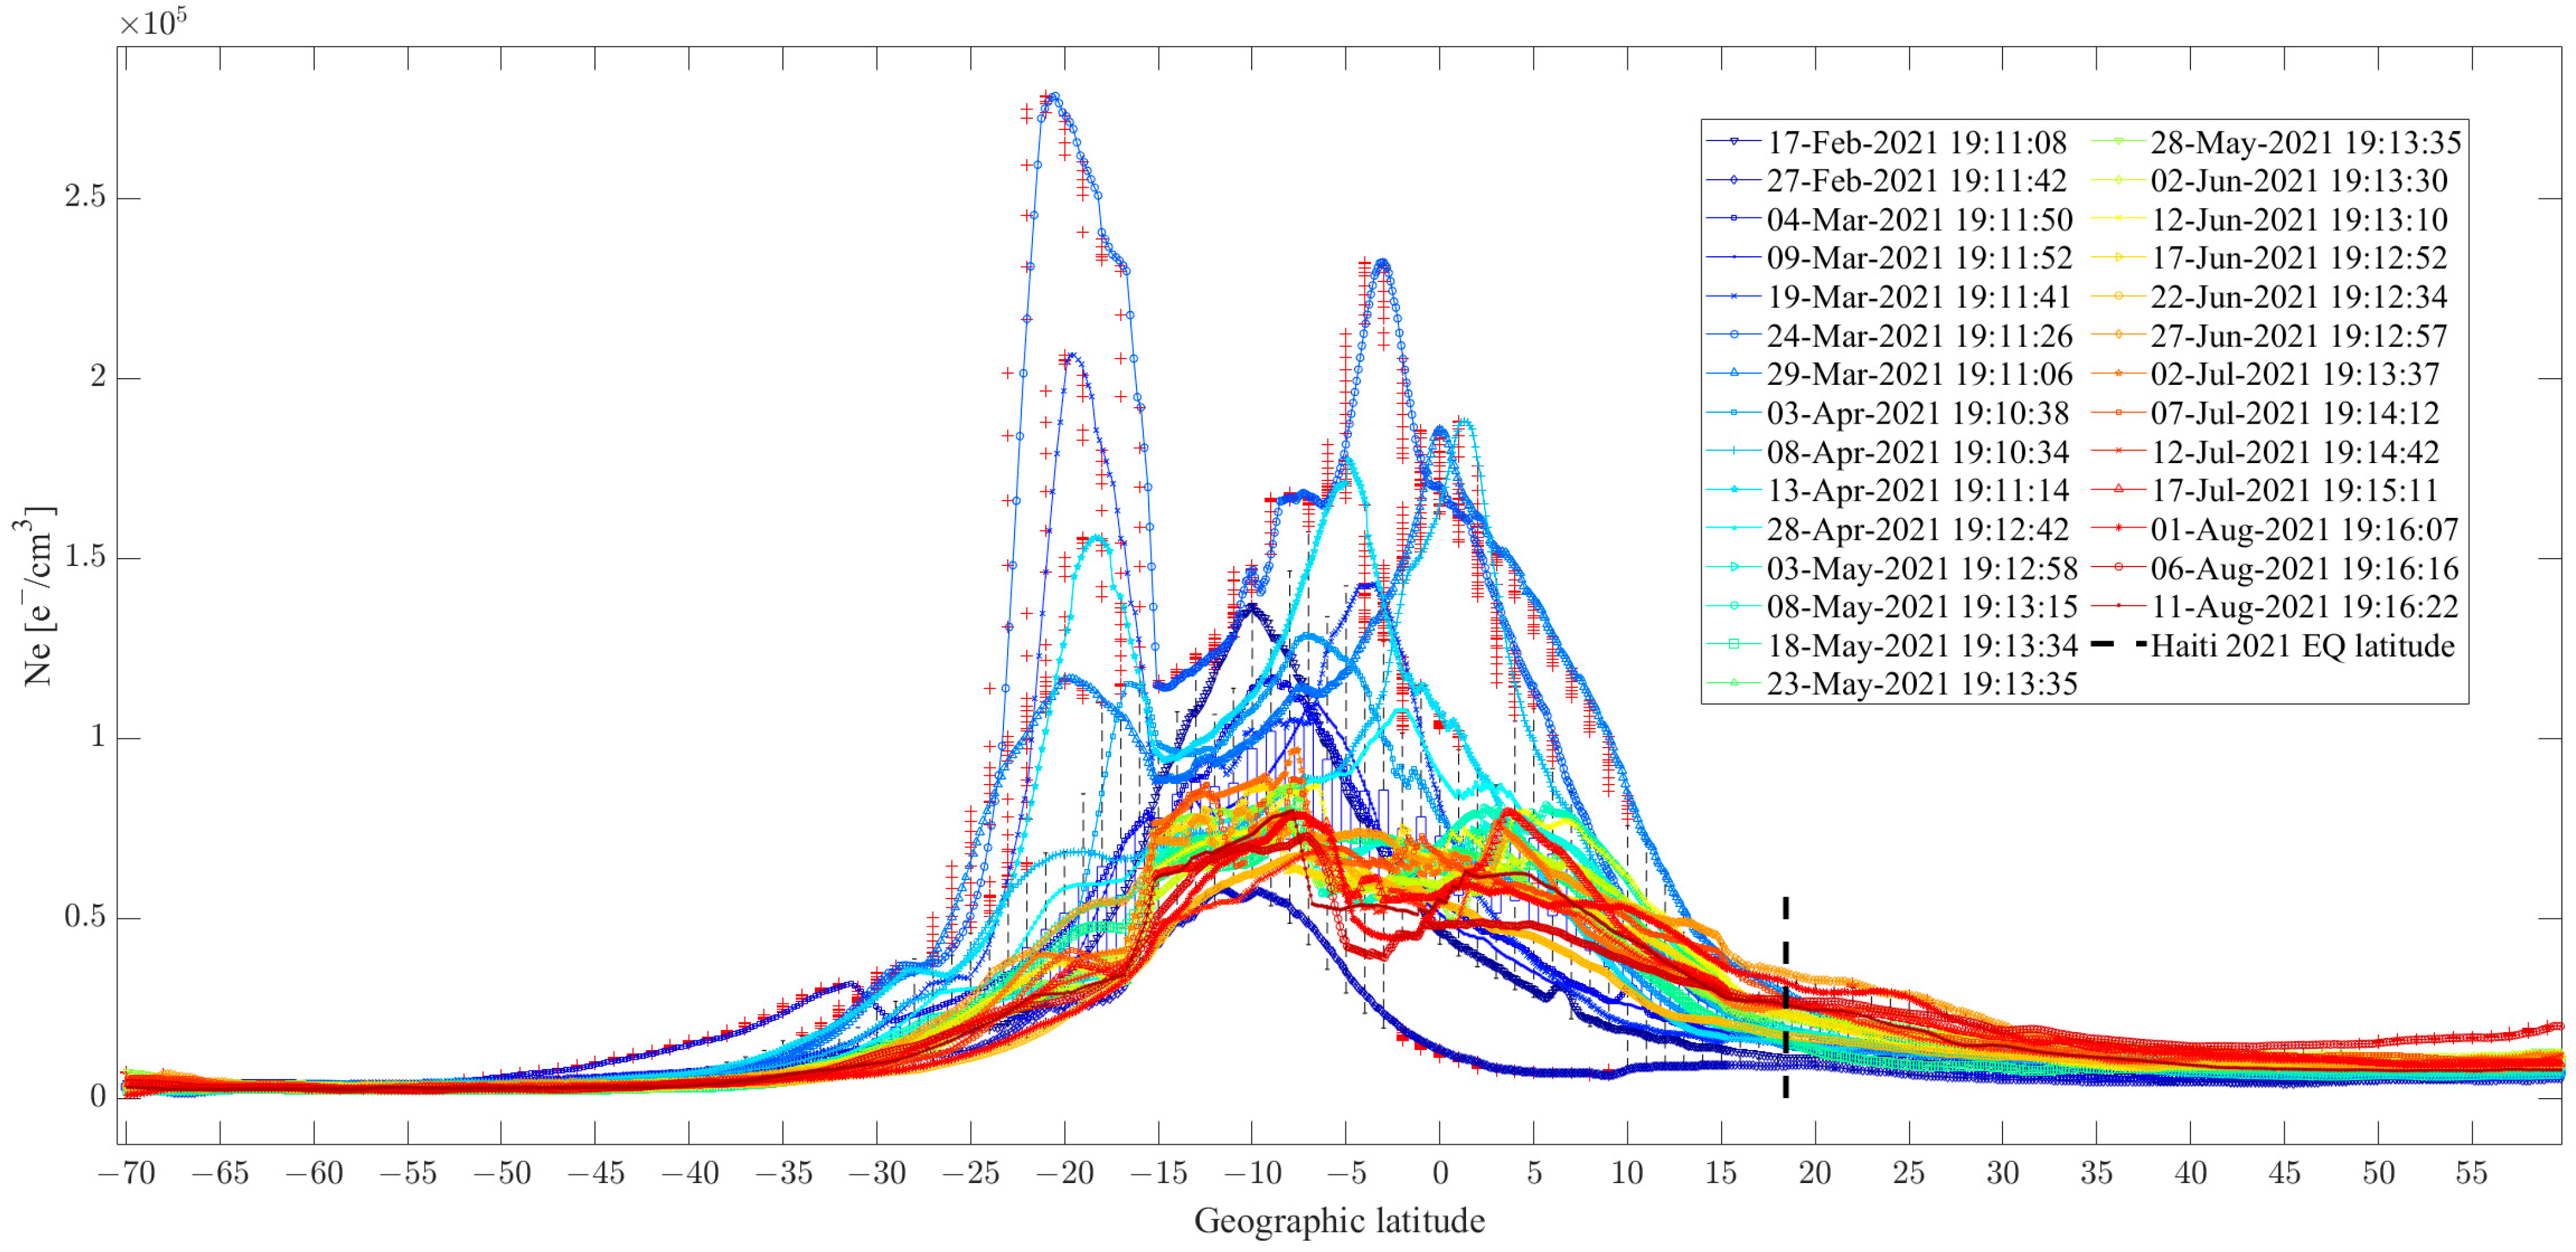
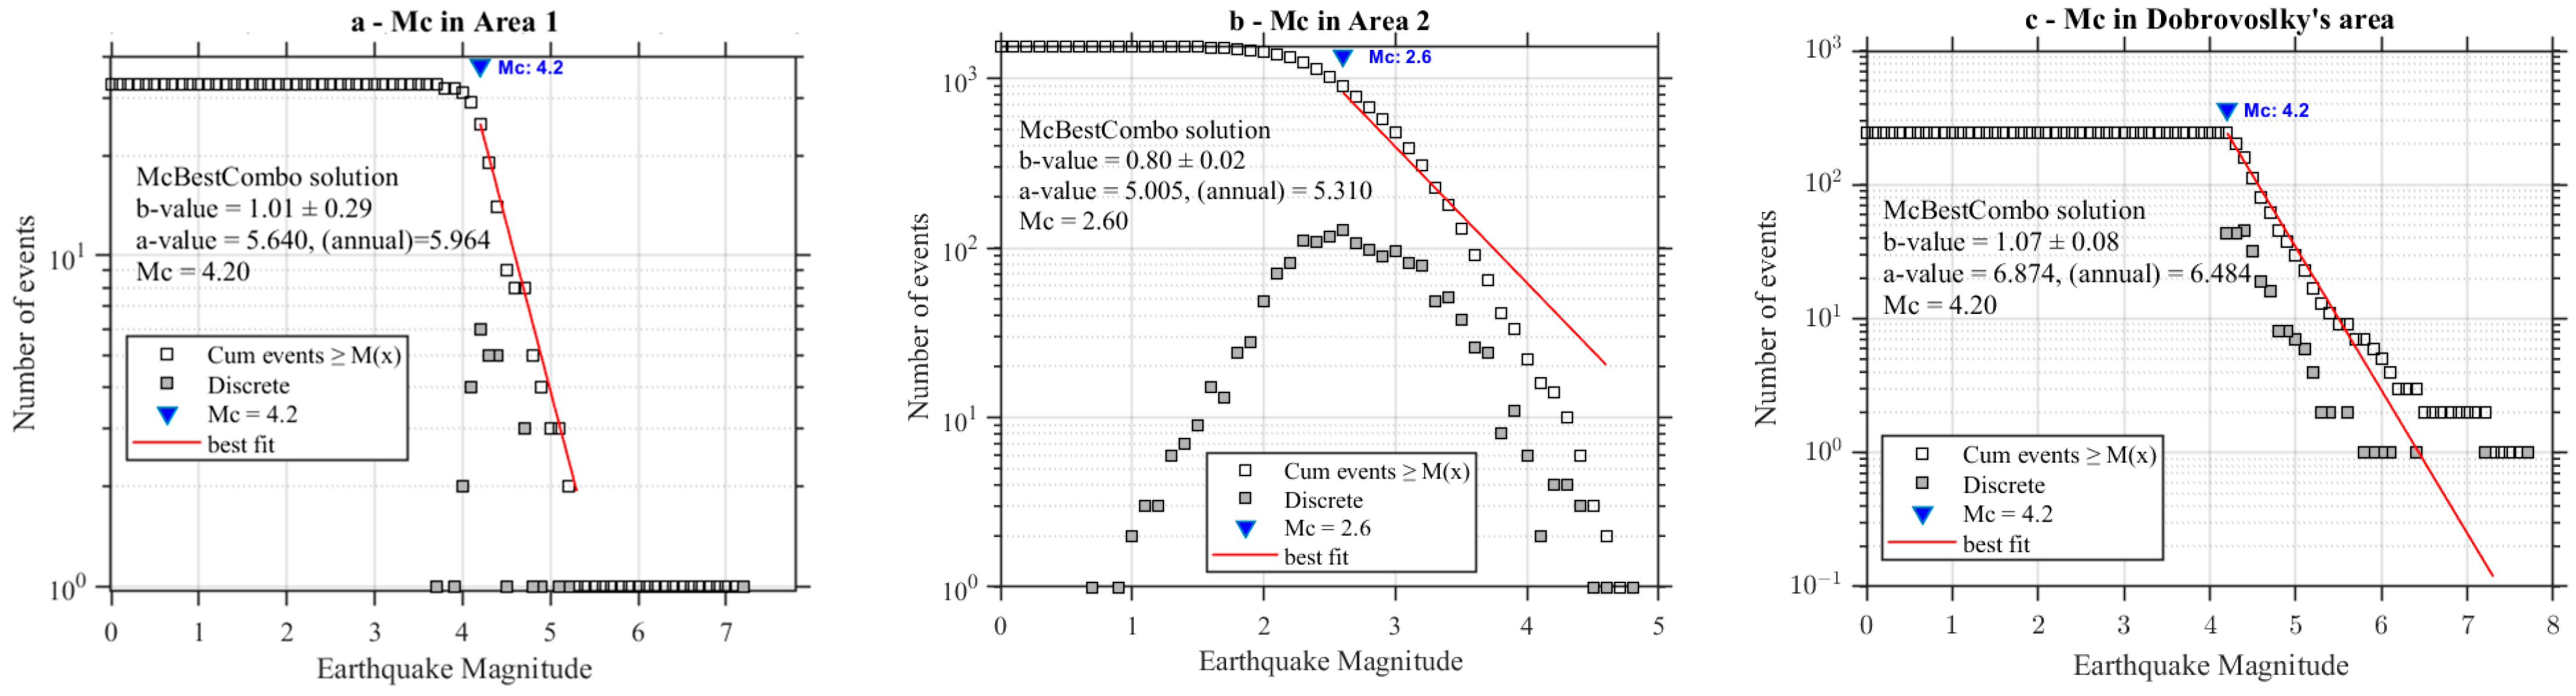
Table 1.
List of lithosphere, atmosphere and ionosphere anomalies in the six months before Mw = 7.2 Haiti 2021 earthquake occurrence.
Table 1.
List of lithosphere, atmosphere and ionosphere anomalies in the six months before Mw = 7.2 Haiti 2021 earthquake occurrence.
| Parameter | Anomalous Day [2021] | Anticipation Time [Day] | Value |
|---|---|---|---|
| Lithosphere | |||
| ES | 24 February | −171 | 6.5 × 10⁸ J/km2 |
| 6 April | −130 | 3.0 × 10⁹ J/km2 | |
| Atmosphere | |||
| Aerosol | 12 June | −63 | 0.61 |
| 13 June | −62 | 0.62 | |
| 14 June | −61 | 0.48 | |
| 14 July | −31 | 0.44 | |
| 21 July | −24 | 0.50 | |
| SO2 | 27 February | −168 | 1.93 × 10⁻⁶ kg/m2 |
| 17 March | −150 | 1.86 × 10⁻⁶ kg/m2 | |
| 14 June | −61 | 2.29 × 10⁻⁶ kg/m2 | |
| CO | 18 March | −149 | 102 × 10−9 ppbv |
| From 11 to 18 April (excluding 14 April) | From −125 to −118 (excluded −122) | 97 ÷ 111 × 10−9 ppbv | |
| From 6 to 8 June | From −69 to −67 | 75 ÷ 77 × 10−9 ppbv | |
| 17 June | −58 | 75 × 10−9 ppbv | |
| 4 July 1 | −41 | 90 × 10−9 ppbv | |
| 10 July | −35 | 81 × 10−9 ppbv | |
| 29 July | −16 | 78 × 10−9 ppbv | |
| 10 August | −4 | 80 × 10−9 ppbv | |
| Humidity | 27 July | −18 | 0.0164 |
| OLR | 17 March | −150 | 187 W/m2 |
| Temperature | 11 May | −95 | 301 K |
| CH4 | 24 February | −171 | 2.24 σ |
| 15 April | −153 | 2.40 σ | |
| 17 April | −107 | 3.76 σ | |
| 1 May | −105 | 2.29 σ | |
| 14 May | −82 | 2.18 σ | |
| 28 May | −78 | 2.71 σ | |
| 7 July | −12 | 2.11 σ | |
| Ionosphere | |||
| CSES-01 Ne | 20 March | −147 | 1.232 × 10⁴ e−/cm3 |
| 23 April | −113 | 1.737 × 10⁴ e−/cm3 | |
| 18–20 May | From −88 to −86 | (1.006 ÷ 3.019) × 104 e−/cm3 | |
| 3 June | −72 | 2.704 × 10⁴ e−/cm3 | |
| 10–11 June | −65 | 2.7 × 10⁴ e−/cm3 | |
| 30 June | −45 | 3.398 × 10⁴ e−/cm3 | |
| 5 July | −40 | 2.065 × 10⁴ e−/cm3 | |
| 15 July | −30 | 1.309 × 10⁴ e−/cm3 | |
| 20 July | −25 | 3.288 × 10⁴ e−/cm3 | |
| 28 July | −17 | 4.076 × 10⁴ e−/cm3 | |
| 3 August | −11 | 1.246 × 10⁴ e−/cm3 | |
| 9 August | −5 | 1.155 × 10⁴ e−/cm3 | |
| TEC | 1 July | −44 | 1.44 TECU 2 |
| 2 July | −43 | 1.35 TECU 2 | |
1 On this day, hurricane Elsa passed inside the atmospheric research area, so this anomaly is likely due to weather perturbation. 2 The value is in normalised TECU units.
Disclaimer/Publisher’s Note: The statements, opinions and data contained in all publications are solely those of the individual author(s) and contributor(s) and not of MDPI and/or the editor(s). MDPI and/or the editor(s) disclaim responsibility for any injury to people or property resulting from any ideas, methods, instructions or products referred to in the content. |
© 2024 by the author. Licensee MDPI, Basel, Switzerland. This article is an open access article distributed under the terms and conditions of the Creative Commons Attribution (CC BY) license (https://creativecommons.org/licenses/by/4.0/).
Share and Cite
MDPI and ACS Style
Marchetti, D. Observation of the Preparation Phase Associated with Mw = 7.2 Haiti Earthquake on 14 August 2021 from a Geophysical Data Point of View. Geosciences 2024, 14, 96. https://doi.org/10.3390/geosciences14040096
AMA Style
Marchetti D. Observation of the Preparation Phase Associated with Mw = 7.2 Haiti Earthquake on 14 August 2021 from a Geophysical Data Point of View. Geosciences. 2024; 14(4):96. https://doi.org/10.3390/geosciences14040096
Chicago/Turabian StyleMarchetti, Dedalo. 2024. "Observation of the Preparation Phase Associated with Mw = 7.2 Haiti Earthquake on 14 August 2021 from a Geophysical Data Point of View" Geosciences 14, no. 4: 96. https://doi.org/10.3390/geosciences14040096
Note that from the first issue of 2016, this journal uses article numbers instead of page numbers. See further details here.