1. Introduction
Real-time monitoring of deep geological disposal facilities (GDFs) for radioactive waste disposal is a significant challenge. The operational timescales of a GDF mean that monitoring technologies must function reliably over timescales in excess of 100 years [
1]. A regulatory requirement of any GDF is likely to be the in-situ monitoring of the thermo-hydro-mechanical-chemical (THMC) behaviour of the engineered barrier system (EBS) that surrounds the waste canister. Monitoring creates significant challenges: temperatures can be highly elevated due to the presence of heat generating waste, relative humidity (RH) varies from 20% to 100%, and swelling pressures within the bentonite barrier are typically in excess of 2 MPa.
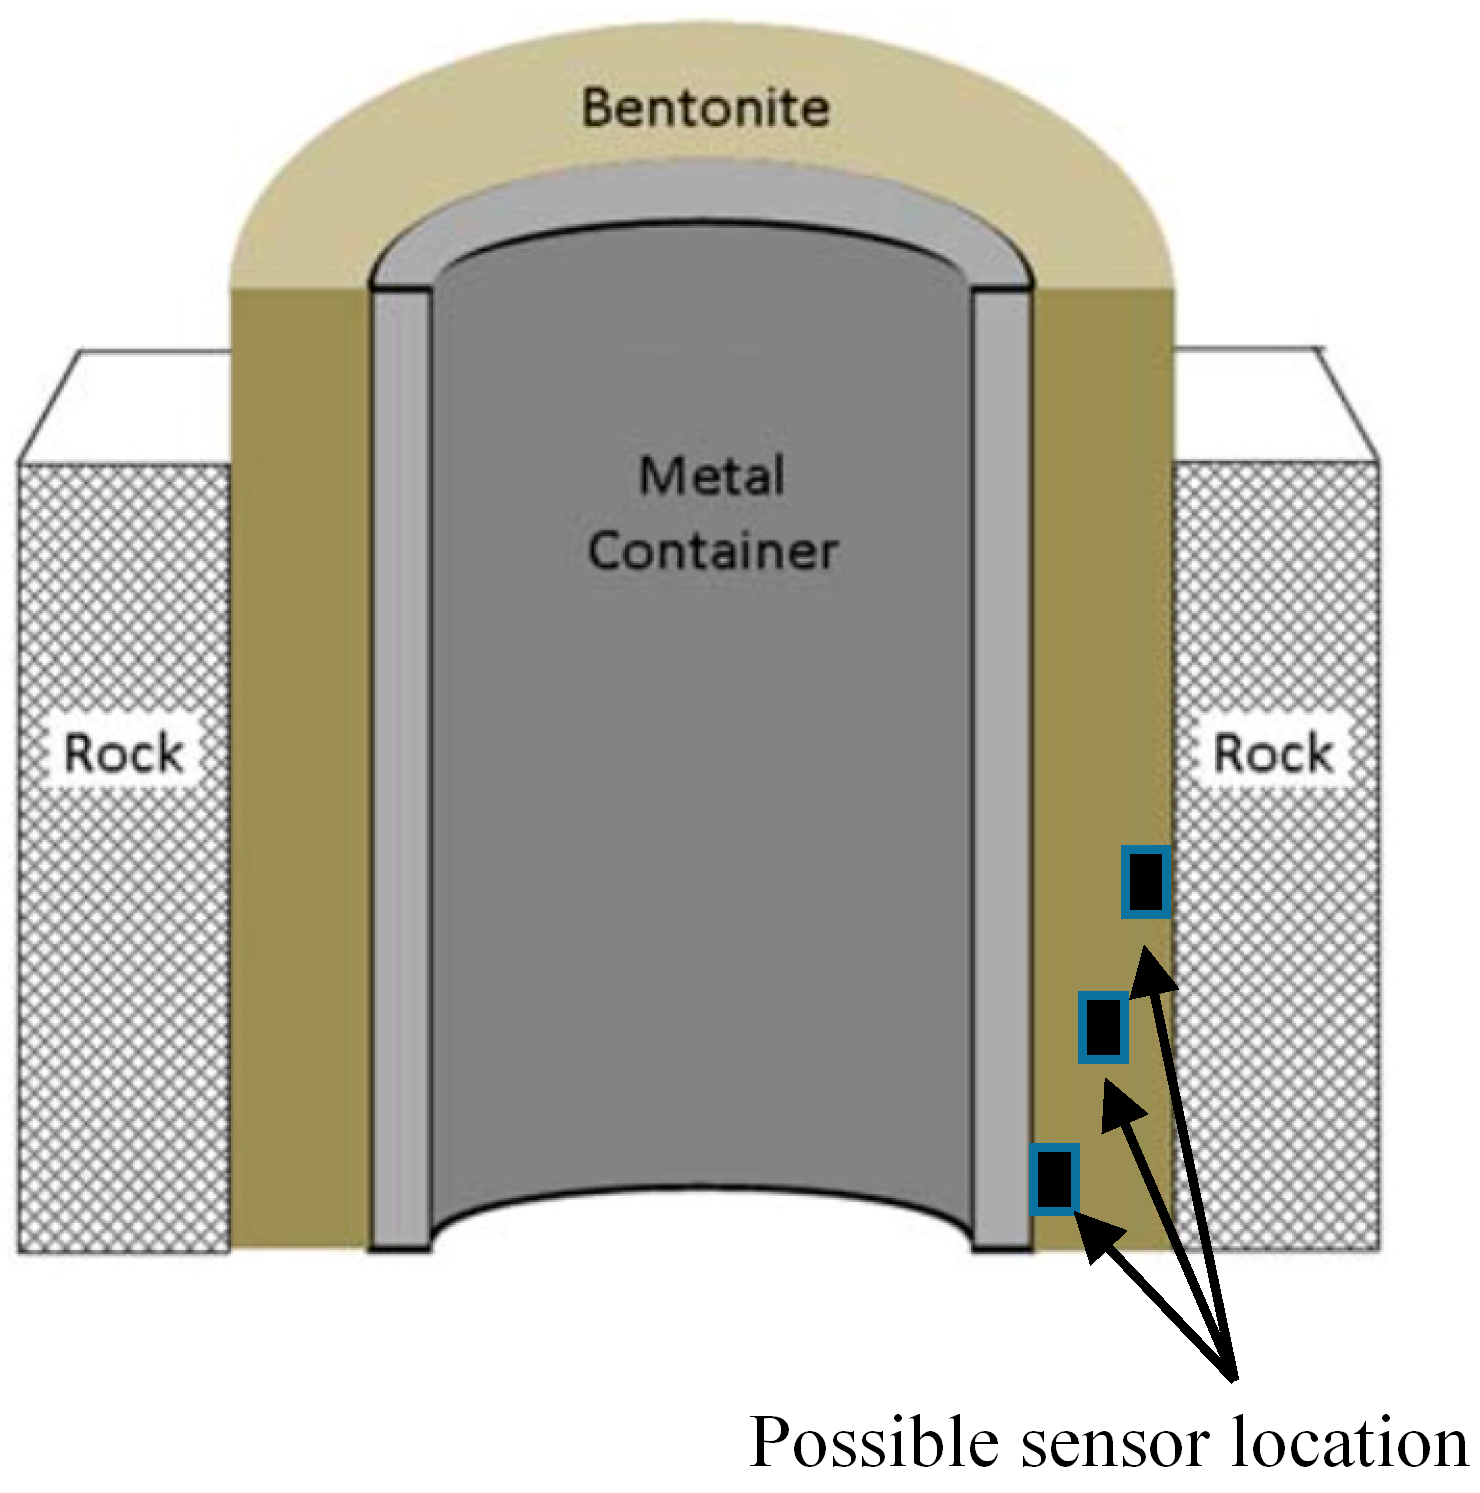
Most geological disposal concepts, for example the Swedish KBS-3V concept, are based on an EBS composed of a compacted bentonite buffer, which surrounds the waste canister (e.g.,
Figure 1). Post deposition, the bentonite buffer saturates via groundwater ingress from the surrounding rock, which results in a swelling pressure of between 2 and 10 MPa to ensure hydraulic sealing between the EBS, the surrounding rock and the central waste canister. Further, the very low hydraulic permeability of the bentonite ensures that, should canister failure occur, radionuclide transport would be extremely slow, since it is via diffusion only. Finally, the plastic nature of the saturated bentonite within the EBS also protects the canister from structural damage during small earthquakes [
2].
Historically, an extensive range of relative humidity sensors have been deployed in radioactive waste disposal facilities and in underground testing laboratories over the past decades [
3,
4]. While the measurement principle of the sensors varies, one common restraint of these traditional sensors lies in the unit size of the sensor (typically in the order of 10 cm), which limits the spatial resolution of the sensing device.
This research focuses on testing of a MEMS-based (Micro-Electro-Mechanical System) sensing system, developed in [
5] for monitoring relative humidity within, or adjacent to, the compacted bentonite buffer in the EBS. Application of MEMS sensors in GDFs and other civil engineering projects still faces several key challenges in the engineering field [
6]. This paper extends our previous research [
5] by testing the performance of bespoke encapsulated MEMS sensors within saturated bentonite under swelling pressures of 2 MPa. We show that our encapsulated MEMS monitoring system can withstand swelling pressures in excess of 2 MPa and that, through improved sensor calibration, accurate measurements of compacted bentonite relative humidity can be achieved even up to RH values of 100%.
2. Materials and Methods
MEMS sensors provide higher measurement accuracy, improved spatial resolution in a limited space, and a longer life cycle resulting from low power consumption in the order of microwatts [
7]. A first prototype of a multi-sensor monitoring system was presented in [
5]. The system contains the Maxim
® 31725 temperature sensor (Maxim Integrated, San Jose, CA, USA) [
8] and the Sensirion
® SHT25 relative humidity sensor (Sensirion, Staefa Switzerland) [
9]. The Maxim
® 31725 temperature sensor (Maxim Integrated, San Jose, CA, USA) has a typical precision of ± 0.5 °C for a measurement range between −55 °C and 150 °C, and the Sensirion
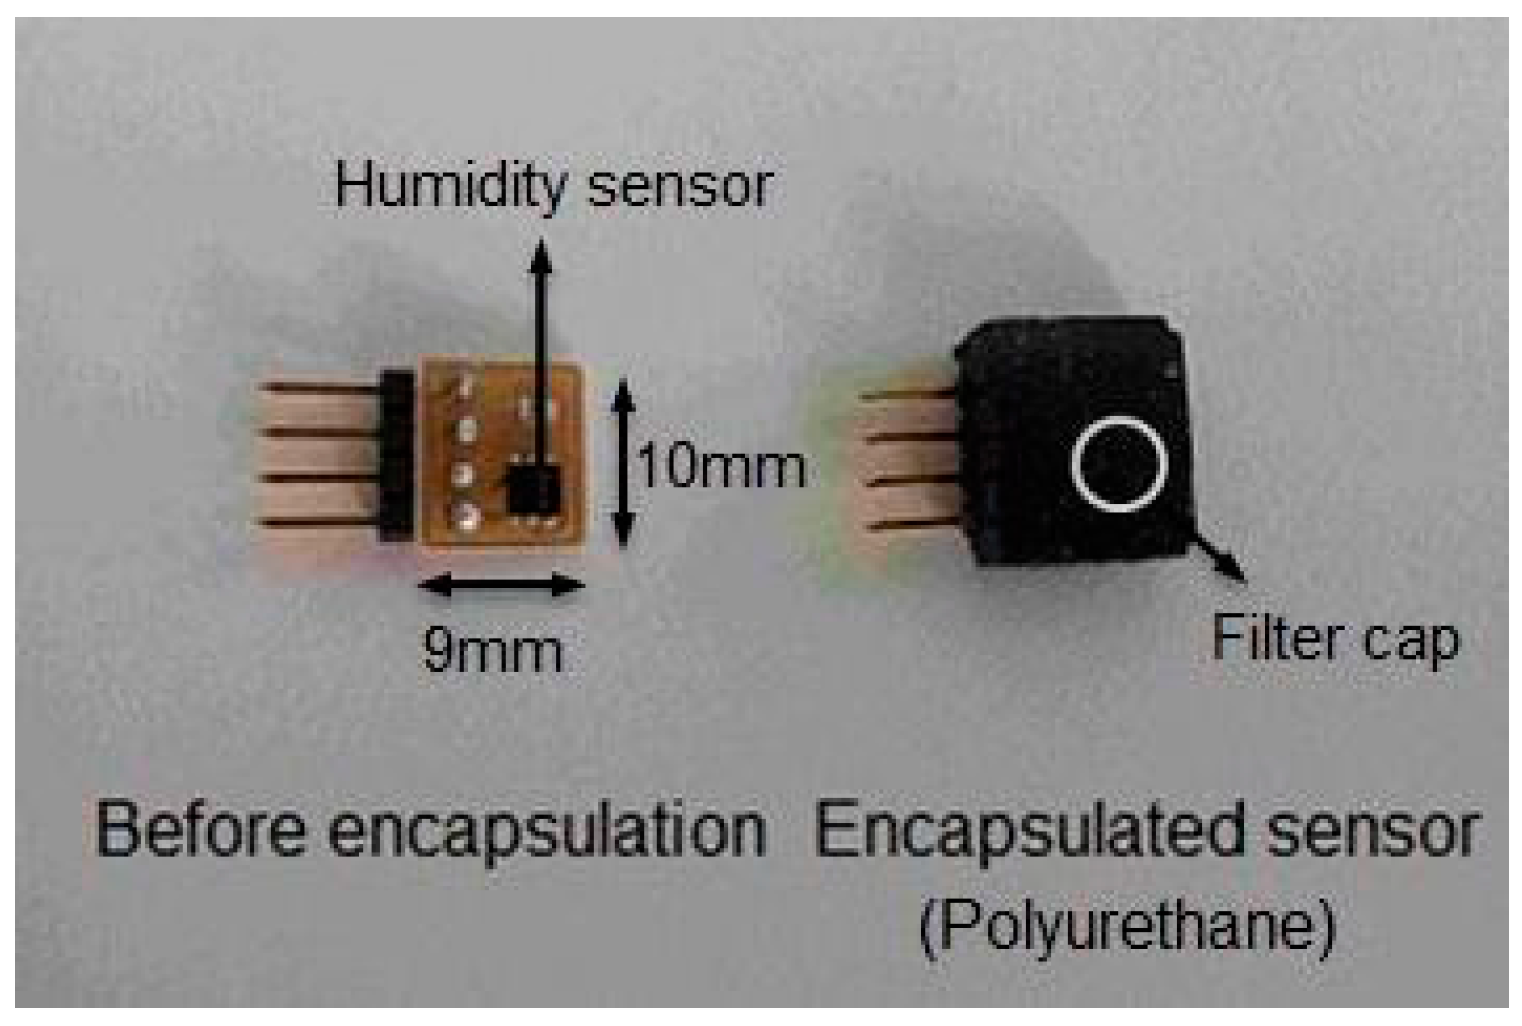
® (Sensirion, Staefa, Switzerland) SHT25 RH sensor has a labelled precision level of ±1.8% within the 10–90% RH range, and ±3% for the full RH range. Both sensors have a chip dimension of 3 mm × 3 mm × 1 mm, and are integrated onto a single printed circuit board (
Figure 2). To minimise size, the sensor block, 9 mm × 11 mm, is limited to hosting the sensor and its connector; all other functional components are integrated onto the motherboard that can be installed outside the bentonite barrier. The power supply and signal transmission are maintained by heat-resistant PTFE-coated wires that are compatible with temperatures between −60 °C and 200 °C. In future, these wires are planned for replacement by a wireless transmission system, which eliminates wire installation concerns, although at the expense of slightly increased sensor size.
To avoid direct contact between the sensor and the bentonite, a PTFE filter membrane cap designed by Sensirion
® (Sensirion, 8712 Staefa ZH, Switzerland) [
10] was incorporated to cover the RH sensor on the PCB board (printed circuit board) prior to encapsulation. The filter protects the sensor from mechanical impact and contamination and prevents liquid water entering the sensors by capillarity, thus invalidating the measurement. At the same time, it allows the propagation of water vapour molecules between the measuring environment and the RH sensor. The sensor was then encapsulated via a ‘potting’ method [
11] that uses polyurethane resin as an encapsulation material. This resulted in a rectangular polyurethane block that enclosed the sensor, with a window for the measurement of RH (
Figure 2). The encapsulated sensor block has similar dimensions to the sensor board prior to encapsulation, thus maintaining the small size. Since the MEMS temperature sensor is entirely encompassed during polyurethane encapsulation, it is unaffected by the bentonite, so is not discussed further. By contrast, the RH humidity sensor relies on detection through the sensing window (
Figure 2) and its accuracy may be compromised either by contact via liquid phase with the pore-water of the saturated bentonite, or by the swelling pressure that is exerted.
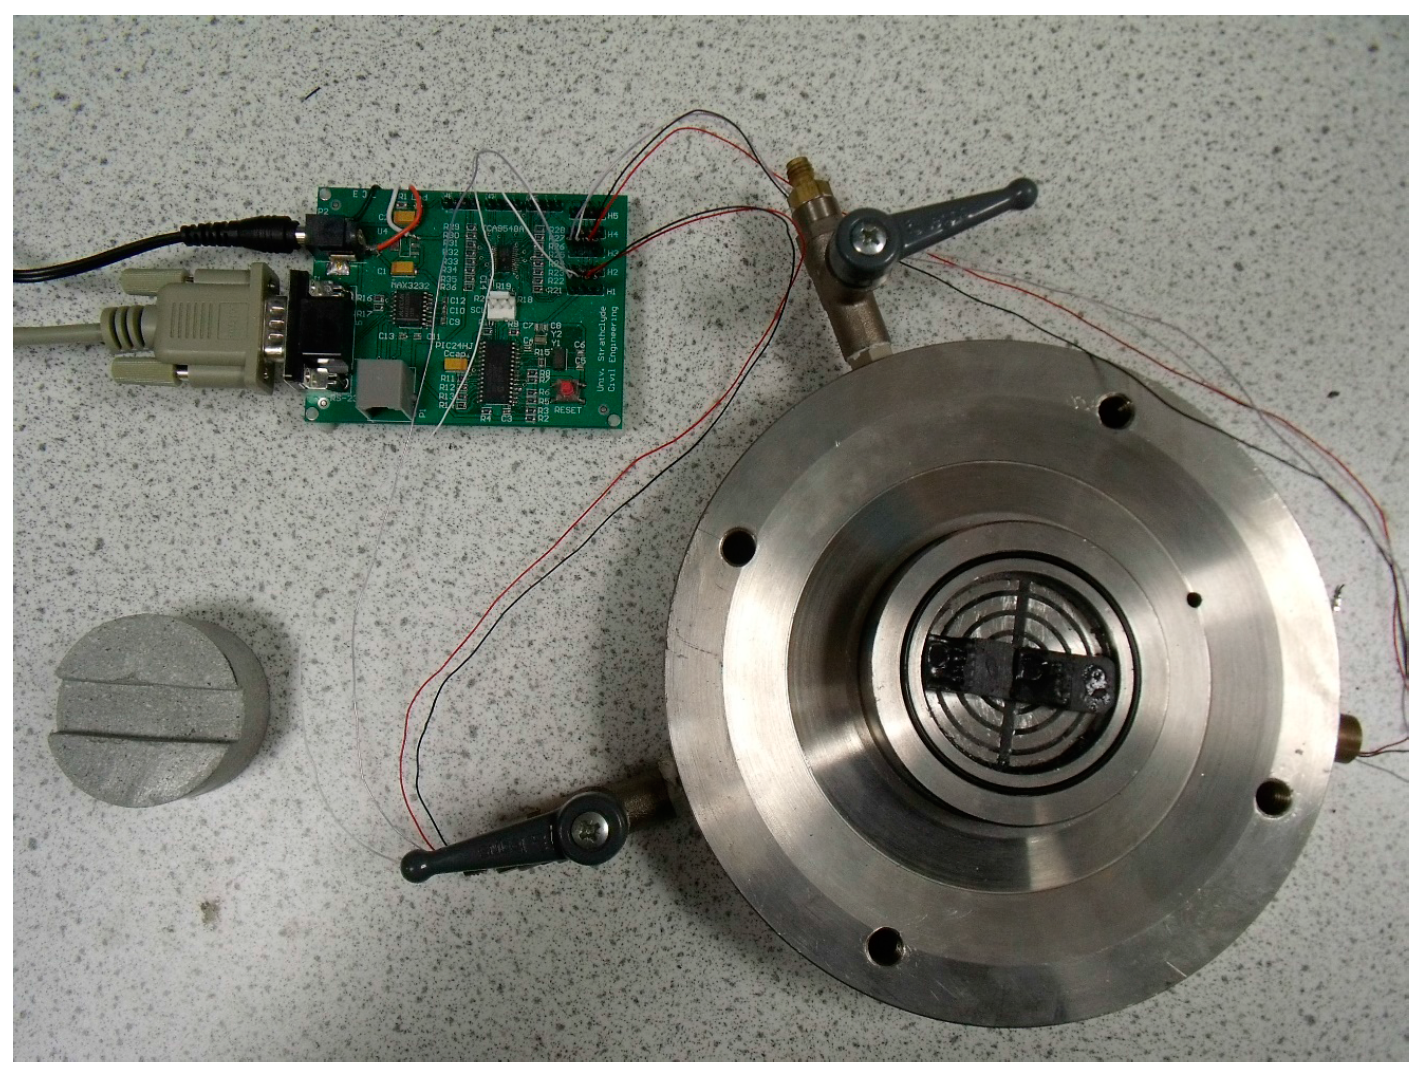
Experiment 1 focuses on verifying the mechanical robustness of the RH sensor under the swelling pressure exerted by hydrated bentonite. The test was carried out in an engineered oedometer cell, specifically designed by the Universitat Politecnica de Catalunya, as shown in
Figure 3. The oedometer cell is separated into two sections by a ceramic-disc-supported thin membrane. On top of the membrane, an enclosed water reservoir is used to apply a known vertical stress to the top of the sample within the range 0–2 MPa. A compacted bentonite block was fitted in the cavity below the membrane. The compacted MX-80 bentonite was drilled to form a 20 mm-thick cylinder block, with a diameter of 50 mm. The size of the bentonite block corresponded exactly to the dimension of the cavity inside the oedometer cell, in order to ensure that the top surface of the bentonite block was in firm contact with the membrane.
Hydration of the bentonite occurred through injection of deionised water from channel A (
Figure 3) onto the top surface of the bentonite. The gap between the bentonite block and the side ring of the oedometer was sealed by polyurethane resin, in order to inhibit the ingression of water down the sides of the bentonite so as to achieve uni-directional water flow from the top surface to the bottom surface of the bentonite block.
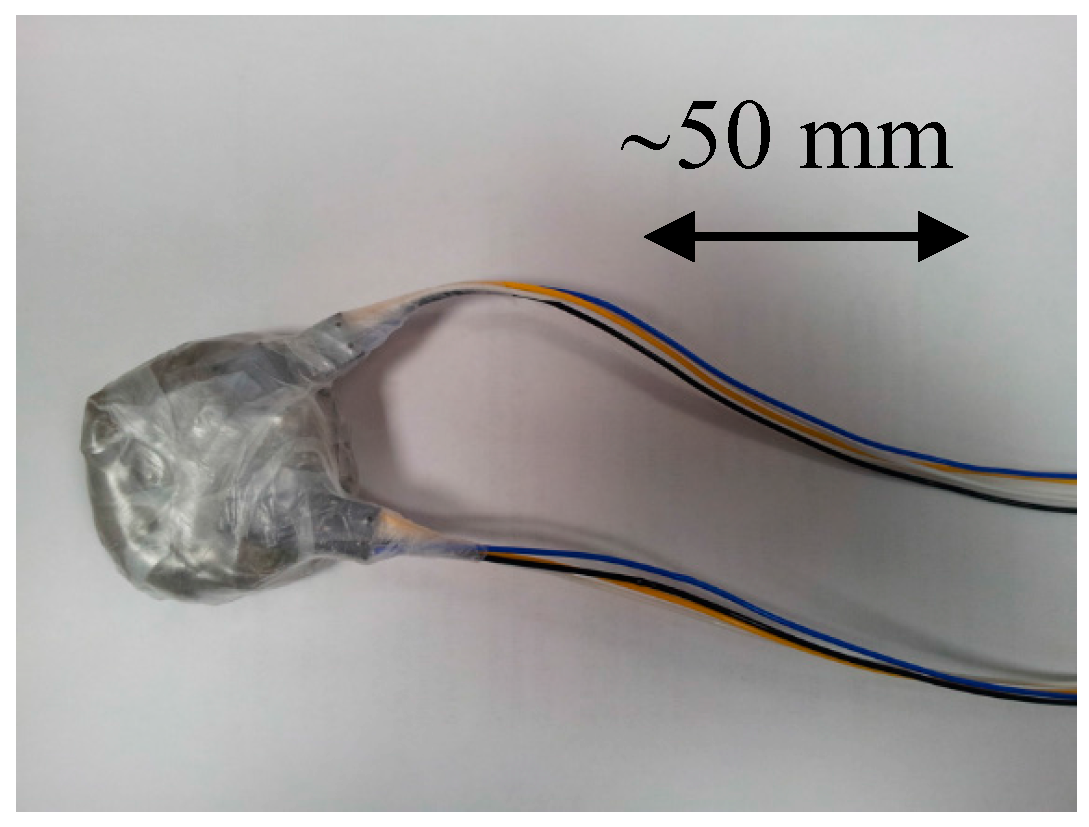
In order to insert two sensors (side-by-side), a rectangular groove was carved into the base of the bentonite block, as shown in
Figure 4. Two RH sensors were fitted into the groove, ensuring a firm contact with the bentonite block. This allowed the relative humidity at the bottom of the bentonite block to be measured during hydration. This installation minimised the volume of air between the sample and the sensor ensuring a rapid response time. The electrical wires connecting the sensors to the control system were meticulously guided through channels beneath the cavity to the outside of the oedometer cell, and connected to the controller board. The exterior entrances to these channels were sealed via application of polyurethane, in order to block the air ventilation through the channel, and hence to prevent pore-water evaporation from the sample and, most of all, water vapour flow through any gap between the sample and the sensor towards the outside of the cell.
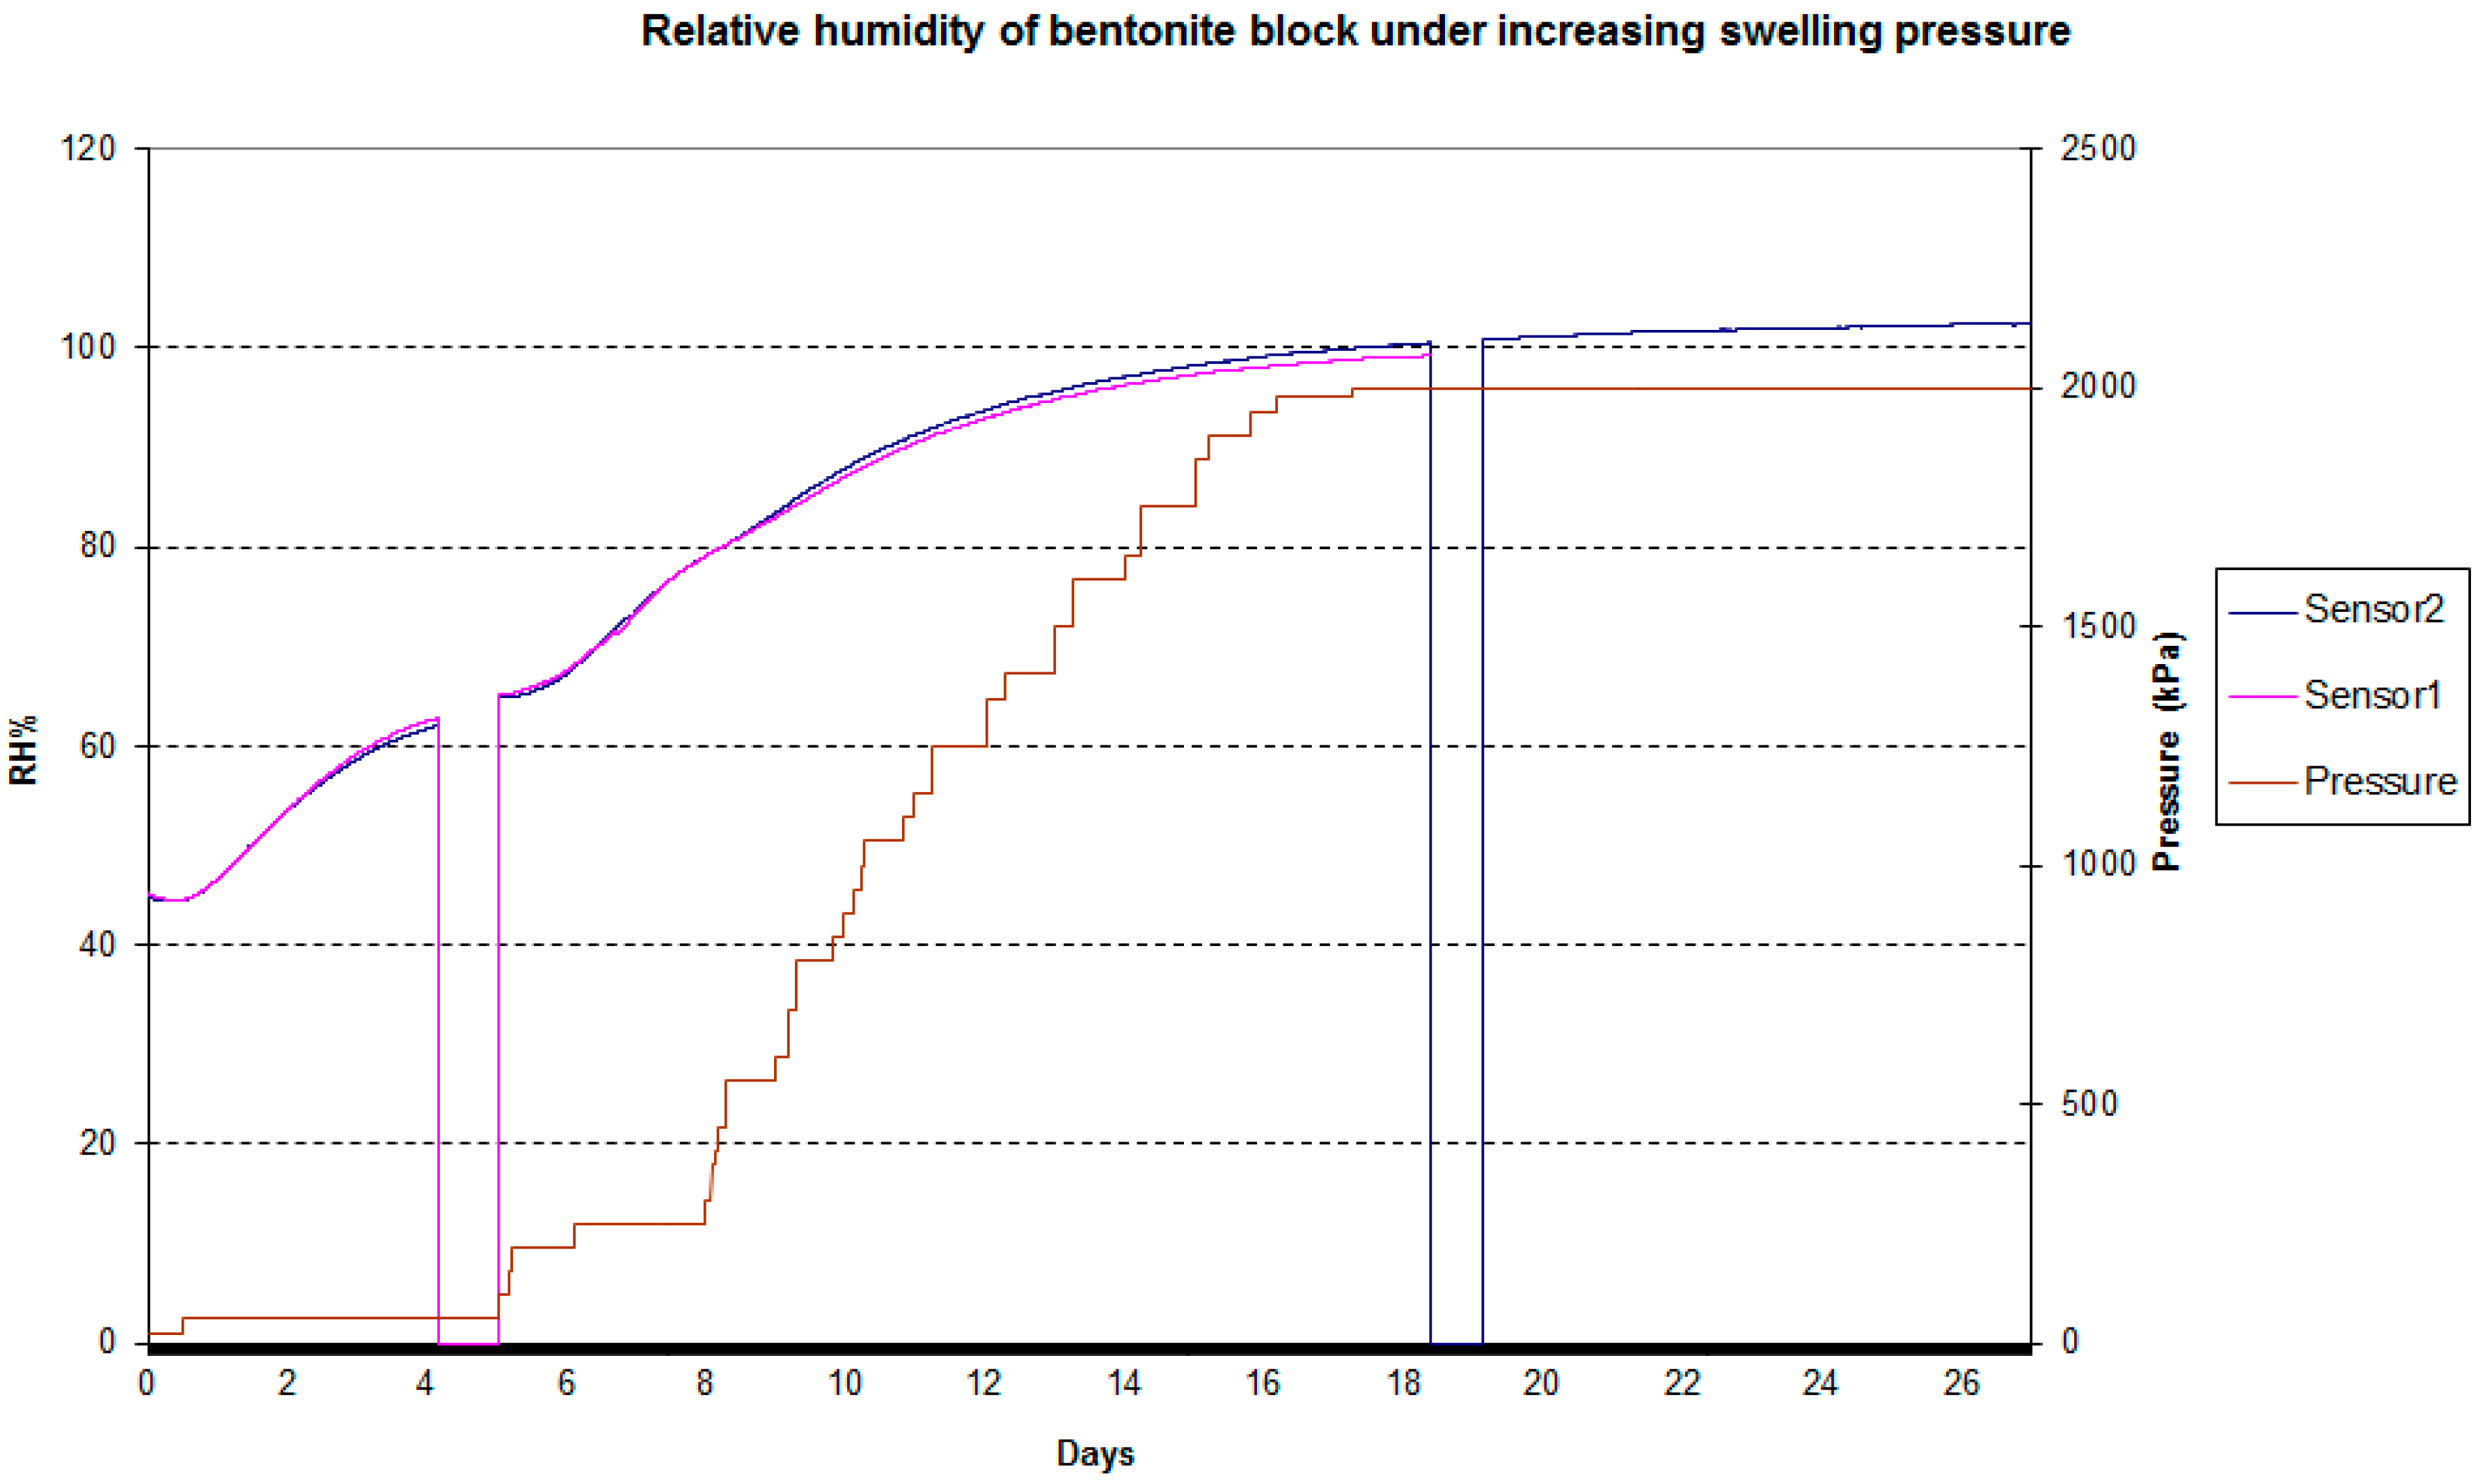
The principal objective of the experiment was to test the mechanical robustness of the RH sensors embedded at the base of the bentonite block under increasing swelling pressure due to hydration of the bentonite block. In order to reach swelling pressures in the range of 2 MPa, the bentonite block must be fully constrained in all directions. As a consequence, the position of the membrane on top of bentonite was kept stationary by continuously increasing the water pressure in the upper reservoir such that the applied pressure on the top of the sample was equal to the swelling pressure generated by the hydrating bentonite. A displacement gauge was placed on top of the oedometer cell. When a displacement was recorded by the displacement gauge, the water pressure controller was manually incremented in a step-wise fashion to restore zero vertical displacement.
Experiment 2 was designed to test the accuracy of the sensing system within the saturated bentonite. There exist several different methods to measure the relative humidity of the water vapour in equilibrium with the bentonite blocks. Besides the installation of a traditional RH sensor at the point of interest (which would disturb the sample and be too large as to be incorporated), it is also possible to measure the RH using a Chilled-Mirror Psychrometer [
12]. The psychrometer used in this experimental programme is a product of Decagon Devices, Inc. (Pullman, WA, USA) and is known as a WP4 Dew Point Potentiameter. Although the psychrometer actually measures the relative humidity RH, the data are displayed in terms of total suction
Ψ according to the psychrometric law:
where
R is the universal gas constant (8.31432 J·mol
−1·K
−1), T is the absolute temperature in Kelvin,
vw0 is the specific volume of water, and
ωv is the molecular mass of water vapor (18.016 g/mol).
uv and
uv0 represent the partial pressure of water vapour and the vapour pressure of water vapour at saturation, respectively. For water vapour at 20 °C, this equation can be simplified to:
where
is given in kPa. This equation was used to derive the relative humidity RH measured in the air surrounding the sample from the value of total suction
Ψ displayed by the instrument.
By comparing the RH measured using a WP4 dewpoint potentiometer with the RH measured by the sensing system, within the same hydrated bentonite block, we can validate the in vivo measurement accuracy of the RH sensor whilst embedded in a bentonite block.
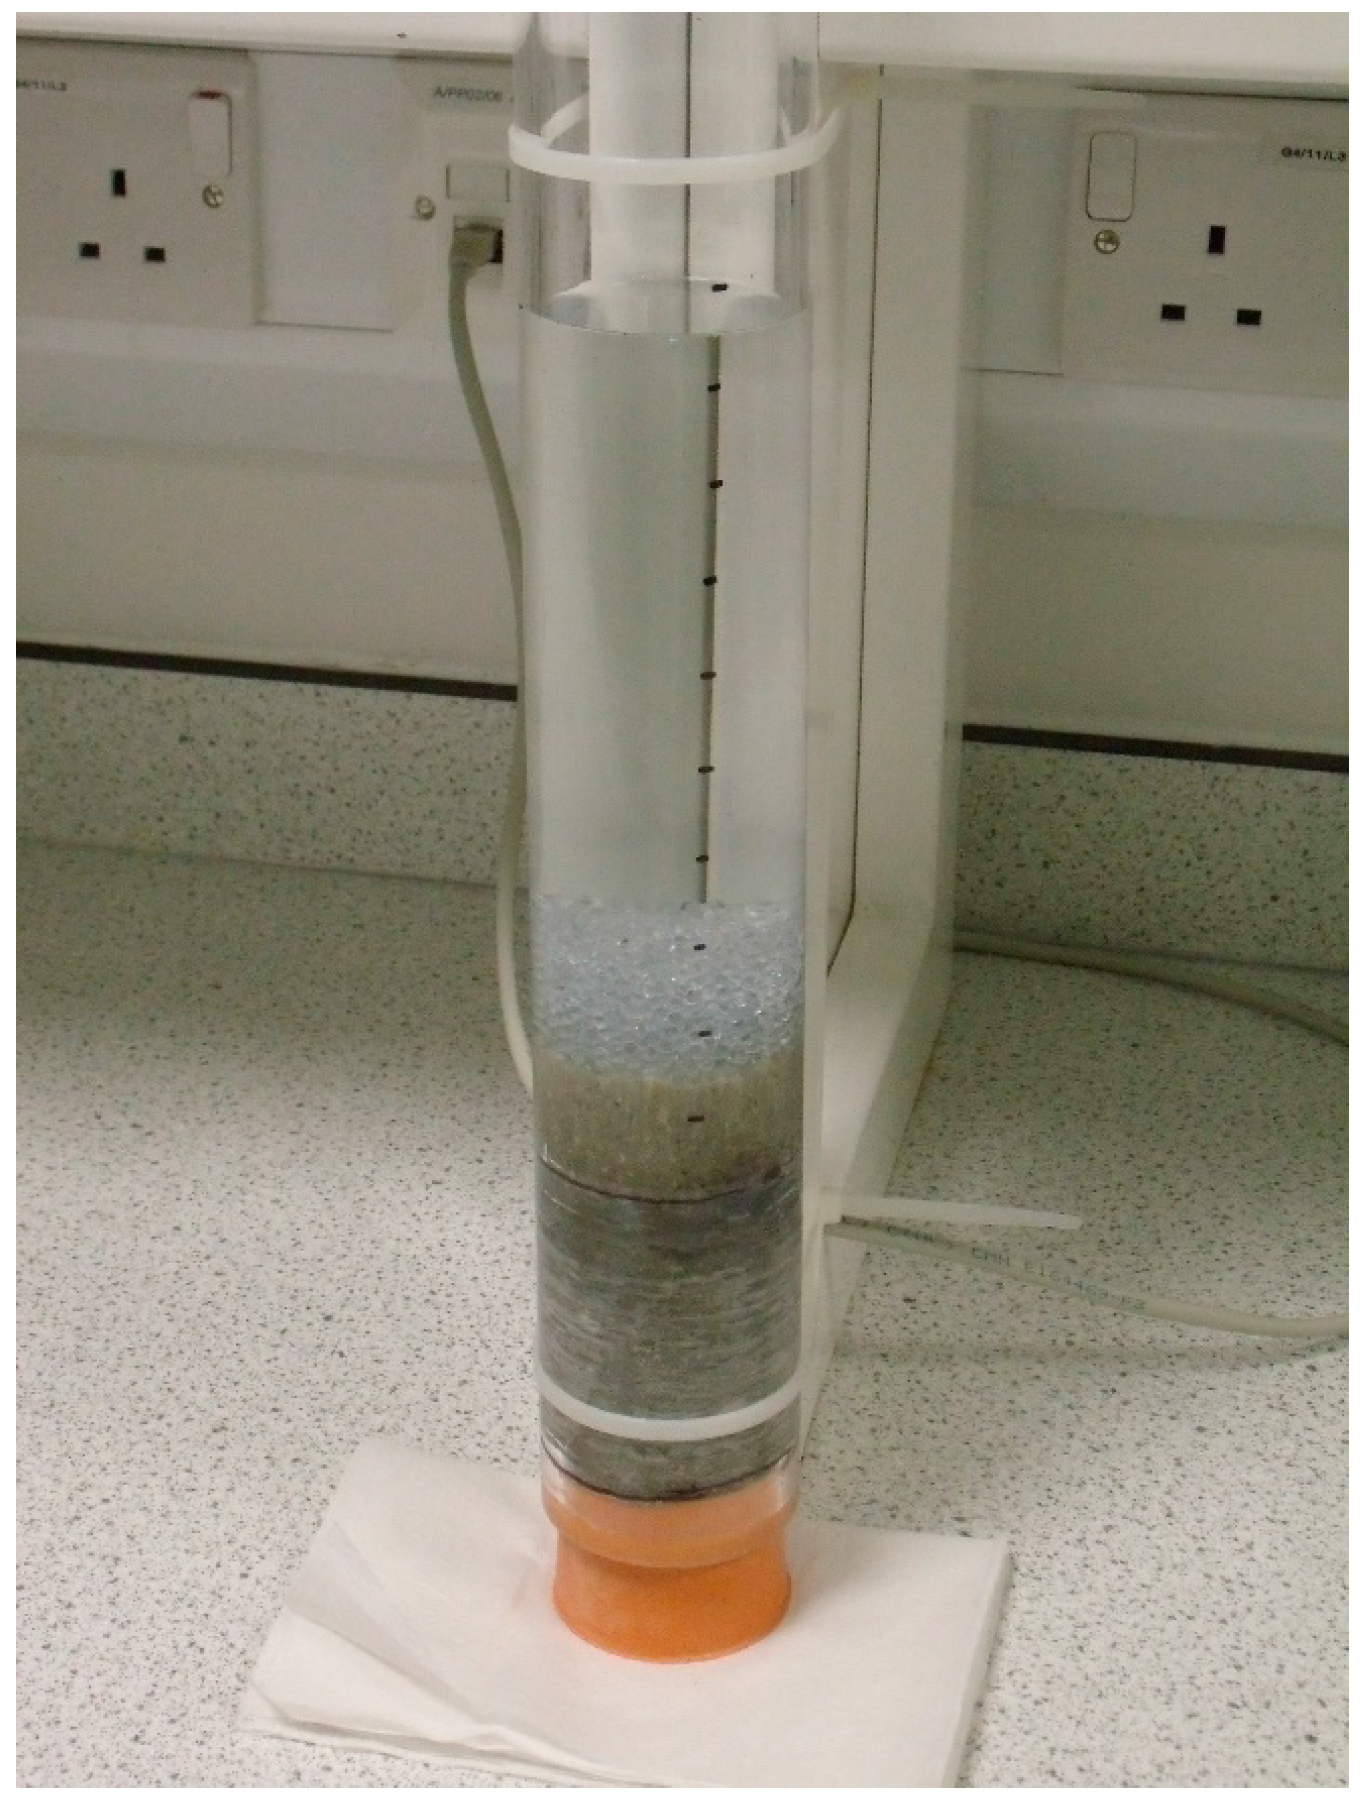
Experiment 2 was carried out using the following steps: an MX-80 bentonite block was first cut and drilled to form a short cylinder with a diameter of 5 cm and a height of approximately 7.5 cm. The bentonite cylinder was then sealed on the sides using an impermeable membrane and fixed to the bottom of a polycarbonate tube, as shown in
Figure 5. The internal diameter of the tube was chosen to be the same as the diameter of the bentonite cylinder, with any remaining void space between the bentonite and the tube wall being filled by the membrane. Water was injected from the top of the tube and was only in contact with the upper surface of the bentonite block. Hence, the hydration of the bentonite block took place gradually from top to bottom, and a gradient of water content along the length of the bentonite cylinder was formed during this hydration process.
The duration of the hydration process varied between tests with a minimum of 7 days and a maximum of 20 days. This was to achieve different water content levels in the bentonite samples such that sensor accuracy could be tested at a range of relative humidity values. The hydrated bentonite block was then removed from the tube and cut into slices approximately 2.5 cm thick. Rectangular cavities were cut into both sides of each 2.5 cm bentonite block to install the RH sensors. The hydrated bentonite block and the sensors were then wrapped using an impermeable membrane to allow for water vapour equilibrium in the air surrounding the sample, as shown in
Figure 6. The RH data was regularly measured by the sensing system over a period of several days until a constant RH was recorded, indicating that (i) uniform distribution of suction was achieved within the bentonite block and (ii) water vapour surrounding the bentonite block achieved equilibrium with suction in the bentonite. The bentonite block was then unsealed and a small sample of each block was immediately put into the WP4. The RH of the sample could be calculated from the displayed value of total suction
Ψ using Equation (2).
4. Discussion
The differences noted between the measurements of the sensing system developed here may be due both to errors in the WP4 measurement and/or the sensor measurement. The WP4 method tends to underestimate relative humidity due to invasion of ambient air into the sealed sample chamber, allowing some evaporation until equilibrium is established [
12]. The WP4 also tends to be inaccurate at RH values close to 100%, when even very small fluctuations of temperature can cause drop condensation in the measurement chamber.
Table 1 suggests the latter error has not been an issue: among the different measurement techniques, the WP4 is perhaps the one that ensures the largest measurement range at high RH values (up to 99.0–99.5%). Other commercial RH sensors, including thermocouple and transistor psychrometers, are characterised by a shorter measurement range (up to 98.5–99.0%) [
13].
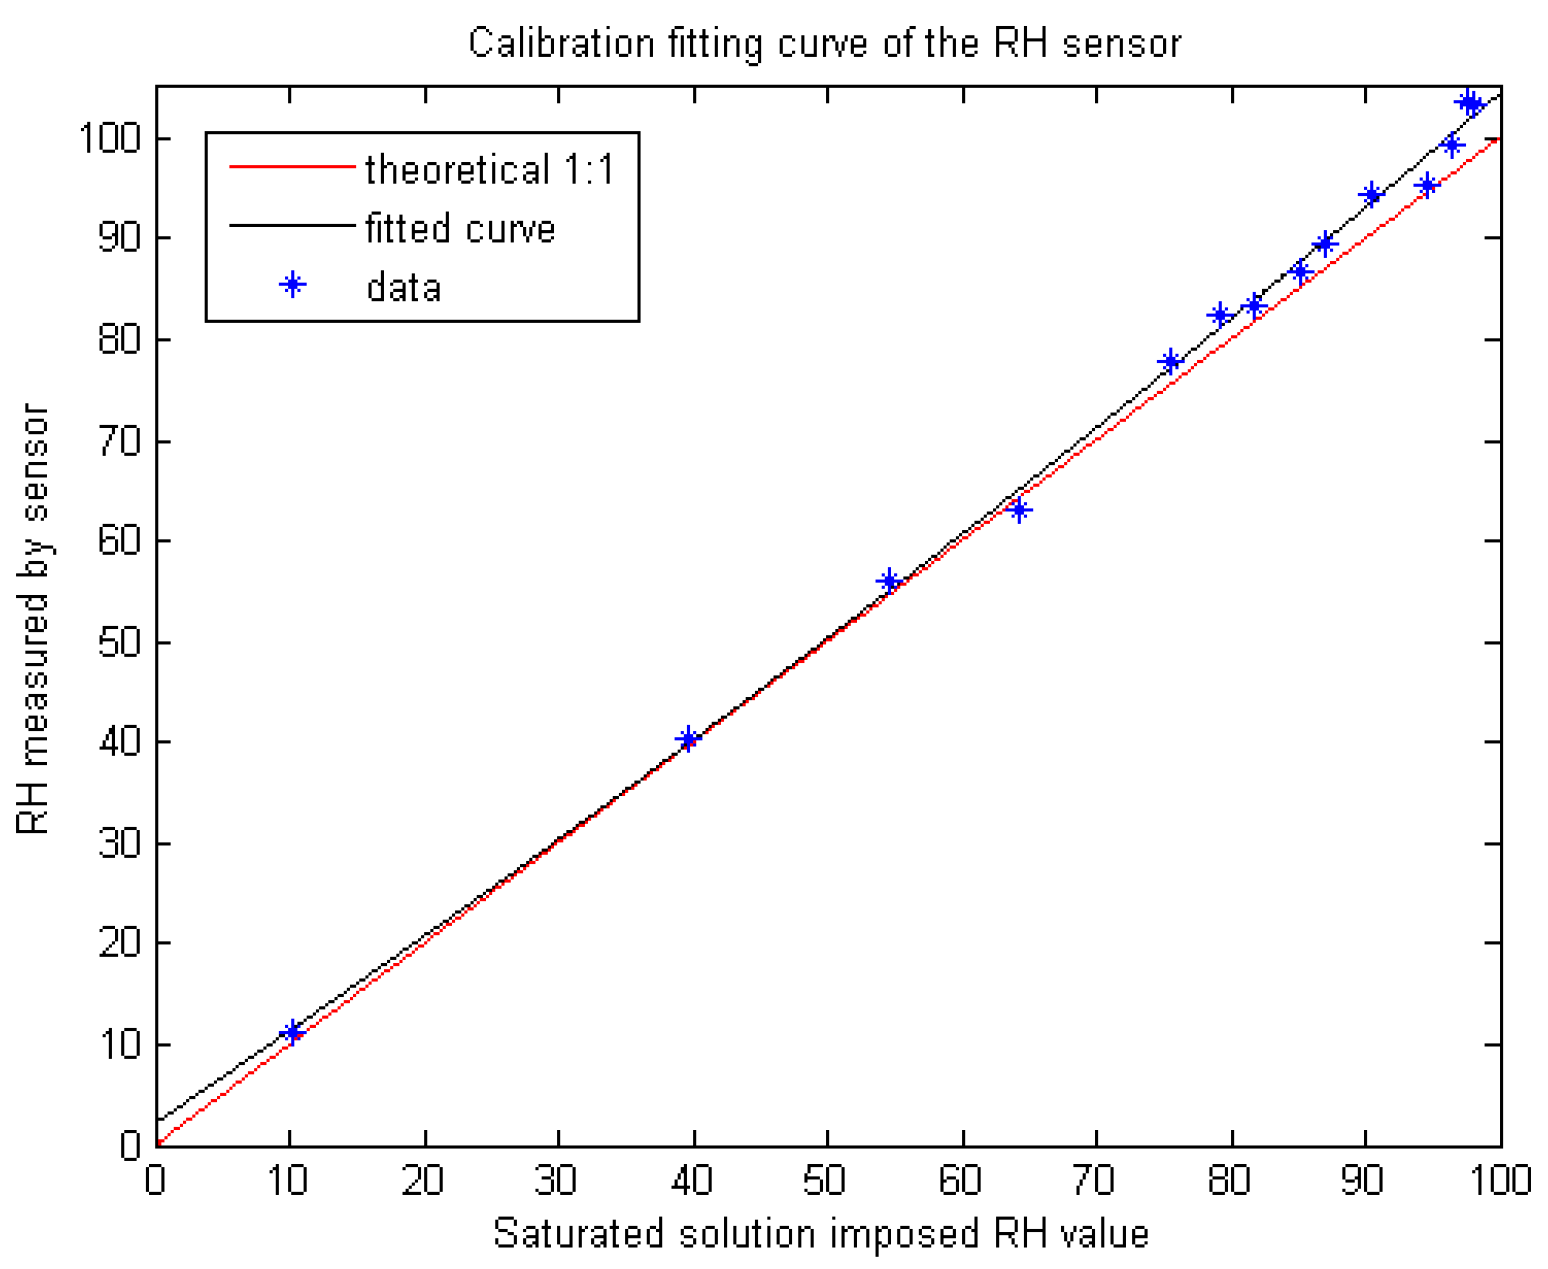
For the case of the RH MEMS sensor tested in this experimental programme, another source of inaccuracy is the non-linearity of the relationship between the air relative humidity and the volumetric water content of the hygroscopic dielectric material placed between the two plates of the capacitive sensor. When relative humidity approaches 100%, the sensing element approaches saturation. As a result, variations in RH generate variations in volumetric water content of the dielectric material that tend to become smaller and smaller as saturation is approached. In turn, variations in capacitance and, hence, electrical signal, tend to become negligible. Since the derivative of the capacitance versus RH function tends to zero as saturation is approached, there is a loss of sensitivity of the instrument close to saturation.
This loss in accuracy associated with the non-linearity of the calibration curve was quantified in [
5] by the use of a variety of saturated chemical solutions, each of which had a different, known saturated relative humidity when placed within a sealed, temperature-controlled environment. Hence, these could be used as accurate reference points without the requirement for any type of sensor. The results of these experiments are reproduced in
Figure 8. Data points lie on the 1:1 line (in red) in the low to medium RH range, but deviate consistently at high RH values. If the relative humidity values returned by the sensor RH are treated as raw sensor data, the sensor can be calibrated using the fitted curve in
Figure 8. An adjusted estimate of the relative humidity RH
A can be from the calibration equation in
Figure 8:
Solving this quadratic equation gives an adjusted value of the measured relative humidity based on the sensor calibration curve, RH
A. The adjusted values for relative humidity RH
A are shown in
Table 2. The difference between the measured value (RH
A) and that derived from the WP4 data has now reduced. The mean of the differences between them is now 1.97% and the discrepancy between the two values for sample number 1, at high humidity, has dropped from 8.1% to 1.9%.
MEMS sensor systems are considerably smaller than traditional monitoring devices, allowing accurate point measurements (as opposed to spatially averaged) and far less physical disturbance to the engineered barrier system within a repository. The results of both Experiment 1 and Experiment 2 described here, show that our MEMs-based sensing system is a promising miniaturised alternative to traditional RH sensors in geological disposal facilities. It is sufficiently robust to withstand at least 2 MPa of swelling pressure and, once calibrated, is capable of accurate RH measurement over the wide range of RH values (20–100%) encountered within an EBS.


