Sea-Air CO2 Exchange in the SW Iberian Upwelling System during Two Contrasting Climate Cycles: 860–780 ka and 630–520 ka


Department of Geology, University of Salamanca, Plaza de los Caídos s/n, 27008 Salamanca, Spain
Geosciences 2018, 8(12), 454; https://doi.org/10.3390/geosciences8120454
Submission received: 4 September 2018
/
Revised: 29 November 2018
/
Accepted: 1 December 2018
/
Published: 4 December 2018
(This article belongs to the Special Issue Ocean-Atmosphere Interaction)
Abstract
:Analysis of planktonic and benthic foraminifers’ accumulation rates from the Iberian margin reveal a substantial change in the biogenic ocean-atmosphere CO2 exchange during the Mid-Pleistocene Transition (MPT; ~800–650 ka from present). Such changes resulted from the major reorganisations in both surface and deep-water circulation that occurred in the North Atlantic at the time, and affected the behaviour of this upwelling region as a CO2 uptake/release area during climate cycles before and after the MPT. During Marine Isotope Stages (MIS) 21-MIS 20 (860–780 ka), this margin acted mostly as an uptake area during interglacials and early glacials. During glacial maxima and terminations it would be neutral because, although surface production and export were very low, carbon storage occurred at the seafloor. During MIS 15-MIS 14 (630–520 ka), the pattern was the opposite, and the Iberian margin worked as a neutral, or as a source area during most interglacials, while during glacials it acted as an important uptake area. Present findings support the idea that glacial/interglacial atmospheric pCO2 oscillations are partly driven by alterations in the meridional overturning circulation that results in substantial variations of the biological pump, and carbon sequestration rate, in some high-productivity regions.
1. Introduction
Variations in biological oceanic processes modify the atmospheric carbon sequestration rate, which has direct implications on climate change. It is known that subpolar oceans, where most of CO2 sink occurs today, registered during the Quaternary episodic release of CO2 to the atmosphere. Carbon sequestration begins with primary production, for example, [1], which occurs in the surface of the oceans but fuels heterotrophic activity from the surface to the seabed. Around 5–15% of the carbon is exported to the depths through mixing, advection, diffusion, passive sinking, and active transport [2,3]. The zooplankton have a significant impact on this biological pump [4]. They consume organic matter and form a biomass that, by vertical migration, will be transported to the aphotic zone, and eventually will end up in the seabed. Here, the organic matter will be remineralized or stored. Besides, vertically migrating zooplankton feed in surface waters but excrete at depth, actively transporting organic material to the meso- and bathypelagic zones. The zooplankton are responsible for up to 70% of the total organic particulate carbon (POC) exports [5,6,7,8].
Local physical dynamics influence the carbon budget. In upwelling margins, offshore transport by upwelling filaments can exceed Ekman transport [9], and the lateral advection increases the carbon export with depth [4,10,11]. Such conditions complicate the reconstruction of past surface processes based on fossil assemblages. In addition, dissolution affects each planktonic group differently. In this line, studies of vertical fluxes of different planktonic groups [11] demonstrated that foraminifers are the least altered group. Foraminifers’ assemblage recorded in sediments is the most similar to the assemblage collected by surface traps, being almost unaffected by lateral advection. Diatoms’ accumulation rate, on the contrary, is four times higher in sediments than in surface traps. Thus, it seems advisable to prioritise foraminifers for studying past variations of the biological pump.
During the Quaternary, the atmospheric pCO2 has oscillated in parallel to glacial/interglacial cycles, glacial values being ~80–100 μatm lower than interglacials ones [12]. The climate phasing underwent a major transition ~800–650 ka ago, changing from 41-ky to 100-ky cycles (MPT) [13], in which the pCO2 was probably involved [14,15]. Of the carbon pools on Earth, the oceanic one is the most likely to be related with these glacial/interglacial atmospheric CO2 variations [16,17]. The returning time of CaCO3 rocks is too slow [18], and the terrestrial biosphere released carbon during glacials [19], the opposite variation to the recorded lowered pCO2.
At present, most of the CO2 sink occurs in the high-latitude ocean, while tropical areas release it [20]. This is related to the lower temperature in the subpolar ocean that enhances gas solubility. Besides, the higher concentration of nutrients in these waters results in increased productivity, and fuels the biological pump. Subarctic oceans record more than twice the POC export compared to oligotrophic, subtropical waters [21]. Nevertheless, measurements of modern sea-air CO2 flux [22] identify other uptake areas, like some continental shelves and upwelling areas. The coastal upwelling west of Iberia is one of these, and registers a sea-air pCO2 difference varying yearly between −20 and −45 µatm (the more negative the value, the higher the CO2 absorption). Recent studies show that some present-day sink areas, like the high-latitude North Atlantic and Pacific, released CO2 in the past during episodes of severe environmental changes, such as hypoxia, increased sea ice formation, or reduced deep-water formation [23,24].
During the Pleistocene, the upwelling region west of Iberia registered severe cooling events that reduced primary and secondary production [25,26,27,28,29]. These events were related to major reorganizations of the Atlantic Meridional Overturning Circulation (AMOC) that occurred as a consequence of deglaciations [30]. Nevertheless, no research has been conducted to explore a potential variation of the sea-air CO2 exchange in upwelling areas, related to the major reorganizations in both surface [31] and deep-water [32] circulation that occurred in the North Atlantic during the Mid-Pleistocene Transition (MPT; ~800–650 ka from present). The objectives of the present work are to explore the potential change in the CO2 flux in the western Iberian margin (Figure 1), and the behaviour of this region as an uptake/release area during climate cycles before/after the MPT. For this, planktonic and benthic foraminifers were studied as indicators of surface productivity, carbon export, and deep-ocean carbon accumulation. The study time-intervals are two climate cycles of contrasting characteristics, before/after the MPT [33,34], Marine Isotope Stages (MIS) 21-20 (860–780 ka) and MIS 15-14 (630–520 ka), (Figure 2) (Appendix A).
2. Material and Methods
2.1. Study Site
The Portugal Current (PC), which is the southward branch of the North Atlantic Current (NAC), dominates the surface circulation in the western Iberian margin [35] (Figure 1). Nevertheless, the seasonal migration of the Azores anticyclone cell and its associated large-scale wind patterns determine important hydrographic variations in the region. During most of the year, coastal convergence conditions prevail, favouring convection of surface waters. This convection can reach depths between 700 m, in the north of the Iberian margin, and less than 200 m towards the south [36]. In summer, the weakening of the Iceland Low Pressure area favours the northward migration of the strengthened Azores high-pressure cell. This results in strong northerlies along west Iberia that induce the upwelling of cold, less salty, and nutrient-rich sub-surface waters [36]. Upwelled waters form an averaged 50 km-wide band along the coast, with extensions and filaments that penetrate more than 200 km offshore [37].
The deep mass of water in the site is the North Atlantic Deep Water (NADW). It flows between ~2200 and ~4000 m depth, above the Antarctic Bottom Water (AABW) [38].
The study site IODP-U1385 (37°34.284′ N, 10°7.562′ W; 2589 m water depth) is located within the upwelling band in surface. Although during interglacials the deep mass of water is the NADW, it is substituted by AABW during glacials (Figure 2). This substitution is due to the decrease in the NADW formation that occurs during glacial stages. Sediments consist on hemipelagic calcareous muds and calcareous clays. Biogenic carbonate ranges between 23–39%, due to enhanced terrigenous input during glacials [39].
2.2. Sediment Data and Calculations
This study uses 105 samples from the sections 65.7–76.9 and 91.3–99.3 crmcd (corrected revised meters of composite depth [45]), providing a 1.75-ky-resolution record. One-cm-thick samples were freeze-dried, weighted, and sieved to obtain the >150 μm fraction. This fraction was split into aliquots containing, at least, 300 planktonic foraminifer specimens. One of these aliquots was used to identify planktonic foraminifer taxa, as described in [46], and to count total benthic foraminifers.
Planktonic and benthic foraminifers’ accumulation rates were calculated by multiplying the accumulation of foraminifers (number of tests/g of dry sediment) by the accumulation rate of the sediment (g of dry sediment/cm2 ky). The Planktonic foraminiferal Accumulation Rate (PAR) is a measure of the secondary surface production and the carbon export. Accordingly, it can be used to indicate effective CO2 uptake. That is, the CO2 that is not only absorbed at surface, but also pumped to depths. The Benthic foraminifer Accumulation Rate (BAR) can be considered an index for the amount of organic carbon delivered to the bottom and, thus, for the potential CO2 sequestration and re-mineralization in the seafloor. This correlation is based in the knowledge that high densities of benthic foraminifers are related with high organic carbon supply to the seafloor [28,47,48]. The comparison between the PAR and the BAR allows the evaluation of both the CO2 export in surface, and its storage at the bottom, that is, the effective carbon sequestration in this area.
The Annual Sea Surface Temperature (SST) was reconstructed by the artificial neural network method [49], using the MARGO North Atlantic database [50].
The age model follows the oxygen isotope stratigraphy [41]. This is based on the correlation of the benthic δ18O record from site U1385 with the global benthic LR04 isotope stack. This stack is a composite of 57 benthic δ18O records distributed globally, and it is tuned to an ice model, and to orbital parameters to provide an age model for the Plio-Pleistocene [43].
3. Results
3.1. Surface Production and Export
For the whole study-interval, low PAR coincided mostly with low, or sharply decreasing SST. Nevertheless, there is no correlation in magnitude, as the lowest PAR did not correspond to the lowest SST (Figure 3c,d,g,h). Substantially reduced PAR coincided better with rapidly increased levels of AABW in the area, as indicated by sharp descents in the δ13C record (Figure 3a,b).
During MIS 21–20, PAR oscillated between 695–42,190 test·cm−2 ky−1. The most prolonged interval below 10,000 test·cm−2 ky−1 coincided with MIS 20 glacial maximum and T IX (Figure 3d). Contrary to this, through the sixth climate cycle, PAR was generally low during interglacial MIS 15, increased progressively since the glacial inception, and reached very high values during glacial MIS 14 (mostly above 10,000 and reaching 48,506) (Figure 3c). PAR was much higher during MIS 14 than during MIS 20.
3.2. Organic Matter Reaching the Seafloor
The BAR ranges between 73–1214 test·cm−2 ky−1 during MIS 21–20, and between 12.5–1900 test·cm−2 ky−1 through MIS 15–14 (Figure 3e,f). Interglacial MIS 21 registered substantially higher BAR than the younger interglacial MIS 15. The comparison between glacials offers the opposite record, BAR being three times higher during MIS 14 than during the older glacial MIS 20.
The benthic record is similar to the planktonic one; low BAR mostly coinciding with low-PAR intervals, although the magnitude of variations changes (Figure 3c,f). This correspondence of BAR with the PAR record is expectably, considering that benthic communities depend on the carbon export from surface e.g., [28,53,54]. Nevertheless, there are remarkable differences between both records at some times, and low BAR coincided with higher PAR. Some of these are the interval 858–847 ka, at 803 ka, and at 798 ka (Figure 3d,f)
4. Discussion
4.1. Carbon Cycle Dynamics during MIS 21-MIS 20 (860–780 ka)
During this climate cycle, deep-cooling episodes occurred that were related to Heinrich-type events [30]. It should be expected that such events would modify the structure of surface ecosystems and result in decreased production, which, in consequence, should have reduced the effective absorption of CO2. This is what happened during other, more recent Heinrich events, for examples see [27,28]. Nevertheless, during MIS 21-20 the lowest PAR did not correspond to the coldest SST (Figure 3d,h), which suggests another cause contributed to reduce production.
It is known that during this cycle the NADW formation was very weak [32], which favoured the presence of AABW in site U1385 [31], as the low δ13C indicates (Figure 3b). Episodes of sharp and severe weakening of the AMOC would have driven lowered production, and carbon export, in the Iberian upwelling system during MIS 21-20. A weak AMOC means a weak surface and subsurface circulation, which maintain the nutrient stream that allows to sustain the levels of biological productivity over long timescales. This would decrease the nutrient availability in surface waters and, consequently, diminish primary production and the subsequent carbon export (PAR). This interpretation is corroborated by the coincidence of drops in PAR with rapid rises of AABW in the area (Figure 3b,d). The most prolonged interval of reduced production and, thus, of reduced biological CO2 absorption, occurred during MIS 20 glacial maximum and T IX (Figure 3d), when surface circulation in the North Atlantic almost collapsed [31].
The presence of the oxygen-poor AABW in depth is favourable to the accumulation of organic matter in the sediment. In this scenario, the benthic community is not able to consume all of it and storage of organic carbon occurs [28]. Therefore, if a high amount of organic carbon reaches the poorly ventilated bottom, it will result in the impoverishment of the benthic habitat [54,55], and in the enhancement of carbon sequestration. This is probably what happened during 803 and 798 ka (Figure 3b,d). The high surface absorption and export of CO2, combined with very low oxidation of organic matter at the bottom, would outcome in very high carbon sequestration rates. At these times the southwest Iberian margin would have acted as an intense CO2 uptake area.
The opposite would happen when the deep mass of water was the more ventilated NADW. Oxidising conditions at sea floor would deplete the organic matter at disposal for benthic communities, and prevent carbon sequestration. Besides, in areas like the study site, the CO2 resulting from oxidation is easily upwelled and, if not absorbed by the planktonic community, outgassed. This is what could have happened during the prolonged interval 858–847 ka (Figure 3b,d), when oxidising conditions at the bottom coincided with relatively low biological pump in surface waters, as informed by PAR. In consequence, little carbon sequestration, or even CO2 release to the atmosphere, would have occurred in the southwest Iberian margin during the early MIS 21; with the exception at 852 ka, that registered an episode of high biological pump (Figure 3d,f).
4.2. Carbon Cycle Dynamics during MIS 15-MIS 14 (630–520 ka)
During MIS 15 and early MIS 14, the effective biological absorption and export of CO2 in the study area was generally lower than during MIS 21, as indicated by more prolonged intervals of very low PAR (Figure 3c). The repeated and rapid advection of very low-salinity, and cold subpolar water to the area at the time [26,30] would have been responsible of this. Although SST was not so low as to cause drastic decrease in production (Figure 3g), sudden changes in salinity modify severely the structure of surface ecosystems and result in drops in production [25,26,27,28,29].
The little amount of organic matter that reached the bottom would rapidly oxidise, in contact with the highly oxygenated NADW that bathed the seafloor at U1385 depths during most of MIS 15 (Figure 3a). Therefore, the availability of food for benthic communities was very scarce, according to the low BAR (Figure 3e), and no carbon could be remineralized nor stored at the time. Besides, it is very probable that upwelled waters brought to surface additional CO2 that did not enter the biological pump, as very low PAR suggests. In consequence, the southwest Iberian margin, an area of CO2 uptake today [22], would have worked mostly as a CO2 source during 618–564 ka.
The biological pump reactivated considerably off Iberia during MIS 14 (Figure 3c,e). Still, pronounced reductions of carbon export were related with rapid weakening of the AMOC, evidenced by rapid substitutions of NADW by AABW in the study site. During the last climate cycle, episodic releases of CO2 happened in the subpolar North Atlantic and North Pacific, both of them areas of intense CO2 uptake today. It is thought that, at that time, they contributed to increasing the atmospheric pCO2 [23,24]. Weakened surface-water sinking-rate has been argued as a cause for such episodes. Nevertheless, during MIS 14, only the episode of weakened NADW formation at ~556 coincided with a substantial pCO2 increase (Figure 3a,i), which suggests that only AMOC alterations of particular magnitude have an influence in the global CO2 balance. In summary, the southwest Iberian margin acted mostly as an intense CO2 uptake area during most of glacial MIS 14, contrary to what happened during interglacial MIS 15, and also during the previous glacial MIS 20 (Figure 3c,f).
T VI registered a lesser, and more gradual, increase of pCO2 and pCH4 than both T IX, and the partial deglaciation at 580 ka (Figure 3i,j). This could have been related to a change in the biological pump and carbon sequestration rates in some high-productivity regions, like the Iberian upwelling.
4.3. CO2 Uptake/Release Variation in Relation with Changes of the North Atlantic Circulation during the MPT
Increased biological pump as consequence of enhanced supply of land-derived nutrients, during glacials, has been postulated as partly accounting for glacial/interglacial atmospheric pCO2 oscillations [56,57]; another potential driver being the drastic rearrangement of ocean circulation that happened at deglaciations [58]. Kohfeld et al. [59] observed that the export-production during the last glacial maximum was higher than during the Holocene and the previous interglacial, both in the global ocean and in the west Iberian margin. Here, greater biological pump activity was also recorded during glacial MIS 12, respect to interglacials MIS 13 and MIS 11 [29]. Nevertheless, the present work shows that the export-production did not keep the same pattern throughout the whole Pleistocene, at least not in this region. While in the MIS 15-MIS14 climate cycle the export-production off west Iberia varied similarly to the younger cycles, during MIS 21-MIS 20 its variation was the opposite. That is, higher export-production during most of the interglacial than during the glacial maximum (Figure 3c,d). This dissimilar behaviour suggests that variations of export-production off Iberia were not related with changes in the land-derived nutrient supply. The ice volume was larger in MIS 20 than in MIS 14, according to δ18O values (Figure 2a,b). Thus, the nutrient supply should also have been greater—but the export-production was much lesser.
During MIS 16 (678–620 ka; Appendix A), an important reorganisation of the surface circulation occurred in the North Atlantic that severely affected the oceanography off Iberia, especially during glacial stages [31]. In glacials previous to MIS 16, the North Atlantic surface and subsurface circulation drastically weakened. This reduced the nutrient stream along the Iberian margin, and the nutrient availability in surface, resulting in decreased primary and secondary production. Contrary to this, in glacials after MIS 16, the surface and subsurface circulation remained very strong in the North Atlantic, which favoured much higher primary and secondary production off Iberia (Figure 3c,d).
If the mid-Pleistocene rearrangement of the North Atlantic surface circulation [31] was responsible for the change of pattern in the southwest Iberian margin CO2 absorption and export, the intensification of NADW formation, which also happened at the time, can account for variations in the carbon remineralisation and storage at the bottom. During interglacials previous to MIS 17 (710–678 ka; Appendix A), the oxygen-depleted AABW occupied the abyssal mid-latitude North Atlantic [32], which favoured the storage of whatever organic matter that reached the seafloor. Since MIS 17, on the other hand, the highly ventilated NADW spread throughout the abyssal North Atlantic, especially during interglacials (Figure 3a,b). This mass of water rapidly oxidised the organic matter that reached the bottom, which resulted in null carbon sequestration. Only during glacials, when the NADW formation weakened, the AABW advanced northward, oxidation decreased, and carbon storage resumed in the Iberian upwelling margin (Figure 3a,b,e,f).
The combined effects of variations in the biological absorption of CO2 in surface waters, and the carbon storage in depth resulted in a substantial change of pattern of the sea-air CO2 exchange off Iberia, during climate cycles before/after the MPT. Before the MPT, the west Iberian margin acted mostly as a CO2 uptake area during interglacials and early glacials. Conversely, during glacial maxima and terminations it would be neutral, as surface production and export were very low but carbon storage occurred in the bottom. After the MPT the pattern switched, the Iberian margin worked as a neutral, or as a source area during most of interglacials, and as an important uptake area during glacials (Figure 3c–f).
5. Conclusions
One of the most widely accepted explanations for the glacial/interglacial oscillation of the atmospheric pCO2 is an enhancement of the biological pump during glacials, which would result from an increased supply of land-derived nutrients [56,57]. Another cause could have been the drastic change in the ocean circulation that happened during deglaciations [58]. On the other hand, it has been demonstrated that a major reorganisation of the AMOC occurred during the MPT (~800–600 ka) that severely affected the North Atlantic basin, especially during glacials [31,32]. The present study, conducted in the Iberian upwelling system, supports the idea that glacial/interglacial atmospheric pCO2 oscillations are not mainly driven by variations in the supply of land-derived nutrients. Results show that AMOC changes caused substantial variations in the biological pump and carbon sequestration rates off Iberia. These variations resulted in shifts of the ocean-atmosphere gas balance in this upwelling region, and could also have happened in other high-productivity regions.
The AMOC changes that occurred during the MPT affected the sea-air CO2 exchange in the southwest Iberian upwelling area, and altered its behaviour as a CO2 uptake/release area during climate cycles before and after the MPT. Before the MPT, the west Iberian margin acted mostly as an uptake area during interglacials and early glacials. During glacial maxima and terminations it would be neutral because, although the surface production and export were very low, carbon storage occurred at the seafloor. After the MPT, the pattern switched and the Iberian margin worked as a neutral, or as a source area during most of interglacials, while during glacials it acted as an important uptake area.
Through the MIS 21-MIS 20 climate cycle (860–780 ka), frequent episodes of weak surface circulation in the North Atlantic affected the Iberian margin by reducing the mixing of water, and the nutrient availability in surface. This resulted in diminished primary production and carbon export. In consequence, biological CO2 absorption in the area decreased substantially during such episodes. The most prolonged of these encompassed MIS 20 glacial maximum and T IX, when surface circulation in the North Atlantic almost collapsed. Nevertheless, the very low rate of NADW formation at that time favoured the presence of the poorly oxygenated AABW well above 2590 m in the Iberian margin, which resulted in little respiration of the organic matter and its storage at the seafloor.
Through MIS 15, the biological absorption of CO2 in the study area was generally lower than during MIS 21, as a consequence of the frequent advection of low-salinity and cold subpolar water, which disturbed the planktonic ecosystem. Besides, the strong AMOC induced the presence of the highly ventilated NADW at the site bottom during most of the interglacial, which would have oxidised all the organic matter reaching the seafloor. As a result, this area probably released CO2 during prolonged intervals between 618 and 579 ka. Contrary to this, during MIS 14 and other glacials since MIS 16, the strong surface circulation in the North Atlantic maintained a relatively deep column of mixed surface-water off Iberia. This favoured much higher primary and secondary production. As a consequence, the absorption of atmospheric CO2 through glacials after the MPT was much higher than during previous glacials. Carbon storage at the seafloor also increased during MIS 14 and younger glacials. It was the aftermath of the decreased ventilation that was associated with the weakening of the AMOC during glacial periods.
Funding
This research received no external funding
Acknowledgments
I want to acknowledge the Integrated Ocean Drilling Program (IODP) for providing the sediment samples, and also the useful comments and suggestions from three anonymous referees that greatly contributed to improve the present manuscript.
Appendix A
Distribution of climate cycles, Marine Isotope Stages (MIS), and Terminations (T) of middle and late Pleistocene [60].
| Age (ka) | Climate Cycle | Age (ka) | Climate Cycle | ||||
| MIS 1 | 430 | MIS 12 | T V | 5th | |||
| 12 | MIS 2 | T I | 1st | 478 | MIS 13 | ||
| 35 | MIS 3 | 532 | MIS 14 | T VI | 6th | ||
| 58 | MIS 4 | 564 | MIS 15 | ||||
| 72 | MIS 5 | 620 | MIS 16 | T VII | 7th | ||
| 130 | MIS 6 | T II | 2nd | 678 | MIS 17 | ||
| 190 | MIS 7 | 710 | MIS 18 | T VIII | 8th | ||
| 243 | MIS 8 | T III | 3rd | 758 | MIS 19 | ||
| 280 | MIS 9 | 785 | MIS 20 | T IX | 9th | ||
| 338 | MIS 10 | T IV | 4th | 812 | MIS 21 | ||
| 366 | MIS 11 | 865 | T X |
References
- Berger, W.H.; Fischer, K.; Lai, C.; Wu, G. Ocean Productivity and Organic Carbon Flux. Part. 1. Overview and Maps of Primary Production and Export Production; University of California: San Diego, CA, USA, 1987. [Google Scholar]
- Laws, E.A.; Falkowski, P.G.; Smith, W.O.J.; Ducklow, H.; McCarthy, J.J. Temperature effects on export production in the open ocean. Glob. Biogeochem. Cycles 2000, 14, 1231–1246. [Google Scholar] [CrossRef] [Green Version]
- Henson, S.A.; Sanders, R.; Madsen, E.; Morris, P.J.; Le Moigne, F.; Quartly, G.D.S. A reduced estimate of the strength of the ocean’s biological carbon pump. Geophys. Res. Lett. 2011, 38, L04606. [Google Scholar] [CrossRef]
- Honjo, S.; Manganini, S.J.; Krishfield, R.A.; Francois, R. Particulate organic carbon fluxes to the ocean interior and factors controlling the biological pump: A synthesis of global sediment trap programs since 1983. Prog. Ocean. 2008, 76, 217–285. [Google Scholar] [CrossRef]
- Longhurst, A.R.; Bedo, A.W.; Harrison, W.G.; Head, E.J.H.; Sameoto, D.D. Vertical flux of respiratory carbon by oceanic diel migrant biota. Deep-Sea Res. 1990, 37, 685–694. [Google Scholar] [CrossRef]
- Al-Mutairi, H.; Landry, M.R. Active export of carbon and nitrogen at Station ALOHA by diel migrant zooplankton. Deep-Sea Res. II 2001, 48, 2083–2103. [Google Scholar] [CrossRef]
- Steinberg, D.K.; Carlson, C.A.; Bates, N.R.; Goldthwait, S.A.; Madin, L.P.; Michaels, A.F. Zooplankton vertical migration and the active transport of dissolved organic and inorganic carbon in the Sargasso Sea. Deep-Sea Res. I 2000, 47, 137–158. [Google Scholar] [CrossRef]
- Steinberg, D.K.; Van Mooy, B.A.S.; Buesseler, K.P.; Boyd, P.W.; Kobari, T.; Karl, D.M. Bacterial vs. zooplankton control of sinking particle flux in the ocean’s twilight zone. Limnol. Oceanogr. 2008, 53, 1327–1338. [Google Scholar] [CrossRef]
- Álvarez-Salgado, X.A.; Arístegui, J.; Barton, E.D.; Hansell, D.A. Contribution of upwelling filaments to offshore carbon export in the subtropical Northeast Atlantic Ocean. Limnol. Oceanogr. 2007, 52, 1287–1292. [Google Scholar] [CrossRef] [Green Version]
- Neuer, S.; Ratmeyer, V.; Davenport, R.; Fisher, G.; Wefer, G. Deep water particle flux in the Canary Island region: Seasonal trends in relation to long-term satellite derived pigment data and lateral sources. Deep-Sea Res. 1997, 44, 1451–1466. [Google Scholar] [CrossRef]
- Abrantes, F.; Meggers, H.; Nave, S.; Bollman, J.; Palma, S.; Sprengel, C.; Henderiks, J.; Spies, A.; Salgueiro, E.; Moita, T.; et al. Fluxes of micro-organisms along a productivity gradient in the Canary Islands region (29° N): Implications for paleoreconstructions. Deep-Sea Res. II 2002, 49, 3599–3629. [Google Scholar] [CrossRef]
- Petit, J.R.; Jouzel, J.; Raynaud, D.; Barkov, N.I.; Barnola, J.M.; Basile, I.; Bender, M.; Chappellaz, J.; Davis, M.; Delaygue, G.; et al. Climate and atmospheric history of the past 420,000 years from the Vostok ice core, Antarctica. Nature 1999, 399, 429–436. [Google Scholar] [CrossRef]
- Imbrie, J.; Berger, A.; Boyle, E.A.; Clemens, S.C.; Duffy, A.; Howard, W.R.; Kukla, G.; Kutzbach, J.; Martinson, D.G.; Mcintyre, A.; et al. On the structure and origin of major glaciation cycles: 2. The 100,000-year cycle. Paleoceanography 1993, 8, 699–735. [Google Scholar] [CrossRef]
- Ruddiman, W.F. Orbital insolation, ice volume and greenhouse gases. Quat. Sci. Rev. 2003, 22, 1597–1629. [Google Scholar] [CrossRef]
- Ruddiman, W.F. Ice-driven CO2 feedback on ice volume. Clim. Past 2006, 2, 43–55. [Google Scholar] [CrossRef]
- Broecker, W.S. Glacial to interglacial changes in ocean chemistry. Progr. Oceanogr. 1982, 2, 151–197. [Google Scholar] [CrossRef]
- Sigman, D.M.; Boyle, E.A. Glacial/interglacial variations in atmospheric carbon dioxide. Nature 2000, 407, 859–869. [Google Scholar] [CrossRef] [PubMed]
- Berner, R.A.; Lasaga, A.C.; Garrels, R.M. The carbonate-silicate geochemical cycle and its effect on atmospheric carbon dioxide over the past 100 million years. Am. J. Sci. 1983, 283, 641–683. [Google Scholar] [CrossRef]
- Archer, D.E.; Winguth, A.; Lea, D.; Mahowald, N. What caused the Glacial/Interglacial atmospheric pCO2 cycles? Rev. Geophys. 2000, 38, 159–189. [Google Scholar]
- Archer, D.E.; Eshel, G.; Winguth, A.; Broecker, W.; Pierrehumbert, R.; Tobis, M.; Jacob, R. Atmospheric pCO2 sensitivity to the biological pump in the ocean. Glob. Biogeochem. Cycl. 2000, 14, 1219–1230. [Google Scholar] [CrossRef]
- Buesseler, K.O.; Lamborg, C.H.; Boyd, P.W.; Lam, P.J.; Trull, T.W.; Bidigare, R.R.; Bishop, J.K.; Casciotti, K.L.; Dehairs, F.; Elskens, M.; et al. Revisiting Carbon Flux through the Ocean’s Twilight Zone. Science 2007, 316, 567. [Google Scholar] [CrossRef]
- Takahashi, T.; Sutherland, S.C.; Wanninkhof, R.; Sweeney, C.; Feely, R.A.; Chipman, D.W.; Hales, B.; Friederich, G.; Chavez, F.; Sabine, C.; et al. Climatological mean and decadal change in surface ocean pCO2, and net sea–air CO2 flux over the global oceans. Deep-Sea Res. Part II Top. Stud. Oceanogr. 2009, 56, 554–577. [Google Scholar] [CrossRef] [Green Version]
- Ezat, M.M.; Rasmussen, T.; Hoönisch, B.; Groeneveld, J.; de Menocal, P. Episodic release of CO2 from the high-latitude North Atlantic Ocean during the last 135 kyr. Nat. Commun. 2017, 8, 14498. [Google Scholar] [CrossRef] [PubMed]
- Gray, W.R.; Rae, J.W.B.; Wills, R.C.J.; Shevenell, A.E.; Taylor, B.; Burke, A.; Foster, G.L.; Lear, C.H. Deglacial upwelling, productivity and CO2 outgassing in the North Pacific Ocean. Nat. Geosci. 2018, 11, 340–344. [Google Scholar] [CrossRef]
- De Abreu, L.; Shackleton, N.J.; Schönfeld, J.; Hall, M.A.; Chapman, M. Millennial-scale oceanic climate variability off the western Iberian margin during the last two glacial periods. Mar. Geol. 2003, 196, 1–20. [Google Scholar] [CrossRef]
- Rodrigues, T.; Voelker, A.H.L.; Grimalt, J.O.; Abrantes, F.; Naughton, F. Iberian Margin sea surface temperature during MIS15 to 9 (580–300 ka): Glacial suborbital variability versus interglacial stability. Paleoceanography 2011, 26, 1–16. [Google Scholar] [CrossRef]
- Amore, F.O.; Flores, J.A.; Voelker, A.H.L.; Lebreiro, S.M.; Palumbo, E.; Sierro, F.J. A Middle Pleistocene Northeast Atlantic coccolithophore record: Paleoclimatology and paleoproductivity aspects. Mar. Micropaleontol. 2012, 90–91, 44–59. [Google Scholar] [CrossRef]
- Martin-Garcia, G.M. Environmental Variations in the North. Atlantic in Response to Quaternary Glaciations; Nova Science Pub. Inc.: New York, NY, USA, 2018; 139p. [Google Scholar]
- Martin-Garcia, G.M. Changes in carbon cycle dynamics associated to rapid cooling events in the Northeast Atlantic upwelling region during 530–400 ka (MIS13-11). Env. Res. Lett. 2018. under review. [Google Scholar]
- Martin-Garcia, G.M.; Alonso-Garcia, M.; Sierro, F.J.; Hodell, D.A.; Flores, J.A. Severe cooling episodes at the onset of deglaciations on the Southwestern Iberian margin from MIS 21 to 13 (IODP site U1385). Glob. Planet. Chang. 2015, 135, 159–169. [Google Scholar] [CrossRef]
- Martin-Garcia, G.M.; Sierro, F.J.; Flores, J.A.; Abrantes, F. Change in the North Atlantic circulation associated with the mid-Pleistocene transition. Clim. Past 2018, 14, 1–12. [Google Scholar] [CrossRef]
- Poirier, R.K.; Billups, K. The intensification of northern component deepwater formation during the mid-Pleistocene climate transition. Paleoceanography 2014, 29, 1046–1061. [Google Scholar] [CrossRef] [Green Version]
- Lisiecki, L.E.; Raymo, M.E. Plio-Pleostocene climate evolution: Trends and transitions in glacial cycle dynamics. Quat. Sci. Rev. 2007, 26, 56–69. [Google Scholar] [CrossRef]
- Lang, N.; Wolff, E.W. Interglacial and glacial variability from the last 800 ka in marine, ice and terrestrial archives. Clim. Past 2011, 7, 361–380. [Google Scholar] [CrossRef] [Green Version]
- Peliz, A.; Dubert, J.; Santos, A.M.P.; Oliveira, P.B.; Le Cann, B. Winter upper ocean circulation in the Western Iberian Basin—Fronts, eddies and poleward flows: An overview. Deep Sea Res. Part. I Oceanogr. Res. Pap. 2005, 52, 621–646. [Google Scholar] [CrossRef]
- Fiúza, A.F.G.; Macedo, V.E.; Guerreiro, M.R. Climatological space and time variation of the Portuguese coastal upwelling. Oceanol. Acta 1982, 5, 31–40. [Google Scholar]
- Sousa, J.M.; Bricaud, A. Satellite-derived phytoplankton pigment structures in the Portuguese upwelling area. J. Geophys. Res. 1992, 97, 11343–11356. [Google Scholar] [CrossRef]
- Hernández-Molina, F.J.; Serra, N.; Stow, D.A.V.; Llave, E.; Ercilla, G.; Van Rooij, D. Along-slope oceanographic processes and sedimentary products around the Iberian margin. Geo-Mar. Lett. 2011, 31, 315–341. [Google Scholar] [CrossRef] [Green Version]
- Stow, D.; Hernández-Molina, F.J.; Hodell, D.; Alvarez Zarikian, C.A. Mediterranean outflow: Environmental significance of the Mediterranean Outflow Water and its global implications. IODP Prel. Rep. 2012, 339. [Google Scholar] [CrossRef]
- Expedition 339 Scientists. Mediterranean outflow: Environmental significance of the Mediterranean Outflow Water and its global implications. IODP Prel. Rept. 2012, 339. [Google Scholar] [CrossRef]
- Hodell, D.; Lourens, L.; Crowhurst, S.; Konijnendijk, T.; Tjallingii, R.; Jiménez-Espejo, F.; Skinner, L.; Tzedakis, P.C.; Members, S.S. A reference time scale for Site U1385 (Shackleton Site) on the Iberian Margin. Glob. Planet. Chang. 2015, 133, 49–64. [Google Scholar] [CrossRef] [Green Version]
- McManus, J.F.; Oppo, D.W.; Cullen, J.L. A 0.5-million.year record of millennial-scale climate variability in the North Atlantic. Science 1999, 283, 971–975. [Google Scholar] [CrossRef]
- Lisiecki, L.E.; Raymo, M.E. A Pliocene-Pleistocene stack of 57 globally distributed benthic δ18O records. Paleoceanography 2005, 20, PA1003. [Google Scholar] [CrossRef]
- Adkins, J.F.; Ingersoll, A.P.; Pasquero, C. Rapid climate change and conditional instability of the glacial deep ocean from the thermobaric effect and geothermal heating. Quat. Sci. Rev. 2005, 24, 581–594. [Google Scholar] [CrossRef]
- Hodell, D.A.; Lourens, L.; Stow, D.A.; Hernández-Molina, F.J.; Alvarez-Zarikian, C.A.; Abrantes, F.; Acton, G.D.; Bahr, A.; Balestra, B.; Llave Barranco, E.; et al. The “Shackleton Site” (IODP Site U1385) on the Iberian Margin. Sci. Drill. 2013, 16, 13–19. [Google Scholar] [CrossRef] [Green Version]
- Kennett, J.P.; Srinivasan, M.S. Neogene Planktonic Foraminifera. A Phylogenetic Atlas; Hutchinson Ross Publishing Company: New York, NY, USA, 1983. [Google Scholar]
- Schmiedl, G.; Mackensen, A.; Muller, P.J. Recent benthic foraminifera from the eastern South Atlantic Ocean: Dependence on food supply and water masses. Mar. Micropaleontol. 1997, 32, 249–287. [Google Scholar] [CrossRef]
- Mojtahid, M.; Jorissen, F.; Lansard, B.; Fontanier, C.; Bombled, B.; Rabouille, C. Spatial distribution of live benthic foraminifera in the Rhone prodelta: Faunal response to a continental-marine organic matter gradient. Mar. Micropaleontol. 2009, 70, 177–200. [Google Scholar] [CrossRef] [Green Version]
- Malmgren, B.A.; Kucera, M.; Nyberg, J.; Waelbroeck, C. Comparison of statistical and artificial neural network techniques for estimating past sea surface temperatures from planktonic foraminifer census data. Paleoceanography 2001, 16, 520–530. [Google Scholar] [CrossRef] [Green Version]
- Kucera, M.; Weinelt, M.; Kiefer, T.; Pflaumann, U.; Hayes, A.; Weinelt, M.; Chen, M.T.; Mix, A.C.; Barrows, T.T.; Cortijo, E.; et al. Reconstruction of sea-surface temperatures from assemblages of planktonic foraminifera: Multi-technique approach based on geographically constrained calibration data sets and its application to glacial Atlantic and Pacific Oceans. Quat. Sci. Rev. 2005, 24, 951–998. [Google Scholar] [CrossRef]
- Loulergue, L.; Schilt, A.; Spahni, R.; Masson-Delmotte, V.; Blunier, T.; Lemieux, B.; Barnola, J.M.; Raynaud, D.; Stocker, T.F.; Chappellaz, J. Orbital and millennial-scale features of atmospheric CH4 over the past 800,000 years. Nature 2008, 453, 383. [Google Scholar] [CrossRef]
- Lüthi, D.; Le Floch, M.; Bereiter, B.; Blunier, T.; Barnola, J.M.; Siegenthaler, U.; Raynaud, D.; Jouzel, J.; Fischer, H.; Kawamura, K.; Stocker, T.F. High-resolution carbon dioxide concentration record 650,000-800,000 years before present. Nature 2008, 453, 379. [Google Scholar] [CrossRef] [Green Version]
- Wollenburg, J.E.; Knies, J.; Mackensen, A. High-resolution paleoproductivity fluctuations during the past 24 kyr as indicated by benthic foraminifera in the marginal Arctic Ocean. PA3 2004, 204, 209–238. [Google Scholar] [CrossRef]
- Rodríguez-Tovar, F.J.; Dorador, J.; Martin-Garcia, G.M.; Sierro, F.J.; Flores, J.A.; Hodell, D.A. Response of macrobenthic and foraminifer communities to changes in deep-sea environmental conditions from Marine Isotope Stage (MIS) 12 to 11 at the “Shackleton Site”. Glob. Planet. Chang. 2015, 133, 176–187. [Google Scholar] [CrossRef]
- Grunert, P.; Skinner, L.; Hodell, D.; Piller, W.E. A micropalaeontological perspective on nutrients, oxygenation and temperature in NE Atlantic deep-waters across Terminations I and II. Glob. Planet. Chang. 2015, 131, 174–191. [Google Scholar] [CrossRef]
- McElroy, M.B. Marine biological controls on atmospheric CO2 and climate. Nature 1983, 302, 328–329. [Google Scholar] [CrossRef]
- Broecker, W.S.; Henderson, G. The sequence of events surrounding Termination II and their implication for the cause of glacial-interglacial CO2 changes. Paleoceanography 1998, 13, 352–364. [Google Scholar] [CrossRef]
- Toggweiler, J.R. Variation of atmospheric CO2 by ventilation of the ocean’s deepest water. Paleoceanography 1999, 14, 571. [Google Scholar] [CrossRef]
- Kohfeld, K.E.; Le Quéré, C.; Harrison, S.P.; Anderson, R.F. Role of Marine Biology in Glacial-Interglacial CO2 Cycles. Science 2005, 308, 74–78. [Google Scholar] [CrossRef]
- Railsback, L.B.; Gibbard, P.L.; Head, M.J.; Voarintsoa, N.R.G.; Toucanne, S. An optimized scheme of lettered marine isotope substages for the last 1.0 million years, and the climatostratigraphic nature of isotope stages and substages. Quat. Sci. Rev. 2015, 111, 94–106. [Google Scholar] [CrossRef]
Figure 1.
(a) Surface circulation in the North Atlantic and location of the study-site. AF, Arctic Front; AzC, Azores Current; NAC, North Atlantic current; PC, Portugal Current. (b) Site U1385 bathymetry [40].
Figure 1.
(a) Surface circulation in the North Atlantic and location of the study-site. AF, Arctic Front; AzC, Azores Current; NAC, North Atlantic current; PC, Portugal Current. (b) Site U1385 bathymetry [40].
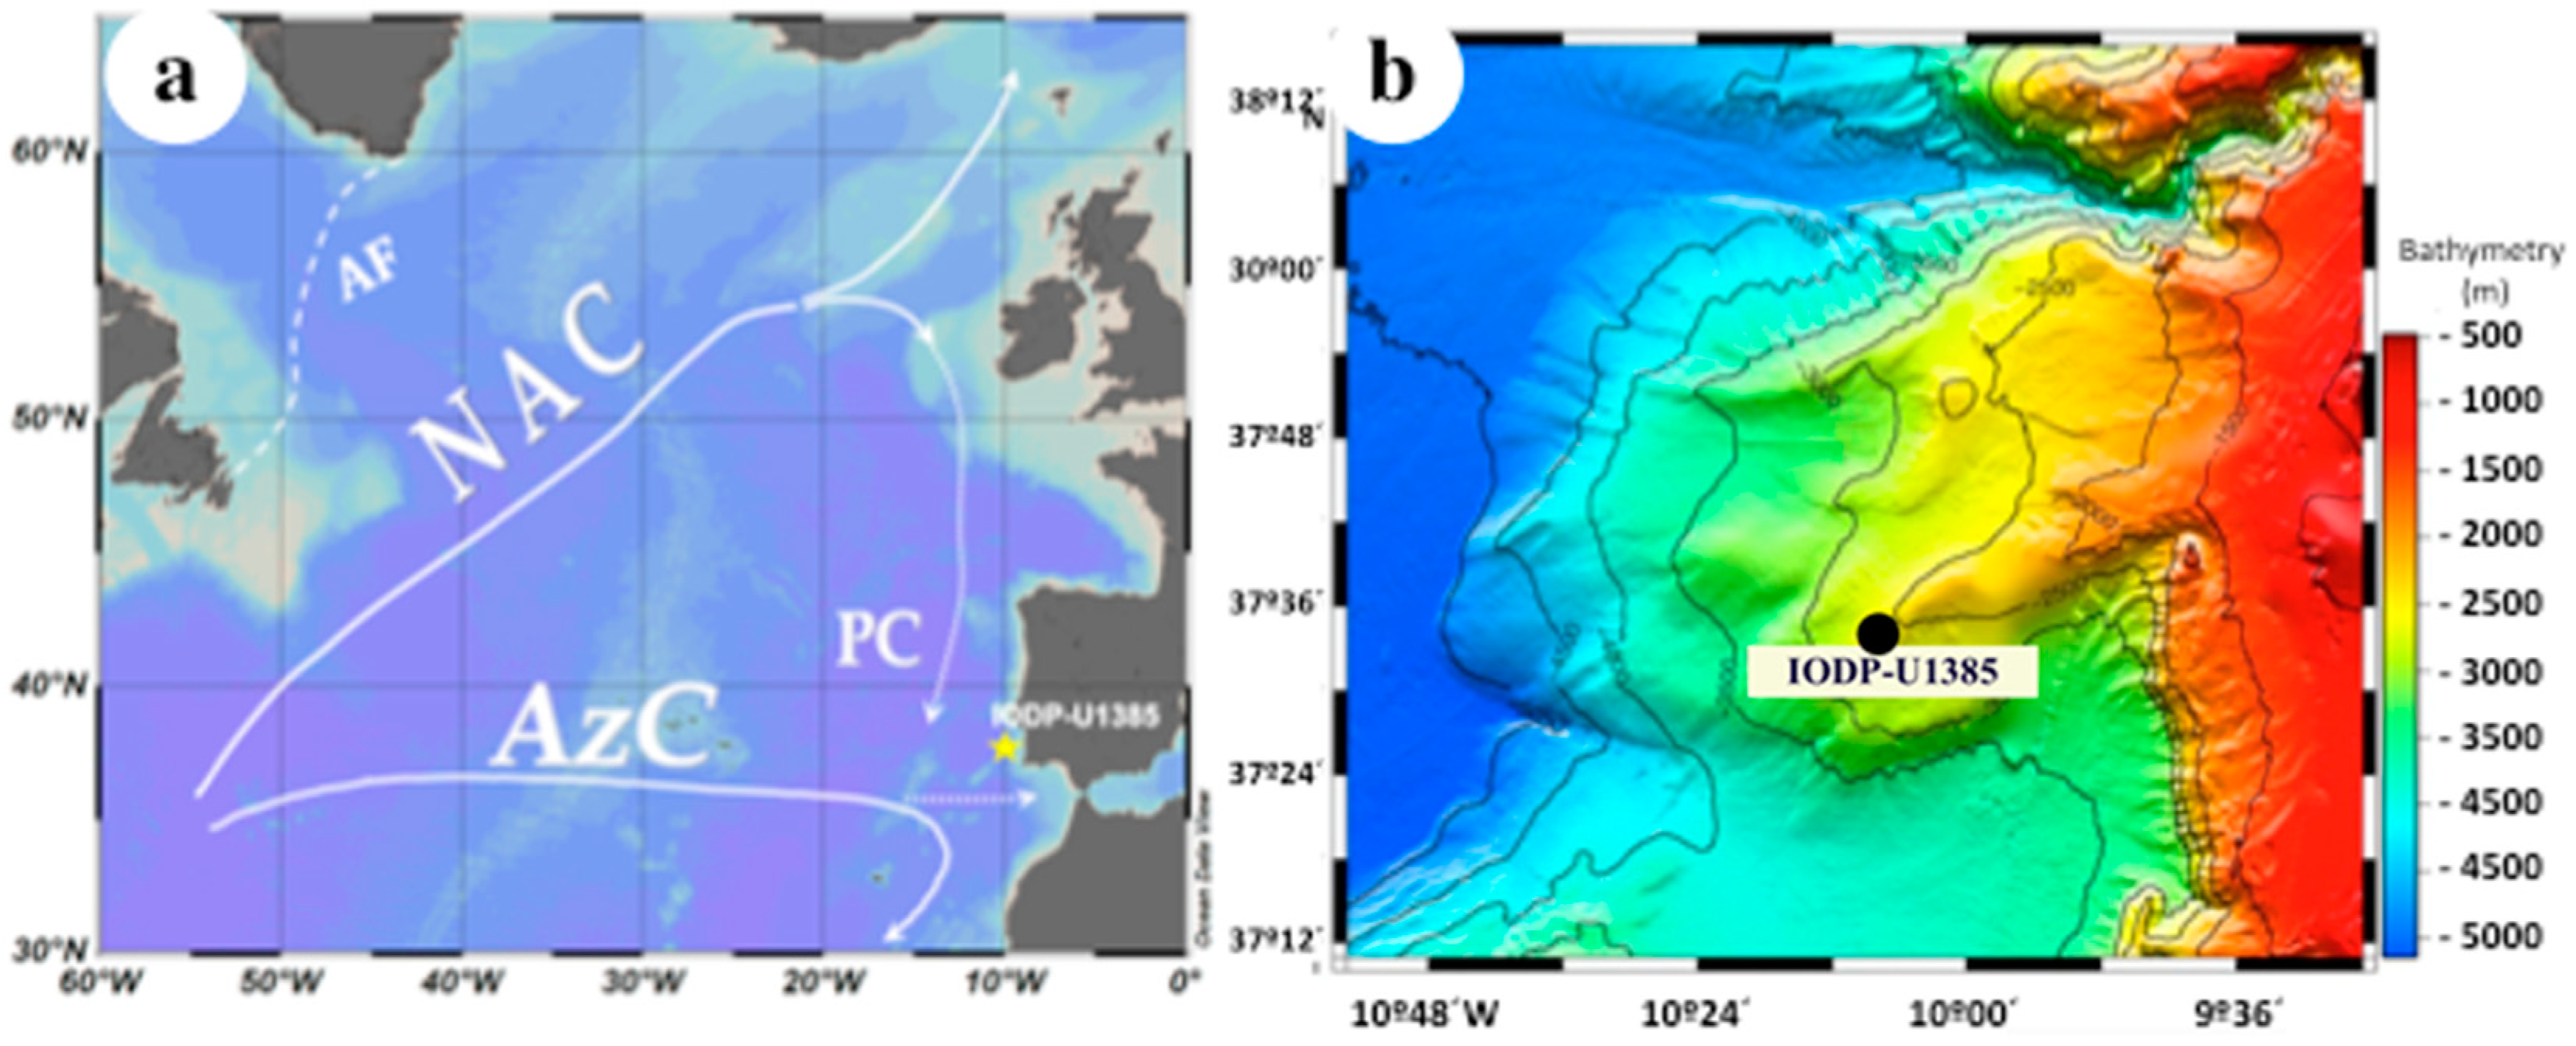
Figure 2.
(a,b) Benthic δ18O record from site U1385 [41] in black; the grey fill enhances glacial conditions according to the threshold for the North Atlantic [42]. In purple, the global LR04 stack [43]. (c,d) Benthic δ13C record from site U1385 [41]; the orange fill enhances 13C-depleted values typical of AABW [44]. The more negative δ13C, the higher the boundary between the North Atlantic Deep Water (NADW) and the Antarctic Bottom Water (AABW) is above the sea-floor. Terminations (T) are marked in roman numerals, and marine isotope stages are written on top of the figure.
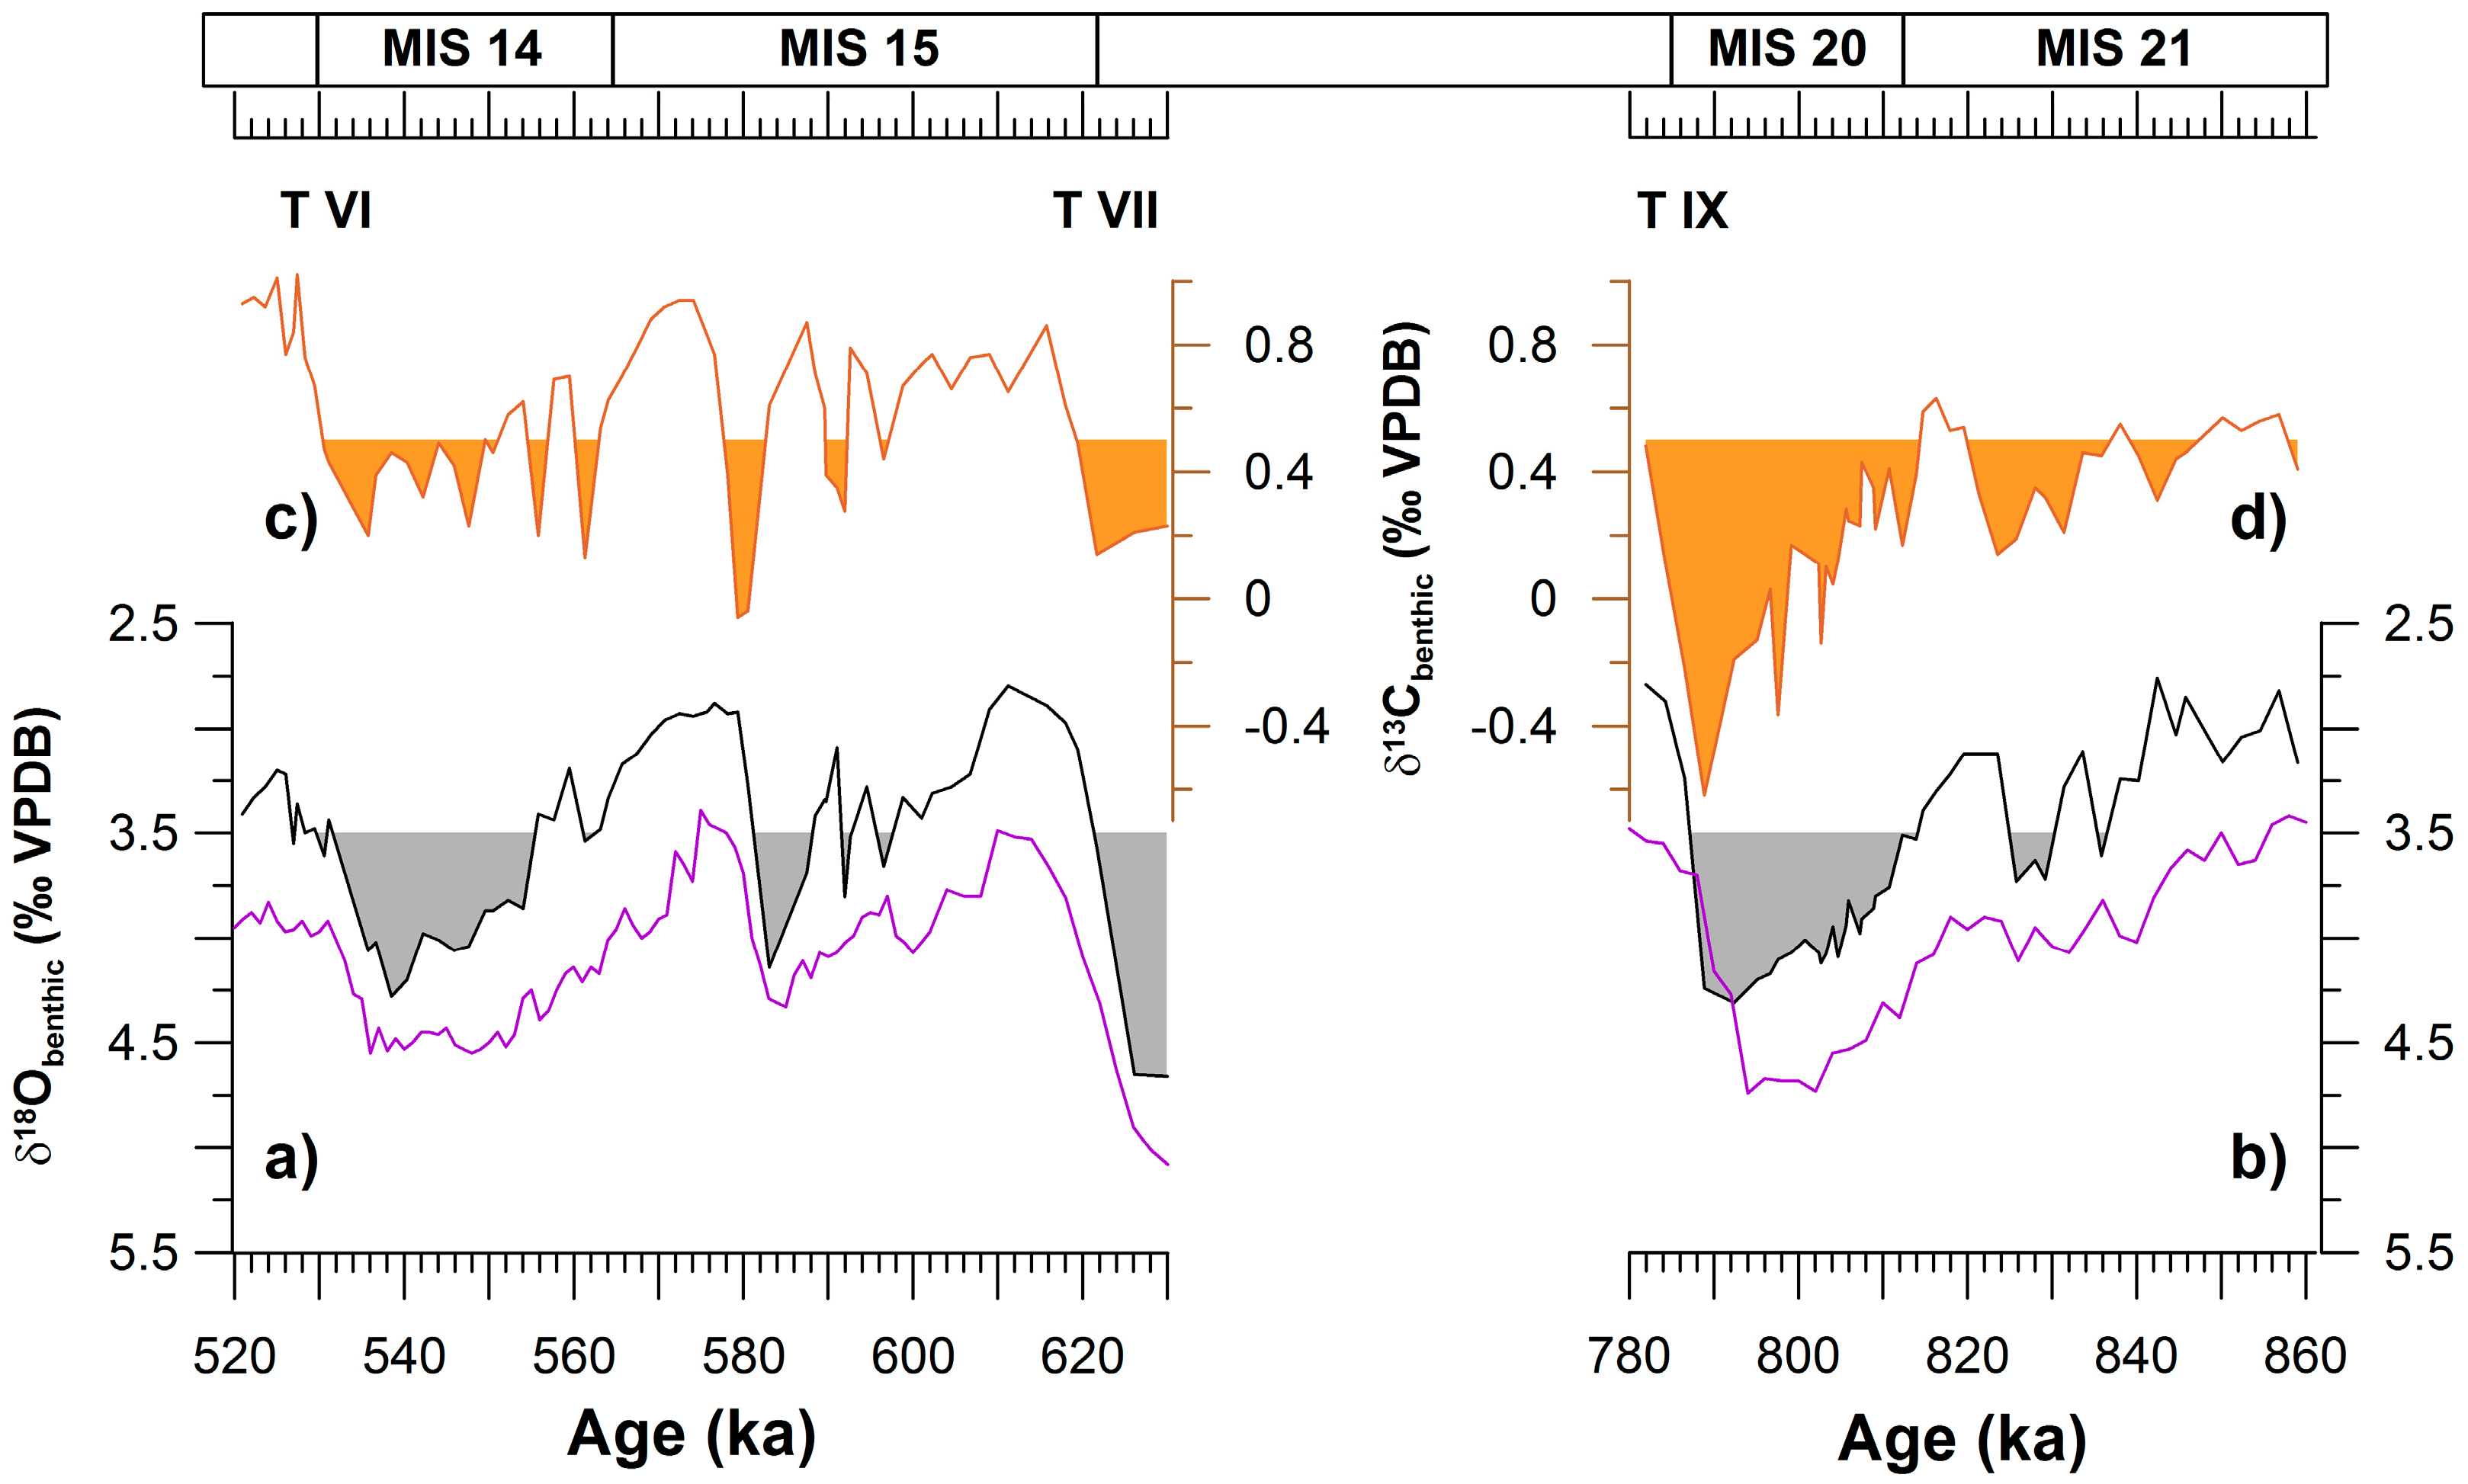
Figure 3.
Records from site U1385 during the ninth and sixth climate cycles, compared with greenhouse gasses. (a,b) Benthic δ13C [41]; the fill enhances 13C-depleted values typical for AABW [44]. The more negative the δ13C, the higher the boundary NADW/AABW is in the study site. (c,d) Planktonic foraminiferal Accumulation Rate (PAR) (#complete planktonic foraminifer shells/cm2 ky). (e,f) BAR (#complete benthic foraminifer shells/cm2 ky). (g,h) Annual Sea Surface Temperature (SST); the fill enhances values below 16.6 °C, which is the average SST for the study-interval. (i,j) CH4 (green) [51] and CO2 (red) [52] content in the Antarctic ice. Terminations are marked in roman numerals, and MISes are written on top of the figure. Grey bands highlight intervals of low CO2 absorption.

© 2018 by the author. Licensee MDPI, Basel, Switzerland. This article is an open access article distributed under the terms and conditions of the Creative Commons Attribution (CC BY) license (http://creativecommons.org/licenses/by/4.0/).
Share and Cite
MDPI and ACS Style
Martin-Garcia, G.M. Sea-Air CO2 Exchange in the SW Iberian Upwelling System during Two Contrasting Climate Cycles: 860–780 ka and 630–520 ka. Geosciences 2018, 8, 454. https://doi.org/10.3390/geosciences8120454
AMA Style
Martin-Garcia GM. Sea-Air CO2 Exchange in the SW Iberian Upwelling System during Two Contrasting Climate Cycles: 860–780 ka and 630–520 ka. Geosciences. 2018; 8(12):454. https://doi.org/10.3390/geosciences8120454
Chicago/Turabian StyleMartin-Garcia, Gloria M. 2018. "Sea-Air CO2 Exchange in the SW Iberian Upwelling System during Two Contrasting Climate Cycles: 860–780 ka and 630–520 ka" Geosciences 8, no. 12: 454. https://doi.org/10.3390/geosciences8120454
Note that from the first issue of 2016, this journal uses article numbers instead of page numbers. See further details here.