Geomechanical Model Test and Energy Mechanism Analysis of Zonal Disintegration in Deep Surrounding Rock


1
Research Center of Geotechnical and Structural Engineering, Shandong University, Jinan 250061, China
2
School of Architecture and Engineering, Liaocheng University, Liaocheng 252000, China
*
Author to whom correspondence should be addressed.
Geosciences 2018, 8(7), 237; https://doi.org/10.3390/geosciences8070237
Submission received: 4 June 2018
/
Revised: 20 June 2018
/
Accepted: 26 June 2018
/
Published: 28 June 2018
Abstract
:With the decreasing of shallow resources, underground roadways of resources exploitation have reached into deep rock mass with high geostress. A series of new failure phenomena such as zonal disintegration phenomenon were discovered in deep surrounding rock, which is completely different from shallow caverns. To reveal the formation mechanism of zonal disintegration, the geomechanical model test and energy mechanism analysis of zonal disintegration were carried out respectively. Taking the deep roadway of Dingji coal mine in China’s Huainan coal mine as engineering background, a 3D geomechanical model test was carried out relying on the high stress 3D loading test system. The zonal disintegration phenomenon was observed, and the oscillation law of displacement was measured. Based on the strain gradient theory and continuum damage mechanics, the elastoplastic damage model was established. An energy failure criterion was proposed by principle of energy dissipation and release. The ODE45 function in Matlab software was used to solve the displacements and stresses of excavated model roadway. The analytical solutions the and the geomechanical model test were basically consistent. The applicability of theoretical model and energy failure criterion were confirmed to explain the mechanism of zonal disintegration and it can be used to provide theoretical support for the failure and supporting design of surrounding rock in deep underground engineering.
1. Introduction
Zonal disintegration is a common deformation failure phenomenon in deep rock engineering under high geostress conditions. It is manifested by the phenomena of alternating fractured zones and non-fractured zones in the surrounding rock on both sides and face of the roadway (Figure 1) [1].
In recent decades, scholars have carried out a lot of research work on zonal disintegration from different perspectives. In theoretical analysis, a non-euclidean analytic model was established to determine the incompatible deformation of zonal disintegration in deep rock masses [2,3]. A strain gradient model was established to obtain the stress field in elastic and plastic zones, and the formation of zonal disintegration of rock mass near deep level tunnel was elucidated [4]. A mechanical model is proposed to investigate zonal disintegration mechanism of cross-anisotropic rock masses around a deep circular tunnel subjected to dynamic unloading under hydrostatic pressure condition [5]. In numerical simulations, the failure mechanism of zonal disintegration around deep underground excavations under tri-axial stress were studied through three-dimensional Realistic Failure Process Analysis (RFPA3D) [6,7], a numerical method based on the UMAT of ABAQUS was proposed to investigate the mechanism of zonal disintegration [8]. In the geomechanical model test, a pre-set roadway model test was implemented to confirm that roadways under a large axial pressure caused the lateral expansion of the wall around circular opening (Figure 2a) [9], a triaxial loading geomechanical model test was used to truly reproduce the zonal disintegration phenomenon and obtained the wave change of strain and displacement with a variety of test methods (Figure 2b) [10].
Zonal disintegration of deep roadway is a regular strain localization phenomenon. The strain gradient theory can reflect the strain localization of the rock mass [11,12]. Since the existing elastoplastic model [13] of continuous media neglects the influence of strain gradient, it has encountered difficulties in explaining the zonal fracture phenomenon of deep rock mass. Therefore, the effect of strain gradient should be considered in the study of the zonal disintegration phenomenon. In the field of application, the plastic strain gradient is analysed to predict the tendency of rock burst in ore pillars [14].
In the fracture mechanics analysis of materials, many scholars have explained the macroscopic fracture mechanism from different aspects and the corresponding fracture criteria are established. According to the applied parameters, there are two categories: the stress parameter criterion and the energy parameter criterion [15]. In the stress parameter criterion, a 2D [16] and full 3D [17] discrete beam lattice model with embedded discontinuities were present to simulate cracks propagating through rock mass until complete localized failure. In the energy parameter criterion, the deep rock mass is subjected to processes such as transformation, transmission, dissipation and release of energy during the process of cracks fracture. From the energy point of view, the characteristics of the deformation and failure stage of rock mass can be easily characterized [18]. Therefore, it can be achieved to understand the formation mechanism of the zonal disintegration phenomenon by studying the characteristics of energy changes of surrounding rock in deep roadway.
In this paper, taking the deep roadway of Dingji coal mine in China’s Huainan coal mine as engineering background, a 3D geomechanical model test was carried out relying on the high stress 3D loading test system. The zonal disintegration phenomenon was observed, and the oscillation law of displacement was measured.Based on the elastoplastic damage model and the energy failure criterion, the formation and development law of zonal disintegration are analyzed and it can be applied to the similar deep underground engineering.
2. Geomechanical Model Test for Zonal Disintegration in Deep Rock Mass
Geomechanical model test is a physical simulation method for scaling research on engineering problems based on a certain similarity principle. Under the condition of satisfying the similar principle, the deformation and failure characteristics of rock mass can be simulated more accurately. Some new experimental phenomena can be observed. New theory and mathematical model can be provided by the experimental results. The geomechanical model test has become an important means to study the nonlinear deformation and failure of deep rock masses with its intuitionistic and visual characteristics.
2.1. Analogical Materials of Model Test
The deep roadway of the Dingji coal mine in Huainan area is chosen as the engineering prototype of the model test. The buried depth of roadway is 910 m, the lithology of the roadway is medium sandstone which is mainly dominated by quartz and cemented by calcium. The geomechanical characteristics of the medium sandstone from the coal mine are shown in Table 1.
To simulate the mechanical properties of sandstone, a new typed cementations geotechnical similar material called iron crystal sand cementation material (IBSCM) [19,20] was proposed based on the similarity principle and the mechanical parameters of the rock. The iron powder, the barite powder and the quartz sand are selected as the aggregate of IBSCM. Among these components the iron powder and the barite powder are fine aggregates while the quartz sand is coarse aggregate. Its cementing agent is the rosin-alcohol solution (Figure 3). The mechanical parameters of the IBSCM material can be adjusted through the change of the component concentration and the cementing agent solubility.
The geometrical similarity scale of the model is taken as 1/50 and the similar weight ratio of the model is taken as 1. Based on the similar conditions and the geomechanical characteristics of the medium sandstone from the coal mine (Table 1), through a large number of material ratios and corresponding mechanical parameter tests, the physical and mechanical parameters of similar materials of the model were obtained in Table 2, the proportion of iron power, the barite powder and quartz sand is 1:1.2:0.38, the concentration of rosin alcohol solution is 9.5%, the ratio of rosin alcohol solution to the total weight is 5%.
2.2. Model Dimensions and Boundary Conditions
The shape of geomechanical model is a cube, and the size of the model is length (direction of parallel to the roadway axis, x direction) width × (direction of perpendicular to the roadway axis, z direction) × height (vertical orientation, y direction) = 0.6 m × 0.6 m × 0.6 m, the model roadway is excavated using circular holes and the diameter of the roadway is 0.1 m.
The model geostress field is mainly dominated by horizontal tectonic stress and the lateral pressure coefficient is 1.5. The vertical stress () of the model roadway is calculated as the gravity stress , where, is the unit weight of rock mass, h is the converted model depth of roadway; the horizontal geostress () perpendicular to the roadway axis is calculated as 1.5 times the vertical stress; the horizontal geostress () paralleled to the roadway axis is 1.2 times the compressive strength of the model similar materials. The model roadway condition and loading mode are shown in Figure 4.
2.3. Layout Scheme of Displacement Measurement
To observe zonal disintegration phenomenon effectively, grating scale multi-point displacement measuring elements are arranged around model roadway at intervals. The layout of the model monitoring section and the arrangement of the measuring element are shown in Figure 5.
2.4. Model Loading and Excavation
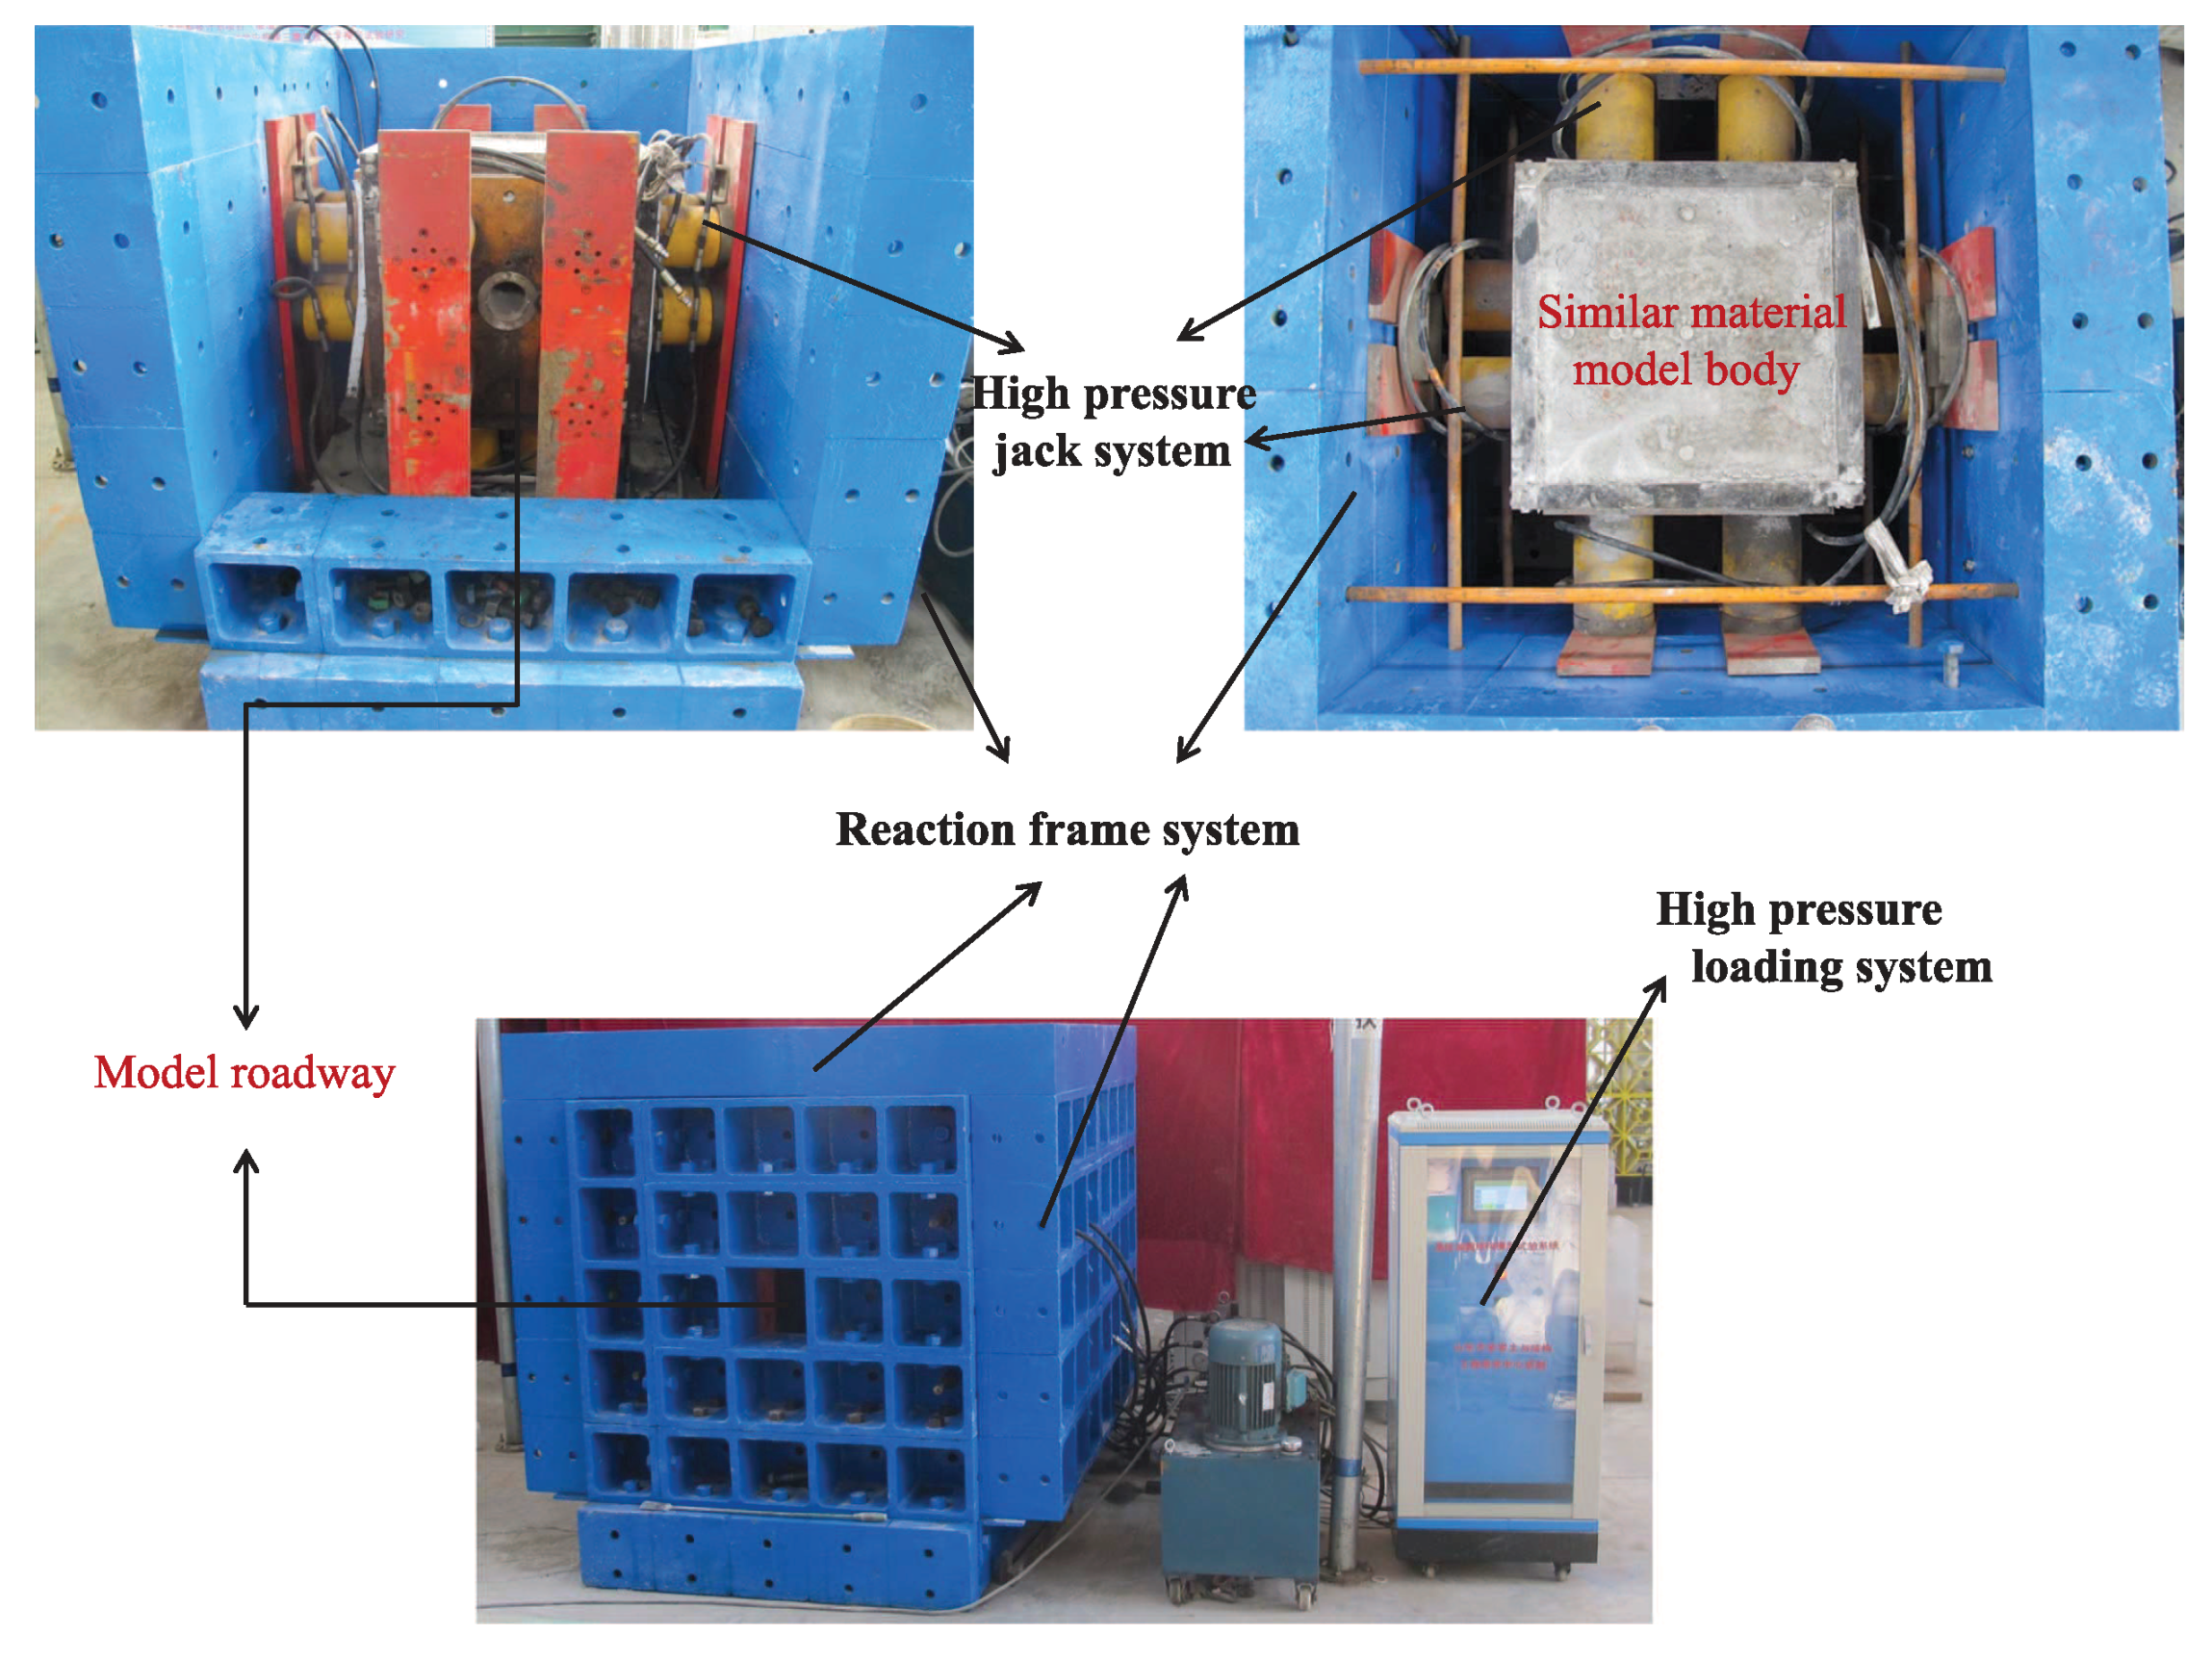
According to the loading method described in Section 2.2, a self-designed high-stress true three-dimensional loading model test system [21] is used to apply boundary load to the model so that the initial stress field is formed inside the model. As shown in Figure 6, the system is composed of three components listed as follows: the reaction frame system, the high pressure jack system and the high-pressure loading system. The high pressure equipment is especially designed in this test and its rated output is 5.5 MPa. There are in total 24 hydraulic jacks respectively set on the six sides of the equipment. The maximum power output of each hydraulic jack can reach 2000 KN. The whole system meticulously simulates the deformation and failure process of the model roadway in Dingji coal mine.
With the complement of the model fabrication, exert the stress at the model boundary according to the similar stress and keep a steady pressure for one day so that an initial high geostress field can be formed inside the model. Full section excavation was adopted and kept excavating the model by stages along the roadway axle until the whole model roadway was cut-through and shaped up [22]. During the process, the deformation and failure of the model roadway should be observed. The test procedure was illustrated and test data of displacement instruments was recorded (Figure 7).
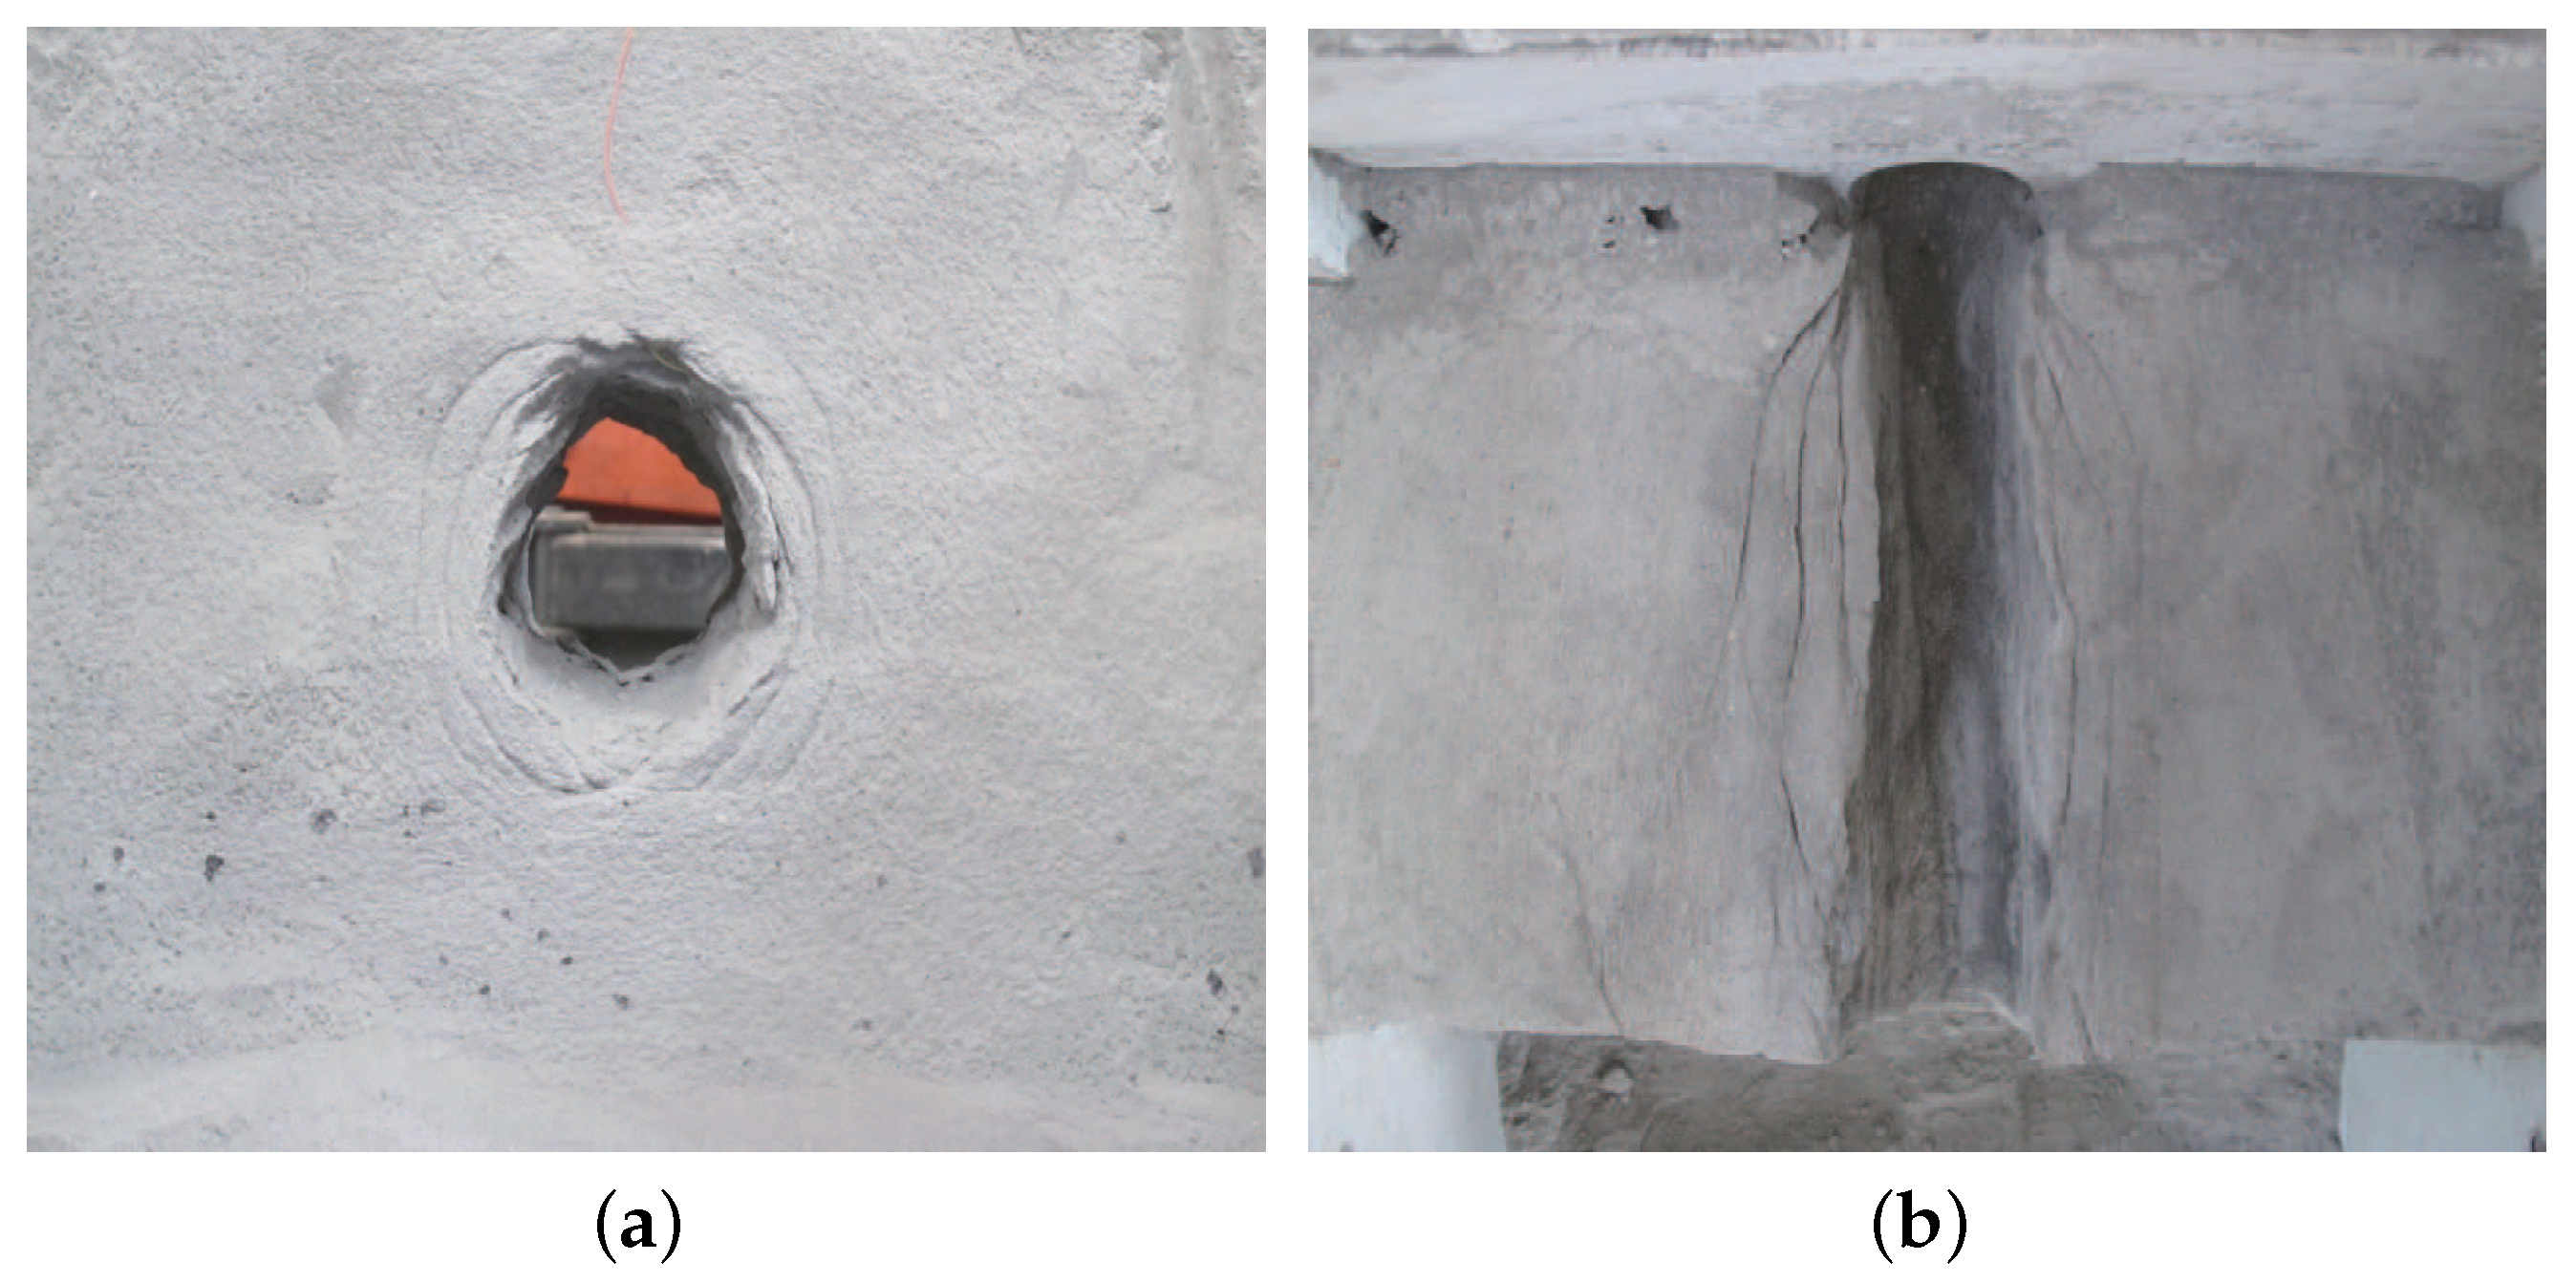
After the roadway excavation was completed, the boundary stress was to be maintained for a long time. When the reading of the monitoring instrument was stabilized, the boundary stress was removed and the model test bench was disassembled, the geomechanical model was sliced and observed the following phenomena which seen in Figure 8.
There are four discontinuous fractured zones around the roadway and the shape of the fractured zone is approximately circular. The surrounding rock in the roadway surface area is seriously damaged. This area can be considered as the traditional damage zone. The remaining three damage zones and non-fractured zones appear alternately.
The range of fractured zone around roadway is measured. There are four fracture zones around roadway. The range of the first fractured zone is 0–2.5 cm, the second fracture zone is 3.6–4.5 cm, the third fracture zone is 6.9–7.5 cm, and the fourth fracture zone is 10.8–11.2 cm. The test data of radial displacement are shown in Table 3. At the same time, the radial displacement curve of model roadway monitoring points is given in Figure 9. Based on the radial strain and radial displacement curve, the following conclusions can be obtained. The radial strain and radial displacement of model roadway monitoring points show the oscillation attenuation law. In this attenuation law, the wave peak and trough values appear alternately, and the oscillation amplitude decreases gradually with the increase of the distance from wall.
3. Gradient-Dependent Elastoplastic Damage Softening Model of Deep Rock Mass
3.1. The Introduction of Strain Gradient
In traditional continuum mechanics, since the space and time variables can infinitely tend to zero, it is impossible to describe the multi-scale effects of material failure fundamentally. That is, the irreversible destruction process of materials at the micro scale has a decisive influence on the destruction at the macro scale. In considering the scale effect of materials, two methods are usually used: lattice-model [23] and strain gradient theory [24]. Different from the traditional continuum mechanics method, in Lattice-Model , the role of the second nearest neighbor of the discrete element is considered [25], so that the deformation of the material at a smaller scale is involved on the scale of the discrete element. The strain gradient theory takes into account the contribution of the strain gradient in the material constitutive relation, thus providing a way to explore the size effect of the material.
The Toupin-Mindlin strain gradient theory introduced in this paper is derived from the Cosserat couple stress theory. The introduced strain gradient is an integral term which does not distinguish between rotational strain gradient and tensile strain gradient. To describe the state of the material, the usual Eulerian strain and the strain gradient are required. A point in the rock mass is selected as a research object, the expression of Eulerian strain and strain gradient is as follows:
where, is the macroscopic displacement of material (rock mass).
In the Toupin-Mindlin strain gradient theory, is two order Cauchy stress tensor conjugate to the Eulerian strain tensor , which are satisfied by the traditional elastoplastic stress-strain relationship. is set as the three order stress tensor which is conjugate to strain gradient tensor , the specific expression can be written as [26]:
where, is the Kronecker symbol, G is the lame constant, l is the internal length parameter, which is generally valued as diameter of aggregate particles [27].
After introducing the higher order stress, the previous equation in the continuum mechanics should be changed accordingly. Equivalent stress and equivalent strain, equilibrium equations and boundary conditions are different from the classical continuum theory.
The equivalent stress and equivalent strain considering the strain gradient can be written as [28]:
where, is the deviator strain, is the deviator stress, the expressions can be detailed as = − , ; , .
If the static process is considered only, the static equilibrium equation including high order stress is:
The boundary conditions including high order stress are:
where, , are the normal surface force boundary condition and the high order surface force boundary condition; is the surface normal vector; is the surface gradient operator, which can be indicated as: .
3.2. The Establishment of Elastoplastic Damage Model
With the increasing depth of underground engineering, the failure of deep rock mass presents the characteristics of ductility and strain softening under the condition of high geostress [29,30]. The equivalent stress-strain curve of uniaxial compression is shown in Figure 10. According to the obvious mechanical properties of post-peak strain softening of rock under deep high geostress condition, the stress-strain relationship is appropriately simplified.
The OA stage is called as the stage of cracks compaction, the AB stage is linear elastic, and the point B is the yield point which represents the dividing line or transition from the elastic to the plastic region of the curve. is the yield stress and is the yield strain, OA and AB are collectively simplified linear elastic region, and the slope is the elastic modulus E.
The BC stage is a stage of plastic hardening. The point C is the point of peak strength, is the peak stress, and is the peak strain.
The CD stage is the stage of plastic softening, and the point of D is the intersection of the softening stage and the flow stage, which is the residual stress and is the residual strain.
The DE stage is the residual stage, the strength of the rock mass declines with the increase of deformation. Until the deformation reaches the ultimate strain , the rock mass is completely destroyed.
The equivalent stress-strain relationship can be written as follows:
where, , , and are the pending parameters. Among them, and are the small parameter perturbation terms, which is a smooth connection between the plastic hardening stage and the elastic stage, is the modification parameter of damage variable [31] to represent the influence of the residual strength.
To describe the strain softening of deep rock under high stress, the damage evolution of rock is determined [32]. It is considered that no damage occurs in the rock mass at the elastic stage until the rock mass yields into the plastic stage [33]. The damage evolution equation is written as follows:
Through lots of rock compression tests, the equivalent stress-strain curve of the rock shown in Figure 10 was fitted and the parameters determined in the relational equation were solved.
4. Deformation and Stress Analytical Solution in Deep Roadway
4.1. Theoretical Equations Based on Strain Gradient
Taking the deep roadway excavated with full section as the research object, the calculation model based on strain gradient is established. The column coordinate system is established: the Z axis is parallel to the axis of the roadway, the plane polar coordinate system is perpendicular to the axis of the roadway. Because the excavation of roadway is a three-dimensional spatial problem, and thus the deep roadway is abstracted into a thick walled cylinder model with infinite length (Figure 11). a is the excavating radius and the inner radium of plastic zone, is the outer radius of plastic zone, b is the outer radius of elastic zone.
It is assumed that is the initial axis strain parallel to the direction of the unexcavated roadway, and the increment of the axial strain after the tunnel excavation is negligible compared with the initial strain. Therefore, the above issue can be considered as a quasi-plane strain issue [3] in which the axial strain is a non-zero constant, namely . The force is parallel to the direction of the roadway and can be expressed as . where, is Poisson ratio, E is elastic modulus.
In the cylindrical coordinates, the displacement of the polar coordinate plane is only a function of the radius, expressed in or abbreviated as u, is the displacement of axis of roadway. There are three nonzero terms in the strain tensor: , and , and four nonzero terms in the strain gradient tensor: , , and . The geometric equation [27] can be simplified as:
where, , and are radial, tangential and axial strains without the high order strains. , , and are high order strains expressed in polar coordinates.
After substituting Equation (8) into Equation (2), the constitutive relation of high order stress is obtained as follows:
Only the axial strain is considered before the roadway is excavated, and it does not change during the excavation.
Considering the effect of strain gradient on the stress-strain relationship of surrounding rock and substituting Equation (8) into Equation (3), the equivalent strain can be expressed as:
The deep roadway with axial pressure is simplified as a quasi-plane strain problem with initial axial strain . Thus, the axial stress of the roadway without considering the high order stress is written as:
where, the and are radial and tangential stresses without the high order stress.
After substituting Equations (9) and (11) into Equation (3), the equivalent stress can be expressed in the following form:
Defining the following parameters , and as the generalized radial stress, tangent stress and axial stress of the surrounding rock containing the high order stress term, the detailed expression can be obtained by Cauchy stress tensor and three order stress tensor.
Under excavation condition, the equilibrium equation for axisymmetric plane strain problem can be expressed as the following form:
After substituting Equation (13) into Equation (14), the equation of motion containing the strain gradient term is written as:
The initial condition and boundary conditions of the internal (r = a) and external (r = b) boundary of the deep circular roadway (Figure 11) are shown as:
The elastic state equation and plastic state equation are both satisfied at the junction () of elastic zone and plastic zone and the which the equivalent strain are satisfied the relational expression: .
Based on the strain gradient theory and the deformation theory of plasticity, a corresponding elastoplastic damage softening model (Equation (6)) is established. The equivalent equation (Equation (15)) with strain gradient terms is obtained, and the initial and boundary conditions for solving the motion equation (Equations (16)–(18)) are derived.
4.2. The Process of Solving Theoretical Equations
Because of the axial symmetry of the mechanical state of the surrounding rock in the deep roadway, it is known that the displacement caused by the excavation is a function of radius r. Then substituting Equation (9) into Equation (15), the equation of motion is obtained as:
where, is the density of rock mass; , , , , ; .
To find the numerical solution of the above problem, the ODE45 function in Matlab software can be applied. Firstly, the initial value condition and boundary range should be provided. It is assumed that a is the radius of the tunnel excavation, b is the radius of stress disturbance area in the surrounding rock. Therefore, the range of r in the spatial domain is .
The initial displacement solution of the classical elastic theory [34] can be calculated as:
Therefore, the initial displacement of the outer boundary in the deep circular roadway at the initial time is written as:
The outer boundary conditions can be obtained by Equation (22).
Then substituting the initial value into Equation (20), the following solutions can be obtained such as , , and . According to the above solutions and constitutive equation of elastic zone (Equation (6a)), the motion equation can be solved by the ODE45 function, and the displacement and stress value of each time point in the space range can be obtained, then substituting the results into Equation (13), the generalized stresses , can be solved.
The radius that scarified Equation (6) can be found by substituting the values of stresses and into the expression, and the radius defined as the junction of elastic zone and plastic zone.
The junction is determined and each order derivative of displacement , , and can be calculated. The above derivatives are considered as the initial values of outer boundary of plastic zone. According to the constitutive equation of plastic zone (Equation (6b)), the motion equation can be solved by the ODE45 function, and the numerical solution u, , and in the space range of can be obtained.
Substituting the all-order derivatives of displacement , , , and the radial stress into Equation (23) , the calculation error can be checked. If the calculation error meet the tolerance , the whole calculation processes are completed and the numerical solutions of the whole calculation range are obtained, or the error does not guarantee the required accuracy, the initial space step was adjusted to recalculated, until meet the requirements.
5. Overall Energy Failure Criteria for Rock Unit
5.1. Energy Conversion Relationship in Deep Rock Mass
Figure 12 shows the energy conversion curve of surrounding rock under high stress conditions, the OA stage is a stage of crack compaction, W is the work done by the external forces, the input energy is converted into rock elastic strain energy . If unloaded, this part of energy will be released. There are at this stage.
The AB stage is linearly elastic. The original cracks are compacted and new cracks are continuously generated. The rock continues to absorb external energy and store it, so that the elastic strain energy increases continuously. If unloaded, the energy will be released without causing damage to the rock. There are at this stage.
The BC stage is a plastic hardening stage, which is generally shorter in this case. The work done by external force continues to be transformed into elastic strain energy , and some of it begin to be dissipated by the nonlinear internal mechanism of rock mass and form dissipative energy , therefore, there are at this stage. with the cracks accelerating the convergence, penetration, the curve of stress and strain shows the apparent nonlinearity that the proportion of stored elastic strain energy is continuously decreasing while the proportion of dissipative energy is increasing.
The CD stage is a plastic softening stage, in which a large number of cracks are generated, and the bearing capacity of the rock mass drops sharply with the increase of deformation. Cracks begin to penetrate until a macroscopic main crack is formed and a block slip along the macroscopic fracture surface occurs. The elastic strain energy stored in the rock is converted into the cracking surface energy and the frictional energy between the lone piece of rock. there are at this stage.
The DE stage is a residual stage. As the deformation increases, the strength of the rock mass gradually decreases and the deformation gradually increases until the rock mass is completely destroyed when the deformation reaches the ultimate strain . At this time, the elastic strain energy not only largely transforms into frictional energy and surface energy , a part of the energy is converted to kinetic energy and released, so this stage has the following energy relationship: .
5.2. Energy Failure Criterion Analyzed by Principle of Energy Dissipation and Release
It can be seen from Figure 12 that the work dong on the rock exerted by external force is partially dissipated by the nonlinear internal mechanism of the rock and formed dissipative energy , and the other part is transformed into the elastic strain energy and stored in the rock. After the plastic softening stage, the peak strength is exceeded. A large number of cracks are generated and the cracks begin to penetrate until a macroscopic main crack is formed. The rock deformation mainly manifests as a block slip along the macroscopic fracture surface. When the critical point of failure is reached, the elastic strain energy stored in the rock releases energy in a direction that is easy to release, that is, the direction of the minimum principal stress. When the amount of energy released in this direction reaches the energy required for the rupture of the unit body, the rock unit is totally destroyed. The surrounding rock in the deep cavern is in an elastoplastic state under high geostress conditions. Near the cavern wall, a plastic zone is formed due to plastic yield under high stress, and the elasticity is still deep in the surrounding rock. Both the plastic zone and the elastic zone of the surrounding rock store some of the elastic strain energy .
Based on the deformation failure mode of the rock unit, it can be considered that the energy release is the intrinsic driving force for the sudden destruction of the rock unit. Therefore, the overall failure criterion of the rock unit is established by the releasable strain energy in the rock unit [35].
5.2.1. Pressure Condition
According to Section 3, the generalized stresses , and can be solved. Then assumed that the maximum stress is , the minimum stress is and the medium stress is . When the rock mass under the condition of three-direction compressive stress state ( ), the energy release rate of the rock unit in the principal stress direction is:
where, is the constant of material.
The maximum energy release rate occurs in the direction of the minimum compressive stress, i.e., .
When the rock unit undergoes total destruction, it is satisfied the following expression:
where, is the critical strain energy release rate of whole destroyed rock unit under the state of compression , it can be determined by uniaxial compression test and the value is , is the uniaxial compressive strength.
The overall energy failure criteria for rock units is arranged as:
5.2.2. Tension Condition
When the tensile stress are occurred in the rock mass (), the energy release rate of the rock unit in the principal stress direction is:
The maximum energy release rate occurs in the direction of the maximin tensile stress, i.e., = .
When the rock unit undergoes total destruction, it is satisfied the following expression:
where, is the critical strain energy release rate of whole destroyed rock unit under under the state of tension, it can be determined by uniaxial tensile test and the value is , is the uniaxial tensile strength.
The overall energy failure criteria for rock units is arranged as:
where, Stress , and is positive with compressive stress.
6. Analytical Results and Comparative Analysis with Model Test Results
6.1. Selection of Calculation Parameters
The above mentioned three dimensional geomechanical model test is the background of analytical solution of zonal disintegration in deep rock mass. According to the similar conditions, the model test parameters are converted to prototype parameters. Finally, the analytical results and model test results are comparatively analyzed. The calculation parameters of surrounding rock are as follows: The radius of circular roadway is 2.5 m, the radius of calculation zone is 12 m. Elastic modulus of surrounding rock E = 77.82 GPa, poisson ratio = 0.268, peak strain , ultimate strain , gradient elastic parameters c = G = 30.7 GPa, internal length parameter of surrounding rock l = 0.01 m. The external loads applied to the calculation models are as follows: the Y-directional pressure is 23.84 MPa, the X-directional pressure is 35.76 MPa, the Z-directional pressure is 177.1 MPa.
6.2. Comparative Analysis
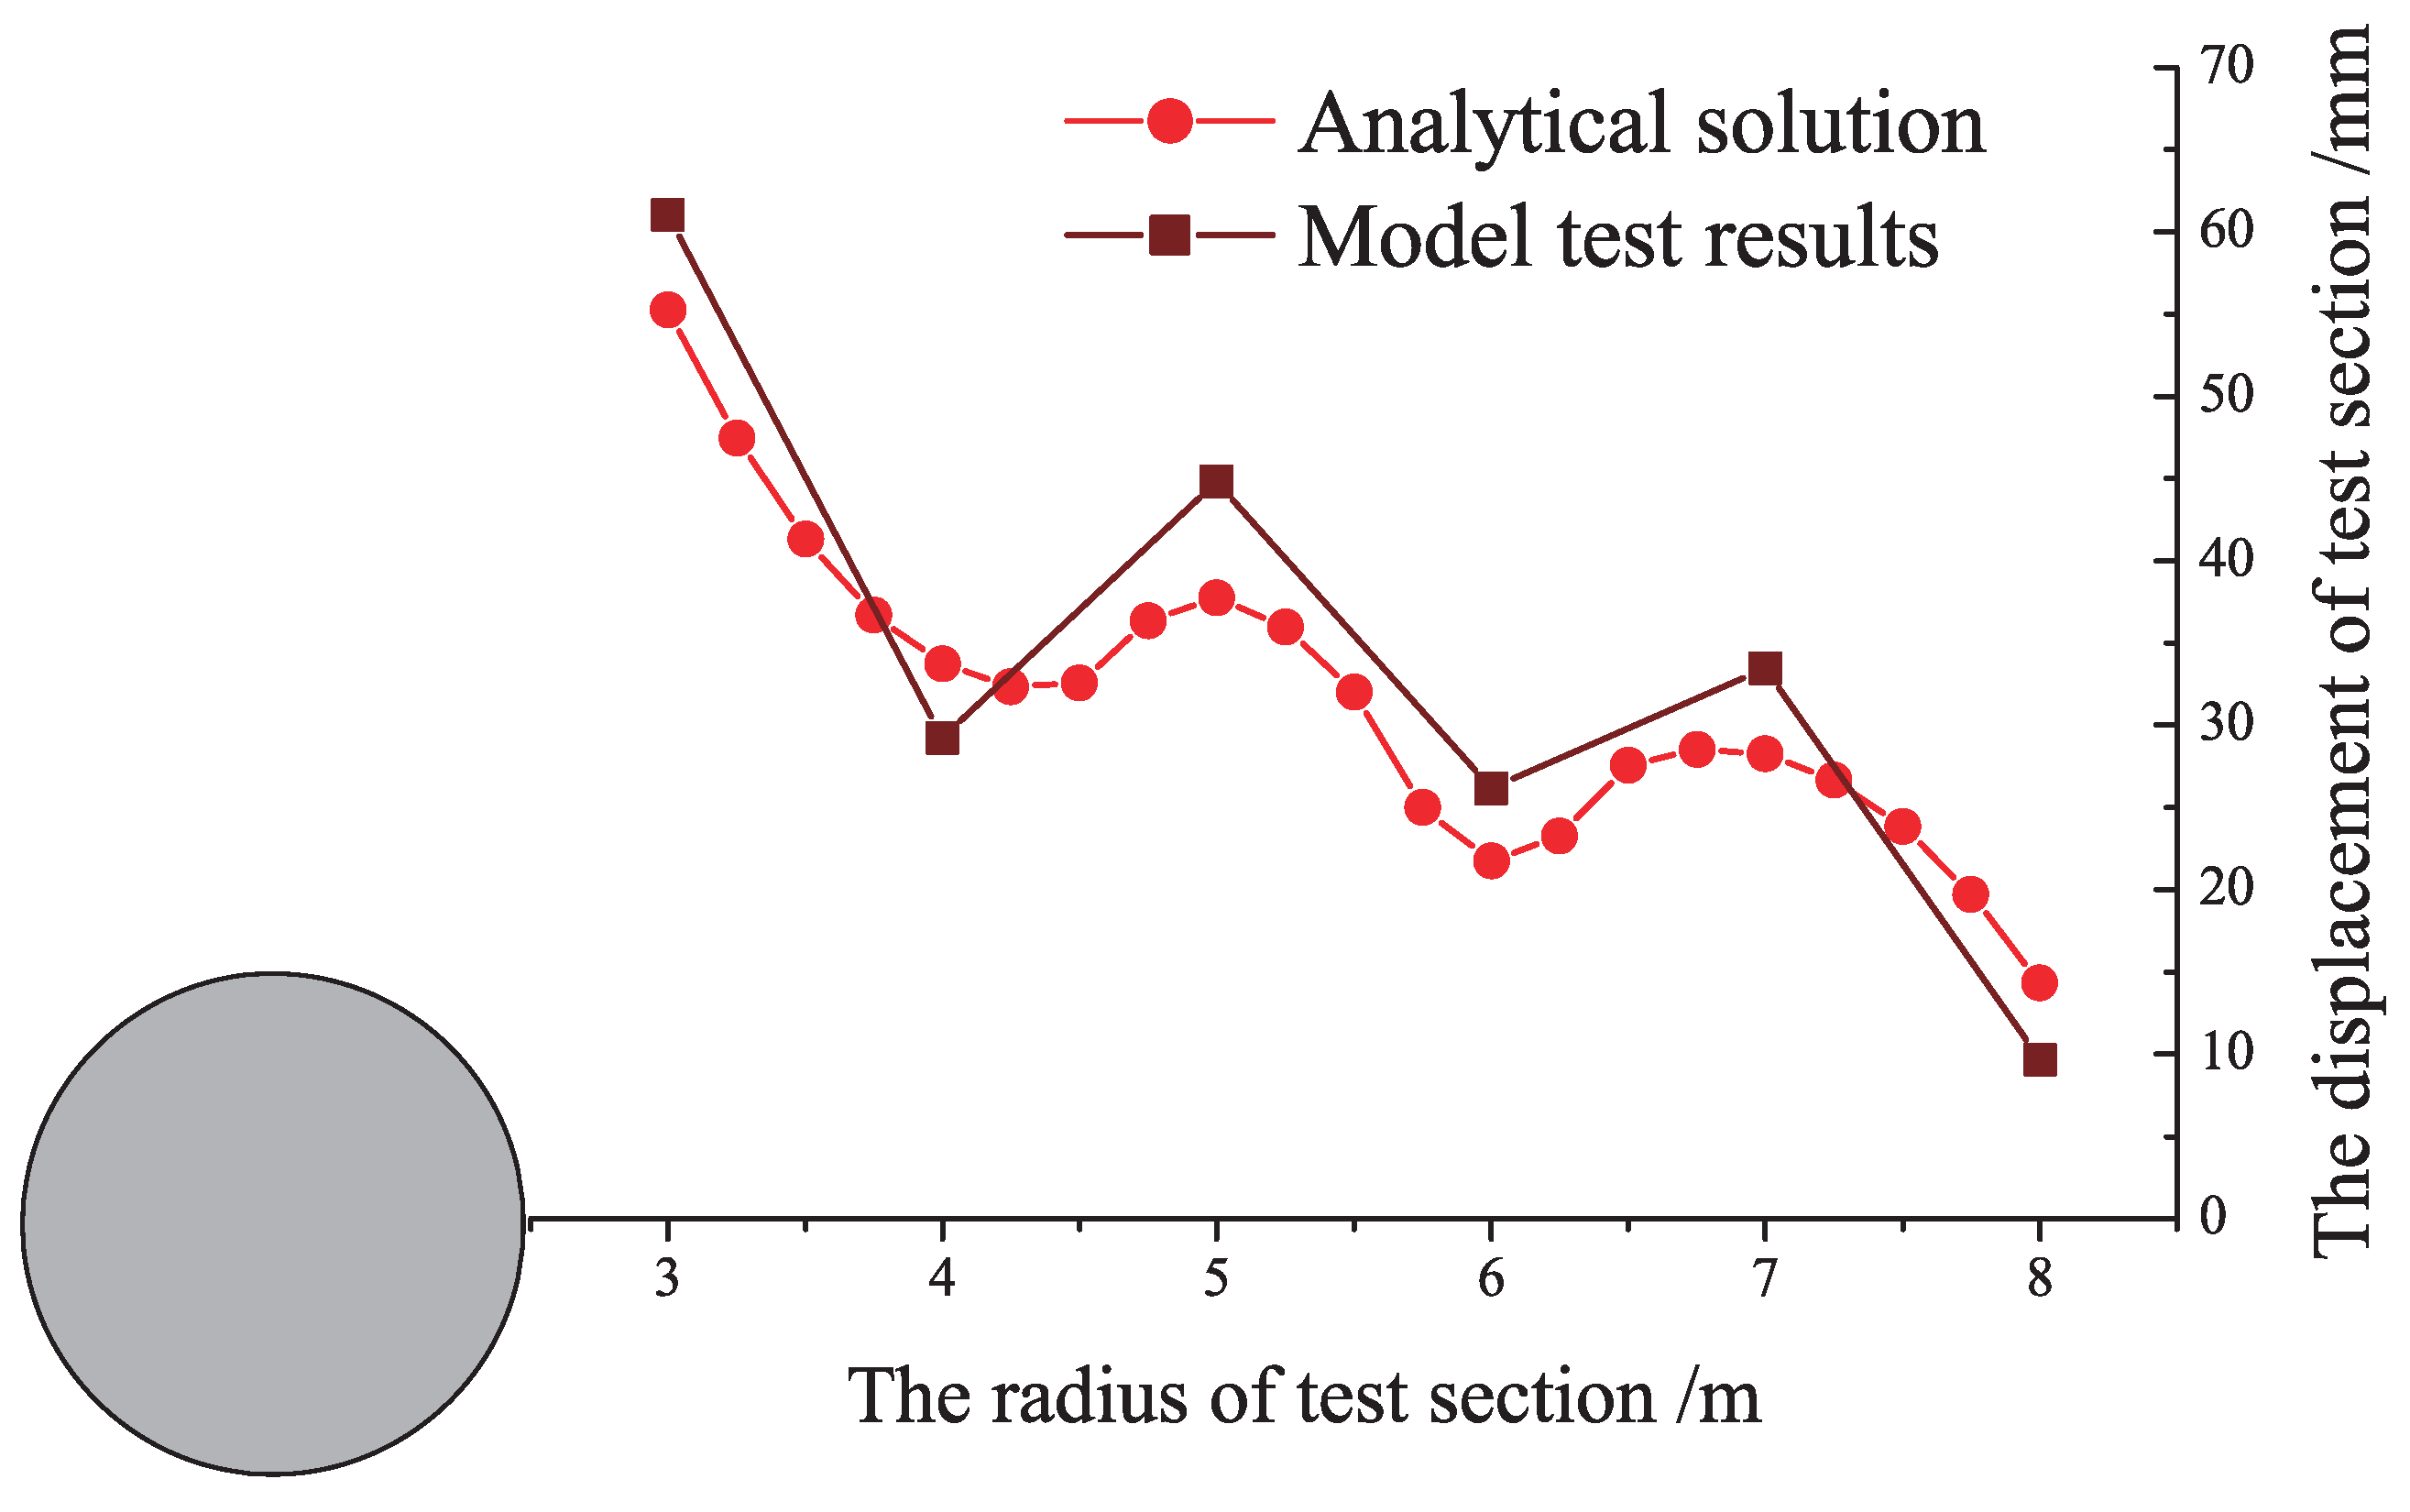
After substituting the above parameters into the elastoplastic damage softening constitutive equation (Equation (6)), equilibrium equation (Equation (15)) and the initial and boundary conditions for solving the motion equation (Equations (16)–(18)), the analytical solutions of radial displacement and stresses was obtained by the ODE45 function in Matlab software. Then the failure mechanism of roadway can be analysed by the energy failure criterion (Equations (26) and (29)). The comparative analysis is done with the model test data in Table 4. At the same time, the contrastive curves of radial displacement is shown in Figure 13.
According to the radial displacement curve (Figure 13), the radial displacement of surrounding rock shows the oscillation attenuation law. In this attenuation law, the wave peak and trough values appear alternately, and the oscillation amplitude decreases gradually with the increase of the distance from wall. This variation law is consistent with the radial displacement obtained by the model test. In addition, the analytical solution is basically consistent with the model test results.
Based on Equations (26) and (29), the fractured zone distribution can be obtained by the energy failure criterion. To verify the analytical solution, the range of fractured zone obtained from model test and analytical solution are all presented in Table 5.
As shown in Table 5, there are four discontinuous fractured zones in the surrounding rock mass. The first fractured zone near roadway wall is tension fractured zone, the remaining three are damage fractured zone. The depth of fractured zone obtained by model test is 8.10 m, and the depth of fractured zone obtained by analytical solution is 8.30 m. Four discontinuous fractured zones are obtained by means of analytical solution and model test results, and the range and average radius of fracture zone are basically the same.
In summary, the radial displacement and fractured zone distribution of surrounding rock obtained by analytical solution are basically consistent with the experimental results obtained by 3D geomechanical model test. By means of parse, the oscillation law of radial displacement is obtained, and the discontinuous fractured zones of surrounding rock are obtained. The reliability of zonal disintegration elastoplastic damage model is verified effectively.
7. Zonal Disintegration Energy Mechanism Analysis
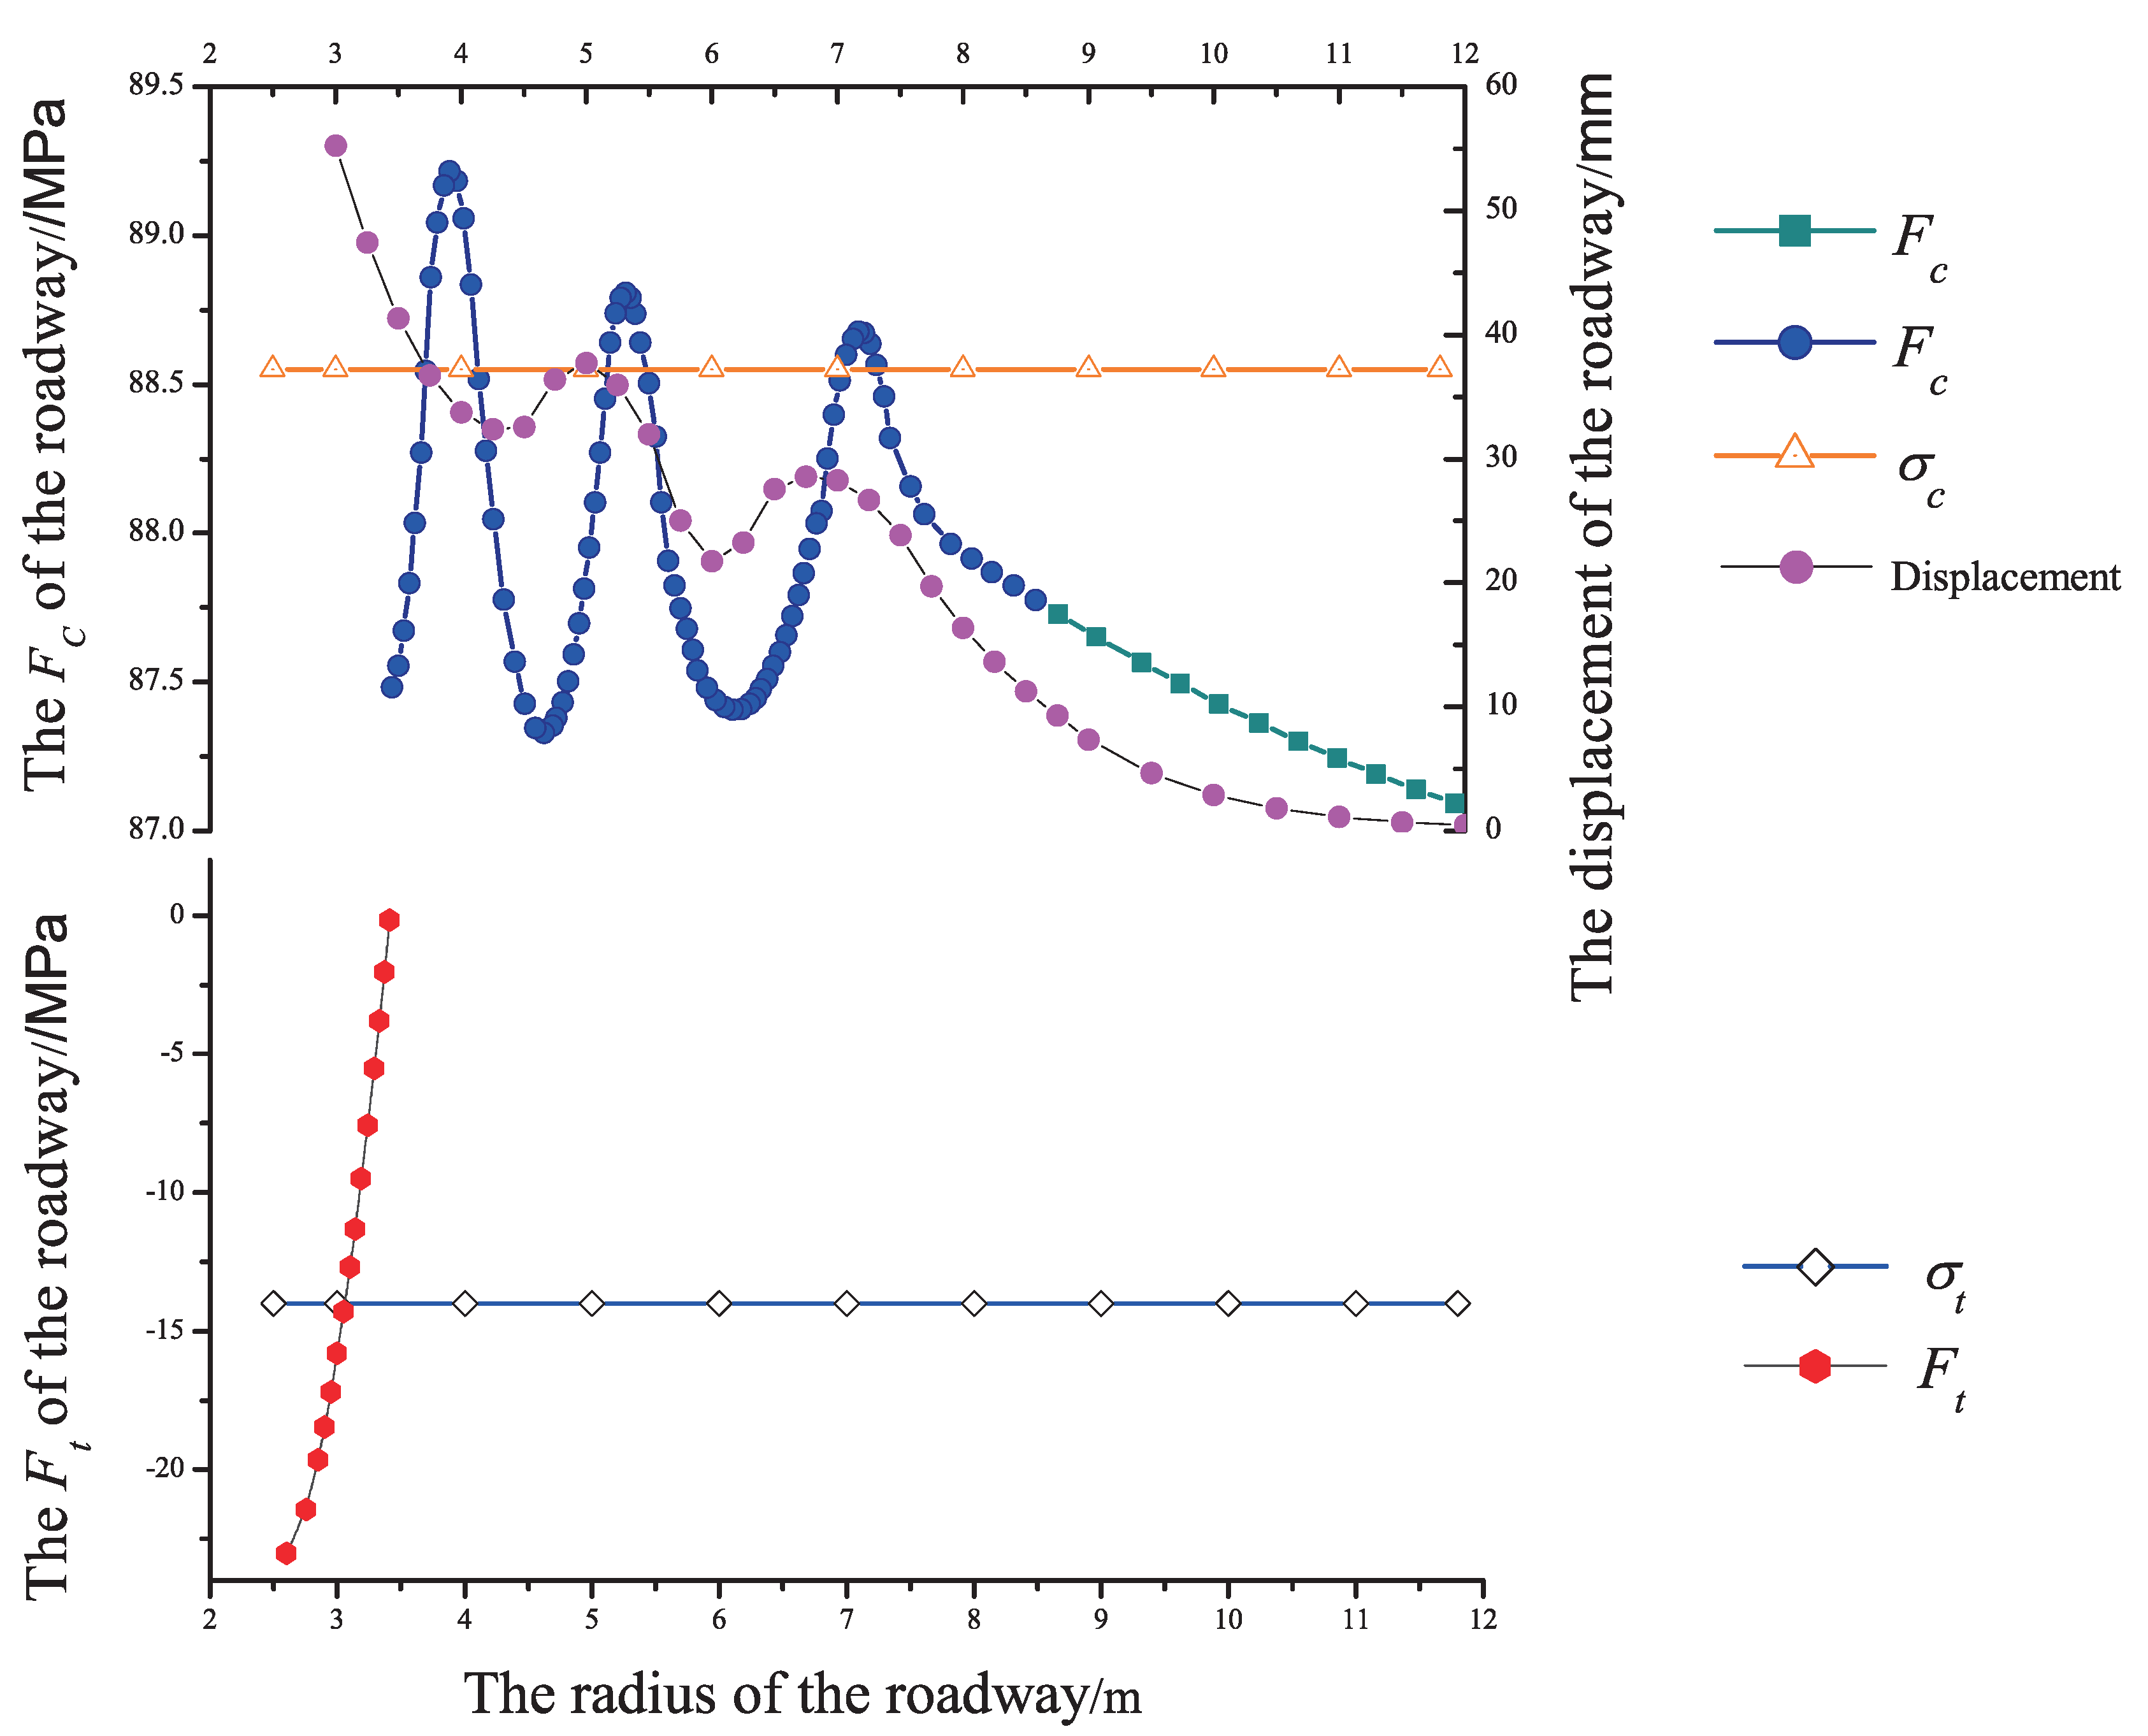
Figure 14 shows that the surrounding rock near the roadway wall is changed from the three-direction stress state to the two-direction stress state after excavation. The appearance of the free surface causes the surrounding rock to expand in this direction, the displacement increases and the radial tensile stress generates, the aggregated energy of surrounding rock is in the most unstable state. When , the elastic strain energy stored in the surrounding rock is released and converted into the surface energy needed to form the crack, the surrounding rock will be destroyed in the direction of the maximum tensile stress (radial tensile stress) and generated the circular fractured zone, meanwhile, the analytical solution of radial displacement. The destruction of the surrounding rock caused secondary unloading of the internal rock mass, and the elastic strain energy continued to be formed and stored in the completed surrounding rock area. It can be seen from Figure 8 that at the radius of m, the radial stress of the surrounding rock is turned into pressure stress and the surrounding rock is under three-dimension compression, the elastic strain energy in the surrounding rock continues to accumulate. When , that is, the accumulated energy satisfies the energy failure criterion, the energy will be released along the direction of the minimum principal stress (radial compress stress), and created a new fractured zone. Between the two fractured zones, the elastic strain energy stored in the surrounding rock cannot reach the destruction conditions of the rock mass and form a relatively complete area. This process is followed circularly and progressively, and the zonal disintegration phenomenon occurs finally (Figure 15). In the tensile range, the and displacement shows the monotonic change, in this compress range, the and displacement of surrounding rock show the oscillation law, in which the wave peak and wave trough appear alternately. It is precisely because of the oscillation law, the discontinuous localization failure zones appear in the surrounding rock. In the fractured zone of surrounding rock, the radial displacement is wave peak value. However, in the middle of the two adjacent fractured zones, the radial displacement of surrounding rock is wave trough value. The oscillation law of and displacement in deep surrounding rock is the key reason of zonal disintegration.
8. Conclusions
- Taking the deep roadway of Dingji coal mine in China’s Huainan coal mine as engineering background, a 3D geomechanical model test is carried out relying on the analogical materials and high stress loading test system. The zonal disintegration phenomenon is observed, and the oscillation law of displacements are measured.
- The zonal disintegration in deep rock mass is a special and regular strain localization phenomenon. The influence of strain gradient should be considered. Based on the strain gradient theory and continuum damage mechanics, the zonal disintegration elastoplastic damage model is established. Based on the principle of energy dissipation and release, the energy failure criteria for zonal disintegration of surrounding rock in deep roadway are established, and the mechanical mechanism and energy evolution law for the occurrence of zonal disintegration are accurately described.
- The analytical solution for zonal disintegration is proposed and consistent with the 3D geomechanical model test. The reliability of zonal disintegration elastoplastic damage moddel and zonal disintegration energy failure criterion are verified effectively.
Author Contributions
Q.G. and Q.Z. participated in theoretical derivation; X.Z. and Q.Z. conceived and designed the experiments; Q.G. performed the experiments; L.Z. analyzed the data; Q.G. wrote the paper, assisted by all other authors.
Funding
The research was financially supported by the Key Research Development Project of China (No.2016YFC0401804-03), the Taishan Scholars Project Fund of Shandong Province, the Natural Science Foundation Project of China (No.41772282), the Preliminary Research Project of the Underground Laboratory for the Geological Disposal of High-level Radioactive Waste (No. YKKY-J-2015-25).
Conflicts of Interest
The authors declare no conflict of interest.
References
- Shemyakin, E.I.; Fisenko, G.L.; Kurlenya, M.V.; Oparin, V.N.; Reva, V.N.; Glushikhin, F.P.; Rozenbaum, M.A.; Tropp, A.; Kuznetsov, Y.S. Zonal disintegration of rocks around underground workings, part 1: Data of in situ observations. Sov. Min. 1986, 3, 157–168. [Google Scholar] [CrossRef]
- Zhang, T.K.; Pan, Y.S.; Qian, Q.H. Non-Euclidean model for zonal failure of deep roadway under the permeation action. J. China Coal Soc. 2017, 11, 2842–2851. [Google Scholar]
- Qian, Q.; Zhou, X.; Xia, E. Effects of the axial in situ stresses on the zonal disintegration phenomenon in the surrounding rock masses around a deep circular tunnel. J. Min. Sci. 2012, 2, 276–285. [Google Scholar] [CrossRef]
- Qi, C.Z.; Li, K.R.; Bai, J.P.; Chanyshev, A.I.; Liu, P. Strain Gradient Model of Zonal Disintegration of Rock Mass near Deep-Level Tunnels. J. Min. Sci. 2017, 1, 21–33. [Google Scholar] [CrossRef]
- Zhou, X.P.; Bi, J. Zonal disintegration mechanism of cross-anisotropic rock masses around a deep circular tunnel. Theor. Appl. Fract. Mech. 2012, 57, 49–54. [Google Scholar] [CrossRef]
- Zuo, Y.; Xu, T.; Zhang, Y.; Zhang, Y.; Li, S.; Zhao, G.; Chen, C. Numerical study of zonal disintegration within a rock mass around a deep excavated tunnel. Int. J. Geomech. 2011, 4, 471–483. [Google Scholar] [CrossRef]
- Jia, P.; Zhu, W.C. Mechanism of zonal disintegration around deep underground excavations under triaxial stress insight from numerical test. Tunn. Undergr. Space Technol. 2015, 48, 1–10. [Google Scholar] [CrossRef]
- Zhang, Q.Y.; Zhang, X.T.; Wang, Z.C.; Xiang, W.; Xue, J.H. Failure mechanism and numerical simulation of zonal disintegration around a deep tunnel under high stress. Int. J. Rock Mech. Min. Sci. 2017, 2, 344–355. [Google Scholar] [CrossRef]
- Gu, J.; Gu, L.; Chen, A.; Xu, J.; Wei, C. Model test study on mechanism of layered farcture within surrounding rock of tunnels in deep stratum. Chin. J. Rock Mech. Eng. 2008, 27, 433–438. [Google Scholar]
- Zhang, Q.; Zhang, X.; Xiang, W.; Chen, X.; Cao, G.; Xu, X. Model test study of zonal disintegration in deep rock mass under different cavern shapes and loading conditions. Chin. J. Rock Mech. Eng. 2013, 8, 1564–1571. [Google Scholar]
- Polyzos, D.; Fotiadis, D.I. Derivation of mindlin’s first and second strain gradient elastic theory via simple lattice and continuum models. Int. J. Solids Struct. 2012, 3–4, 470–480. [Google Scholar] [CrossRef]
- Wang, X.B.; Pan, Y.S. Instability criterion of shear failure for rock specimen based on gradient-dependent plasticity. Chin. J. Rock Mech. Eng. 2003, 5, 747–750. [Google Scholar]
- Zhou, W.Y.; Yang, Q. Numerical Computational Methods for Rock Mechanics; China Electric Power Press: Beijing, China, 2005. [Google Scholar]
- Peng, R.; Ju, Y.; Wang, J.G.; Xie, H.; Gao, F.; Mao, L. Energy dissipation and release during coal failure under conventional triaxial compression. Rock Mech. Rock Eng. 2015, 2, 509–526. [Google Scholar] [CrossRef]
- Wei, D. Advances in fracture criteria of mixed model fracture in concrete. Mech. Eng. 2006, 6, 9–14. [Google Scholar]
- Nikolic, M.; Ibrahimbegovic, A.; Miscevic, P. Embedded discontinuity approach for representing mode I and mode II failure mechanisms. Int. J. Numer. Methods Eng. 2015, 8, 1507–1526. [Google Scholar] [CrossRef]
- Nikolic, M.; Ibrahimbegovic, A. Rock mechanics model capable of representing initial heterogeneities and full set of 3D failure mechanisms. Comput. Methods Appl. Mech. Eng. 2015, 290, 209–227. [Google Scholar] [CrossRef]
- Xie, H.P.; Peng, R.D.; Ju, Y. Study On energy analysis of rock failure. Chin. J. Rock Mech. Eng. 2005, 24, 2603–2608. [Google Scholar]
- Zhang, Q.Y.; Li, S.C.; Guo, X.H. Research and development of new typed cementatious geotechnical similar material for iron crystal sand and its application. Rock Soil Mech. 2008, 8, 2453–2463. [Google Scholar]
- Wang, C.; Zhang, Q.; Xiang, W. Physical and numerical modeling of the stability of deep caverns in tahe oil field in China. Energies 2008, 10, 769. [Google Scholar] [CrossRef]
- Zhang, Q.; Wen, X.; Yue, Z.; Chao, W.; Liu, C. Development and application of ultra high pressure 3d loading model test system with intelligent numerical control function. Chin. J. Rock Mech. Eng. 2016, 3, 483–493. [Google Scholar]
- Zhang, X.T.; Zhang, Q.Y.; Wen, X.; Qiang, G.; Yuan, S.B.; Chao, W. Model test study of zonal disintegration in deep layered jointed rock mass. Rock Soil Mech. 2014, 8, 2247–2254. [Google Scholar]
- Ostojastarzewski, M. Lattice models in micromechanics. Appl. Mech. Rev. 2002, 55, 35–60. [Google Scholar] [CrossRef] [Green Version]
- Mindlin, R.D. Micro-structure in linear elasticity. Arch. Ration. Mech. Anal. 1964, 1, 51–78. [Google Scholar] [CrossRef]
- Nikolić, M.; Karavelić, E.; Ibrahimbegovic, A.; Miščević, P. Lattice Element Models and Their Peculiarities. Arch. Comput. Methods Eng. 2017, 4, 1–32. [Google Scholar] [CrossRef]
- Mindlin, R.D. Second gradient of strain and surface-tension in linear elasticity. Int. J. Solids Struct. 1965, 4, 417–438. [Google Scholar] [CrossRef]
- Zhao, J.; Pedroso, D. Strain gradient theory in orthogonal curvilinear coordinates. Int. J. Solids Struct. 2008, 11, 3507–3520. [Google Scholar] [CrossRef]
- Fleck, N.; Hutchinson, J. A phenomenological theory for strain gradient effects in plasticity. J. Mech. Phys. Solids 1993, 12, 1825–1857. [Google Scholar] [CrossRef]
- Moës, N.; Belytschko, T. Extended finite element method for cohesive crack growth. Eng. Fract. Mech. 2002, 7, 813–833. [Google Scholar] [CrossRef]
- Simo, J.C.; Oliver, J.; Armero, F. An analysis of strong discontinuities induced by strain-softening in rate-independent inelastic solids. Comput. Mech. 1993, 5, 277–296. [Google Scholar] [CrossRef]
- Zhou, Y.Q.; Sheng, Q.; Leng, X.L.; Xiao, D.F.; Long, F.L. Statistical constitutive model of elastic damage for rock considering residual strength and threshold. J. Yangtze River Sci. Res. Inst. 2016, 1, 125–137. [Google Scholar]
- Geers, M.G.D. Experimental analysis and computational modelling of damage and fracture. Tech. Univ. 2016, 4, 593–617. [Google Scholar]
- Fang, Z.; Harrison, J.P. Application of a local degradation model to the analysis of brittle fracture of laboratory scale rock specimens under triaxial conditions. Int. J. Rock Mech. Min. Sci. 2002, 4, 459–476. [Google Scholar] [CrossRef]
- Yang, G. An Introduction to Elastic-Plastic Mechanics; People’s Education Press: Beijing, China, 2004. [Google Scholar]
- Xie, H.P.; Ju, Y.; Li, L.Y. Criteria for strength and structural failure of rocks based on energy dissipation and energy release principles. Chin. J. Rock Mech. Eng. 2005, 17, 3003–3010. [Google Scholar]
Figure 1.
The Oktyabrskil Mine with a depth of 957 m.

Figure 2.
The zonal disintegration phenomenon of model test. (a) Zonal disintegration phenomenon of pre-set model roadway; (b) Zonal disintegration phenomenon of triaxial loading geomechanical model roadway.
Figure 2.
The zonal disintegration phenomenon of model test. (a) Zonal disintegration phenomenon of pre-set model roadway; (b) Zonal disintegration phenomenon of triaxial loading geomechanical model roadway.

Figure 3.
Component diagram of similar material.

Figure 4.
Model roadway condition and loading mode.

Figure 5.
Layout scheme of displacement measurement. (a) Layout of the model monitoring section; (b) Arrangement of the measuring element.
Figure 5.
Layout scheme of displacement measurement. (a) Layout of the model monitoring section; (b) Arrangement of the measuring element.
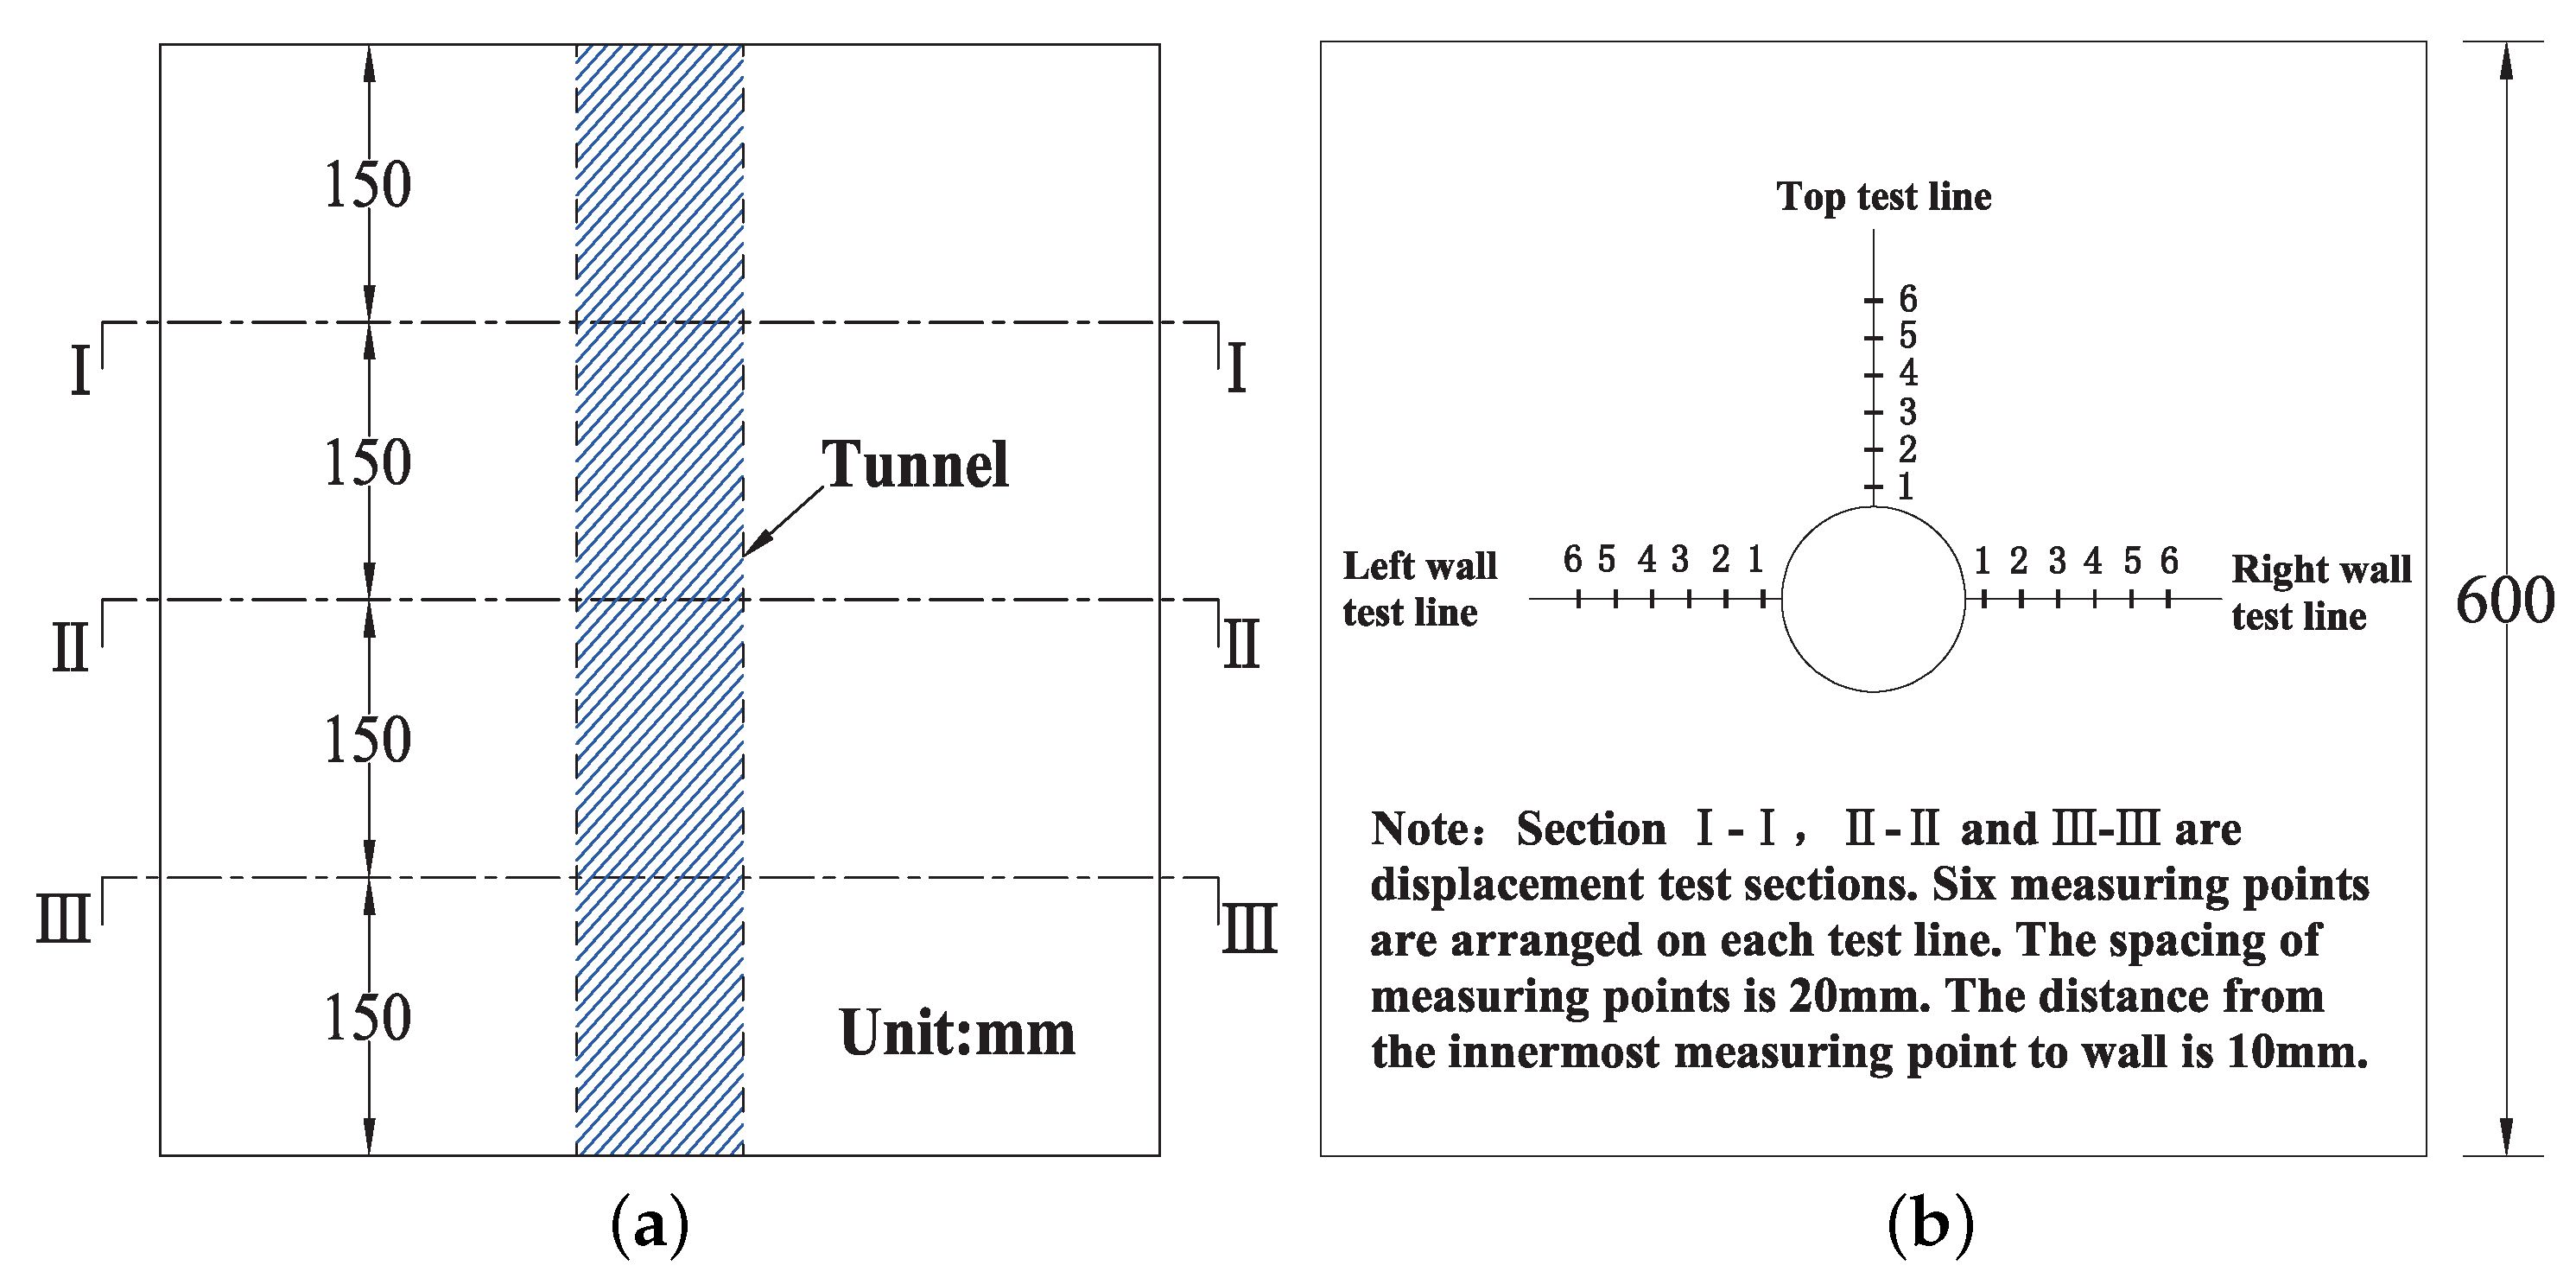
Figure 6.
High-stress true three-dimensional loading model test system.

Figure 7.
Test procedure of the model.

Figure 8.
The zonal disintegration phenomenon of geomechanical model test. (a) Perpendicular to the roadway axis; (b) Along the direction of the roadway axis.
Figure 8.
The zonal disintegration phenomenon of geomechanical model test. (a) Perpendicular to the roadway axis; (b) Along the direction of the roadway axis.

Figure 9.
Radial displacement curve of roadway monitoring points.

Figure 10.
Relation curve of stress and strain relationship of deep rock mass.

Figure 11.
The calculation model of the deep roadway considering the axial stress.

Figure 12.
Energy conversion relationship in deep rock mass.

Figure 13.
The contrastive curve of radial displacement.

Figure 14.
Relation curve of and radial displacement of deep rock mass.

Figure 15.
The energy mechanism of zonal disintegration of rock mass.


Table 1.
Physical and mechanical parameters of medium sandstone from the coal mine.
| Unit Weight | Deformation Modulus | Cohension | Friction Angle | Compression Strength | Poisson Ratio |
|---|---|---|---|---|---|
| (KN·m) | (MPa) | (MPa) | () | (MPa) | |
| 26.2 | 12,970 | 10.00 | 43 | 88.55 | 0.268 |
Table 2.
Physical and mechanical parameters of model material.
| Unit Weight | Deformation Modulus | Cohension | Friction Angle | Compression Strength | Poisson Ratio |
|---|---|---|---|---|---|
| (KN·m) | (MPa) | (MPa) | () | (MPa) | |
| 25.9–26.5 | 251–270 | 0.18–0.22 | 40–45 | 1.70–1.90 | 0.24–0.28 |
Table 3.
Radial displacements of model roadway.
| Test Sections | 1 | 2 | 3 | 4 | 5 | 6 | |
|---|---|---|---|---|---|---|---|
| Top (mm) | I | 60.45 | 29.50 | 42.55 | 27.25 | 31.75 | 7.75 |
| II | 58.05 | 30.65 | 41.25 | 27.50 | 33.95 | 8.35 | |
| III | 56.20 | 29.75 | 39.95 | 24.50 | 31.15 | 7.95 | |
| Left wall (mm) | I | 65.25 | 30.75 | 51.45 | 24.50 | 33.75 | 8.25 |
| II | 63.25 | 31.35 | 54.05 | 25.20 | 37.10 | 7.60 | |
| III | 68.50 | 30.15 | 56.05 | 24.05 | 35.10 | 7.65 | |
| Right wall (mm) | I | 57.25 | 25.75 | 37.75 | 27.75 | 32.25 | 13.05 |
| II | 60.65 | 28.05 | 41.55 | 29.40 | 34.50 | 13.15 | |
| III | 59.55 | 27.30 | 38.85 | 25.25 | 31.60 | 13.20 | |
Table 4.
The comparison of radial displacement.
| Value Type | The Measuring Point | |||||
|---|---|---|---|---|---|---|
| 1 | 2 | 3 | 4 | 5 | 6 | |
| Model test results | 61.02 | 29.25 | 44.83 | 26.15 | 33.46 | 9.69 |
| Analytical solution | 55.23 | 33.72 | 37.76 | 21.73 | 28.27 | 14.35 |
Table 5.
The comparison of radial displacement.
| Number of Fractured Zone | Model Test Results | Analytical Solution | ||
|---|---|---|---|---|
| Range of Fractured | Average | Range of Fractured | Average | |
| Zone (m) | Radius (m) | Zone (m) | Radius (m) | |
| 1 | 2.50–3.75 | 3.13 | 2.50–3.06 | 2.78 |
| 2 | 4.30–4.75 | 4.52 | 4.72–5.16 | 4.94 |
| 3 | 5.95–6.25 | 6.10 | 6.16–6.44 | 6.30 |
| 4 | 7.90–8.10 | 8.00 | 8.14–8.30 | 8.22 |
© 2018 by the authors. Licensee MDPI, Basel, Switzerland. This article is an open access article distributed under the terms and conditions of the Creative Commons Attribution (CC BY) license (http://creativecommons.org/licenses/by/4.0/).
Share and Cite
MDPI and ACS Style
Gao, Q.; Zhang, Q.; Zhang, X.; Zhang, L. Geomechanical Model Test and Energy Mechanism Analysis of Zonal Disintegration in Deep Surrounding Rock. Geosciences 2018, 8, 237. https://doi.org/10.3390/geosciences8070237
AMA Style
Gao Q, Zhang Q, Zhang X, Zhang L. Geomechanical Model Test and Energy Mechanism Analysis of Zonal Disintegration in Deep Surrounding Rock. Geosciences. 2018; 8(7):237. https://doi.org/10.3390/geosciences8070237
Chicago/Turabian StyleGao, Qiang, Qiangyong Zhang, Xutao Zhang, and Longyun Zhang. 2018. "Geomechanical Model Test and Energy Mechanism Analysis of Zonal Disintegration in Deep Surrounding Rock" Geosciences 8, no. 7: 237. https://doi.org/10.3390/geosciences8070237
Note that from the first issue of 2016, this journal uses article numbers instead of page numbers. See further details here.