Article

Development of Method for the Measurement of Dermal Exposure on a Lifelike Cow Dummy to Assess the Risk of Using a Urease Inhibitor (Atmowell®) to Reduce NH3 Emissions in Cattle Farming

1
Julius Kühn-Institute (JKI), Federal Research Centre for Cultivated Plants, Institute for Application, 38108 Braunschweig, Germany
2
Institute of Agricultural Engineering, Max-Eyth-Straße 6, Kiel University, 24118 Kiel, Germany
*
Author to whom correspondence should be addressed.
Environments 2024, 11(3), 47; https://doi.org/10.3390/environments11030047
Submission received: 1 November 2023 / Revised: 20 December 2023 / Accepted: 30 January 2024 / Published: 29 February 2024

Abstract

:
Up to 58% of NH3 emissions can be reduced through the use of the urease inhibitor Atmowell® in cattle farming. Automated manure scraper and drag hose systems should be used to apply urease inhibitors (UIs) to stable floors. Proof of safe use is also needed. A risk assessment of the urease inhibitor PPDA was conducted utilising estimated and calculated exposure data along with established and verified model calculation tools. Risk assessment models can be improved using measured dermal exposure data. The fluorescent dye pyranine and a Tyvek® collector were used to measure exposure. Tyvek® was attached to a lifelike cow dummy. Regarding the drag hose system, two worst-case scenarios were considered: over the cow and passing the cow. Regarding the robot application system, a 0 m frontal scenario was considered. The over the cow scenario exhibited the highest dermal exposure, with 1.5 mg of PPDA/cow per application run. The robot scenario exhibited the smallest amount, with 0.8 mg of PPDA/cow per application run. The risk of using PPDA was already excluded by model calculation tools in a risk assessment. Compared with the estimated and calculated dermal exposure values, the measured dermal exposure levels were reduced by a factor of two to six.

1. Introduction

In total, 95% of ammonia emissions in Germany result from agriculture, and excessive ammonia (NH3) is emitted into the environment [1]. These emissions result mainly from animal husbandry, especially manure management [2,3]. Ammonia and ammonium produced after conversion cause considerable damage to terrestrial and aquatic ecosystems through acidification and eutrophication (nutrient enrichment) [1]. Human health and animal health are also harmed by ammonia emissions [4]. As a result, Germany signed Directive 2016/2284 to reduce ammonia emissions by 5% every year from 2020 to 2029 and by 29% beginning in 2030 to protect the environment and both human and animal health from additional harm caused by NH3 emissions [5]. Adding urease inhibitors to floors where faeces and urine meet can significantly reduce ammonia volatilisation [6,7,8,9]. The application of a urease inhibitor with an automatic backpack sprayer placed on a rollator led to significant reductions of up to 58% in investigations of two naturally ventilated dairy barns [6]. To implement Atmowell® in cattle barns, different application techniques (e.g., robotic manure scrapers and drag hose systems) can be used to automate the application of a urease inhibitor (UI) on a stable floor. There is no practical use for urease inhibitors in animal husbandry. Proof of safe use is also needed to rule out a possible risk resulting from UI use for animals and humans. Therefore, dermal exposure data are needed. To estimate exposure to plant protection products, different risk assessment models can be used, although they are usually based on very conservative data. The external exposure of farm animals to biocidal active substances can be evaluated accordingly via the use of the BfR calculation tool [10]. However, the specific use of a given UI using the abovementioned application techniques is not considered here. To represent reality more accurately and improve risk assessment models, measured exposure data can be used [10]. Measurement of potential dermal exposure is a key component of pesticide risk assessment [11]. To measure drift as well as dermal and inhalation exposure levels for agricultural risk assessment, fluorometry represents a suitable methodological approach. In this process, plant protection products (PPPs) can be replaced by a fluorescent dye, after which the adopted collectors are washed off. A fluorometer can be used to measure dye concentrations [12,13], which can be converted into PPP quantities. In [14,15], dermal exposure to pyranine dye was reported for mannequins dressed in Tyvek® coveralls. Tyvek® also had promising results in laboratory studies [16] combined with the fluorescent dye pyranine, as it exhibited a high recovery rate, suitable storability, and low degradation under the influence of UV radiation. Another advantage is that Tyvek® comes in various sizes, which allows for attachment to larger bodies.
Pyranine 120% (TER Chemicals) has been used for several years at the Julius Kühn Institute (JKI) as a standard method for measuring direct pesticide drift in the field when assessing plant protection devices (Julius Kühn-Institut) [17]. This dye has a low detection limit [18], is water soluble, and can be removed from a variety of surfaces, particularly plastic surfaces. This process is characterised by a high recovery rate on artificial targets, Petri dishes, and paper patches [13]. In addition, it was found that the drift behaviour of a mixture of pyranine + Atmowell® did not differ from that of a pure pyranine solution. In these studies, the Atmowell® solution was substituted with a pyranine solution without significant effects on the exposure measurement results [19]. The use of pyranine combined with Tyvek® as a collector is an effective methodological approach for detecting the dermal exposure of lifelike cow dummies. This paper aimed to methodically answer the following research questions:
-
Is using Tyvek® in combination with pyranine a reproducible method for detecting dermal exposure on a lifelike cow dummy?
-
Is Tyvek® suitable for recording/quantifying dermal exposure with different application techniques and exposure levels?
-
How should the measured dermal exposure be assessed in terms of risk?

2. Materials and Methods

Several experimental trials were conducted to develop methods for measuring dermal exposure involving a lifelike cow dummy. First, animal behaviour studies were performed under practical conditions to obtain an overview of the possible worst-case scenarios involving the drag hose system. Afterwards, with the help of video analysis, the maximum possible exposure in a worst-case scenario of the drag hose system was first calculated using the number of nozzles, the flow rate, and the duration of contact with the lifelike cow dummy. Finally, dermal exposures were measured on a lifelike cow dummy under practical conditions using different worst-case scenarios. All methods and their associated materials are explained in detail below.

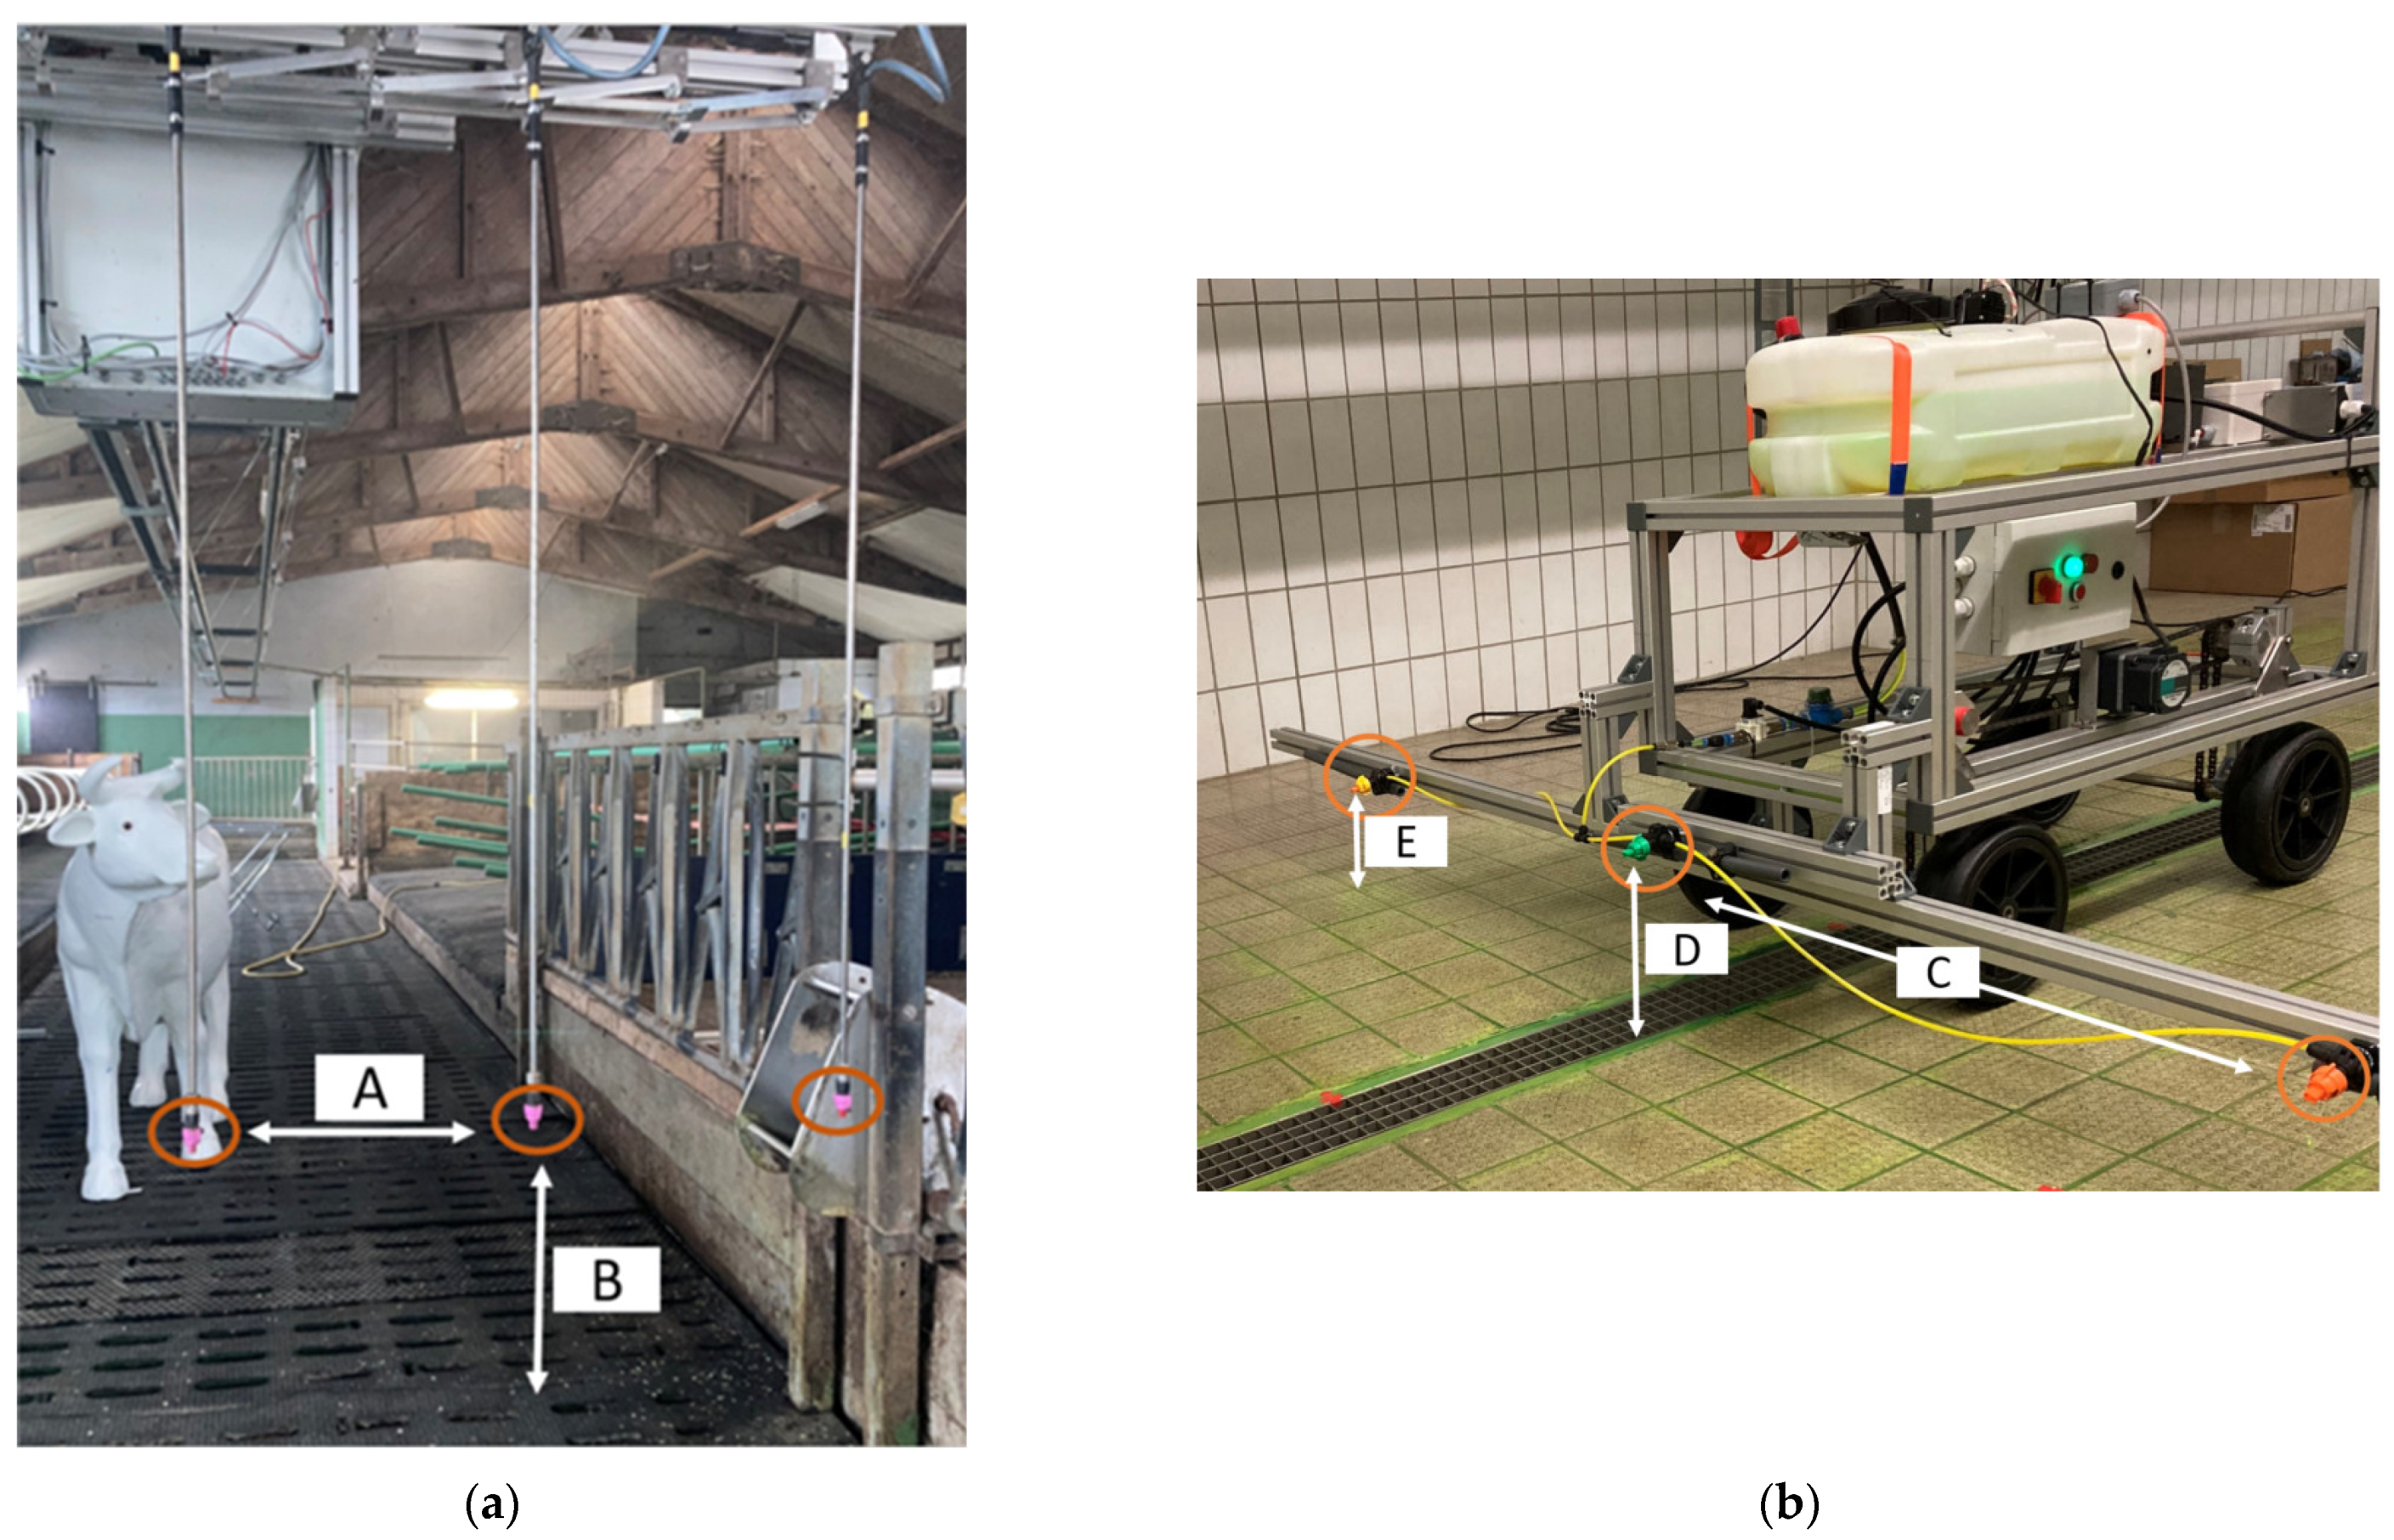
2.1. Application Techniques

Different application techniques were considered depending on the experimental trial. The following application techniques were used:

2.1.1. Drag Hose System

Five metal drag hoses were fixed to a spray bar on the ceiling with a spacing of 50 cm. There were nozzles directed downwards at the end of each drag hose (Figure 1a). The target distance from the ground was 90 cm. The spray liquid was sprayed at a constant pressure of 2 bar and a speed of 1 km/h (Table 1). This technique was used in all the experimental trials.

2.1.2. Robot Dummy

A manure removal robot was pulled over the stable floor by a rail system in later practical applications. However, in the exposure measurements, a robot dummy (constructed by Kiel University, Kiel, Germany) was used for easy handling. The robot dummy entailed the use of the same parameter settings as those of the prototype in the practical applications (Table 1). The spray liquid was sprayed onto the ground at a pressure of 3 bar using an AirMix 110-01 nozzle at the edges (20 cm target area distance) and an AirMix 110-015 nozzle at the centre (with a target area distance of 28 cm). The nozzles were angled forwards at approximately 80°. The three nozzles exhibited a spacing of 91 cm. The robot was operated at a speed of 0.24 km/h. Table 1 provides all the parameter settings of the two application techniques. In contrast to the drag hose system, this technique was only used in the practical trials for measuring dermal exposure on lifelike cow dummies (Figure 1b).

2.2. Worst-Case Scenarios

Different scenarios were considered depending on the experiments. For exposure estimation via video analysis, the focus was on the over the cow scenario. This scenario, as well as the passing the cow scenario with the drag hose application technique, was considered in previous animal behaviour studies. During the exposure measurements, the 0 m frontal scenario of the robot dummy application technique was also considered. All three scenarios were chosen as examples of the maximum dermal exposure and could be considered worst-case scenarios:
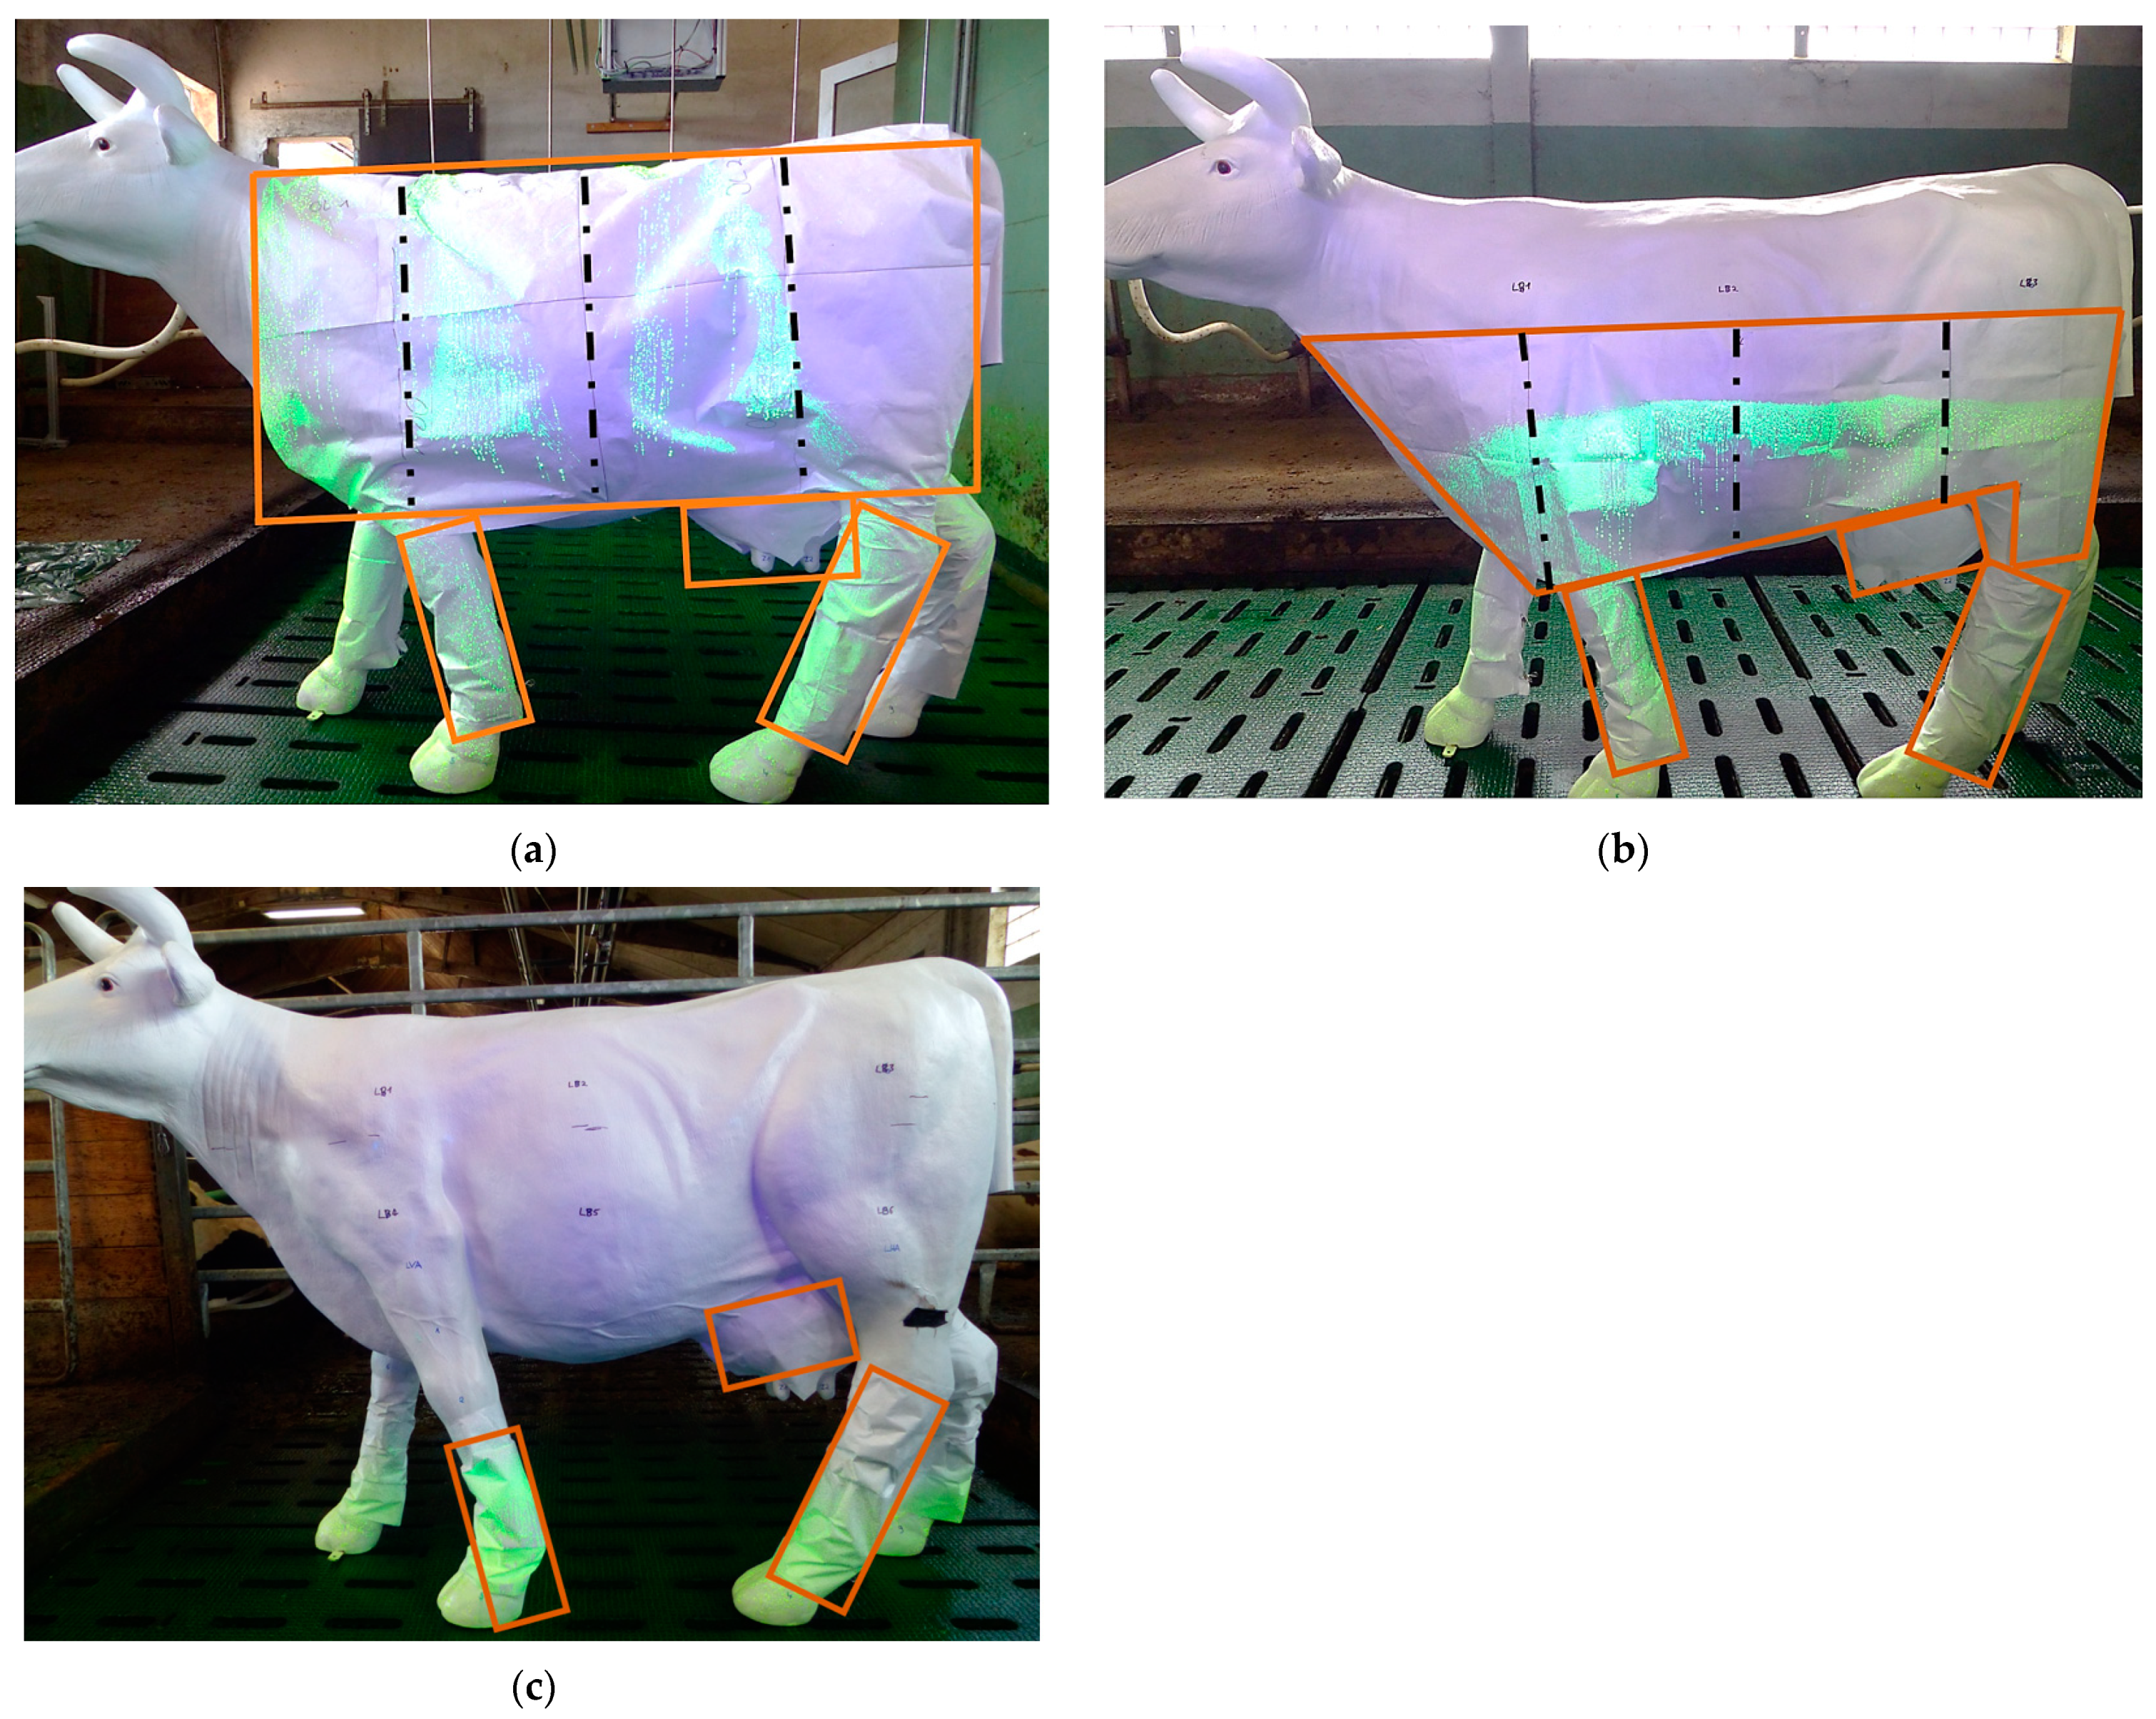
  • Over the cow scenario (Figure 2a): A lifelike cow dummy/real cow was placed/positioned transverse to the direction of travel of the application unit. The drag hoses were run over the lifelike cow dummy/real cow. This represented the maximum exposure with this application technique.
  • Passing the cow scenario (Figure 2b): A lifelike cow dummy/real cow was positioned lengthwise next to the application unit. The drag hoses were pulled past the cow. In contrast to the over the cow scenario, no exposure on the back of the cow dummy/real cow occurred.
  • The 0 m frontal scenario (Figure 2c): A lifelike cow dummy was positioned transverse to the direction of travel of the application unit. The robot dummy moved until it was directly in front of the lifelike cow dummy’s legs. This scenario was considered to determine the maximum exposure with this application technique.

2.3. Lifelike Animal Behaviour

Behavioural tests were conducted with real animals to determine how frequently the worst-case scenarios, i.e., over the cow and passing the cow, could occur during an application run with the drag hose system. For this purpose, the drag hose system was installed in a cubicle housing system (Stable A) (Table 2). Two cameras were arranged in the test group at various positions (Appendix A Figure A1) to monitor animal activity while the application was carried out for 77 days. The application system was run once per day at a pace of 1 km/h (early morning hours (03:45 am)). In the video recordings, direct interactions with animals were counted and categorised according to the over the cow and passing the cow worst-case scenarios in terms of frequency considering the total number of cows.

2.4. Lifelike Cow Dummy

A lifelike cow dummy (Figurenhalle, Enger, Germany) made of synthetic resin was used to estimate dermal exposure via video analysis and exposure measurements in the practical trials. The dummy had an easily washable surface, making it ideal for our experiments with pyranine dye, which was applied in the practical trials. The manufacturer specified the dimensions of the lifelike cow dummy as a length and height of approximately 210 and 150 cm, respectively. Additionally, the surface area of the lifelike cow dummy was measured using a laser scanner at the National Metrology Institute (PTB), yielding a surface area of 5.43 m2.

2.5. Estimation of Dermal Exposure—Video Analysis

The over the cow worst-case scenario was recorded with a camera to estimate the maximum dermal exposure level. The tests were performed under controlled conditions at the testing facility of the Institute of Agricultural Engineering at Kiel University, where the drag hose system was installed (Table 2). The lifelike cow dummy was oriented in the same way as in the later practical trials for this scenario (Figure 2a). The maximum volume of liquid that could be applied using the specified application rate of the nozzles (Table 1) was calculated using the number of nozzles and the duration of contact with the lifelike cow dummy. For simpler estimation, two situations in the over the cow scenario were considered separately. The video recorded for this purpose can be found at the following link: https://www.openagrar.de/receive/openagrar_mods_00091411 (accessed on 2 February 2024) [20]. On the one hand, the situation of nozzles meeting cows was observed (recording time: 2 to 4 s), while on the other hand, the situation of drag hoses pulled over cows also occurred (recording time: 5 to 10 s). The resulting maximum possible amount of liquid could then be converted into the amount of PPDA (mg) and the dermal systemic exposure dose (SED). These calculations are described below.

2.6. Trials under Practical Conditions

2.6.1. Pyranine Properties

Pyranine 120% (TER Chemicals) is a highly water-soluble yellow-green sodium salt powder. It has been used for several years as a tracer in nozzle and drift tests at the JKI due to its high fluorescence. Pyranine can be employed instead of a urease inhibitor. All exposure measurements in this study were performed at a concentration of 1 g/L.

2.6.2. Tyvek®

In this work, Tyvek® was used as a collector and was attached to a lifelike cow dummy. It consists of polyethylene and is available from its manufacturer (DuPont, Wilmington, DE, USA) in various sizes and shapes (coveralls and tarps). Tyvek® sheets were cut to the same dimensions as the lifelike cow dummy in this research. The segments were adapted according to the related scenario and expected exposure (Figure 3a–c).

2.6.3. Collector (Tyvek®) Cutting Patterns Depending on the Application Scenarios

Figure 3a–c show the Tyvek® cutting patterns for the three scenarios. The over the cow scenario showed the highest Tyvek® coverage of the model’s surface area. The robot dummy scenario required the smallest amount of Tyvek®, as only the feet and legs were exposed. The Tyvek® cutting patterns for the legs, udders, and feet were the same in all the scenarios. A slight difference existed between the two trial periods for the different scenarios. Additional foot patches were attached to the cow’s hooves in the practical experiment in August to improve the method after the first field trial in May.
The Tyvek® sheets used for the different exposure measurements were attached to the lifelike cow dummy using double-sided adhesive tape and/or staples. Table 3 provides the surface area covered with Tyvek® in each scenario.

2.6.4. Measuring Dermal Exposure

Dermal exposure was measured under practical conditions in the cubicle housing system in Stable A (Table 2). The drag hose system was installed above the stable floor. The robot dummy was mobile. Both application techniques could be used along the entire length of the stable floor (Appendix A Figure A1). All measurements were carried out using both application techniques (drag hose system and robot dummy), and the parameter settings are listed in Table 1. Two field trials were conducted in 2022 during separate seasons (May and August). In both trials, the worst-case scenarios suggested above were examined. In May, each scenario was repeated seven times, and in August, each scenario was repeated five times. The application distance of the drag hose system was 5 m from the stable floor, and the cow was placed 3 m from the starting point in both scenarios. The robot could spray a total distance of 3 m, with the lifelike cow dummy placed at the end of the application distance (Appendix A Figure A1).

2.6.5. Sample Handling and Analysis

For better sample handling during laboratory analysis, the upper body sheets were cut into smaller pieces in both drag hose scenarios (Figure 3a–b) after each application run. The leg, udder, and feet cuttings were removed directly from the lifelike cow dummy. All samples were stored in plastic bags and protected from light until analysis. After each application, the lifelike cow dummy was completely washed and dried to minimise the risk of cross-contamination. On the analysis day, plastic bags were filled with 1.5 L of deionised water and shaken for two minutes by hand. Subsequently, the material was left to rest for 10 min to ensure complete soaking. Then, 40 mL of the solution was collected and analysed using a fluorometer. A fluorometer (Shimadzu RF-6000, Shimadzu, Duisburg, Germany) was used to excite the samples at a wavelength of 405 nm for all sample treatments, and the emitted fluorescence was monitored at a wavelength of 515 nm. The correlation between the dye concentration and the fluorescence intensity was linear over the entire concentration range investigated [13]. The concentration (µg/L) was used as a reference.

2.7. Data Analysis

All data were analysed using MS Excel. Graphics and tables were also created in Microsoft Excel (2016). When assessing the exposure of users, workers, and bystanders to PPPs, the 95th percentile was used [21]. These guidelines were also applied to the data collected in this study in Microsoft Excel (2016). The dermal SED value was then calculated with Equation (1) using the 95th percentile as the baseline.

2.8. Calculation of the Amount of Applied PPDA and the Dermal Systemic Exposure Dose (SED)

To answer the last research question mentioned above, different established approaches and verified model calculation tools, such as (a) estimated maximum exposure data, (b) the ConsExpo modelling programme [22], and (c) the BfR calculation tool [23], were applied for risk assessment [20]. The dermal exposure values calculated via risk assessment were compared with the dermal exposure data measured in this study.
Under normal practical conditions, PPDA was applied to the stable floor at a concentration of 2.5 mg of PPDA (dissolved in 100 mL of water)/m². Since pyranine was used as a tracer for the urease inhibitor PPDA in the exposure measurements, the measured exposure data were converted to the equivalent amounts of PPDA. The measured exposure data of the pyranine–water mixture were given in µg/L on the fluorometer during analysis in the laboratory. For both sizes, the initial concentration of pyranine (1 g/L) and the application rate of PPDA in the barn (2.5 mg of PPDA in 100 mL per m²) were known, and the measured concentration was converted to the PPDA amount (mg) considering a factor of 40.
To calculate the margin of safety (MOS), which can be used to assess health risk [18], the systemic exposure dose (total SED = dermal SED + inhalation SED) is necessary. The dermal SED incorporates dermal exposure. Therefore, the dermal SED is a good way to compare the estimated (a) and measured (d) exposure values in this study with the calculated values from risk analysis [24] using models ((b) to (c) below). The dermal SED value can be calculated for the estimated and measured data using Equation (1), which is given in risk analysis [24]:
Dermal SED = PPDA mg × 0.02/500 kg,
According to the risk analysis, a value of 0.02 represents a dermal absorption factor of 2%, assuming that cow dermal absorption is equal to absorption by human skin. In this case, 500 kg refers to the weight of a cow. Various approaches were used to calculate the dermal SED:
(a)
Estimated maximum exposure data: Exposure was evaluated using a camera recording the number of nozzles and the duration of contact with the lifelike cow dummy during application via the drag hose system. The resulting amount of PPDA (in mg) per cow was substituted in Equation 1 to calculate the dermal SED.
(b)
ConsExpo modelling programme [22]: The BfR has recommended this programme for assessing the direct exposure of livestock to biocidal products. In the model, there is neither an application involving the drag hose system nor an over the cow scenario. As an alternative, the following scenario was used during modelling: Treatment of Animal Housing—Exposure of a Dairy Cow from a Spraying Treatment with Direct Product Contact [24].
(c)
BfR calculation tool [23]: This calculation tool estimates the external exposure of farm animals to biocidal active substances. In the model, there is neither an application involving a drag hose system nor an over the cow scenario. As an alternative, the following scenario was used during modelling: Surface Treatment of Animal Housing (Floor Only). Dermal exposure in this model is described/defined as rubbing against surfaces [24].
(d)
Measured exposure data: the dermal SED was estimated using the 95th percentile of the measured values from dermal exposure to PPDA (mg) per cow in the over the cow scenario using Equation (1).

3. Results

3.1. Animal Behaviour

Over 77 days from February to May, the number of animal contacts in both the over the cow and passing the cow scenarios was less than one contact per cow per day. Animal contact in the over the cow scenario varied between 0 and 0.24 contacts per cow per day, while this value varied between 0.09 and 0.8 contacts per cow per day in the passing the cow scenario (Figure 4). In addition, pre-investigations revealed that animals gradually adapted to the system over time, and the influence of the drag hose system on animal behaviour was minimal at night. Its application at this time was therefore proven to be the most practical.

3.2. Video Analysis

Table 4 provides the video analysis results. Two distinct situations were considered: a nozzle meets a cow and a drag hose is pulled over a cow. The number of contacts in the relevant body areas and the length of each contact with the nozzle were noted in these scenarios per application run. The set flow rate of the nozzles was then used to calculate the amount of liquid (mL) in each scenario. The maximum possible amount of PPDA applied to the lifelike cow dummy was 379 mL. In practice, the application rate of PPDA was 2.5 mg of PPDA per 100 mL per m². The amount of liquid could therefore be converted into the amount of PPDA (mg) using a factor of 40. Notably, 379 mL corresponds to 9.5 mg of PPDA in each application run. The video has already been published [20].

3.3. Measured Dermal Exposure

The total dermal exposure levels measured on the lifelike cow dummy for all scenarios and application techniques in May and August were calculated to obtain the dermal SED [mg/kg bw per day] (Equation (1)), as summarised in Table 5. The highest dermal SED occurred in the over the cow scenario, ranging from 5 × 10⁻⁵ [mg/kg bw per day] (without foot patches) to 6 × 10⁻⁵ [mg/kg bw per day] (with foot patches). The dermal SED in the passing over the cow scenario was 5 × 10⁻⁵ [mg/kg bw per day], with a value of 4 × 10⁻⁵ [mg/kg bw per day] without foot patches. Compared to application with the drag hose system, the robot dummy scenario demonstrated the lowest dermal SED. The dermal SED was 1 × 10⁻⁵ [mg/kg bw per day], especially when foot patches were not used. The dermal SED with foot patches was 3 × 10⁻⁵ [mg/kg bw per day], which was three times greater than that measured without patches. In both drag hose scenarios, the upper body of the lifelike cow dummy exhibited the highest exposure, varying between 68 and 76%. In the case of robot application, 100% of the exposure occurred on the legs. The upper body was not measured because the application with the robot was performed near the ground, which suggested that no exposure on the upper body could be expected.

3.4. Comparison of the Calculated and Measured Dermal Systemic Exposure Dose (SED) Values

The maximum possible dermal exposure was expected in the over the cow scenario, which was considered the worst-case scenario in the risk assessment. The dermal SED was calculated in this worst-case scenario per application run using the different approaches (refer to (a) to (d)) (Table 6). Furthermore, the dermal SED values calculated based on the measured exposure data from the passing the cow scenario and the robot dummy are presented. The considered factor represents how much lower or higher the dermal SED of the measured exposure data (d) of the over the cow scenario is relative to all other dermal SED values. When comparing the dermal SED values on which the measured exposure data are based ((d) to (f)), the over the cow scenario exhibited the greatest value, followed by the passing the cow scenario, with values of 0.7 and 0.5, respectively, compared to the robot dummy. When dermal SED values were calculated for the over the cow scenario using approaches (a) to (d), video analysis showed the highest value, at 3.8 × 10⁻⁴ mg/kg bw per day. The dermal SED was six times greater than the measured dermal SED (d), with a value of 6 × 10⁻⁵ mg/kg bw per day. The ConsExpo modelling tool generated five times higher dermal SED values, with an average of 3.1 × 10⁻⁴ mg/kg bw per day. The dermal SED calculated by the BfR calculation tool was two times greater with a value of 1.0 × 10⁻⁴.

4. Discussion

This study demonstrated the development of a method to measure dermal exposure on a lifelike cow dummy, as well as how the collected data can be classified in relation to risk assessment. The maximum possible exposure in the over the cow scenario on a lifelike cow dummy was first estimated via the flow rate of the nozzles via video analysis. Furthermore, the frequency of both worst-case scenarios with the drag hose system (over the cow and passing the cow) was evaluated using real cows in animal behavioural experiments. Finally, dermal exposure was measured on a lifelike cow dummy using Tyvek® as a collector combined with the fluorescent dye pyranine considering three worst-case scenarios. The dermal SED could then be calculated using the estimated and measured exposure values. This value could be used as a reference point for the comparison of estimated and measured exposure levels with calculated exposure data obtained with model calculation tools for risk assessment [24].
Tyvek® was previously used as a collector, together with pyranine, to measure dermal exposure in tractor cabins [15] and for bystanders when plant protection products were applied in a culture room [14]. With this study, it was possible to demonstrate that this method may be useful for measuring reproducible dermal exposure values on lifelike cow dummies, even at higher exposure levels. As there was direct contact between the animal and the application technique in the investigated application areas, dripping from the lifelike cow dummy covered with Tyvek® could not be ruled out due to the larger exposure quantity. Because of the horizontal orientation of the nozzles and the forward application in the robot dummy scenario (0 m frontal), a substantial quantity of liquid was applied to the legs over a longer period, exceeding the absorption capacity of Tyvek® and resulting in dripping. Therefore, the measured exposure values could be lower than the real exposure levels. An investigation of the differences in dripping behaviour between Tyvek® and cow skin was not conducted. Because cow skin does not completely absorb the liquid, this aspect should not generate much of an impact. In this case, it is only plausible to assume that both surfaces behave equally. Although no drag hose scenario indicated dripping in the practical tests, small losses were still possible, particularly if the Tyvek® cutting patterns of the upper body were removed and cut after application.
In risk assessment of plant protection products, modelling mainly involves relatively conservative data [10]. The methods used in the UI risk assessment also reflected this aspect. Due to the database used in the BfR [23] and ConsExpo [22] models, it was not possible to calculate realistic over the cow scenarios related to our application case. Therefore, alternative application scenarios were chosen. The data used for the calculations in the ConsExpo model were related to spraying application. However, direct product contact was considered. Furthermore, the amount of exposure can be modified in the calculation tool and was set to 7.9 mg of PPDA per application run for 314 mL of spray liquid. This value was calculated based on the same video analysis approach that was used for the 9.5 mg per application level of PPDA, as indicated in Table 4. The only difference was that the exposure amount used in the ConsExpo model was based on the flow rate of five AirMix 110-25 nozzles instead of three AirMix 110-25 nozzles and two AirMix 110-04 OC nozzles. As a result, the flow rate decreased, which yielded a smaller total amount of PPDA (mg per application run) and a slightly lower dermal SED value (3.1 × 10⁻⁴ [mg/kg bw per day]) than the video analysis (3.8 × 10⁻⁴ [mg/kg bw per day]).
In the BfR tool, soil treatment is considered, and dermal exposure among animals results from rubbing against surfaces. Direct contact between the application technique and animals was not considered here. This could explain the lower dermal SED value of 1.0× 10⁻⁴ [mg/kg bw per day] compared to those provided by the other models (3.8 × 10⁻⁴ [mg/kg bw per day]) and the ConsExpo model (3.1 × 10⁻⁴ [mg/kg bw per day]). Furthermore, the risk assessment was based on one contact per animal and one application run per day. However, animal behaviour video analysis demonstrated that there were just over 0.09 contacts per cow per day. This suggests that the risk will likely be lower in reality than the calculated, estimated, and measured levels.
It has already been determined that applying UI (2.5 mg of Atmowell® in 100 mL) on a stable floor once per day is safe for animals, humans, and the environment [24]. However, these assumptions only partially represent reality because they are mainly based on assumptions with theoretically estimated input parameters. Measurements could improve the theoretical exposure assumptions of risk assessments. This suggests that an even lower risk level could be assumed. It should be highlighted that measured inhalation exposure data must be included in the final comparison for risk assessment. To assess inhalation exposure among cattle, additional methods must be developed.

5. Conclusions

  • The established method is very well suited for collecting reproducible exposure data from lifelike dummies under practical conditions;
  • The frequency of contact between the application technology and animals is many times lower than that estimated in the risk assessment;
  • In both drag hose scenarios, exposure on the lifelike cow dummy occurs mainly on the torso;
  • In the robot dummy scenario, mainly the legs and feet of the lifelike cow dummy are exposed due to the robot operating close to the ground;
  • The measured exposure data are lower than the dermal exposure values calculated before the theoretical risk assessment;
  • For a final comparison with the total SED values from the risk assessment, inhalation exposure values must be recorded and included in the assessment procedure.

Author Contributions

Conceptualisation, A.E. and E.H.; methodology, A.E. and J.K.W.; validation, A.E., A.M. and E.H.; formal analysis, A.E.; investigation, A.E.; resources, A.E.; data curation, A.E.; writing—original draft preparation, A.E.; writing—review and editing, A.E., A.M., J.K.W. and E.H.; visualisation, A.E.; supervision, J.K.W. and E.H.; project administration, A.E. and J.K.W.; funding acquisition, J.K.W. All authors have read and agreed to the published version of the manuscript.

Funding

The project Prax REDUCE is supported by funds from the Federal Ministry of Food and Agriculture (BMEL) based on a decision of the Parliament of the Federal Republic of Germany via the Federal Office for Agriculture and Food (BLE) under the innovation support programme (funding code: 2813IP036).

Data Availability Statement

Raw data were generated at Julius Kühn-Institut (JKI), Federal Research Centre for Cultivated Plants, Institute for Application Techniques in Plant Protection, Messeweg 11/12, 38104 Braunschweig, Germany. The data are openly available in a public repository that issues datasets with DOIs. The data that support the findings of this study are openly available in OpenAgrar at https://doi.org/10.5073/20231101-103121-0 (accessed on 2 February 2024) and at https://doi.org/10.5073/20231101-110657-0 (accessed on 2 February 2024).

Acknowledgments

The authors would like to thank Marina Dercks and Celina Ehlers for their contributions to this work.

Conflicts of Interest

On behalf of all the authors, the corresponding author states that there are no conflicts of interest.

Appendix A

Figure A1. Schematic floor plan of Stable A, in which the animal behaviour study and exposure measurements were performed. The positions of the video cameras used in the animal behaviour study are indicated by 1 and 2. The position of the lifelike cow dummy in all exposure scenarios is indicated by 1. A is the application length of the robot dummy (3 m). B is the application length of the drag hose system in both scenarios (5 m), while 2 and 3 denote the positioning and orientation, respectively, of the video cameras used in the animal behaviour study.
Environments 11 00047 g0a1

References

  1. Umwelt Bundesamt. Ammoniak-Emissionen. Available online: https://www.umweltbundesamt.de/daten/luft/luftschadstoff-emissionen-in-deutschland/ammoniak-emissionen (accessed on 28 July 2022).
  2. Haenel, H.-D.; Rösemann, C.; Dämmgen, U.; Döring, U.; Wulf, S.; Eurich-Menden, B.; Freibauer, A.; Döhler, H.; Schreiner, C.; Osterburg, B.; et al. Calculations of gaseous and particulate emissions from German agriculture 1990-2018: Report on methods and data (RMD) Submission 2020. In Thünen Report; Johann Heinrich von Thünen-Institut: Braunschweig, Germany, 2020; Volume 77. [Google Scholar]
  3. Behera, S.N.; Sharma, M.; Aneja, V.P.; Balasubramanian, R. Ammonia in the atmosphere: A review on emission sources, atmospheric chemistry and deposition on terrestrial bodies. Environ. Sci. Pollut. Res. Int. 2013, 20, 8092–8131. [Google Scholar] [CrossRef] [PubMed]
  4. Agency for Toxic Substances and Disease Registry (ATSDR). Toxicological Profile for Ammonia. US Department of Health and Human Services, Agency for Toxic Substances and Disease Registry. 2004. Available online: https://www.atsdr.cdc.gov/toxprofiles/tp126.pdf (accessed on 12 December 2023).
  5. EC. [European Commission]. Directive (EU) 2016/2284 of the European Parliament and of the Council of 14 December 2016 on the Reduction of National Emissions of Certain Atmospheric Pollutants, Amending Directive 2003/35/EC and repealing Directive 2001/81/EC. 2016, Vol. 59. Available online: https://eur-lex.europa.eu/legal-content/EN/TXT/PDF/?uri=OJ:L:2016:344:FULL&from=EN (accessed on 12 December 2023).
  6. Bobrowski, A.B.; Willink, D.; Janke, D.; Amon, T.; Hagenkamp-Korth, F.; Hasler, M.; Hartung, E. Reduction of ammonia emissions by applying a urease inhibitor in naturally ventilated dairy barns. Biosyst. Eng. 2021, 204, 104–114. [Google Scholar] [CrossRef]
  7. Leinker, M. Entwicklung einer Prinziplösung zur Senkung von Ammoniakemissionen aus Nutztierställen mit Hilfe von Ureaseinhibitoren; Cuvillier Verlag: Göttingen, Germany, 2007. [Google Scholar]
  8. Hagenkamp-Korth, F.; Haeussermann, A.; Hartung, E.; Reinhardt-Harnisch, A. Reinhardt-Hanisch, Annett. Reduction of ammonia emissions from dairy manure using novel urease inhibitor formulations under laboratory conditions. Biosyst. Eng. 2015, 130, 43–51. [Google Scholar] [CrossRef]
  9. Bobrowski, A.B.; van Dooren, H.J.; Ognik, N.; Hagenkamp-Korth, F.; Hasler, M.; Hartung, E. Reduction of ammonia emissions by using a urease inhibitor in a mechanically ventilated dairy housing system. Biosyst. Eng. 2021, 130, 115–129. [Google Scholar] [CrossRef]
  10. BfR. Risikobewertung von Pflanzenschutzmitteln. Available online: https://www.bfr.bund.de/de/risikobewertung_von_pflanzenschutzmitteln-70187.html (accessed on 4 April 2023).
  11. Machado-Neto, J.G. Determination of Safe Work Time and Exposure Control Need for Pesticide Applicators. Bull. Environ. Contam. Toxicol. 2001, 67, 20–26. [Google Scholar] [CrossRef] [PubMed]
  12. OECD. Guidance Document for the Conduct of Studies of Occupational Exposure to Pesticides during Agricultural Application; OECD: Paris, France, 2022. [Google Scholar]
  13. Herbst, A.; Wygoda, H.-J. Pyranin–ein fluoreszierender Farbstoff für applikationstechnische Versuche. Nachrichtenbl. Deut. Pflanzenschutzd. 2006, 58, 79–85. [Google Scholar]
  14. Ahrens, K.; Röver, M.; Peter, E.; Molnar, G.; Martin, S.; Wegener, J.K. Development of a method for measuring exposure of residents and bystanders following high crop application of plant protection products. J. Cultiv. Plants 2023, 75, 138–150. [Google Scholar]
  15. Molnar, G.; Ahrens, K.; Wegener, J.K.; Röver, M.; Peter, E.; Martin, S.; Dittmar, S. Development of a selective testing method to pesticide aerosols for characterization and comparison of agricultural tractor cabs classified according to EN 15695-1. J. Cultiv. Plants 2023, 75, 130–137. [Google Scholar]
  16. Ehmke, A.; Wegener, J.K.; Melfsen, A.; Hartung, E. Optimizing exposure data collection for plant protection products: Identifying ideal collectors with the fluorescent dye pyranine. J. Consum. Prot. Food Saf. 2024, accepted. [Google Scholar]
  17. Julius Kühn-Institut. 7–1.5 Messung der Direkten Abdrift von Flüssigen Pflanzenschutzmitteln im Freiland; Julius Kühn-Institut Bundesforschungsinstitut für Kulturpflanzen: Quedlinburg, Germany, 2021. [Google Scholar]
  18. Nairn, J.J.; Forster, W.A. Photostability of pyranine and suitability as a spray drift tracer. N. Z. Plant Prot. 2015, 68, 32–37. [Google Scholar] [CrossRef]
  19. Ehmke, A.; Melfsen, A.; Wegener, J.K.; Hartung, E. Influence of the urease inhibitor suspension (Atmowell®) on the fluorescent dye pyranine and its spray and drift behavior in wind tunnel measurements. J. Environ. Sci. Health. Part. B Pestic. Food Contam. Agric. Wastes 2023, 58, 210–216. [Google Scholar] [CrossRef] [PubMed]
  20. Ehmke, A.; Melfsen, A.; Wegener, J.K.; Hartung, E. Video Recording of the over the Cow Scenario for Estimating Dermal Exposures during the Application of a Urease Inhibitor. Available online: https://www.openagrar.de/receive/openagrar_mods_00091411 (accessed on 10 December 2023).
  21. EFSA. Guidance on the assessment of exposure of operators, workers, residents and bystanders in risk assessment of plant protection products. EFSA J. 2022, 20, 134. [Google Scholar]
  22. RIVM. ConsExpo Web Consumer Exposure Models, Model Documentation, Update for ConsExpo Web 1.0.2. Available online: https://www.rivm.nl/bibliotheek/rapporten/2017-0197.pdf (accessed on 12 December 2023).
  23. BfR. Leitfaden für die Bewertung Gesundheitlicher Risiken; Bundesinstitut für Risikobewertung (BfR): Berlin, Germany, 2020. [Google Scholar]
  24. Haselbach, J.; Jansen-Bouriatchenko, N. Toxicological Risk Assessment of the Urease Inhibitor Phenyl PhosphoroDiAmidate (PPDA) in Indoor Cattle Farming. J. Anim. Sci. Technol. 2022, 64, 603. [Google Scholar]
Figure 1. Drag hose system (a) in the experimental environment of Stable A. Robot dummy (b). The orange circles indicate the nozzles. A is the distance between the nozzles of the drag hose system (50 cm); B is the distance from the nozzle of the drag hose system to the ground (90 cm); C is the distance between the nozzles of the robot dummy (91 cm); D is the distance from the centre nozzle of the robot dummy to the ground (28 cm); and E is the distance from the outer nozzle of the robot dummy to the ground (20 cm).
Environments 11 00047 g001
Figure 2. (a) Lifelike cow dummy in combination with the drag hose system in the over the cow scenario. (b) Lifelike cow dummy in combination with the application technique in the passing the cow scenario. (c) Lifelike cow dummy in combination with the application technique in the 0 m frontal scenario.
Environments 11 00047 g002
Figure 3. (a) The over the cow scenario with the Tyvek® cutting pattern on the model (left). Presentation without covering the hooves. The orange lines illustrate the model covered with the collector. The black dashed line indicates the cut edges of the upper body blanks for sample collection after application. (b) The passing the cow scenario with the Tyvek® cutting pattern on the model (left). Presentation without covering the hooves. The orange lines illustrate the model covered by the collector. The black dashed line indicates the cut edges of the upper body blanks for sample collection after application. (c) The 0 m frontal scenario with Tyvek® cutting patterns on the model. Presentation without covering the hooves. The orange lines illustrate the model covered with the collector.
Environments 11 00047 g003
Figure 4. Average number of contacts per cow per day documented during video analysis of the over the cow and passing the cow scenarios during the application of the drag hose system for 77 days from February to May. Application occurred in the early morning hours at 03:45 a.m.
Environments 11 00047 g004
Table 1. Parameter settings of the application techniques of the drag hose system and robot dummy.
Drag Hose SystemRobot Dummy
Nozzle TypeAirMix 110-25AirMix 110-04 OCAirMix 110-01AirMix 110-015
number of nozzles3221
distance from the floor [cm]902028
flow rate per nozzle [L/min]0.821.30.40.6
distance between the nozzles [cm]5091
speed [km/h]10.24
pressure [bar]23
Table 2. Overview of the experimental environments and associated investigation parameters for real cows and lifelike cow dummies. * Mean value for cattle over 77 days of video recording.
ExperimentAnimal Behaviour (Video Analysis)Exposure MeasurementExposure Estimation (Video Analysis)
experimental environmentStable AStable Atesting facility with controlled conditions
cubicle housing systemcubicle housing system
animals (n)cattle (22 *)lifelike cow dummy (1)lifelike cow dummy (1)
investigation parametersfrequency of contact between animals and application technologyexposure measurement for the worst-case scenariosexposure estimation for the worst-case scenarios
application techniquedrag hose systemdrag hose system and robot dummydrag hose system
considered scenariosover the cow; passing the cowover the cow; passing the cow; 0 m frontalover the cow
Table 3. For all the scenarios and corresponding application techniques, the area covered by Tyvek® is given in cm², as is its ratio to the area of the lifelike cow dummy (%). For the experiments in May 2022 without foot patches and in August 2022 with foot patches, the repetitions performed for each scenario and date are also given [n].
ScenarioDateApplication TechniqueSurface Area of Model [cm²]Surface Area Covered with Tyvek® [cm²]Covered Surface as [%] of the Total Surface Area of the ModelCovered Surface as [%] of the TorsoCovered Surface as [%] of the LegsCovered Surface as [%] of the Udder[n]
over the cowMayDrag hose54,29340,78575702467
August41,80577682665
passing the cowMayDrag hose54,29330,34456603287
August31,36458583485
0 m frontalMayRobot dummy54,29312,28523080207
August13,30525082185
Table 4. Video analysis for estimating the maximum possible amount of fluid on the lifelike cow dummy during the application runs with the drag hose system in the over the cow scenario per application run for the different application settings. The total amount of liquid [mL] was calculated by multiplying the contact time of the nozzles by the total duration of contact. The specific flow rate of the nozzles (Table 1) was considered here. The total amount of PPDA applied was calculated by considering a factor of 40. To calculate the dermal SED, Equation (1) was used.
Situation during the Application RunBody Part ContactContact Time [Sec]Number of NozzlesNozzle TypeTotal Amount of Liquid [mL]Total Amount of PPDA Applied [mg per Application Run]Dermal SED [mg/kg bw per Day]
nozzle meets the cowlegs (frontal)23AirMix 110-25822.18.4 × 10−5
legs (frontal)22AirMix 110-04872.28.8 × 10−5
drag hose is pulled over the cowupper body33AirMix 110-251233.11.2 × 10−4
upper body31AirMix 110-04651.66.4 × 10−5
legs (sideways)11AirMix 110-04220.62.4 × 10−5
Total 3799.53.8 × 10−4
Table 5. Dermal SED values according to the different scenarios and application techniques with and without foot patches. The 95th percentile of the measured values of dermal exposure to PPDA (mg per application) was calculated for the dermal SED [mg/kg bw per day], as were the percentage distributions of the exposure values on the respective body parts. X denotes not measured.
Over the CowPassing the Cow0 m Frontal
dermal SED [mg/kg bw per day]5 × 10⁻⁵ 5 × 10−51 × 10−5
variation coefficient [vc %]101310
torso %7576X
legs %2524100
udder %00.10
dermal SED [mg/kg bw per day] 6 × 10⁻⁵ 4 × 10−53 × 10−5
variation coefficient [vc %]1064
torso %6968X
legs %2931100
udder %110
Table 6. For every approach, the dermal SED values (in mg per kg body weight (bw) per day) are shown. (a) Dermal SED values estimated via video analysis, (b–c) calculated via the risk assessment model tools, and (d–f) assessed via the dermal exposure data measured in this study for the three worst-case scenarios. Factor * denotes the ratio of the dermal SED value of the over the cow scenario based on the measured data compared to all other SED values.
Approach for Dermal SED Determination(a) Video Analysis(b) ConsExpo(c) BfR Calculation Tool(d) Measured Exposure Data(e) Measured Exposure Data(f) Measured Exposure Data
scenarioover the cowspraying treatment with direct product contactsurface treatment of animal housing (floor only)over the cowpassing the cow0 m frontal
SED [mg/kg bw per day]3.8 × 10−43.1 × 10−41.0 × 10−46 × 10−54.2 × 10−53.1 × 10−5
Factor *65210.70.5
Disclaimer/Publisher’s Note: The statements, opinions and data contained in all publications are solely those of the individual author(s) and contributor(s) and not of MDPI and/or the editor(s). MDPI and/or the editor(s) disclaim responsibility for any injury to people or property resulting from any ideas, methods, instructions or products referred to in the content.

