


BioWin Modeling of CalPrex Phosphorus Recovery from Wastewater Predicts Substantial Nuisance Struvite Reduction


1
Madison Department of Soil Science, University of Wisconsin-Madison, Madison, WI 53706, USA
2
Madison Department of Biological Systems Engineering, University of Wisconsin-Madison, Madison, WI 53706, USA
*
Author to whom correspondence should be addressed.
Environments 2024, 11(3), 48; https://doi.org/10.3390/environments11030048
Submission received: 24 October 2023
/
Revised: 22 February 2024
/
Accepted: 26 February 2024
/
Published: 29 February 2024
(This article belongs to the Special Issue Advanced Technologies of Water and Wastewater Treatment)
Abstract
:The wastewater treatment industry could benefit from new technologies for the removal and recovery of phosphorus (P). The CalPrex precipitation reactor has the potential to recover P in a readily land-applicable form by treating organic acid digestate with calcium hydroxide to produce brushite. Using data from a pilot-scale reactor at the local Nine Springs Wastewater Treatment Plant in Madison, WI, we modified the plant’s BioWin configuration using BioWin 6.2 to model the CalPrex technology and estimate performance under a variety of conditions. We produced dose/response curves for a range of possible lime dosages to estimate the impact of reagent dosage on the quantity and composition of precipitate produced by the CalPrex reactor and characterize the effects on downstream anaerobic digester performance. CalPrex was found to capture 46% of the plant’s influent P, reducing nuisance struvite precipitates by 57% and biosolid sludge production by 14%. The CalPrex module was also tested in two predesigned plant configurations in the BioWin cabinet with the intention of testing applicability to other configurations and searching for the impacts of CalPrex on treatment train performance. This is the first work simulating a full-scale implementation of CalPrex and the first to model interactions of CalPrex with other treatment processes.
1. Introduction
The United States (U.S.) consumes more than 23 million short tons of nutrient fertilizer each year, 4.7 million short tons of which is phosphorus (P) [1]. While the bulk of U.S. nutrient pollution originates from the use of agricultural fertilizers, manure application, and eroded runoff, a sizeable portion stems from the disposal of treated wastewater effluents [2]. Conventional treatment methods can reduce plant effluent from 4–10 mg P/L to 1–2 mg P/L [3], but most US treatment plants have no nutrient effluent standards [4]. Nutrient pollution resulting in eutrophication has a variety of associated externalities, including tourism and recreation loss, commercial fishing loss, reduced property values, increased drinking water costs, and human sickness [2].
The nutrients in wastewater are derived from, among other things, biological waste and household and industrial chemicals [2]. Environmental policy has shifted to discourage nutrient pollution of waterways [5] as there is a greater recognition of the deleterious effects of eutrophication, and effective nutrient removal technologies are increasingly commercially viable. In the U.S., the Environmental Protection Agency (USEPA) provides guidance and technical support for states willing to enact nutrient-based water quality guidelines. Phosphorus is a non-renewable resource essential for agriculture [6], and eventually, technology will need to shift towards conservation and recovery of P.
Point sources such as municipal wastewater utilities are relatively easy and effective targets for regulation and control. Most emphasis to date is on P reduction in treated effluent water, usually by enhanced biological phosphorus removal (EBPR) and/or chemical precipitation, resulting in enrichment in biosolids, with only a few nascent technologies for P recovery like the Ostara process [2,7]. In a wastewater treatment plant (WWTP) incorporating EBPR processes, upwards of 90% of influent P can be expected to be captured in the plant biosolids [8], which are typically landfilled, incinerated, or land applied.
A side effect of EBPR processes is the accumulation of nuisance precipitates such as struvite [9]. Struvite, an ammonium magnesium phosphate mineral of the formula NH4MgPO4·6H2O, is frequently a nuisance precipitate that typically forms when ammonium, magnesium (Mg), and phosphate exceed their solubility under basic conditions caused by the off-gassing of carbon dioxide in anaerobic digesters. Struvite can accumulate in and on digesters, pipes, heat exchangers, and pumps. These precipitates cause operational difficulties in the form of reduced reactor volume, clogged piping, reduced heat exchange efficiency, and increased pumping costs and often require expensive remediation [10,11]. However, struvite can also be precipitated in a controlled manner to prevent impediments to WWTP function and recover P as a potential fertilizer [7].
Land application of biosolids returns P to agricultural soil, though high water content limits the distance biosolids can be economically transported from the plant. In biosolids-applied fields, the soil P levels rapidly exceed those required for crop growth, and the biosolids cease to function as a P fertilizer replacement. Typical P management, as currently practiced, cannot be considered effective from a P recovery standpoint, and therefore, extractive nutrient recovery must constitute an important part of future sustainable nutrient management plans [12]. Many wastewater utilities are exploring novel methods of removing nutrients from their effluent, including technologies such as MagPrex, AirPrex, Prisa, Seaborne, and others [12,13,14,15,16,17,18,19,20,21,22,23,24,25].
The CalPrex process for precipitation of soluble P as brushite, a calcium phosphate mineral of the formula CaHPO4·2H2O, is a novel P recovery technology [26] that has been successfully tested at the pilot stage [27] at the Nine Springs Wastewater Treatment Plant in Madison, WI (Figure 1). CalPrex acts on the effluent of an organic acid digester, typically from a two-phase anaerobic digestion system, that is fed waste-activated sludge (WAS) from an EBPR process. The result is that organic acid digestate has a high concentration of soluble orthophosphate and a chemical composition conducive to phosphate precipitation [28]. In CalPrex operation, sludge from the organic acid digester is first dewatered, and the mildly acidic, phosphate-rich liquid is reacted with calcium hydroxide in a clarifier to a pH of ~6.5–7 to precipitate brushite from the solution. The brushite is settled in the clarifier with the aid of polymer, then dewatered and dried. All reject water from the clarifier and solids removed from the acid digestate return to the intercession point, typically moving on to a methanogenic anaerobic digester.
The brushite produced by the CalPrex process can be readily used as a slow-release phosphorus fertilizer [7]. Brushite is a naturally occurring soil phosphate and is rapidly produced when phosphorus is applied to high-calcium soils [29,30]. Pure brushite is 18% phosphorus by weight, comparable to triple superphosphate. While most phosphorus fertilizers have a mild acidifying effect on soil, brushite has a negative potential acidity and can be considered a mild liming agent [29,30,31]. Brushite also has a low salt index, reducing runoff and leaching and allowing higher volume, lower frequency application [29,30,31].
The CalPrex process has not yet been evaluated at full scale nor commercially modeled as part of a full plant configuration. The grand thrust of this work is to evaluate a technology that may remove P from wastewater treatment plants, especially where P precipitates impact essential functions, remove P from land-applied biosolids in fields for which added P might be an environmental concern, and generate a recycled P fertilizer product that will conserve limited P resources. Our primary goal is to make the first prediction of the performance and plantwide impacts of a full-scale CalPrex implementation using a whole-WWTP configuration. The specific objectives of our study are to predict the performance of a full-scale implementation of CalPrex at the Nine Springs Wastewater Treatment plant (Madison, WI), using BioWin 6.2 with modifications to the acid digester process proposed by Vineyard et al. [32,33], and compare results to those of the pilot-scale project [27]. We assess the applicability of these results to other treatment plants and treatment trains using BioWin cabinet models. The resultant configuration will be used in future work to compare phosphorus control technologies, individually and in concert, based on reagent costs, phosphorus recovery, precipitate control, and nutrient emissions. Our results are intended for wastewater engineers considering struvite remediation or nutrient recovery technologies.
2. Materials and Methods
As pilot-scale projects can be prohibitively expensive, it is beneficial to use modeling software to predict the performance of a full-scale installation. BioWin [34] is a wastewater treatment plant modeling program commonly used by engineers to predict the behavior of WWTPs and guide their operations. It can be used to model a variety of wastewater treatment processes and create treatment trains meant to resemble full-scale WWTPs. The software uses a series of hydraulic, chemical, and biological models to predict changes in the chemical and microbial composition of wastewater as it passes through different reactors.
The Nine Springs Wastewater Treatment Plant in Madison, Wisconsin, is a mid-size treatment plant operated by the Madison Metropolitan Sewerage District (MMSD) serving a population of 360,000 over a 180 sq. mile (466 km2) area, with a design capacity of 50 million gallons per day (50 MGD; 189,300 m3/day) [35]. This plant contains an EBPR treatment train, generating WAS with a high P content. A 50:50 mixture of primary sludge and WAS is anaerobically digested in a series of mesophilic methanogenic digesters generating biogas, and then the sludge is dewatered to produce biosolids [35]. The first of these digesters is an acid digester, which generates volatile fatty acids (VFAs) from the breakdown of complex biological compounds for the purpose of easier conversion to biogas in downstream digesters.
A portion of this struvite precipitation is observed on-site to form a nuisance scale on heat exchangers and in pipes; another portion gradually accumulates as grit in digesters and reduces reactor volume, and a third portion follows the biosolids out of the plant. At present, BioWin can only model precipitates as suspended, not forming as scale or settling as grit. The first two forms (scale/grit) necessitate expensive treatment stoppages for remediation; struvite reduction was the primary motivation for the subsequent installation of the WASStrip and Ostara systems at Nine Springs. The CalPrex process was piloted in a Water Research Foundation-funded project at the Nine Springs wastewater treatment plant conducted during the spring, summer, and fall of 2018 [27]. The pilot unit handled ~5% of the throughput of the acid digester at Nine Springs. This project [27] yielded a performance report containing details on chemical concentrations, mass balances, and lime usage, which will serve as the primary data source for building our BioWin configuration or from mass balances provided by the Nine Springs engineers. Madison Metropolitan Sewerage District requested that the BioWin model for the Nine Springs Wastewater Treatment Plant not be fully shared for security reasons.
The Nine Springs wastewater treatment plant provided a BioWin configuration, which we assessed in BioWin 6.2. The WASStrip and Ostara reactors were removed from the treatment train, creating a model essentially equivalent to the plant before the incorporation of P control renovations in 2013. The configuration received was from a legacy version of BioWin and did not attempt to model an acid digester, necessitating that we modify it to match plant mass balances. BioWin does not natively model acidogenic digesters, so we created one using the full suite of modifications described in Vineyard et al. [32,33]. These modifications involve the adjustment of multiple default kinetic parameters to replicate the specialized behavior of these digesters and generate predictions in line with sampling data [32,33]. The effluent profile of the resultant acid digester process (Table 1) closely resembled the specifications and chemical analyses of the Nine Springs acid digester [27].
We developed the following two BioWin configurations from the plant data, one intended to serve as a baseline and the other to test for CalPrex impacts:
- The 2013 Plant (baseline configuration): The Nine Springs configuration has no tertiary P removal processes in place, similar to its state before the installation of the Ostara unit in 2014.
- Base configuration plus the CalPrex unit: The 2013 plant with a CalPrex system installed, including its solid/liquid separation, polymer and lime additions, and reactor clarification. Intended as an analog of a treatment plant installing CalPrex as its only P recovery technology.
2.1. CalPrex Modeling
We modified the BioWin reference model by adding a CalPrex system—consisting of polymer dosing, centrifuge, lime dosing, and clarifier—between the acid digester and the anaerobic digesters to the baseline configuration. The CalPrex pilot operation was placed between the acid digester and the subsequent anaerobic digester in the configuration and consisted of (i) dosing the acid digester effluent stream with a polymer to promote solid-liquid separation, (ii) dewatering the acid digestate by centrifugation, (iii) Ca(OH)2 dosing of the centrate in the CalPrex precipitator, (iv) settling the brushite precipitate in a clarifier, (v) centrifuging the settled brushite, and (vi) recombining the acid digestate solids with the liquids from the brushite centrifuge and clarifier before continuing downstream to the anaerobic digestion train. These functions were replicated within the BioWin configuration using a series of unit processes parameterized to match their pilot equivalents in function. The target pH for lime dosing of the CalPrex reactor in our BioWin configurations is 7.0, at which point almost all solubilized P is expected to precipitate out as brushite [28]. Dewatering and clarification parameters were informed by the performance of the pilot-scale equivalents. The CalPrex pilot unit required a large volume of polymer solution, increasing the total liquid volume of the waste stream by 27%.
The pilot reactor [27] added slurried Ca(OH)2 to increase the pH of the acid digestate to pH 6.5–7.5. The primary variable we controlled in our model was the lime dosing, which we controlled using a variable-volume input stream containing 1 kg Ca/L. We experimented with the total lime dosage to examine its effect on pH, P recovery, and reagent efficiency. Marginal return rates for P capture were calculated using the first derivative of second-order Lagrange interpolating polynomials, equivalent to Newton’s central difference methods when X-spacing is equal to [36].
To estimate the effects of the CalPrex process on the function of downstream treatment processes, several select metrics of high importance to a treatment plant operator were chosen. This list included material inputs, precipitate quantities, P partitioning, and downstream sludge and biogas generation.
2.2. Uncertainty Analysis
The acid digestate conditions were based in part on the average of 201 pH measurements taken at Nine Springs [27]. Given that WWTPs treat a constantly variable stream of municipal waste, the conditions within the plant are subject to perturbation. The Nine Springs acid digesters did not maintain perfectly constant chemistry over the observation period, as evidenced by the variability in pH measurements taken by plant operators to characterize the conditions in the plant. As both the performance of the BioWin model of an acid digester and the performance of the CalPrex installation itself are sensitive to the pH, including the P solubilization of the acid digester feed, the impacts of this variability are of interest to our project. We use the data collected in the pilot project to predict the effects of acid digestate variability on the modeling of an acid digester and subsequent performance of a CalPrex installation and record the results.
The mean pH of the digester was 5.13, with a standard deviation (SD) of 0.089. 75% of all pH measurements fell within one SD of the mean, and 96% fell within two SD of the mean. From this exercise in uncertainty, measured pH values of 5.13 ± 0.09 (mean ± standard deviation) require BioWin pH inhibition threshold values of 6.55 ± 0.13 and yield predicted CalPrex P captures of 431 ± 14 kg P/day.
2.3. Cabinet Configuration Demonstration
The modeling effort applied to the Nine Springs Treatment Plant was facilitated by two factors: the well-documented CalPrex pilot conducted at that location [27] and the availability of a comprehensive BioWin configuration of that plant. It is of interest to know how other WWTPs would respond to the application of CalPrex for P recovery. To test the interactions of the CalPrex reactor with other plant reactors, we inserted the CalPrex system into two generic systems in the BioWin cabinet, a repository of prebuilt plant models. We chose full plant models to capture more detailed trains intended to summarize real treatment plants with a complex series of reactors. This would better expose unforeseen complications in treatment that single reactor configurations would not.
The first cabinet configuration, titled “N Removal + Anaerobic Digester + Sidestream Treatment”, was a generic plant designed to demonstrate the removal of nitrogen (N) by nitrification/denitrification. The second cabinet configuration, titled “EBPR + Anaerobic Digester”, is a generic plant designed to demonstrate the removal of P through EBPR. The two cabinet models were chosen to represent common treatment plant trains in the USA and are the same cabinet models used in Vineyard et al. [32,33] to demonstrate the acid digester modifications. Process layouts for both configurations can be found in the Appendix A.
3. Results
3.1. Baseline Configuration—Nine Springs without Tertiary Phosphorus Control
The 2013 Nine Springs treatment plant configuration models intake of about 950 kg of elemental P per day (Table 2), 94% of which is diverted from plant effluent by the treatment plant’s settling tanks, clarifiers, and the EBPR system. The acidogenic digester produces a stream with a P concentration of roughly 1100 mg P/L, of which 706 mg/L are soluble P.
In the anaerobic digester, destruction of the VFAs by methanogenesis raises the pH to approximately 7.2 under normal operation, favoring the precipitation of P-based precipitates due to the combination of high mineral, ammonia, and soluble P contents. Under these conditions, 554 kg P/d (58% of plant throughput) are projected to precipitate as brushite or struvite within the anaerobic digesters. This equates to roughly 4000 kg of total P precipitate solids per day, approximately three-quarters of which is predicted by the configuration to be struvite. In BioWin, most of these precipitates are captured with the biomass in the biosolids (Table 2) after passing through a gravity belt thickener. The plant is predicted to produce 20 metric tons of dry sludge mass per day, two-thirds of which is volatile suspended solids. Of the non-volatile portion, half is P particulates precipitated in the anaerobic digesters.
3.2. CalPrex Configuration
At the target pH of 7.0, CalPrex significantly affects the P flows of the wastewater treatment plant (Table 2) by capturing 438 kg of P per day. The total dry mass of the CalPrex product is 3800 kg/d, of which 2300 kg/d is brushite, resulting in an 11% P purity by dry mass. The reactor captures 1280 kg/d of organic material alongside the brushite. The subsequent methanogenic digester receives 79 kg P/d in uncaptured brushite and precipitates an additional 128 kg P/d for a total flux of 207 kg P/d in brushite flowing through the methanogenic digesters.
Not all the P exiting the acid digester is captured as brushite (Figure 2). First, the process of dewatering the acid digestate leaves 16% of the solubilized P entrained in the solids and, therefore, not accessible for brushite formation. Further, the CalPrex clarifier cannot perfectly capture all the brushite formed, and 17% of brushite formed in the 2018 pilot passed to the anaerobic digesters [27], which is replicated by our model.
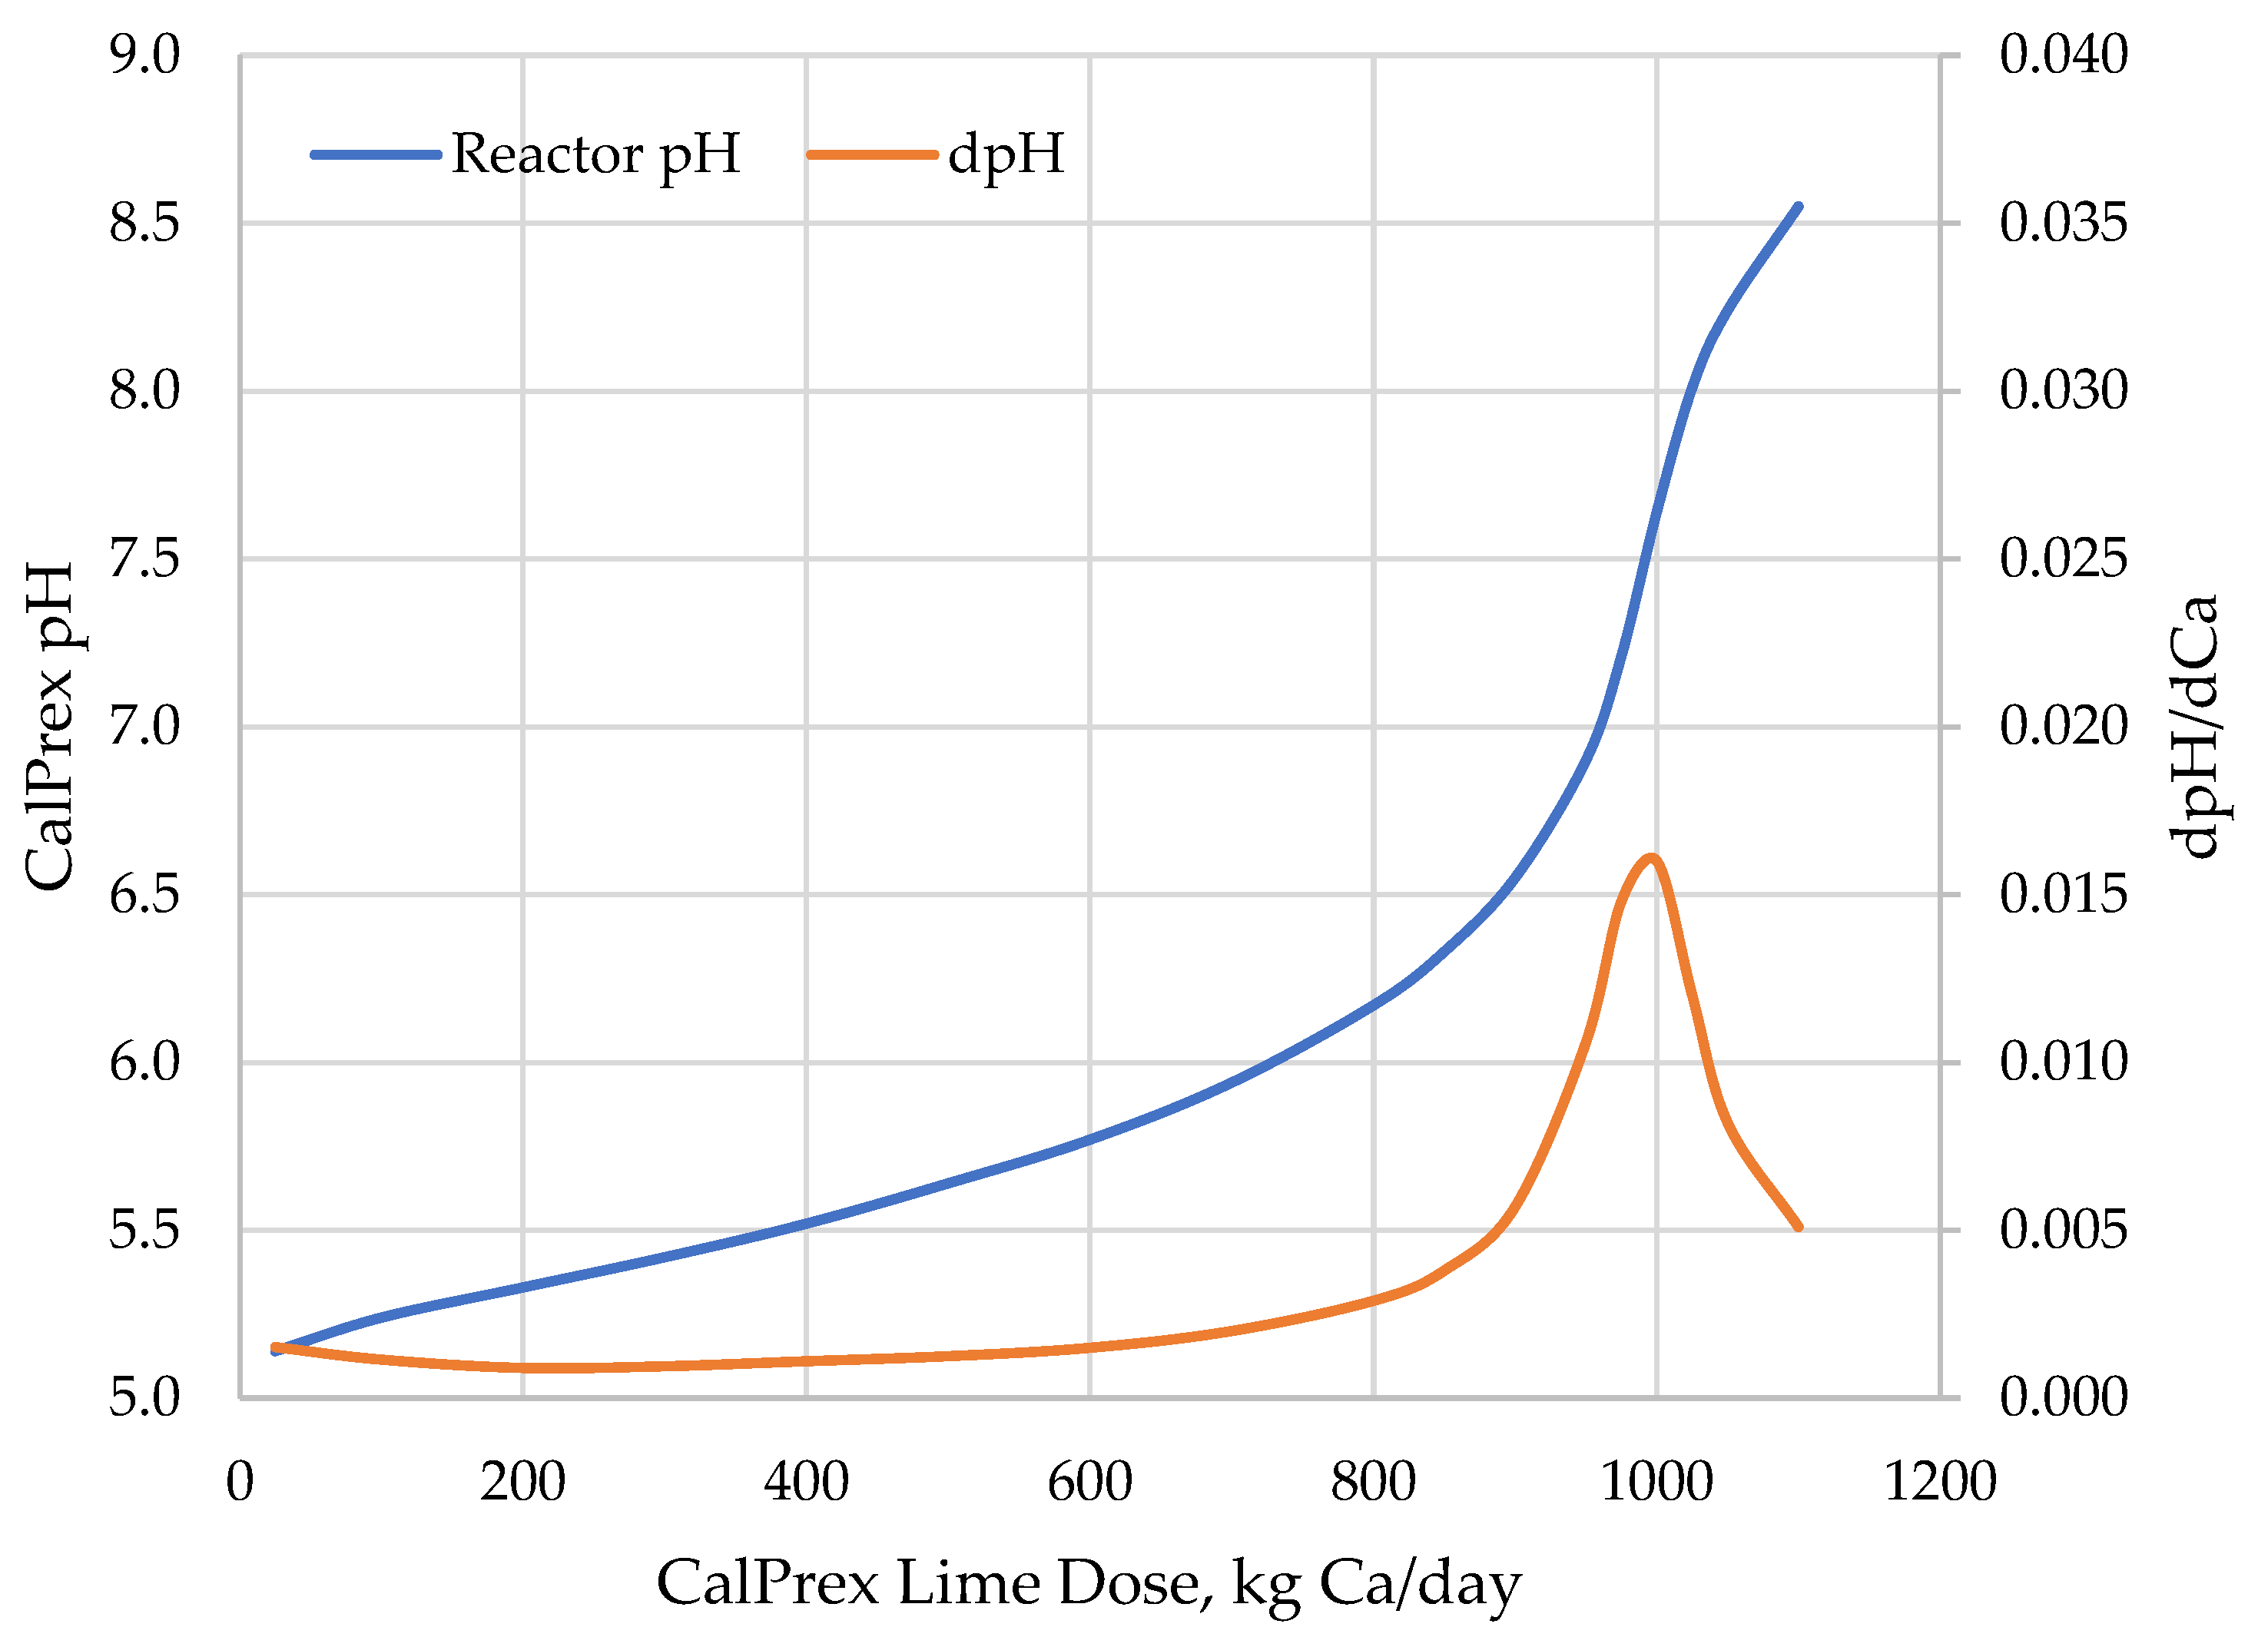
Lime dose–response curves for CalPrex performance were produced by feeding the CalPrex reactor a series of lime doses and calculating a steady-state performance. Dosing the CalPrex reactor with lime caused a predicted pH response curve characteristic of a buffered system with an inflection point at pH 7.6 (Figure 3), here calculated by BioWin but similar to the results calculated using Visual Minteq [28,33]. The titratable acidity of VFAs and soluble phosphates characteristic of acid digestate neutralizes added hydroxides and buffers pH, but once these are neutralized, the pH becomes much more sensitive to lime addition. This sensitivity peaks at the pH 7.6 inflection point, requiring about 1000 kg Ca/day. At higher pH, the solution is buffered by new species such as struvite and ammonia.
At low pH, the solubility of brushite is much higher, and the solution was undersaturated with respect to brushite and could not form a precipitate. As a result, small lime doses increase pH but result in no P recovery (Figure 4). Larger doses achieve steady increases in both pH and brushite recovery as acidity is overcome and ionic activities favor precipitation. The response to lime dose is dependent on acid digester stream characteristics. The soluble Ca concentration is more than 50% higher in the pilot stream compared to its BioWin equivalent, which will affect brushite solubility and may need to be considered when interpreting lime dosages; the lower Ca concentration may cause an underprediction of brushite capture or an overprediction of lime needs, but the reaction is limited more by pH than by calcium so this is expected to be minimal. Finding suitable methods to correct the Ca discrepancy or model a range of influent Ca concentrations was outside the scope of this modeling investigation.
During the CalPrex pilot tests [27], some biomass was found to escape the centrifugation and settle in the clarifier with the brushite. Here, even without any lime added, the CalPrex configuration is predicted to capture ~25 kg of non-brushite P per day. Approximately 90% of this P is biomass-P that passes through the centrifuge and settles in the clarifier, and the rest is soluble orthophosphate occluded with the biosolids. The organic P and the associated biomass might be considered either an impurity or an amendment to recovered brushite, depending on the market.
Lime addition beyond approximately 800 kg Ca/d showed an acceleration in pH increase as buffering capacity was overcome, and the great majority of the soluble P was removed from the solution as brushite. The target pH of 7 was reached when approximately 960 kg of Ca per day was added, and ~420 kg P/d was captured as brushite. Total predicted brushite capture peaked at roughly 975 kg Ca/d, or pH 7.2, with 82% of soluble-P entering the CalPrex reactor precipitated. Beyond this point, struvite begins to form at the expense of brushite; total P capture continued to increase only slightly with lime addition, and the CalPrex process may be terminated.
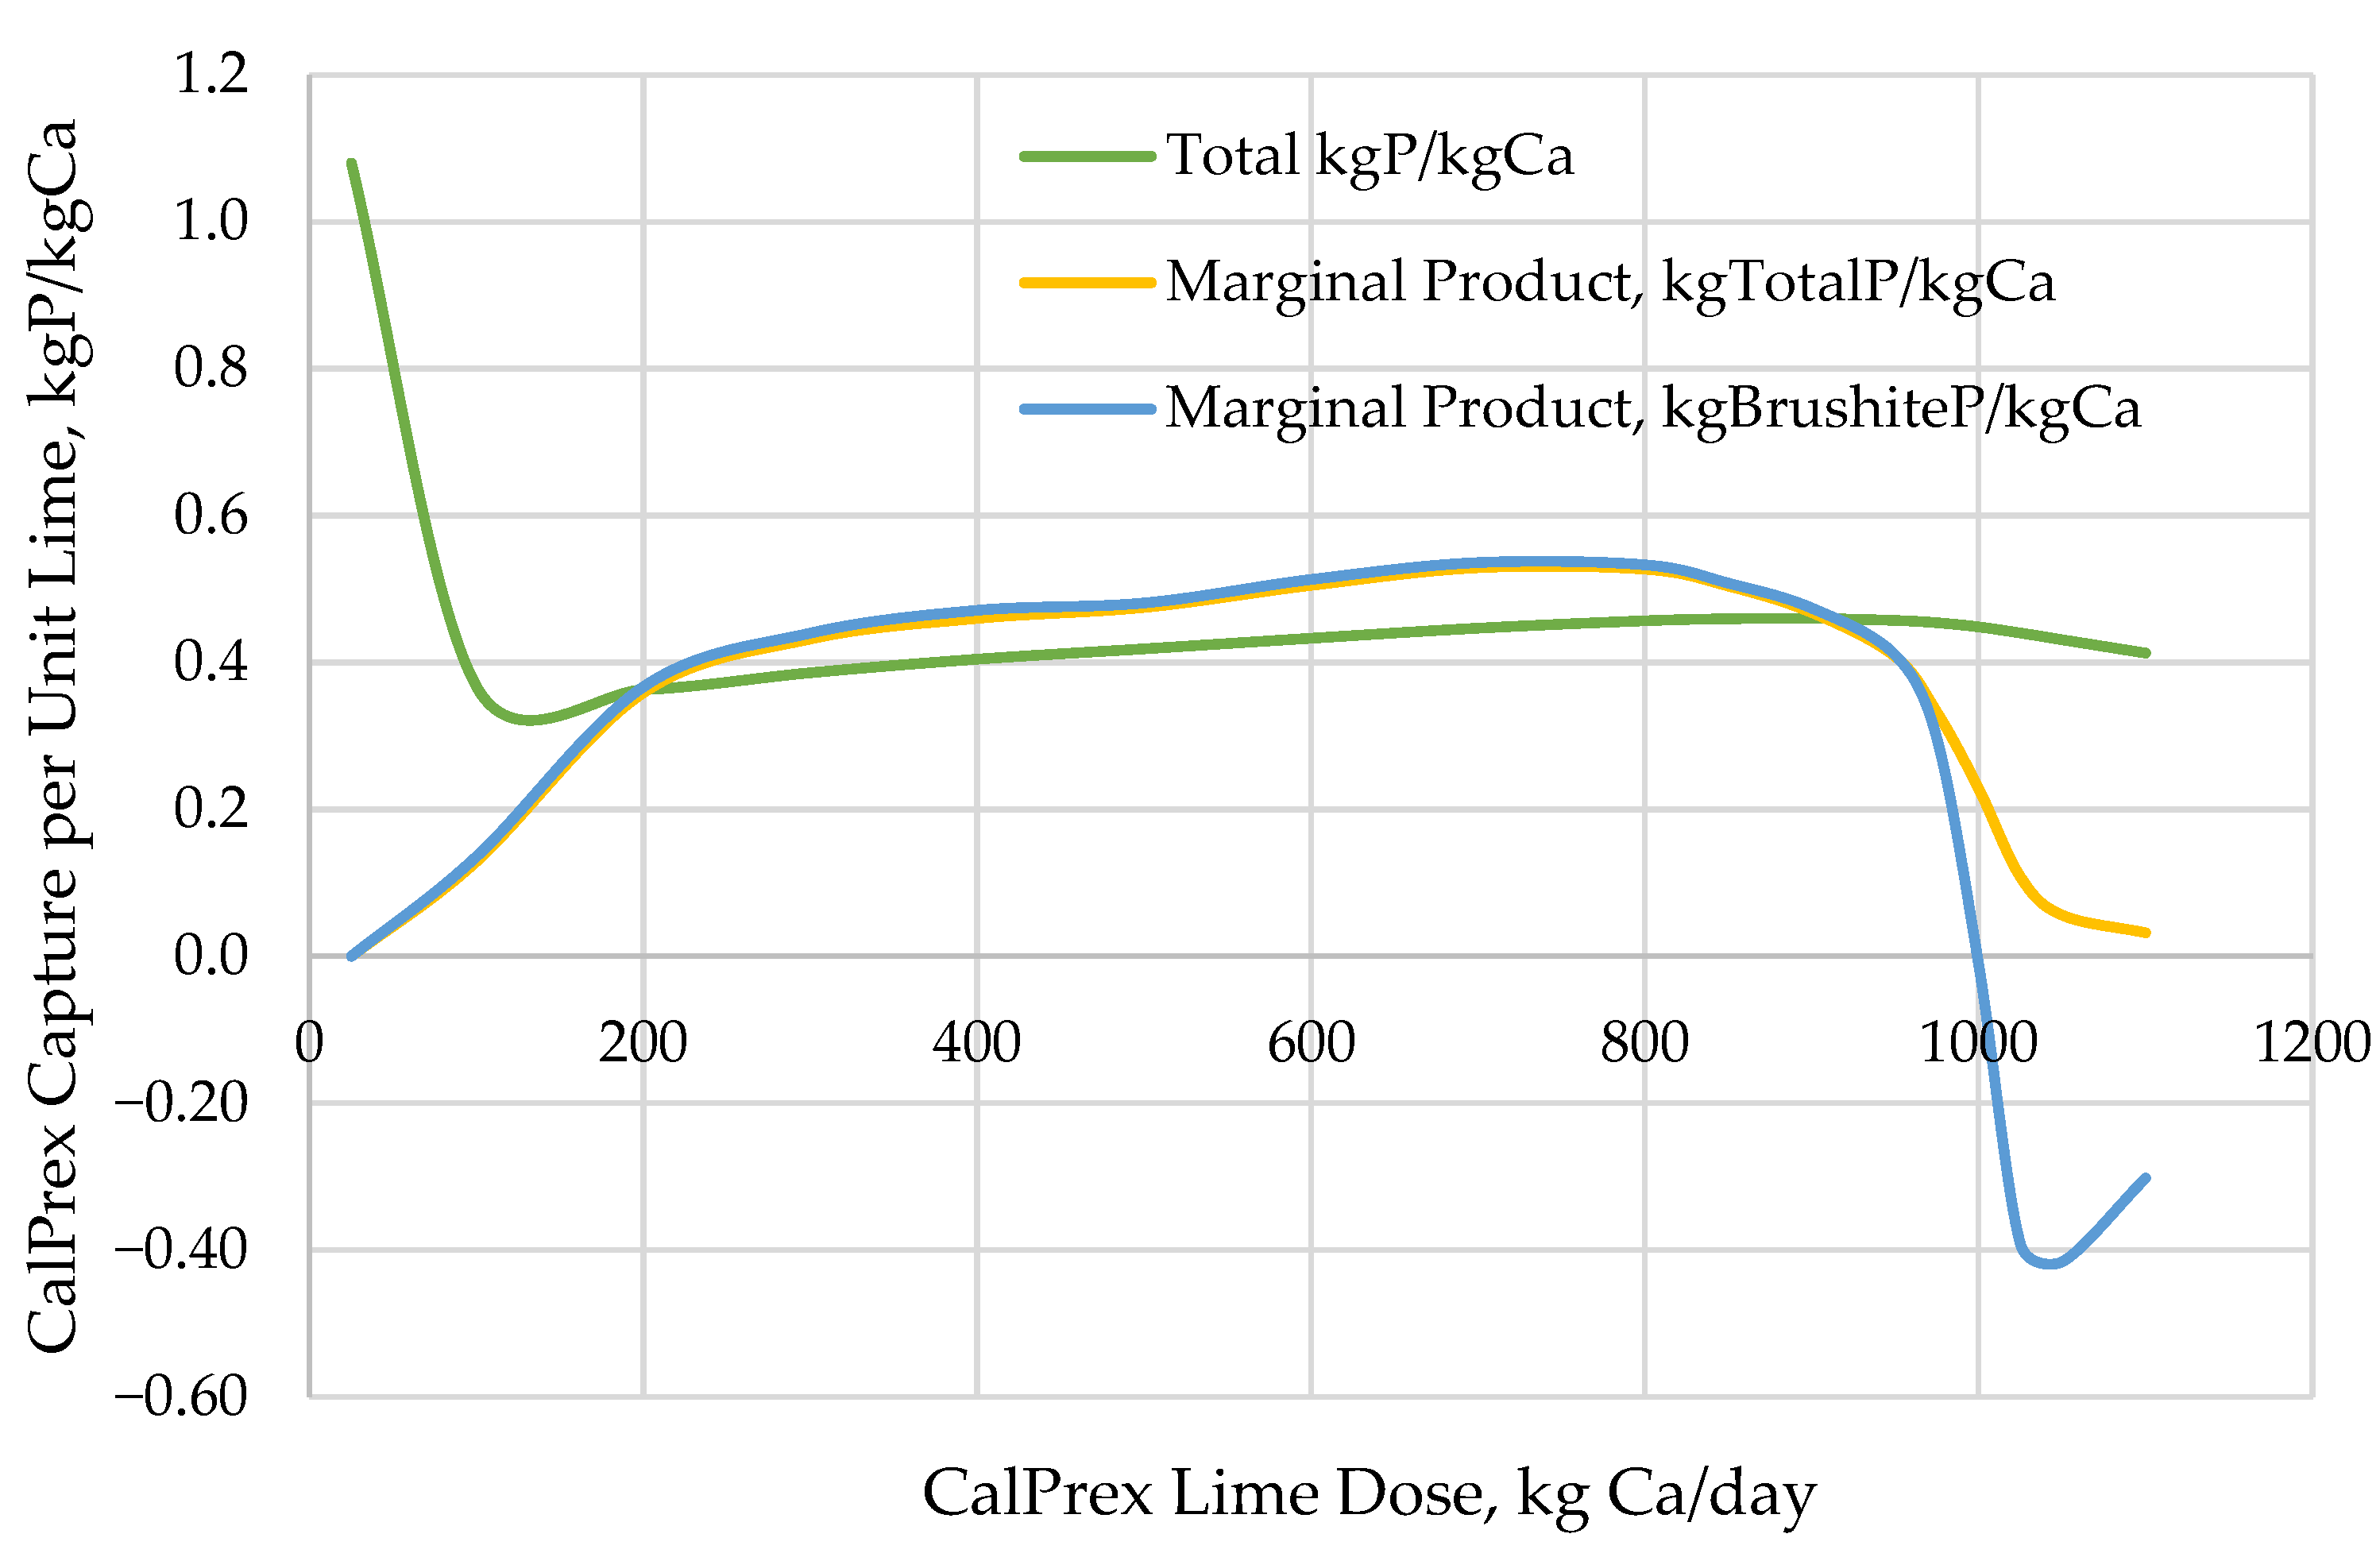
These modeling predictions allow calculation of the marginal product, i.e., incremental P capture per lime dose (Figure 5). An ideal system might return brushite P in a 1:1 stoichiometric ratio with added lime-Ca, returning 31 kg P per 40 kg Ca dosed or a 0.775 mass ratio. Instead, the real-world conditions of this acid digestate result in lower yields, reflecting the need for more hydroxide to titrate VFAs and phosphates, to raise pH, drop the solubility of brushite, and precipitate brushite from the digest than for Ca to react with phosphate to form brushite. Each consecutive kg of lime added causes a corresponding quantity of P to precipitate, but this quantity does not remain constant. An operator can use the incremental P capture curve to inform their dosage for tradeoffs between performance and cost-effectiveness. While the lowest doses precipitated no brushite because of undersaturation, by pH 5.7 precipitating 1 kg of soluble P as brushite required less than 2 kg of Ca input; above pH 7.5, additional lime dosage caused a loss of brushite, and the new conditions caused by the added hydroxide favored struvite formation instead. Total P capture per total lime addition peaked around pH 6.4, where 875 kg Ca/d precipitated 400 kg P/d for a 0.460 mass ratio (or a 59% yield). However, the total P capture remained above a 0.4 mass ratio even past pH 8.5, suggesting that operators have a wide range of tolerable lime dosages, at least until the chemical dispersion effects of higher pH become relevant [10]. Marginal total P recovery did not appear to stop until approximately pH 9, requiring 1200 kg Ca/d.
4. Discussion
Comparing plant-wide P distribution between the two scenarios, we find that CalPrex was not predicted to substantially alter the treatment plant effluent P, with the expected effluent P reduced from 57.3 kg P/d in the control state to 54.5 kg P/d after CalPrex installation. Instead, CalPrex implementation greatly reduced P precipitates within the biosolids compared to the control (Table 2). After introducing CalPrex, the total soluble P entering the anaerobic methanogenic digesters is decreased by nearly 250 kg P/d (138 vs. 385 kg/d), and so the total P precipitating in the anaerobic digesters is decreased by over 50% (289 vs. 554 kg/d). The net effect of CalPrex is a 44% reduction in biosolid P content as compared to the reference state with EBPR alone.
A full-scale CalPrex process should reduce the tendency for P-based precipitates to form in pipes and reactors downstream of the anaerobic digester by reducing soluble P. This benefit is potentially shared with other P removal technologies, depending on their location within the treatment stream, though CalPrex directly precedes the anaerobic digester and can specifically reduce the substrate available for struvite precipitation.
During the anaerobic digestion process, precipitate formation shifts from struvite formation to brushite formation. The total struvite production in the anaerobic digester is expected to be reduced from 3.2 tons of dry solids per day in the control state to 0.6 tons of dry solids per day with the CalPrex system in operation. Conversely, the total brushite production increases from 0.81 tons of dry solids per day to 1.1 tons of dry solids per day. The CalPrex process added to the treatment train is, therefore, expected to reduce P precipitation in the anaerobic digester by 55% on a mass basis.
The reduced precipitate formation in the anaerobic digesters impacts the biosolids contents as well, equating to a direct reduction of more than 10% of dry sludge mass. Furthermore, the additional reduction of total P content by almost 50% could have significant dewatering benefits to the treatment plant [10], potentially reducing the total wet mass by more than 10%, as indicated by total solids. Though not reflected in BioWin outputs, this secondary benefit could reduce biosolid removal costs to the operator. The drier sludge with its lower P content might be a more attractive soil amendment to local agriculture. It has better balanced N and P content and lower overall weight, making it easier to land apply in nearby fields.
4.1. Uncertainty Analysis
P solubilization is weakly responsive to the acid digester pH. A pH two SD below the mean solubilizes 0.4% less P than the mean, while a pH two SD above the mean solubilizes 3% less P than the mean. This 3% reduction is a result of inhibited heterotrophs releasing less biological P from degradable organics and, more importantly, the less acidic environment lowering the solubility of brushite and leading to a solution that is saturated in soluble P but at lower P concentrations.
Total capture of P by CalPrex is minimally impacted by low pH conditions (Figure 6), but higher pH conditions are predicted to reduce P capture by 13%. At higher digestate pH values, a higher portion of total P remains in the biosolids and bypasses the CalPrex reactor entirely. Lower pH values are indicative of higher VFA concentrations and require proportionately more lime to reach pH 7 (Figure 7). These two considerations, increased P capture as brushite but at the cost of more lime to overcome VFA acidity, result in a nearly linear net effect of falling brushite returns in terms of P per Ca at pH values below the mean and higher returns about the mean (Figure 8). The range of pH values tested yielded a reagent efficiency of 0.456 ± 0.11 kg P per kg Ca.
4.2. Cabinet Model Demonstrations
4.2.1. Nitrogen Removal Plant Cabinet Model with CalPrex
The N removal cabinet model is comprised of primary and secondary treatment, wherein the sludge is digested in an anaerobic digester. The digester effluent is then dewatered, and the liquids are processed through a nitrification/denitrification step before returning to the headworks. The plant does not intentionally cultivate phosphate-accumulating organisms, so its activated sludge is not particularly rich in P. The 125 m3/d digester influent stream has only a 106 kg/d P load for a total P concentration of 849 mg P/L (Table 3). Upon splitting the sludge digestion into acid and anaerobic steps as per Vineyard et al. [32,33], the acid digester achieves a 57% P solubilization rate, primarily from hydrolysis of degradable organics from the primary sludge due to the shortage of other readily releasable P entering the acid digester. It has a soluble-P concentration of 483 mg soluble P/L, about 30% less than the expectation from the post-EBPR acid digester of Nine Springs.
The disadvantageous acid digester conditions of the N removal plant are reflected in CalPrex reactor performance. Of the original 106 kg P exiting the acid digester, less than 50% makes it to the CalPrex clarifier as soluble P (Table 4). Due to the lower overall P concentration, it takes a higher lime dose to reach the brushite solubility point, and the proportional P capture is reduced. At pH 7, the reactor has achieved a capture ratio of 0.423 kg P/kg Ca dosage, about 90% of the rate achieved by CalPrex modeled in the Nine Springs configuration. More than 55% of the CalPrex product, by weight, was not brushite but instead organic material that had escaped initial separation and was captured alongside brushite (Table 4).
Downstream, the dilution caused by the CalPrex polymer addition reduced the HRT of the anaerobic digesters, which decreased the volatile suspended solids (VSS) destruction and the methane generation by the digesters (Table 5). CalPrex halted struvite generation in the anaerobic digester and thus eliminated it from the biosolids with no increase in brushite contents (Table 6). Overall, the CalPrex process reduced the plant’s effluent P by 25%, from 120 to 90 kg effluent-P/d, and its biosolid P by 17% (Table 7), possibly reducing dewatering costs. The addition of CalPrex operations did not noticeably impact the net N content of the effluent.
4.2.2. EBPR Plant Cabinet Model with CalPrex
Like the Nitrogen Removal cabinet model above, the cabinet EBPR reactor configuration is composed of primary and secondary treatment but specifically cultivates phosphate accumulating organisms in the sludge. The primary and activated sludges are diverted to a 20-day HRT anaerobic digester process before being partitioned entirely to waste with no solid/liquid separation and, therefore, no recycling of P-bearing liquid from the anaerobic digestate to the headworks.
After the addition of a CalPrex reactor and an acid digester [32,33], the acid digester is predicted to achieve roughly 64% P solubility (Table 3) in its 56 m3/d stream for a total soluble P concentration of 719 mg P/L, which is slightly higher than the Nine Springs equivalent. This high soluble P concentration allows the CalPrex clarifier to return 0.522 kg of P as brushite for each kg of Ca as lime dosed and yields a product that is 56% brushite by dry weight (Table 4).
In this configuration, CalPrex increases the brushite precipitation but lowers the struvite precipitation in the anaerobic digester for a net decrease in anaerobic P precipitate formation. The total P in the biosolids is reduced by roughly 44%, and the soluble P in the biosolids is reduced by 92% (Table 6), potentially offering dewatering benefits. The dilution caused by the polymer addition of the CalPrex process reduces both solids destruction and methane generation (Table 5) in the subsequent anaerobic digester because of reduced HRT in a fixed-size reactor. The effect of dilution was greater in this cabinet model than in Nine Springs because of the difference in HRT, 34 days at Nine Springs and 20 days here. Without a recycle stream, there are no effects on the main treatment stream’s phosphorus content (Table 7).
Overall, the cabinet model configurations imply that the beneficial effects of CalPrex can be generalized beyond the Nine Springs plant. Any plant with an acidogenic digester may be able to install a CalPrex reactor and achieve benefits such as reduced accumulation of nuisance P precipitates in the anaerobic digesters, reduced P content of plant biosolids, and/or reduced biosolid dewatering costs. Plants with EBPR trains preceding the anaerobic digestion may see higher capture rates and reagent efficiencies, but plants without an EBPR train could reduce the P content of their main effluent stream without needing an overhaul of their treatment train.
4.3. CalPrex Installation and Operation
CalPrex has never been implemented at full scale, so the precise needs for efficient implementation and maintenance are not yet known. CalPrex requires a preceding acidogenic anaerobic digester, so full-scale installations should be considered for treatment plants already using a two-phase anaerobic digestion system. A plant considering transitioning to a two-phase system may see the possibility of CalPrex implementation for struvite control as an additional benefit; similarly, a plant seeking to control struvite may consider the additional cost of adding an acidogenic digester as a worthwhile tradeoff because of the increased digestion performance of a two-phase system.
Experimentation has suggested that a reactor pH above 7.2 can greatly diminish the settling rate of precipitated brushite [10], typically yielding fine granules that form a sludge with a much higher water content than the product of a reactor functioning at pH 7 or below. This dispersion would require both a larger settling tank and additional energy for dewatering to create a viable product. At this point, the buffering capacity of VFAs has been expended, and precipitation of soluble P leaves the pH highly sensitive to input lime dosage, so a target of pH 7.0 is expected to be the highest pH an operator would desire. A full-scale implementation would likely need advanced control systems that continuously monitor solution pH and tightly control the lime dosing.
The post-processing and transportation needs for the brushite produced are also unknown. The brushite is intended to be sold as a fertilizer or soil amendment. In the CalPrex plant, predicted brushite purity was 60% with 11% P by dry weight, which closely matched the pilot test measurements [27] and is comparable to triple and single superphosphates. Increased brushite purity may require more efficient separation of organics out of the liquid phase of acid digester centrate or a preliminary clarifier to further settle the organics before lime dosing and brushite collection. Drying, pelletization, bagging, and marketing needs for the brushite are still being tested but may be comparable to similar struvite-based technologies.
The anaerobic digester was shown to decrease solids destruction and methane generation levels after the installation of the CalPrex precipitator, most likely due to the 27% dilution caused by polymer addition deployed at the pilot-scale plant. Real-world effects of dilution will depend on individual treatment plants and their digester HRTs. A full-scale installation would have better options than a large dilution, however, including replacing the freshwater used for polymer preparation with either CalPrex effluent (already stripped of P) or acid digester centrate (dosed with polymer, solids removed but still high in P). The latter possibility would allow soluble P to enter the CalPrex reactor undiluted, likely eliminating HRT changes in the anaerobic digester and possibly improving brushite recovery by avoiding the reduction of soluble P concentrations upon dilution. Another option would be to seek a polymer that would not require such dilution.
The installation of a CalPrex precipitator uniformly reduced the quantity of digester sludge produced by the anaerobic digester after clarification and/or dewatering, both because of the intended capture of P as brushite and the unintended capture of organics as an impurity in the brushite precipitator. However, the mass of CalPrex product was greater than the reduction in digester sludge produced, so a facility intending to landfill the brushite alongside the biosolids would not experience a net reduction in solids. In all cases, the addition of the CalPrex reactor reduced the daily flow of P to the biosolids, and the P precipitated in those biosolids. This reduction could help alleviate concerns about excess P in biosolids land application and divert that P to more productive use.
4.4. Study Limitations and Future Work
Though based on thorough data, this is ultimately a modeling study. By definition, a model cannot capture all possible mechanisms or sources of variability. This study is limited by BioWin’s inability to reliably capture the effects of variable influents in a dynamic simulation. Currently, dynamic simulations using characteristic influent variability of the Nine Springs plant result in static predictions of acid digester function that do not reflect the variability in sampling data [32,33]. This makes it difficult to predict the effects of this variability on the function of nutrient recovery technologies like CalPrex.
While CalPrex has been predicted to greatly reduce nuisance precipitates in the anaerobic digesters and produce a saleable fertilizer product, the precise costs and operational needs of a full-scale implementation are unknown. The technology needs estimates of capital, operation, and maintenance costs, in addition to energy and reagent, which need to be compared with competitor technologies. In addition, the environmental benefits of recovering phosphorus from waste should be compared to the environmental costs of consuming energy and lime. The next step for this research is a detailed life cycle assessment and techno-economic analysis of the CalPrex system. If these prove favorable, additional pilot-scale implementations can increase data reliability and may lead to full-scale installations.
5. Conclusions
The modeling efforts presented in this work yielded the following findings:
- A full-scale CalPrex process was predicted to reduce struvite formation in the anaerobic digesters by 80% and total precipitate formation by 58%.
- The total phosphorus content of the biosolids was decreased by 50%, and the total dry sludge mass was reduced by 12%.
- CalPrex captured 1 kg phosphorus for every 2.1–2.5 kg of calcium as lime added.
- Any plant with an acidogenic digester may be able to install a CalPrex reactor and achieve benefits such as reduced accumulation of nuisance P precipitates in the anaerobic digesters, reduced P content of plant biosolids, and/or reduced biosolid dewatering costs.
- A techno-economic analysis and life cycle assessment is needed to weigh costs and benefits fully.
Author Contributions
Conceptualization, K.K. and P.B.; Methodology, D.V.; Software, D.V.; Formal analysis, D.V.; Investigation, D.V.; Resources, P.B.; Writing—original draft, D.V.; Writing—review & editing, D.V., K.K. and P.B.; Visualization, D.V.; Supervision, K.K. and P.B.; Project administration, K.K. and P.B.; Funding acquisition, K.K. and P.B. All authors have read and agreed to the published version of the manuscript.
Funding
This work was funded by USDA/NIFA INFEWS/T3 Grant (Reference #2017-67003-26055), USDA/NIFA Hatch Grant No. WIS01920 (Accession # 1009816), and USDA/NIFA Hatch Grant No. WIS04092 (Accession # 7003184).
Data Availability Statement
Some MMSD-related data are confidential, but to demonstrate the principles of modeling an acid digester in BioWin, we have made available a modified version of a BioWin cabinet model with full supporting documentation at DOI 10.17605/OSF.IO/8DXM7.
Acknowledgments
We are grateful for the assistance of Matt Seib and the Madison Metropolitan Sewerage District.
Conflicts of Interest
The authors declare the following financial interests/personal relationships, which may be considered as potential competing interests: Phillip Barak reports financial support was provided by the US Department of Agriculture, National Institute of Food and Agriculture, and Hatch Grant. Phillip Barak reports a relationship with Nutrient Recovery and Upcycling, LLC, which includes board membership and equity or stocks. Nutrient Recovery and Upcycling, LLC, is the rights holder to US Patent 8,568,590 (issued 2013), “Phosphate recovery from acid phase digesters”.
Appendix A

Table A1.
Reference Acid Digester Function.
| BioWin Reference | Tabanpour et al. [27] | ||
|---|---|---|---|
| Flow | m3/d | 831 | 844 |
| pH | 5.14 | 5.13 | |
| Total P | kg P/d | 795 | 666 |
| Soluble P | kg P/d | 434 | 438 |
| Calcium Concentration | kg Ca/d | 213 | 445 |
| Ammonia Concentration | kg N/d | 919 | - |
| Total Solids | % | 3.4% (Suspended) | 4.75% |
Table A2.
Reference Anaerobic Digester Function.
| HRT | Hours | 811 |
|---|---|---|
| Brushite In | kg ISS/d | 0 |
| Brushite P In | kg P/d | 0 |
| Brushite Out | kg ISS/d | 491 |
| Brushite P Out | kg P/d | 88.3 |
| Struvite In | kg ISS/d | 0 |
| Struvite P In | kg P/d | 0 |
| Struvite Out | kg ISS/d | 2624 |
| Struvite P Out | kg P/d | 331 |
| Dry gas flow | m3/d | 821 |
| Off gas Methane | kg/d | 8214 |
| VSS Destruction | % | 37.6 |
| Ammonia Concentration | kg N/d | 1349 |
Table A3.
Reference Biosolids Contents.
| Flow | Unit | Value |
|---|---|---|
| Total P | kg P/d | 688 |
| Soluble P | kg P/d | 27.4 |
| Brushite | kg ISS/d | 488 |
| Brushite P | kg P/d | 87.8 |
| Struvite | kg ISS/d | 2608 |
| Struvite P | kg P/d | 329 |
| TSS | kg/d | 20,180 |
| VSS | kg/d | 13,489 |
Table A4.
Effects of CalPrex on Acid Digester Function.
| Reference | CalPrex, 0 Lime | CalPrex to PH 7 | ||
|---|---|---|---|---|
| Flow | m3/d | 831 | 831 | 831 |
| pH | 5.14 | 5.15 | 5.15 | |
| Total P | kg P/d | 795 | 817 | 847 |
| Soluble P | kg P/d | 434 | 462 | 482 |
| Ammonia Concentration | kg N/d | 919 | 886 | 886 |
| P Solubilization | % | 54.50% | 56.50% | 56.90% |
Table A5.
Effects of CalPrex on Anaerobic Digester Function.
| Reference | CalPrex, 0 Lime | CalPrex to PH 7 | ||
|---|---|---|---|---|
| HRT | hours | 811 | 628 | 628 |
| Brushite In | kg ISS/d | 0 | 0 | 352 |
| Brushite P In | kg P/d | 0 | 0 | 63.4 |
| Brushite Out | kg ISS/d | 491 | 628 | 311 |
| Brushite P Out | kg P/d | 88.3 | 113 | 56 |
| Struvite In | kg ISS/d | 0 | 0 | 0 |
| Struvite P In | kg P/d | 0 | 0 | 0 |
| Struvite Out | kg ISS/d | 2624 | 2353 | 1381 |
| Struvite P Out | kg P/d | 331 | 297 | 174 |
| Dry gas flow | m3/d | 821 | 786 | 749 |
| Off gas Methane | kg/d | 8214 | 7874 | 7870 |
| VSS Destruction | % | 37.6 | 36.6 | 36.6 |
| Ammonia Concentration | kg N/d | 1349 | 1283 | 1337 |
Table A6.
Effects of CalPrex on Biosolid Contents.
| Reference | CalPrex, 0 Lime | CalPrex to PH 7 | ||
|---|---|---|---|---|
| Total P | kg P/d | 688 | 686 | 450 |
| Soluble P | kg P/d | 27.4 | 29 | 5.3 |
| Brushite | kg ISS/d | 488 | 624 | 309 |
| Brushite P | kg P/d | 87.8 | 112 | 55.6 |
| Struvite | kg ISS/d | 2608 | 2339 | 1373 |
| Struvite P | kg P/d | 329 | 295 | 173 |
| TSS | kg/d | 20,180 | 19,200 | 17,813 |
| VSS | kg/d | 13,489 | 12,802 | 12,804 |
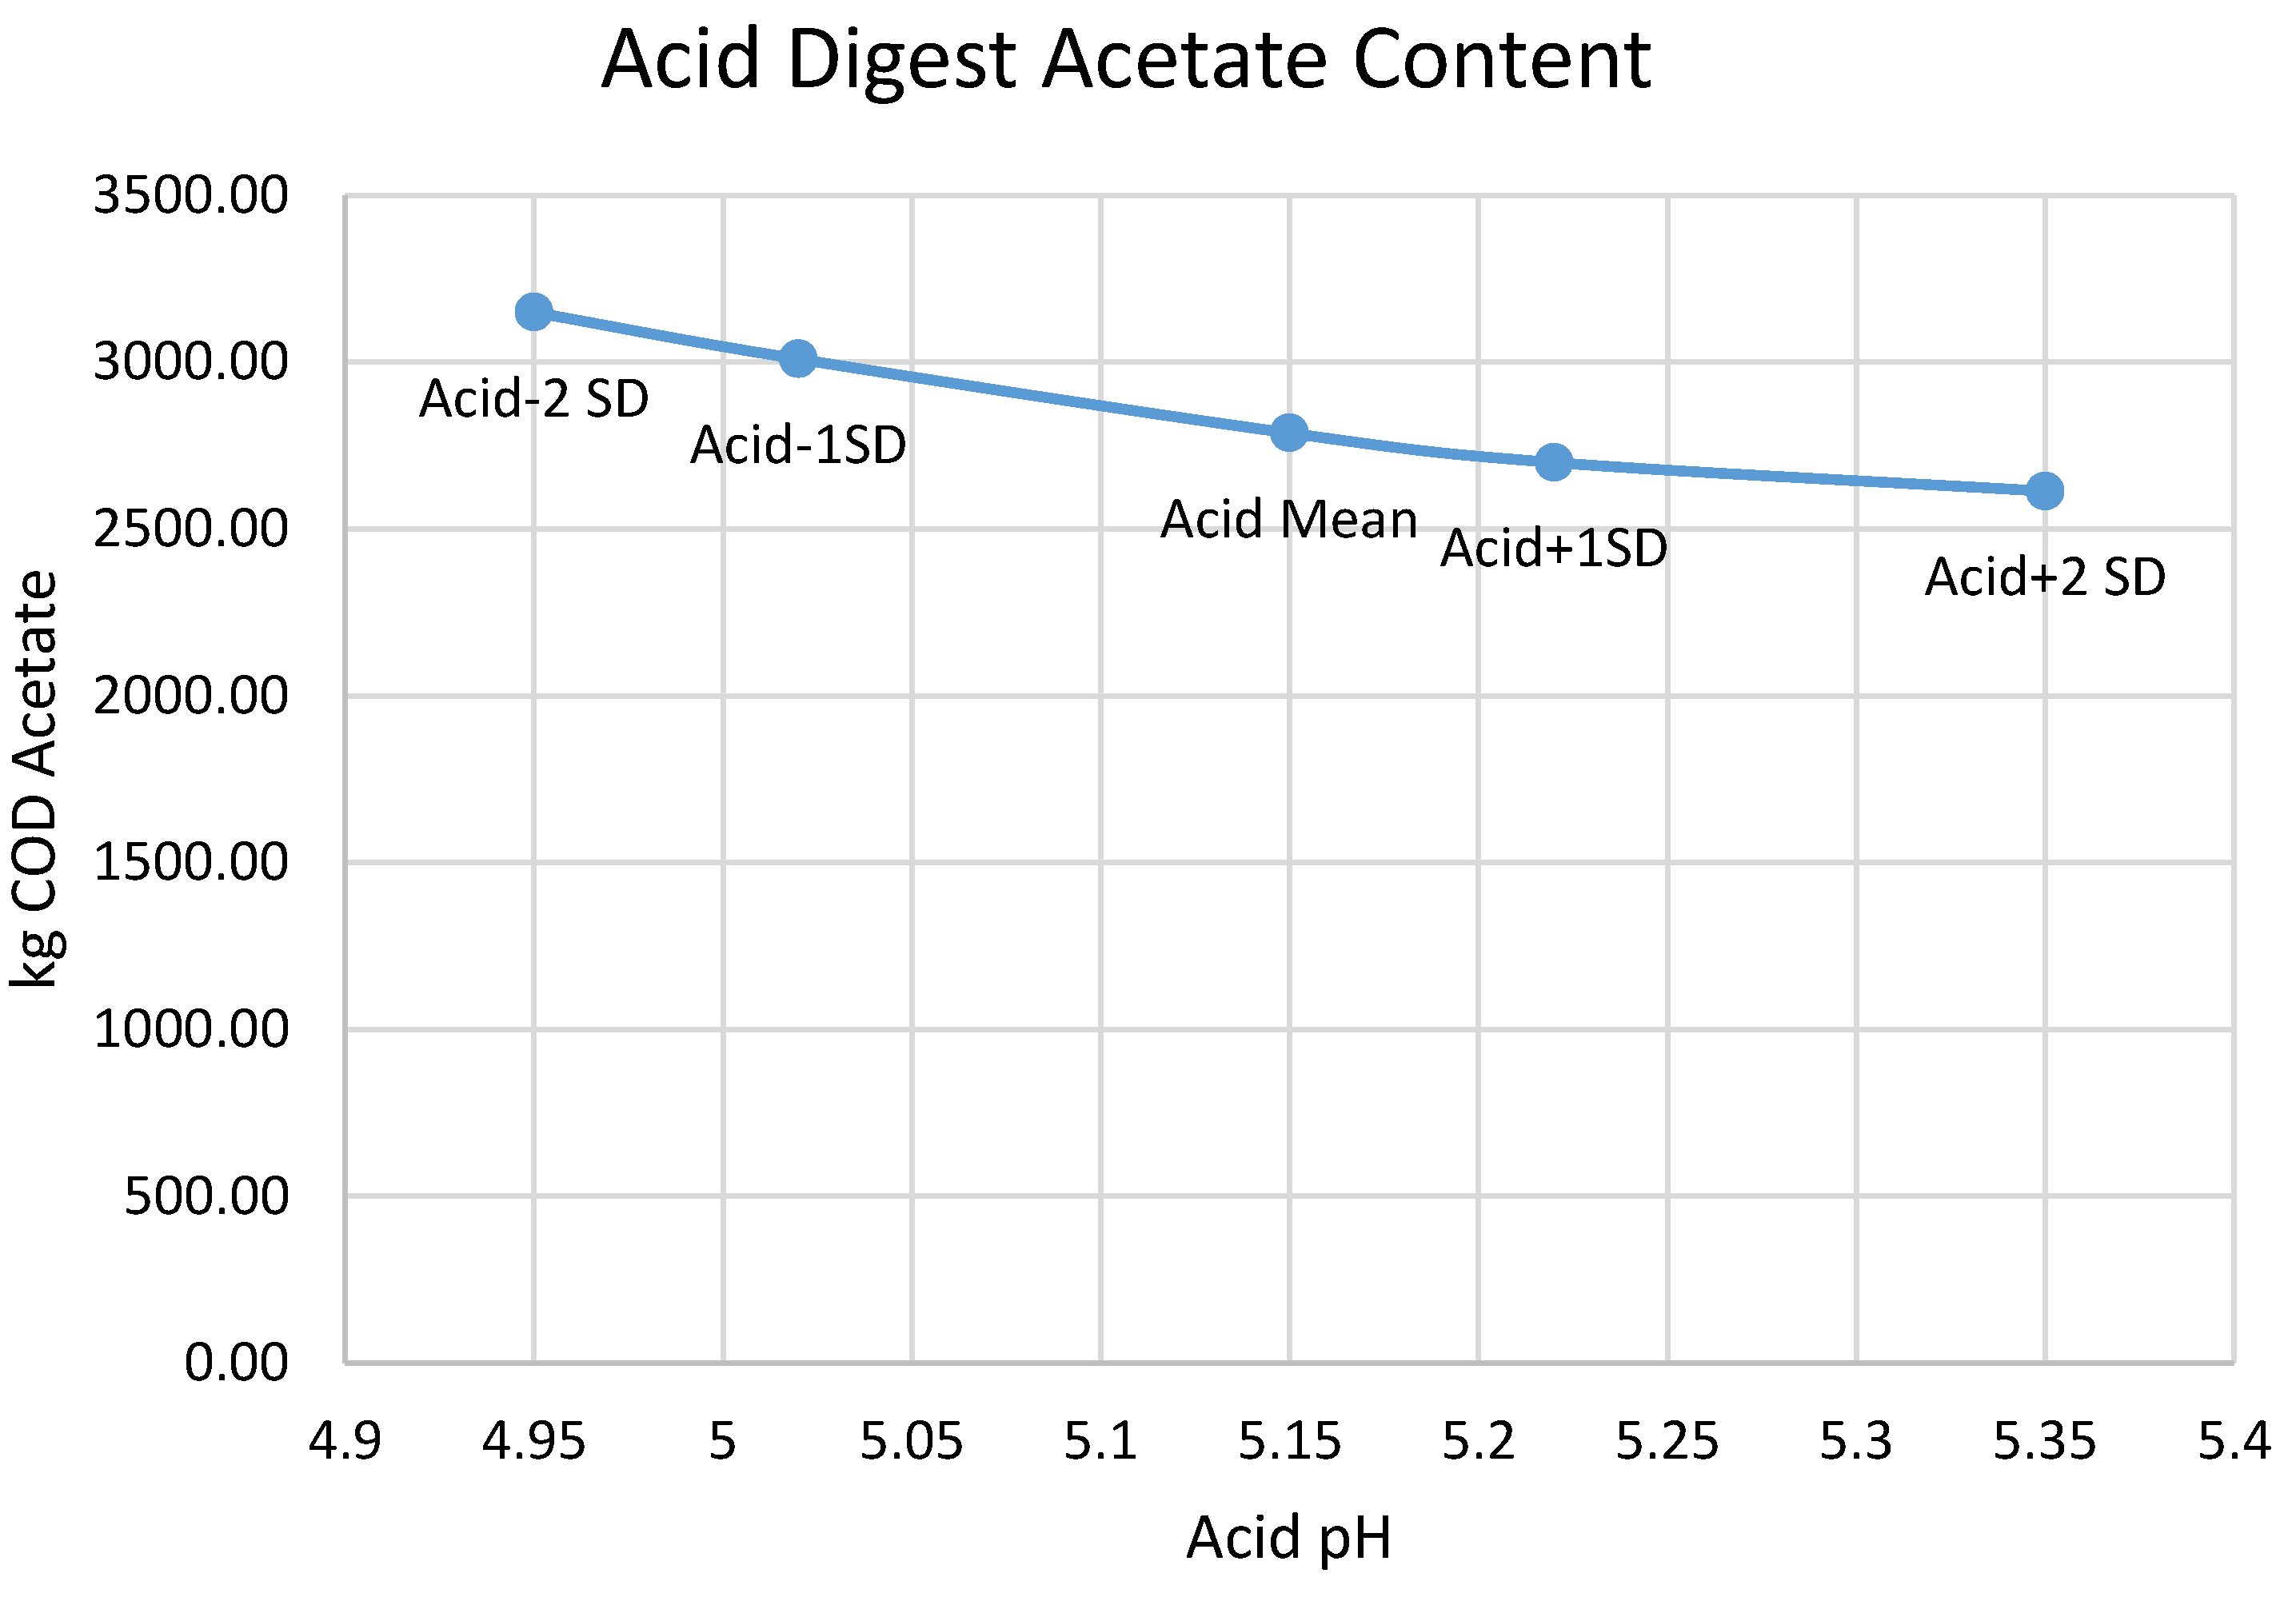
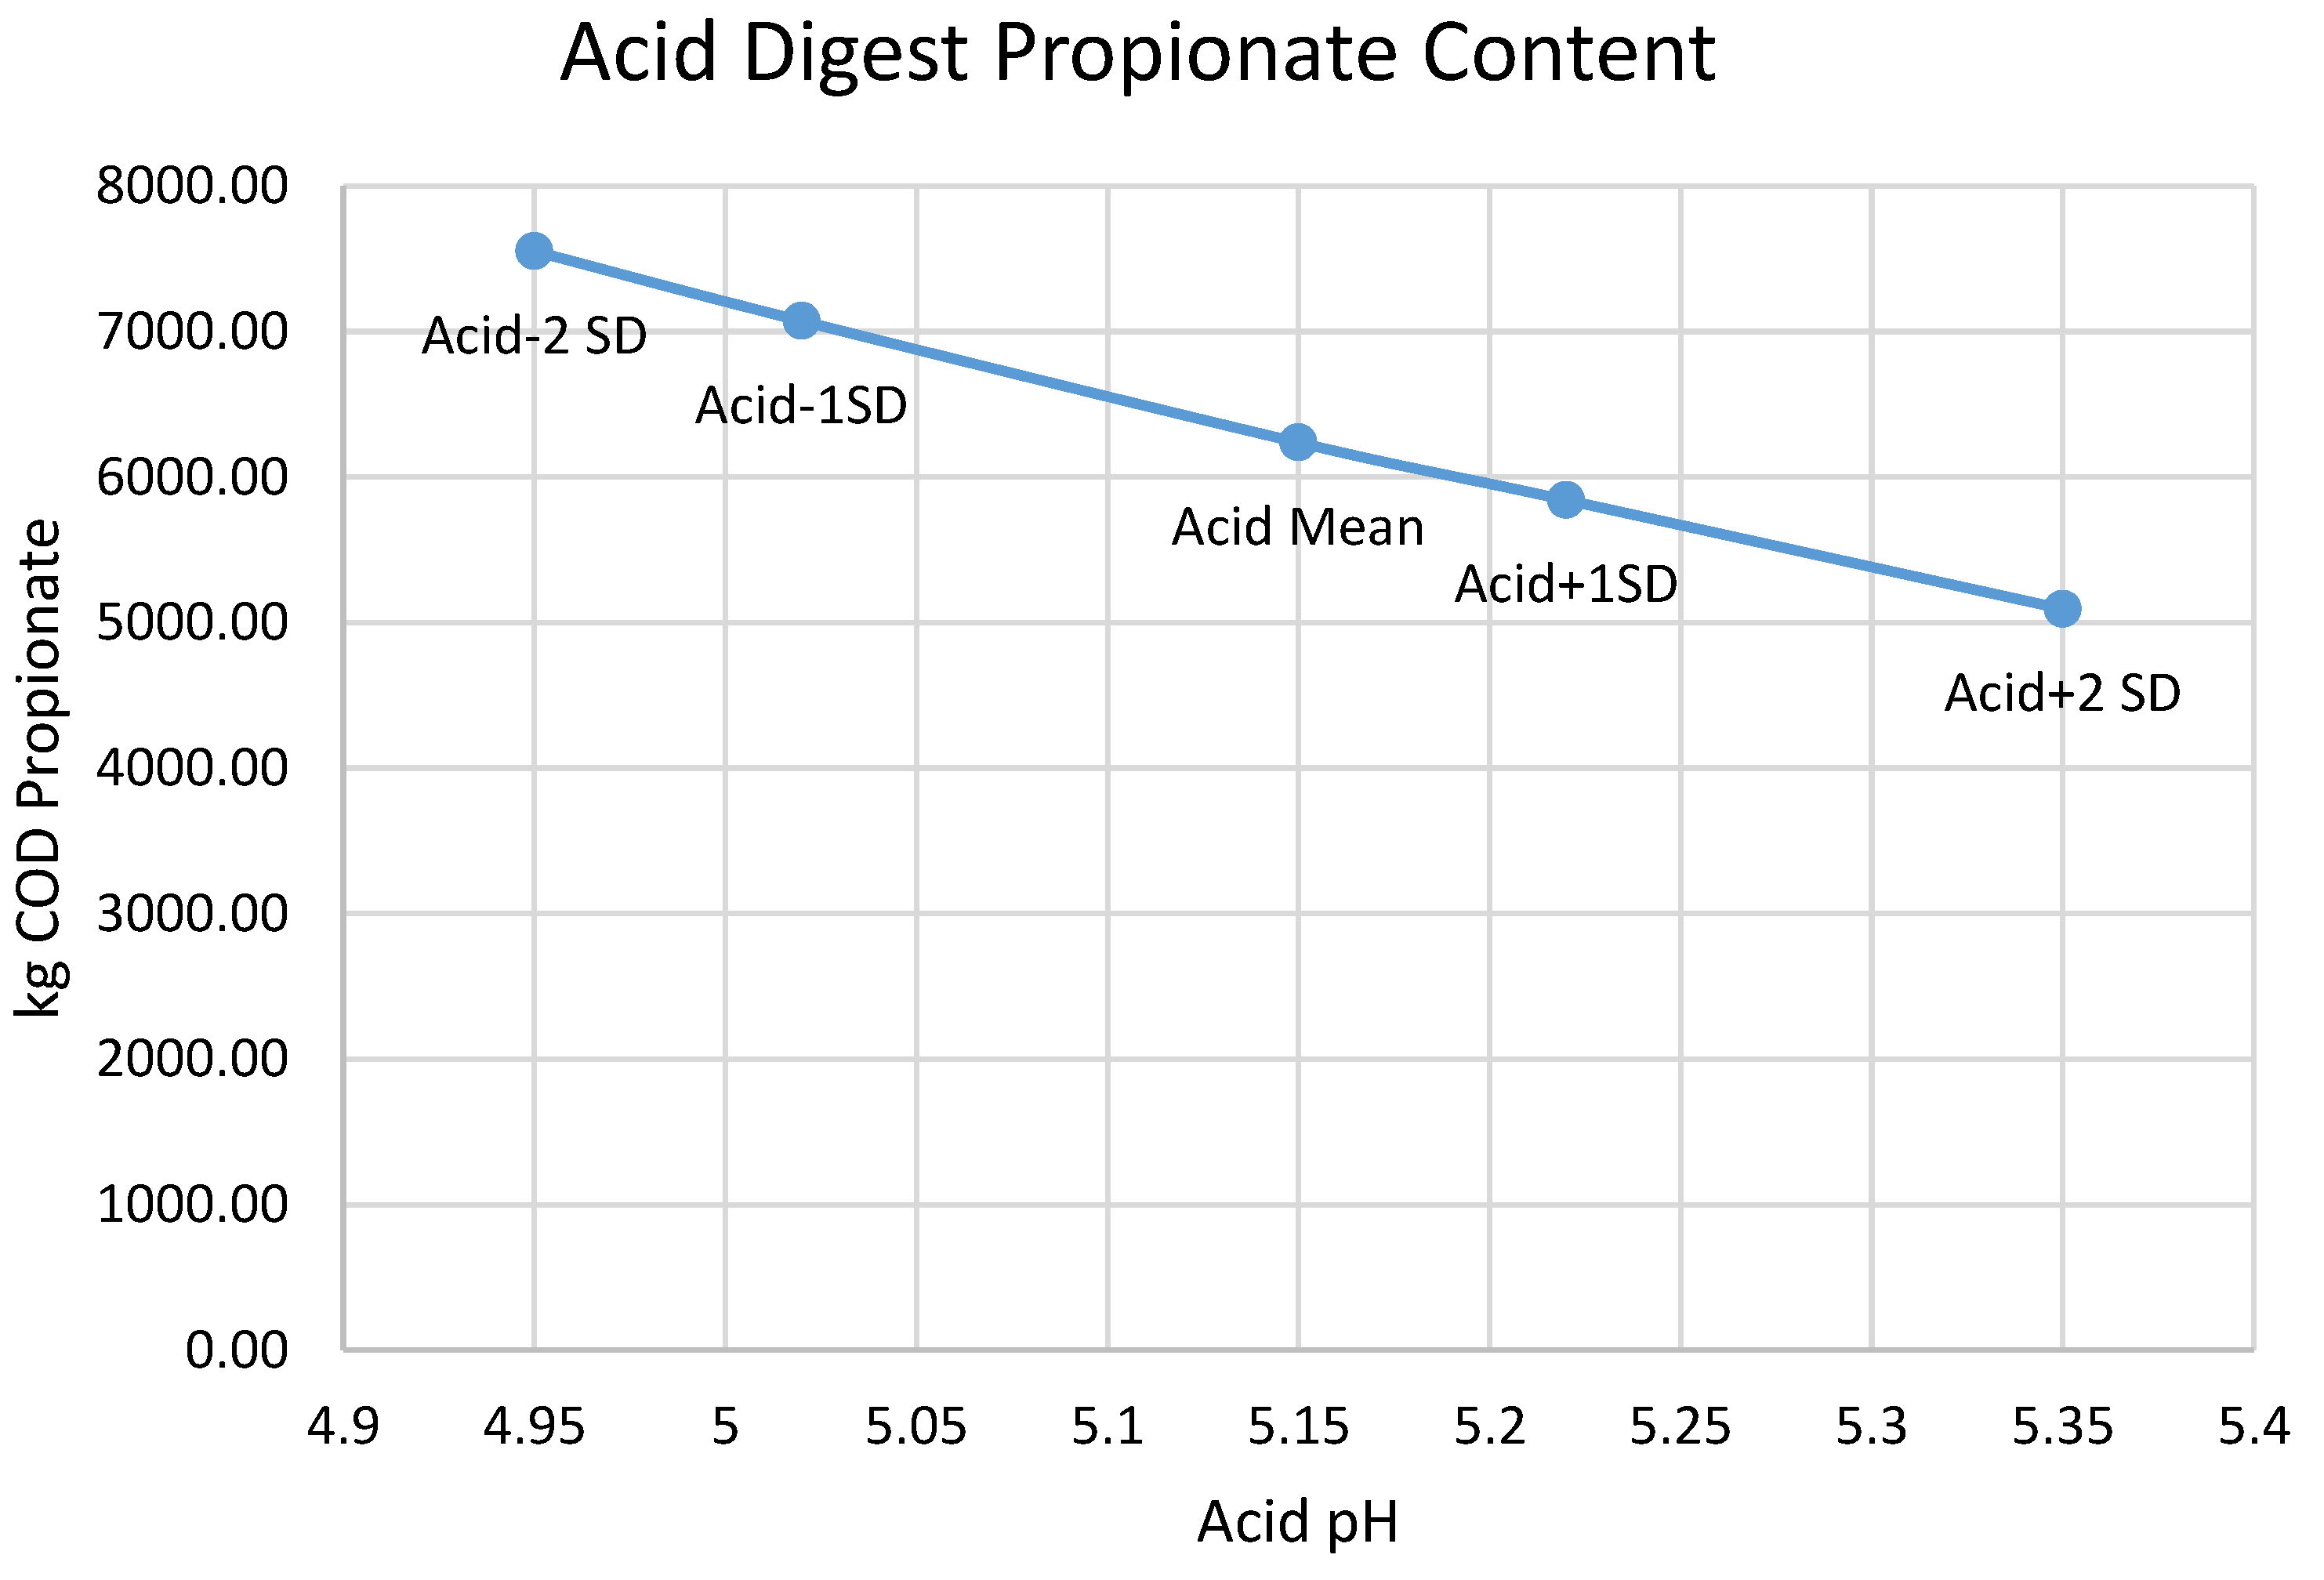
The pH inhibition threshold required to model a given acid digester pH is a nearly linear function of that pH (Figure A1, with a slope of ~1.5, which means that the pH inhibition threshold moves about 1.5x more than the acid digester pH that it is fitting. The mechanistic reason that BioWin causes pH to rise or fall in response to altering the kinetics of the heterotrophs in the acid digester is the production and accumulation of VFAs; the production of both acetic and propionic acids follows the acid digester pH in a nearly linear fashion (Figure A2 and Figure A3), with lower pH associated with higher VFA production.
Figure A1.
Relationship between the pH of the acid digester and the pH inhibition threshold needed to reach it. Points on the graph are mean and ± one and two standard deviations. Non-uniform spacing of the points is due software difficulty in achieving 0.01 pH precision.
Figure A1.
Relationship between the pH of the acid digester and the pH inhibition threshold needed to reach it. Points on the graph are mean and ± one and two standard deviations. Non-uniform spacing of the points is due software difficulty in achieving 0.01 pH precision.

Figure A2.
Relationship between the predicted production of acetic acid and the acid digester pH chosen for optimization.
Figure A2.
Relationship between the predicted production of acetic acid and the acid digester pH chosen for optimization.

Figure A3.
Relationship between the predicted production of propionic acid and the acid digester pH chosen for optimization.
Figure A3.
Relationship between the predicted production of propionic acid and the acid digester pH chosen for optimization.

Appendix A.1. Calibration Notes
The reduction in P concentrations suggests that the polymer added a total of 27% to the volume. We match this with an input of unadulterated water (224 m3/d).
- Calibrating the input solids removal
The Calprex system does not react pure acid digester effluent. Instead, it centrifuges a stream and rejects the solids. Under pilot conditions [27], centrifugation reduced total solids in the centrate from 4.75% to 0.41% TS, suggesting 91.4% solids rejection. Centrate was also reported to contain 57.7–59% of total phosphorus and 84% of soluble phosphorus, which suggests the centrate was 84% of total liquid volume. In the BioWin model, we used a dewaterer to reject 16% of liquids and 91.4% of solids directly to the anaerobic digester. In the remainder, the total P concentration is 524 mg P/L and the calcium is 264 mg/L. Our model captures 84% of soluble P but only 48% of the total P due to the lower overall P solubilization (66% observed vs. 52% predicted), but matching P and Ca concentrations is more important for CalPrex calibration purposes.
- Calibrating the effluent dewaterer
The CalPrex process ends with a clarifier that collects the precipitate and then centrifuges it to reduce water content. In the pilot plant the clarifier captured 87.1% of total P in the centrate. The clarifier underflow was then centrifuged for another 96.5% capture. We model the double centrifuge process as a single dewaterer with 84.1% solid capture and assume 99% liquid rejection. A total of 49.9% of P from the acid digester stream was captured after that as particulate P.
In the modified configuration, the total quantity of P entering the sludge streams is higher than measured on-site due to differences in settling tank and clarifier function in the primary stream. Our modifications, however, have brought soluble P in the acid digester to within 5% of plant measurements. The configuration acid digester now handles a flow nearly equivalent to the pilot version in volume and pH.
Table A7.
CalPrex feed characteristics from site measurements compared to BioWin equivalent.
| CalPrex Pilot | BioWin Plant | |
|---|---|---|
| Flow m3/d | 50.7 | 886 |
| Soluble p mg/L | 429 | 421 |
| Total p mg/L | 459 | 460 |
| Soluble Calcium mg/L | 361 | 229 |
| Total solids | 0.41% | 0.384% (suspended) |
The CalPrex precipitator is an unaerated reactor dosed with calcium hydroxide. The precipitation tank is fed the reject water, or solids-reduced, portion from the intake centrifuge while the solids continue to the anaerobic digester. The liquids are dosed with lime and allowed to settle with a retention time of one to two hours before being centrifuged again. These solids are collected for processing while the P-depleted reject water continues to the anaerobic digester.
- BioWin Configuration Layouts
The CalPrex unit was modeled using eight BioWin processes (Figure A4). This was used to replace the existing anaerobic digester processes of two BioWin cabinet models (Figure A5 and Figure A6) in order to verify reproducibility.
Figure A4.
Example BioWin CalPrex Processes.

Figure A5.
BioWin Cabinet Model: N Removal + Anaerobic Digester + Sidestream Treatment Configuration.
Figure A5.
BioWin Cabinet Model: N Removal + Anaerobic Digester + Sidestream Treatment Configuration.

Figure A6.
BioWin Cabinet Model: EBPR + Anaerobic Digester Configuration.

References
- United States Department of Agriculture, Economic Research Service. Fertilizer Use and Price. 2018. Available online: https://www.ers.usda.gov/data-products/fertilizer-use-and-price.aspx (accessed on 25 June 2019).
- United States Environmental Protection Agency. A Compilation of Cost Data Associated with the Impacts and Control of Nutrient Pollution; United States Environmental Protection Agency, Office of Water: Washington, DC, USA, 2015. [Google Scholar]
- Carey, R.O.; Migliaccio, K.W. Contribution of Wastewater Treatment Plant Effluents to Nutrient Dynamics in Aquatic Systems: A Review. Environ. Manag. 2009, 44, 205–217. [Google Scholar] [CrossRef] [PubMed]
- United States Environmental Protection Agency. NPDES Nutrient Data Tables; United States Environmental Protection Agency: Washington, DC, USA, 2023. [Google Scholar]
- United States Environmental Protection Agency. An Urgent Call to Action—Report of the State-EPA Nutrient Innovations Task Group; United States Environmental Protection Agency: Washington, DC, USA, 2009. [Google Scholar]
- Cordell, D.; White, S. Peak phosphorus: Clarifying the key issues of a vigorous debate about long-term phosphorus security. Sustainability 2011, 3, 2027–2049. [Google Scholar] [CrossRef]
- Kataki, S.; West, H.; Clarke, M.; Baruah, D.C. Phosphorus recovery as struvite: Recent concerns for use of seed, alternative Mg source, nitrogen conservation and fertilizer potential. Resour. Conserv. Recycl. 2016, 107, 142–156. [Google Scholar] [CrossRef]
- Egle, L.; Rechberger, H.; Krampe, J.; Zessner, M. Phosphorus recovery from municipal wastewater: An integrated comparative technological, environmental and economic assessment of P recovery technologies. Sci. Total Environ. 2016, 571, 522–542. [Google Scholar] [CrossRef] [PubMed]
- Achilleos, P.; Roberts, K.R.; Williams, I.D. Struvite precipitation within wastewater treatment: A problem or a circular economy opportunity? Heliyon 2022, 8, e09862. [Google Scholar] [CrossRef] [PubMed]
- Boyce, A.L. Fertilizer-Grade Calcium Phosphate Recovery from Wastewater Treatment Plants. Master’s Thesis, University of Wisconsin-Madison, Madison, WI, USA, 2010. [Google Scholar]
- Doyle, J.D.; Parsons, S.A. Struvite formation, control and recovery. Water Res. 2002, 36, 3925–3940. [Google Scholar] [CrossRef]
- Jeyanayagam, S.; Khunjar, W.; Mehta, C. Accelerating the Implementation of Extractive Nutrient Recovery as an Integral Component of Sustainable Nutrient Management. Water E-J. 2016, 1, 1–8. [Google Scholar] [CrossRef]
- Jorgensen, T.C.; Weatherley, L.R. Ammonia removal from wastewater by ion exchange in the presence of organic contaminants. Water Res. 2003, 37, 1723–1728. [Google Scholar] [CrossRef]
- Fassbender, A.G. ThermoEnergy Ammonia Recovery Process for municipal and agricultural wastes. Sci. World J. 2001, 1 (Suppl. S2), 908–913. [Google Scholar] [CrossRef]
- Gogate, P.R.; Pandit, A.B. A review of imperative technologies for wastewater treatment I: Oxidation technologies at ambient conditions. Adv. Environ. Res. 2004, 8, 501–551. [Google Scholar] [CrossRef]
- Sugiyama, S.; Yokoyama, M.; Ishizuka, H.; Sotowa, K.; Tomida, T.; Shigemoto, N. Removal of aqueous ammonium with magnesium phosphates obtained from the ammonium-elimination of magnesium ammonium phosphate. J. Colloid. Interface Sci. 2005, 292, 133–138. [Google Scholar] [CrossRef] [PubMed]
- Uludag-Demirer, S.; Demirer, G.N.; Chen, S. Ammonia removal from anaerobically digested dairy manure by struvite precipitation. Process Biochem. 2005, 40, 3667–3674. [Google Scholar] [CrossRef]
- El-Bourawi, M.S.; Khayet, M.; Ma, R.; Ding, Z.; Li, Z.; Zhang, X. Application of vacuum membrane distillation for ammonia removal. J. Membr. Sci. 2007, 301, 200–209. [Google Scholar] [CrossRef]
- Tidåker, P.; Sjöberg, C.; Jönsson, H. Local recycling of plant nutrients from small-scale wastewater systems to farmland—A Swedish scenario study. Resour. Conserv. Recycl. 2007, 49, 388–405. [Google Scholar] [CrossRef]
- Turker, M.; Celen, I. Removal of ammonia as struvite from anaerobic digester effluents and recycling of magnesium and phosphate. Bioresour. Technol. 2007, 98, 1529–1534. [Google Scholar] [CrossRef] [PubMed]
- Quan, X.; Wang, F.; Zhao, Q.; Zhao, T.; Xiang, J. Air stripping of ammonia in a water-sparged aerocyclone reactor. J. Hazard. Mater. 2009, 170, 983–988. [Google Scholar] [CrossRef] [PubMed]
- Xie, Z.; Duong, T.; Hoang, M.; Nguyen, C.; Bolto, B. Ammonia removal by sweep gas membrane distillation. Water Res. 2009, 43, 1693–1699. [Google Scholar] [CrossRef]
- Quan, X.; Ye, C.; Xiong, Y.; Xiang, J.; Wang, F. Simultaneous removal of ammonia, P and COD from anaerobically digested piggery wastewater using an integrated process of chemical precipitation and air stripping. J. Hazard. Mater. 2010, 178, 326–332. [Google Scholar] [CrossRef]
- Alitalo, A.; Kyro, A.; Aura, E. Ammonia stripping of biologically treated liquid manure. J. Environ. Qual. 2012, 41, 273–280. [Google Scholar] [CrossRef]
- De Vries, J.W.; Groenestein, C.M.; De Boer, I.J. Environmental consequences of processing manure to produce mineral fertilizer and bio-energy. J. Environ. Manag. 2012, 102, 173–183. [Google Scholar] [CrossRef]
- Barak, P. Phosphate Recovery from Acid Phase Anaerobic Digesters. U.S. Patent US8568590B2, 29 October 2023. [Google Scholar]
- Tabanpour, M.; Downing, L.; Kuhnjar, W. Demonstrating the CalPrex System for High Efficiency Phosphorus Recovery. 2021, CNP—Technology Water and Biosolids Corporation and Nutrient Recovery and Upcycling (NRU). In WEFTEC; Water Environment Federation: Alexandria, VI, USA, 2021. [Google Scholar]
- Barak, P.; Davidson, C.; Minks, A. Chemical composition of organic acid digest from a municipal wastewater treatment plant and chemical modeling of nuisance struvite formation and phosphorus recovery as brushite. PLoS Water 2023, 2, e0000120. [Google Scholar] [CrossRef]
- Lehr, J.; Brown, W.E. Calcium phosphate fertilizers: II. A petrographic study of their alteration in soils. Soil Sci. Soc. Am. J. 1958, 22, 29–32. [Google Scholar] [CrossRef]
- Lunt, O.R.; AKofranek, M.; Clark, S.B. Nutrient availability in soil, availability of minerals from magnesium ammonium phosphates. J. Agric. Food Chem. 1964, 12, 497–504. [Google Scholar] [CrossRef]
- Ellis, B.; Foth, H. Soil Fertility; CRC Press: Boca Raton, FL, USA, 1996. [Google Scholar]
- Vineyard, D.; Karthikeyan, K.G.; Davidson, C.; Barak, P. Modeling an acid-phase digester in BioWin with parameter optimization from site data. J. Water Process Eng. 2023, 54, 103971. [Google Scholar] [CrossRef]
- Vineyard, D.; Karthikeyan, K.; Davidson, C.; Barak, P. BioWin Modeling of Phosphorus Solubilization in an Acid-Phase Digester. Environments 2023, 11, 31. [Google Scholar] [CrossRef]
- Envirosim Associates LTD. BioWin 6 Help Manual. 2020. Available online: http://www.envirosim.com/downloads/BW6Manual.pdf (accessed on 13 December 2023).
- AECOM. Chloride Compliance Study: Nine Springs Wastewater Treatment Plant Final Report. Madison Metropolitan Sewerage District. 2015. Available online: https://www.madsewer.org/wp-content/uploads/2021/12/STUDY-2015-District-Chloride-Compliance.pdf (accessed on 23 November 2023).
- Jeffreys, H.; Jeffreys, B. Methods of Mathematical Physics; Cambridge University Press: Cambridge, UK, 1999. [Google Scholar]
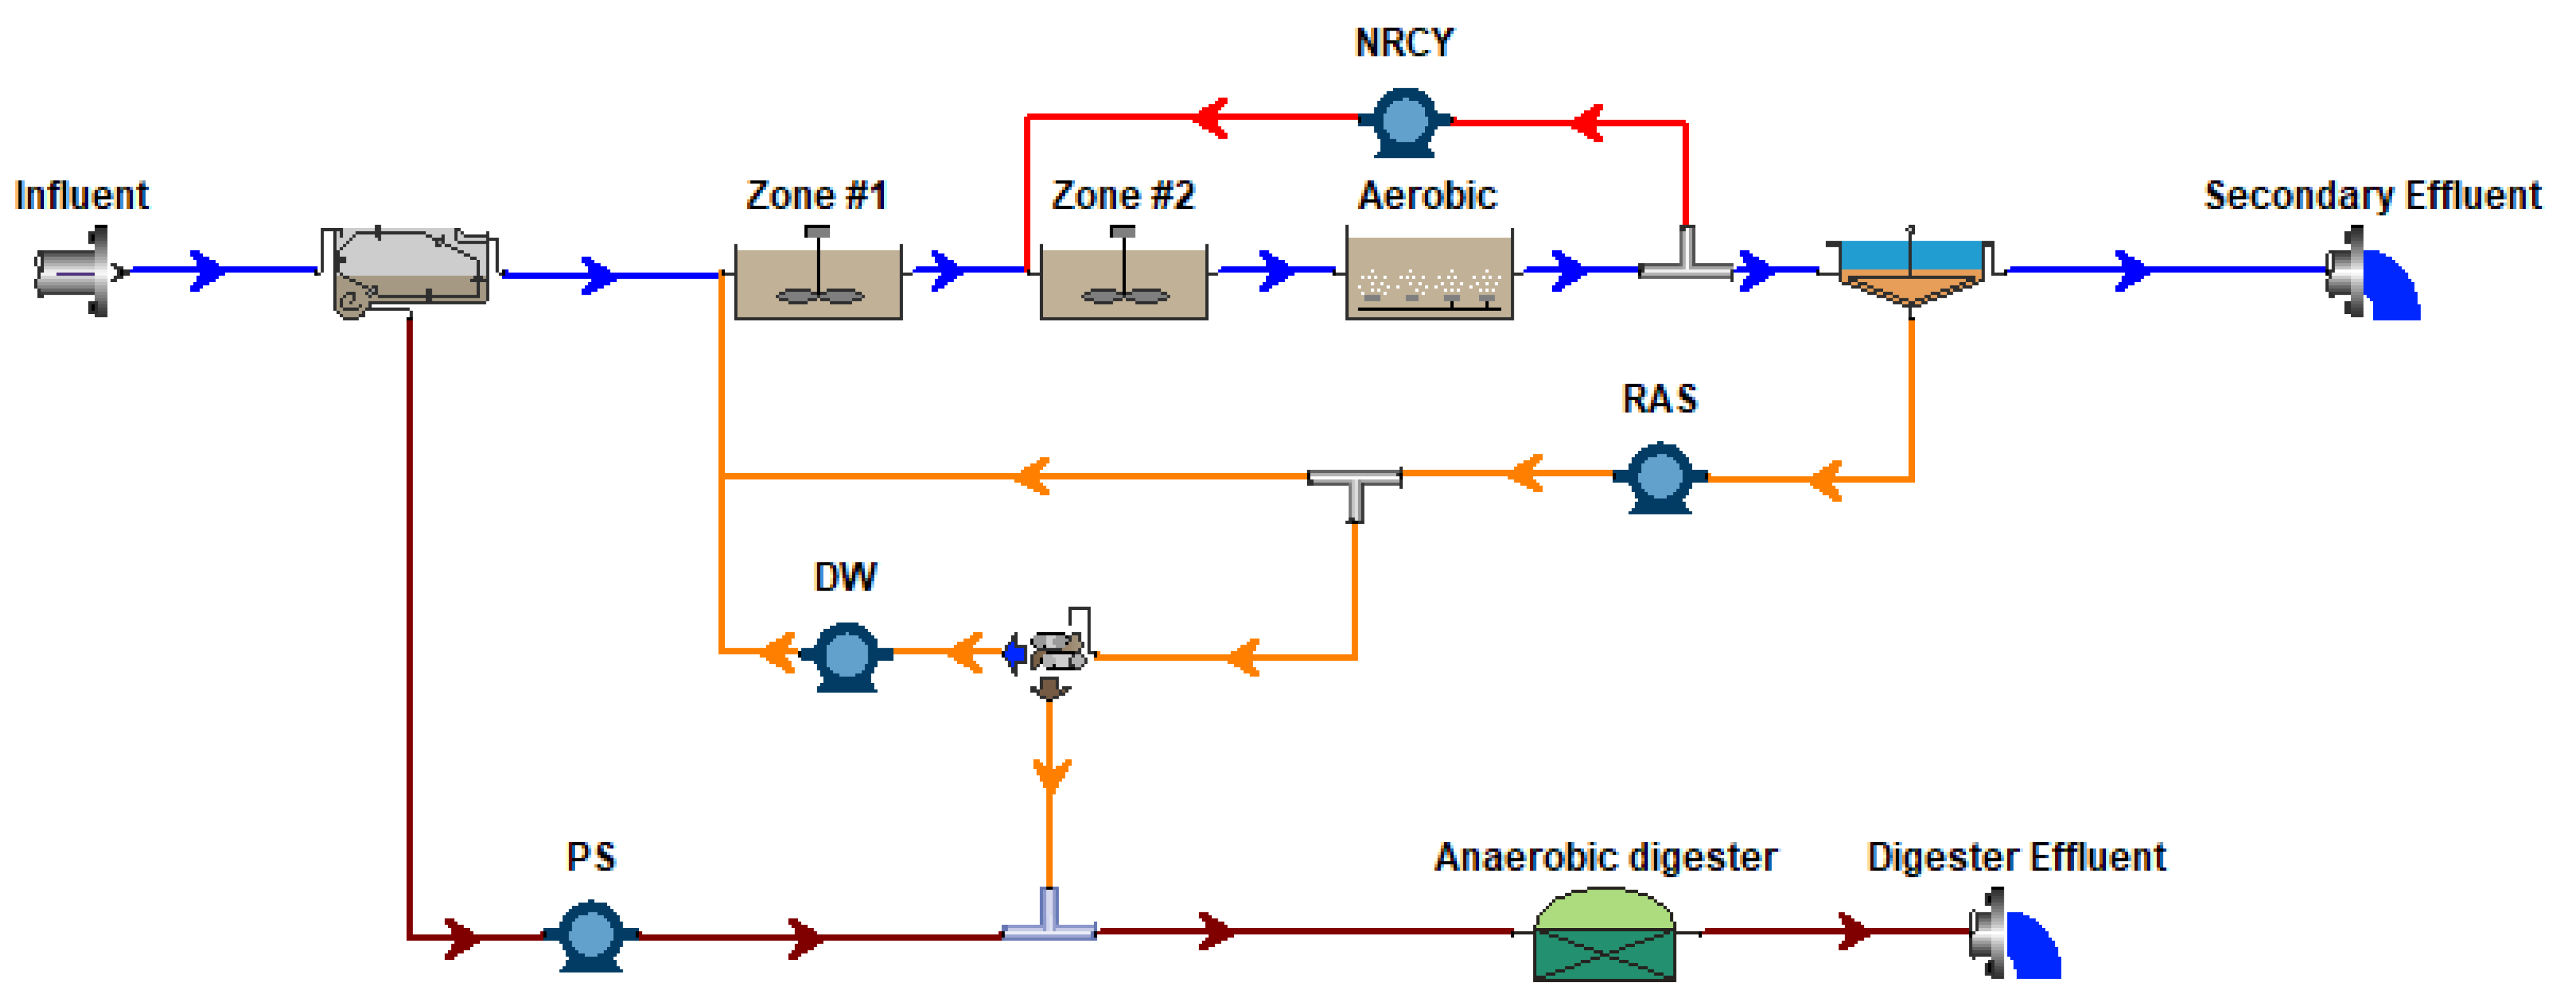
Figure 1.
The sludge digestion train with a CalPrex insertion point.

Figure 2.
Example P flows within the CalPrex process when dosed with lime to pH 7. Acid digestate is dosed with polymer and centrifuged, diverting most of the organic P and 16% of soluble P to the anaerobic digesters. The CalPrex reactor converts 93% of soluble P to brushite and captures 84% of the precipitates due to imperfections in the subsequent clarification and dewatering processes.

Figure 3.
CalPrex reactor pH response to lime dosing.

Figure 4.
CalPrex reactor P capture response to lime dosing.

Figure 5.
CalPrex reactor reagent efficiency response to lime dosing.

Figure 6.
Predicted CalPrex P capture as a function of acid digester pH.

Figure 7.
Predicted Ca requirements to reach CalPrex pH 7 as a function of pH values of the acid digest. Higher pH conditions have the beneficial effect of requiring lower lime dosages to capture brushite, potentially reducing costs to the plant as they spend less money neutralizing the buffering capacity of the VFAs.

Figure 8.
Relationship between the brushite return ratio, kg P per kg Ca, as a function of the acid digester pH used for optimizing the BioWin acid digester kinetics.
Figure 8.
Relationship between the brushite return ratio, kg P per kg Ca, as a function of the acid digester pH used for optimizing the BioWin acid digester kinetics.

Table 1.
Acid Digester Process Effluent Profile.
| Parameter | Unit | Value |
|---|---|---|
| Flow | m3/d | 830 |
| pH | 5.14 | |
| Acetate | kg COD/d | 2937 |
| Propionate | kg COD/d | 7814 |
| Total P | kg P/d | 906 |
| Soluble P | kg P/d | 635 |
| Soluble Ca | kg Ca/d | 207 |
| Ammonia | kg N/d | 1104 |
| Total Solids | kg/d | 20,800 |
| Volatile Solids | kg/d | 17,500 |
Table 2.
Predicted P flows for the Nine Springs Wastewater Treatment Plant, kg P/d.
| Process | EBPR-Only Plant | CalPrex Plant |
|---|---|---|
| Influent Total P | 949 | 949 |
| Effluent Total P | 57.3 | 54.5 |
| Biosolid Total P | 892 | 457 |
| Biosolid Brushite P | 146 | 206 |
| Biosolid Struvite P | 408 | 83 |
| CalPrex Total P | N/A | 438 |
Table 3.
Cabinet Configuration Plant Acid Digestate Properties.
| Acid Digest | Unit | N Plant | EBPR Plant |
|---|---|---|---|
| Flow | m3/d | 125 | 56 |
| pH | 5.21 | 5.21 | |
| Total P | kg P/d | 106 | 61.7 |
| Soluble P | kg P/d | 59.9 | 27.4 |
| Soluble Ca | kg Ca/d | 37.9 | 12.9 |
Table 4.
CalPrex Performance in Cabinet Configurations.
| CalPrex | Unit | N CalPrex | EBPR CalPrex |
|---|---|---|---|
| Influent Total P | kg P/d | 54.3 | 35.7 |
| Influent Soluble P | kg P/d | 50.3 | 33.8 |
| Total P Capture | kg P/d | 42.2 | 27.3 |
| Brushite P Capture | kg P/d | 38.5 | 25.6 |
| Struvite P Capture | kg P/d | 0 | 0 |
| Lime Dose to pH 7 | kg Ca/d | 91.0 | 49.0 |
| Brushite Return Ratio | kg P/kg Ca | 0.423 | 0.522 |
| TSS | kg/d | 471 | 253 |
| TSS Brushite Purity | kg Brushite/kg | 45.4% | 56.1% |
Table 5.
Anaerobic Digestate Properties in Cabinet Configurations with and without CalPrex.
| Anaerobic Digest | Unit | N Original | N + CalPrex | EBPR Original | EBPR + CalPrex |
|---|---|---|---|---|---|
| Brushite Precipitate | kg P/d | 29.0 | 28.2 | 10.4 | 13.4 |
| Struvite Precipitate | kg P/d | 8.93 | 0.0 | 8.47 | 3.61 |
| Dry gas flow | m3/d | 130 | 117 | 55.9 | 50.2 |
| VSS Destruction | % | 49.0 | 47.6 | 45.1 | 43.5 |
Table 6.
Biosolid properties in Cabinet Configurations with and without CalPrex.
| Biosolid | Unit | N Original | N + CalPrex | EBPR Original | EBPR + CalPrex |
|---|---|---|---|---|---|
| Total P | kg P/d | 72.3 | 59.9 | 61.7 | 34.4 |
| Soluble P | kg P/d | 2.6 | 0.2 | 27.4 | 2.28 |
| Struvite P | kg P/d | 8.75 | 0.0 | 8.47 | 3.61 |
| Brushite P | kg P/d | 28.3 | 27.5 | 10.4 | 13.4 |
| TSS | kg/d | 3175 | 2951 | 1429 | 1340 |
Table 7.
P Distribution Profile of Cabinet Configurations with and without CalPrex.
| Whole Plant | Unit | N Original | N + CalPrex | EBPR Original | EBPR + CalPrex |
|---|---|---|---|---|---|
| Influent Total P | kg P/d | 192 | 192 | 80 | 80 |
| Effluent Total P | kg P/d | 120 | 90.0 | 18.3 | 18.3 |
| Biosolid Total P | kg P/d | 72.3 | 59.9 | 61.7 | 34.4 |
| CalPrex Total P | kg P/d | 0 | 42.2 | 0 | 27.3 |
Disclaimer/Publisher’s Note: The statements, opinions and data contained in all publications are solely those of the individual author(s) and contributor(s) and not of MDPI and/or the editor(s). MDPI and/or the editor(s) disclaim responsibility for any injury to people or property resulting from any ideas, methods, instructions or products referred to in the content. |
© 2024 by the authors. Licensee MDPI, Basel, Switzerland. This article is an open access article distributed under the terms and conditions of the Creative Commons Attribution (CC BY) license (https://creativecommons.org/licenses/by/4.0/).
Share and Cite
MDPI and ACS Style
Vineyard, D.; Karthikeyan, K.G.; Barak, P. BioWin Modeling of CalPrex Phosphorus Recovery from Wastewater Predicts Substantial Nuisance Struvite Reduction. Environments 2024, 11, 48. https://doi.org/10.3390/environments11030048
AMA Style
Vineyard D, Karthikeyan KG, Barak P. BioWin Modeling of CalPrex Phosphorus Recovery from Wastewater Predicts Substantial Nuisance Struvite Reduction. Environments. 2024; 11(3):48. https://doi.org/10.3390/environments11030048
Chicago/Turabian StyleVineyard, Donald, K.G. Karthikeyan, and Phillip Barak. 2024. "BioWin Modeling of CalPrex Phosphorus Recovery from Wastewater Predicts Substantial Nuisance Struvite Reduction" Environments 11, no. 3: 48. https://doi.org/10.3390/environments11030048
Note that from the first issue of 2016, this journal uses article numbers instead of page numbers. See further details here.