Article

Reuse of Soils Fertilized with Ash as Recycling Derived Fertilizer Revealed Strong Stimulation of Microbial Communities Involved in P Mobilization in Lolium perenne Rhizospheres

Department of Biological Sciences, University of Limerick, V94 T9PX Limerick, Ireland
*
Author to whom correspondence should be addressed.
Environments 2024, 11(3), 49; https://doi.org/10.3390/environments11030049
Submission received: 24 November 2023 / Revised: 29 February 2024 / Accepted: 1 March 2024 / Published: 4 March 2024

Abstract

:
Circular economy recycling-derived fertilizers (RDF) have the potential to replace linear economy fertilizers such as unsustainable superphosphates. Here, effects of ash RDF treatments in Irish grassland cultivation were investigated in a simulated second growing season. Soil fertilized in a preceding pot trial with superphosphate (SP), poultry-litter ash (PLA) and sewage-sludge ash (SSA) at P concentration of 60 kg P ha−1 and a P-free control (SP0) was reused in a microcosm trial. Lolium perenne was cultivated for 54 days in six replicates with a full complement of micro- and macro-nutrients other than P. PLA treatments provided higher dry weight shoot yields than SP0, while SSA and SP overlapped with SP0 and PLA. Most probable number (MPN) analysis showed that phosphonate- and phytate-utilizing bacterial abundance was significantly increased in PLA. Alkaline (phoD) phosphomonoesterase gene fragments were significantly more abundant (qPCR) in the ashes than the superphosphate or P-free control. Bacterial communities were significantly affected by the P application. Similarly, a significant separation of treatments was confirmed in a canonical correspondence analysis of the phoD-harboring community. The genera Streptomyces and Xanthomonas were significantly higher in abundance in the ash RDFs. These results demonstrated the potential benefits of ash RDF treatments as an alternative P source.

Graphical Abstract

1. Introduction

Fertilizer supply plays an important role in securing food production for the growing human population. The United Nations predicts an increase in the global population from 7.7 billion in 2019 to between 9.4 to 10.1 billion in 2050 [1]. Conventional mineral P fertilizer is produced from phosphate rock, a non-renewable resource located in a small number of mines around the world, with the highest abundance in geopolitically unstable countries. Annually, around 22 × 1012 g mined fossil P enters the global economy, and mined P is still the source for 80% of P fertilizers produced for agricultural purposes [2,3]. Mining of phosphate rock occurs at a significantly faster rate than it can replenish itself via natural geochemical processes, that takes 10–15 million years [4,5]. This leads to the depletion of the finite resource in a linear nutrient economy approach (“take, make, dispose”). Simultaneously it pollutes the environment with a surplus of unequally distributed nutrients originating from the intensification of agriculture and subsequent P accumulation in soil causing run-off and leaching of P. Nutrient recovery from waste streams is a promising move towards a circular economy (“reduce, recycle, reuse”) [6,7]. The recovered nutrients can be applied to soil as recycling-derived fertilizers (RDFs), endeavoring to close the loop in the P cycle.
In soil, P is a relatively immobile nutrient. It is present in various organic and inorganic forms in different pools, which represent occluded/stable, labile, to readily available P fractions of soil [8]. Inorganic and organic P can also be sorbed to soil particles and become unavailable as a source of nutrient [9,10]. Plants almost exclusively access P in the form of orthophosphate, which is typically present in low concentrations between 0.1 to 1 mg P kg−1 in the soil solution, making up around 1% of soil total P [11]. It was estimated that only up to 30% of mineral P fertilizer applied to arable land was taken up by plants, with the remaining 70% either being immobilized or sorbed via microbial or physicochemical processes or leached into the environment [12,13]. The soil microbiota therefore plays a crucial role in accessing P and transforming it into plant available forms. There are a multitude of mechanisms improving P plant uptake facilitated by microorganisms, including: (a) extension of the root system via symbiotic relationships with arbuscular mycorrhizal fungi (AMF), the AMF hyphae can penetrate smaller soil pores compared to the plant’s root hairs and thus explore larger soil volumes; (b) P sorption equilibria alterations in favor of net flux of orthophosphate into the soil solution; (c) direct or indirect microbial P turnover that includes proton efflux, phosphatase production and extracellular release, siderophore exudation, etc. [14,15]. In recent years, soil degradation, acidification and loss of biodiversity have been reported in agriculturally managed soils [16]. This includes a reduction of the alpha diversity of AMF—important plant symbionts for improved P acquisition by the plant host—that was reported in response to the application of mineral fertilizers due to the direct P availability for plant uptake, while organic fertilizers reinforced the plant-fungal symbiosis [17]. Likewise, orthophosphate application in grassland columns negatively affected the alkaline phosphatase gene, nematode and AMF abundance and shifted microbial communities [18]. Application of ashes, that were left over from energy and heat production processes, as fertilizers has been practiced in the past [19]. Ashes usually increase soil pH, potentially counteracting soil acidification and the liming effect also appears to increase bacterial activity [20]. Due to the heat treatment, ashes lack N, and are therefore not feasible for application on mineral soils with low N index [21]. While increased microbial activity after ash application implies carbon release from soil due to higher soil respiration [22], other microbial processes involved in nutrient cycling and therefore P mobilization might be enhanced. This mobilization of P may include the mineralization of organically bound P from the soil already present prior to the fertilizer application as well as recently immobilized P of fertilizer origin. Depending on the feedstock of ash fertilizers (i.e., sewage sludge), a high heavy metal burden is possible, that may accumulate in soil [23]. Therefore, the development of RDFs should focus both on the plant availability of P as well as the removal of hazardous substances from waste streams. The AshDec® process was developed for the incineration of sewage sludge, whereby potassium or sodium based alkaline products are added to the feedstock during incineration at temperatures above 900 °C, to obtain ammonium citrate soluble, alkaline P compounds, indicating their plant availability, and simultaneously evaporating toxic heavy metals such as arsenic, cadmium and lead from the product [24].
The objective of this study was to determine (a) the P plant availability; (b) the microbial-mediated P mineralization activity in experimentally re-used soil after application of two ash RDF fertilizers at a rate of 60 kg P ha−1 in the preceding year and one cut of Lolium perenne (perennial ryegrass) grass; and (c) compare L. perenne shoot production and AMF colonization. Feedstock for ash production was poultry litter (PLA) and municipal sewage sludge (SSA), in comparison to a P-free control (SP0) and conventional superphosphate (SP) fertilizer. RDF based plant growth promotion alongside mineral fertilizer use with and without superphosphate was correlated to changes in the bacterial (16S rRNA gene and phoD) community structures in rhizosphere soil, bacterial phosphonate and phytate utilization, potential phosphatase activity and arbuscular mycorrhizal root colonization. The hypothesis was that P supplied from ash RDFs, may have a lower detrimental impact on the P mobilizing microbial community than mineral P fertilizers and promotes the abundance of P mobilizing bacteria and AMF interactions in the longer term.

2. Materials and Methods

2.1. Microcosm Trial Set-Up

The bulk soil from the preceding pot trial experiment [25], stored in sealed plastic bags in the dark at ambient temperatures was reutilized for this experiment. The soil originated from a field at Teagasc Johnstown Castle, Wexford, Ireland (N52°17′47′′, W6°30′29′′), which had been reseeded with perennial ryegrass in 2018 and prior to that was under long-term pasture management. The P-free control SP0, the mineral fertilizer treatment SP60 and the two ashes PLA60 and SSA60 at 60 kg P ha−1 were chosen from the preceding pot trial (see also Supplementary Information S1). Microcosms (chemically welded plexiglass, length = 12 cm, height = 11 cm, width = 2.5 cm; [26]) were set up in replicates of six per treatment. The moisture content of each treatment was determined via the oven dry method at 105 °C for 24 h. Water holding capacity of the soil was measured for each treatment prior to the start of the microcosm experiment. First, 330 g of soil was used per microcosm and the soil was watered to reach 70% water holding capacity. Then, 0.02 g of the diploid Lolium perenne (var. AberGreen) seeds were added on the soil surface. The seeds were covered with an additional 30 g of soil of the same treatment and that layer was wetted evenly with additional 5 mL of distilled water. The microcosms were incubated in a plant growth chamber (A1000, Conviron, Manitoba, Canada), with the following conditions: 12 h day and 12 h night cycle, the photosynthetically active radiation (400–700 nm) was set between 200–400 µmol ms−1, at a temperature and relative humidity of 20 ± 2 °C and 75 ± 5% r.H. during the photoperiod and 15 ± 1 °C and 70 ± 5% r.H. during darkness. Until germination was observed, the microcosms were kept in propagators to minimise moisture losses. The plexiglass microcosms were wrapped in aluminium foil to minimise algal growth. The microcosms were irrigated with distilled water every second day, at the beginning with a volume of 5 mL, which was then increased to 25 mL over time to meet the plants’ needs. To prevent N-starvation effect in this experiment, a urea solution was applied at a rate of 75 kg N ha−1 with a volume of 10 mL per microcosm.

2.2. Microcosm Harvest, Plant and Soil Analyses

After 54 days of perennial ryegrass cultivation in the plant growth chamber, the bulk soil was harvested separately from the rhizosphere soil. The soil-root mass was transferred into plastic bags and the loosely attached bulk soil was shaken off. Then, the roots were transferred into a zip-lock bag, where the rhizosphere soil, which is closely attached to the root surface, was largely removed by vigorous shaking, until no more soil would detach from the roots. Roots were picked from each sample for arbuscular mycorrhizae analysis, together with the bulk and rhizosphere soil, and stored at 4 °C. Subsamples of the rhizosphere soil were taken and stored at −20 °C for DNA extraction. The number of tillers was counted for each microcosm and the fresh weight of the plant shoots was recorded. The plant biomass was dried in an oven at 55 °C for 72 h, then the dry weight of the plant yield was determined.
Soil pH, available P, potential soil acid and alkaline phosphomonoesterase activity (ACP, ALP) were determined described previously [25]. In brief, soil pH was determined in 0.01M CaCl2 solution. Morgan’s P test was set up to determine plant availability of P following standard protocols [25,27]. Soil’s potential acid and alkaline phosphomonoesterase (phosphatase) activity was measured in 1 g of soil spectrophotometrically with the p-nitrophenyl phosphate method following standard protocols [28].

2.3. Cultivation Dependent Microbial Analyses

The analyses MPN determination in minimal media with a single P source were conducted as described previously [25] for the pot trial. Briefly, for MPN a serial dilution of rhizosphere soil was carried out in saline (0.85% w/v). For MPN, 96 well microtiter plates were used with minimal medium containing either phosphonoacetic acid (MM2PAA) or phytate (MM2Phy) as sole source of P as described elsewhere [29] and incubated at 25 °C for 14 days to visually determine growth. An MPN approach was chosen over plate-based assays to eliminate traces of P commonly found in solidifying agents. MPN g−1 rhizosphere soil was determined via published tables by the Food and Drug Administration (FDA, Blodgett, https://www.fda.gov/food/laboratory-methods-food/bam-appendix-2-most-probable-number-serial-dilutions, accessed on 16 June 2022).

2.4. Cultivation Independent Microbial Analyses

Arbuscular mycorrhization was analysed according to protocols as described elsewhere [18,30]. Briefly, 10 cm long root pieces were incubated in a 10% KOH solution in a water bath at 90 °C for 45 min. Then the roots were rinsed three times with distilled water, before they were incubated with freshly prepared alkaline 30% hydrogen peroxide at room temperature for 60 min. After that, the roots were rinsed with distilled water again and covered with 10 mL 0.1 M hydrochloric acid overnight for 12 h. The next day, the acid was discarded, and the roots were stained with a 0.05% trypan blue lactoglycerol solution at 90 °C for 45 min. Finally, the staining solution was discarded, and the roots were stored in a lactoglycerol discoloration solution until analysis was carried out. Root colonization with arbuscular, vesicular and hyphal structures was evaluated with an Olympus BX60 microscope (Tokyo, Japan) at 600x magnification in an adapted gridline-intersect method [30]. Four 1 cm long root pieces were investigated per sample and for each piece of root 25 fields of view were observed and the presence of AMF structures was recorded (Supplementary Figure S1) and calculated in percentage.
16S PCR-DGGE, phoC and phoD qPCR and phoD sample preparation for sequencing were conducted as described previously [25] for the pot trial. In brief, DNA extraction from 0.25 g rhizosphere soil (frozen at −20 °C) was performed following the manufacturer’s instructions of the DNeasy PowerSoil Pro kit (QIAGEN GmbH, Hilden, Germany). DNA was quantified with the Qubit Fluorometer (Life Technologies, Carlsbad, CA, USA) using a Qubit dsDNA HS assay kit (Life Technologies, Carlsbad, CA, USA).
In order to provide an overview of the bacterial community structures, 16S rRNA gene PCR for denaturing gradient gel electrophoresis (DGGE) was carried out with primer pair 341F-GC and 518R [31]. Conditions for DGGE are provided elsewhere [25]. Amplicon based sequencing of the V4 region of the 16S rRNA gene was conducted with primers containing Illumina adapters (515F-Illumina 5′- TCG TCG GCA GCG TCA GAT GTG TAT AAG AGA CAG GTG CCA GCM GCC GCG GTA A-3′ and 806R-Illumina 5′- GTC TCG TGG GCT CGG AGA TGT GTA TAA GAG ACA GGG ACT ACH VGG GTW TCT AAT-3′) using published PCR protocols [25] in order to obtain sequence based information that goes beyond the capabilities of a finger-print based analysis. Next-Generation Sequencing was performed at the University of Minnesota Genomics Center (Minneapolis, MN, USA) on a MiSeq PE300 platform. Sequencing of the phoD gene was conducted by amplifying the phoD gene first with primers phoD-F733 (5′-TGG GAY GAT CAY GAR GT-3′) and phoD-R1083 (5′-CTG SGC SAK SAC RTT CCA-3′) [32]. Amplicons were subjected to a second PCR in order to add the Illumina adapter sequences (Adapter F: TCG TCG GCA GCG TCA GAT GTG TAT AAG AGA CAG; Adapter R: GTC TCG TGG GCT CGG AGA TGT GTA TAA GAG ACA G). The PCR conditions for first and second reaction have been published elsewhere [25]. Amplicon sequence reads (16S rRNA gene fragments and phoD gene fragment) have been deposited with links to BioProject accession number PRJNA1043576 in the NCBI BioProject database (https://www.ncbi.nlm.nih.gov/bioproject/, accessed on 23 November 2023; SAM38345078-101 (16S), SAMN38345078-101 (phoD)).
qPCR was conducted for phoC with the primers phoC-A-F1 (5′-CGG CTC CTA TCC GTC CGG-3′) and phoC-A-R1 (5′-CAA CAT CGC TTT GCC AGT G-3′) [33] as well as for phoD with ALPS-F730 (5′-CAG TGG GAC GAC CAC GAG GT-3′) and ALPS-R1101 (5′-GAG GCC GAT CGG CAT GTC G-3′) [34] on a Roche LightCycler® 96 (Roche Diagnostics, Mannheim, Germany) using the KAPA SYBR FAST qPCR Master Mix (KAPA Biosystems, Cape Town, South Africa) as described previously [25].

2.5. Data Analysis

Shoot weights, pH, MPN, CFU, ACP, ALP, arbuscular (AC), vesicular (VC) and hyphal (HC) colonization, Morgan’s P, phoD and phoC absolute quantification were assessed for significant differences with SPSS (SPSS Statistics, IBM, Version 26). Normality was tested with Shapiro–Wilk (p > 0.05). The homogeneity of variance was evaluated using Levene’s test at p > 0.05. When both criteria were fulfilled, a one-way analysis of variance (ANOVA) was performed (Tukey HSD post-hoc, p ≤ 0.05). Data violating assumptions of normality were transformed (untransformed results were reported), a non-parametric Kruskal–Wallis test was performed when normality was not achieved. When equal variance was not fulfilled a Games–Howell post-hoc test was conducted.
DGGE gel images were analysed with Phoretix 1D (Totallab, Newcastle, UK) to create binary matrixes for canonical correspondence analysis (CCA) with all environmental data described above using the R packages vegan, mabund, permute and lattice, applying a permutational multivariate analysis of variance (PERMANOVA) test using 999 permutations (R Studio, Version 4.0.3).
Demultiplexed 16S rRNA gene amplicon sequences returned from University of Minnesota Genomics Center (Minneapolis) were analysed in QIIME2 2020.8 [35] using the q2-dada2 plugin (paired-end reads joined, quality filtered, denoised) [36]. Obtained amplicon sequence variants (ASV) were aligned (q2-alignment with mafft [37]) and a phylogenetic tree was built (q2-phylogeny with fasttree2 [38]). Alpha [39] and beta diversity metrics (weighted UniFrac [40]) were created using the q2-diversity plugin and taxonomy assignments were conducted (q2-feature-classifier [41], SILVA 13.8 99% reference data set for 16S rRNA [42,43]). References were trimmed to train a Naïve Bayes classifier. R (Version 4.0.3) with mvabund and vegan packages were used to carry out CCA analysis. Taxa bar plots were created to display relative abundance distributions of prevalent taxa. Differential abundance was tested using Kruskal–Wallis rank sum test (kruskal.test) with Wilcoxon post-hoc analysis for multiple pairwise comparisons between groups (function pairwise.wilcox.test) and Benjamini–Hochberg correction.
Sequences of phoD were trimmed of primers and poor-quality sequences (cutadapt [44]). Paired end reads were merged (usearch [45]) and filtered (fastq_filter). Unique and duplicate sequences were removed (fastx_uniques command). UPARSE was used to cluster sequences into centroid operational taxonomic units (OTUs) [46] at a 75% sequence similarity threshold [47]. An alkaline phosphatase gene reference database (fungene [48]) was used to assign taxonomy. CCA biplot, bar plots and subsequent permutation analysis was conducted in R as described above.

3. Results

3.1. Biomass Yields, Agronomic Efficiency and Elemental Analysis

The fresh weight of the L. perenne shoots after the microcosm harvest was highest in the SP60 treatment, while the no P control SP0 was the lowest (Table 1). The dry biomass analysis showed that both RDF treatments had higher yields compared to the mineral SP60 treatment with PLA60 being significantly higher than SP0. However, after correcting for the seed germination rate (average dry weight per shoot) there was no significant difference detectable between any of the treatments (Table 1). Agronomic efficiency (P-uptake/P-supplied) was highest for PLA60 and lowest for SP60 (Table 1).
The mass balance for the macro- and micronutrients from pooled plant dry matter per pot (i.e., nutrient uptake) identified lowest P and N levels in PLA60 (Table 2). Interestingly, K content was around 20% higher in SP0 compared to all other treatments. SP60 had the highest Ca, Mg, N, P and S content compared to the ash fertilized treatments. Concerning the micronutrients, B and Mb were similar for all treatments, while Cu and Fe uptake were lowest in the PLA60 treatment. Mn mass balance was highest in SP0, while Zn was lower in both ash treatments.

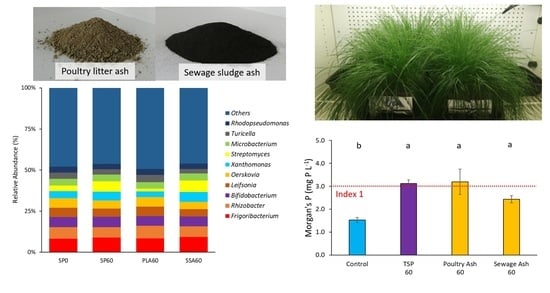
3.2. Microbial P-Mobilization and Solubilization, Soil pH and Morgan’s P

Microbial P mobilization detected with the cultivation-dependent MPN approach demonstrated a significantly higher (p ≤ 0.05) P mobilization capability from phosphonates (PAA) and phytate (Phy) in the PLA60 ash treatment (Table 3). SSA60 had an average of 3.7 × 10⁶ MPN g−1 soil in the PAA medium, which exceeded that of PLA60 with 3.2 × 10⁶ MPN g−1 soil, although significant difference was not reached. MPN PAA and Phy values for SP0 and SP60 were lower than the ash treatments but significant difference was only reached with PLA60. The overall number of heterotrophic bacteria able to grow in R2A medium was similar in all treatments.
The soil pH was affected by all fertilizer treatments, all fertilizers showed a significant liming effect (p ≤ 0.05) compared to the SP0 control, and the pH of the ash RDFs was again significantly higher than in the mineral SP60 treatment (Table 4). Moreover, the concentration of orthophosphates readily available for plant uptake, determined using the Morgan’s P extraction, was significantly higher in all P fertilized treatments, with the SP60 and PLA60 treatment falling into a soil P index of 2, increasing the soil P status from “very low” to “low” compared to the SP0 and SSA60 treatment. The Morgan’s P values for SP60 and PLA60 were twice as high as the one for the P-free SP0 control (Table 4).

3.3. Phosphatase Activity and Gene Copy Numbers (phoC, phoD) in Soil

The potential ACP activity was around ten-fold higher than for ALP, with PLA60 displaying the highest value on average for ACP and SP0 the highest average value for ALP (Table 5). However, neither ACP nor ALP activity in soil identified any significant differences (p > 0.05). Assessment of the gene copy numbers for the alkaline and acid phosphatases on the other hand revealed a significantly higher (p ≤ 0.05) phoC copy number g−1 soil in the SSA treatment and a significantly higher phoD copy number g−1 soil in PLA60 and SSA60 (Table 5), which had also demonstrated significantly higher soil pH levels (Table 4).

3.4. Arbuscular Mycorrhizal Fungi Root Colonization

Root colonization with AMF was assessed via root staining and subsequent microscopic evaluation (Supplementary Table S1). There were no statistically significant differences (p > 0.05) detected between the treatments as arbuscular colonization ranged between 43 and 63%, vesicular colonization ranged from 53 to 76% and hyphal colonization exceeded 90%. Nevertheless, SP60 had the lowest average colonization with arbuscules and hyphae, compared to other treatments.

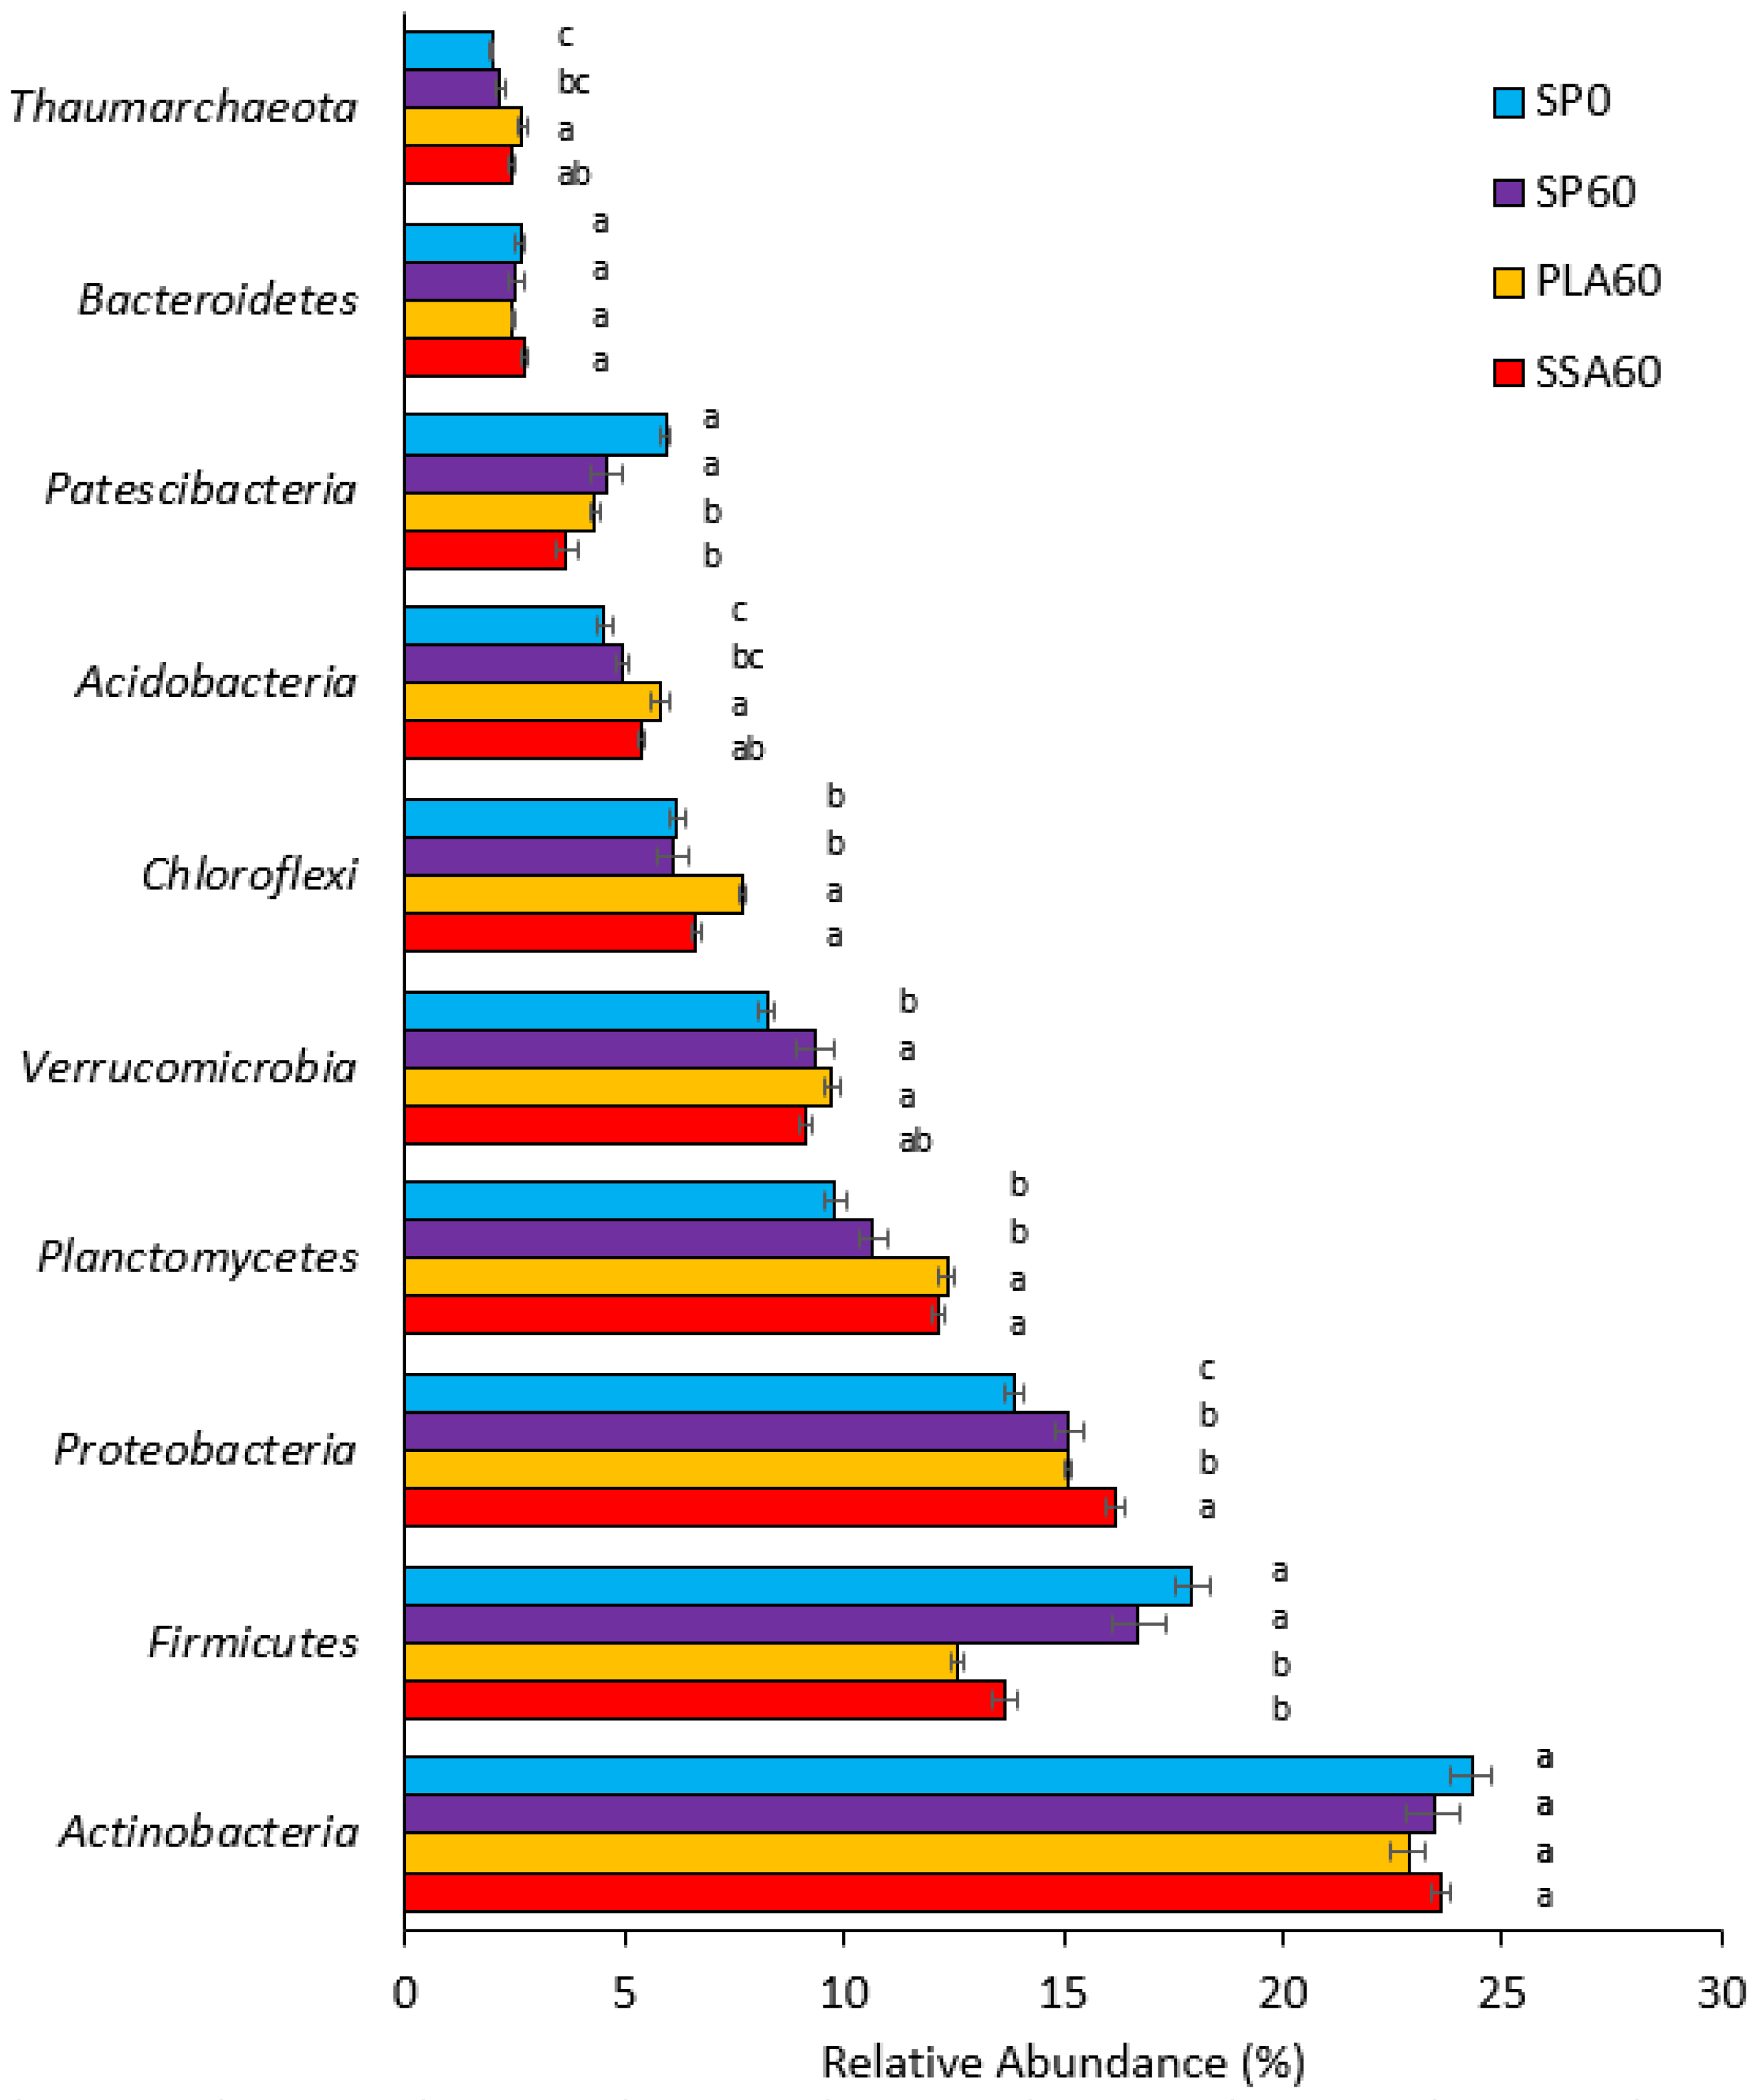
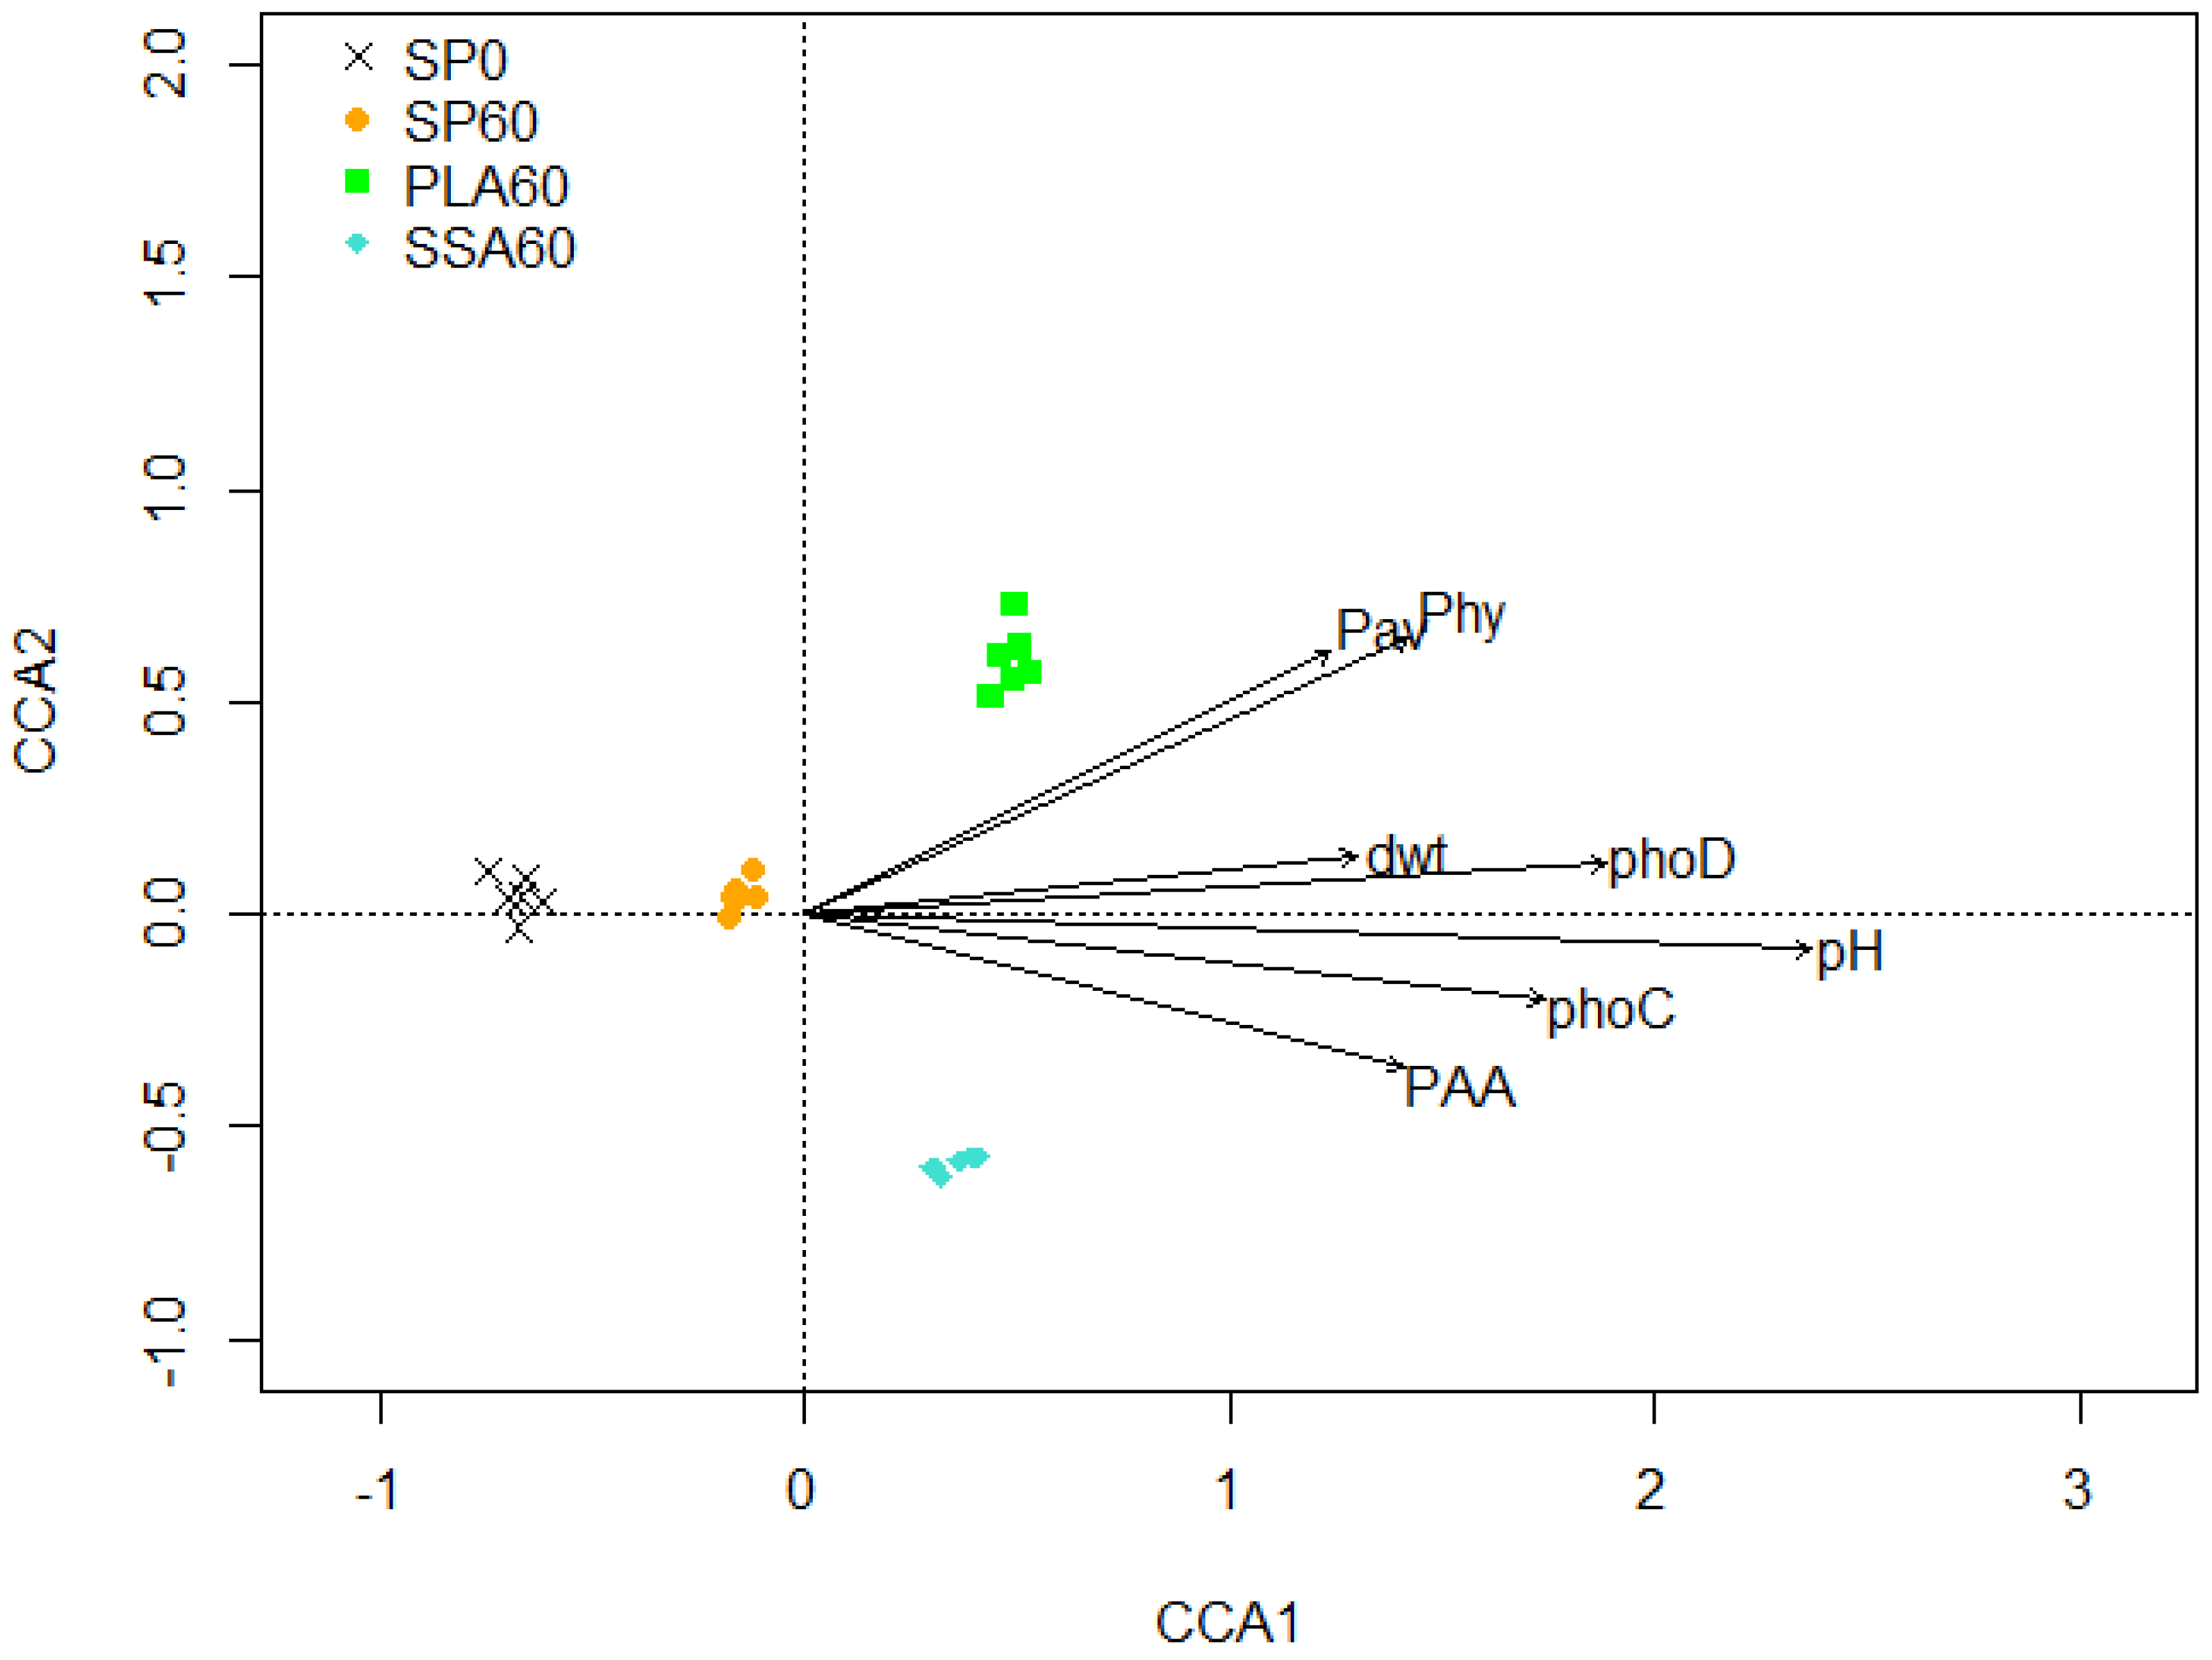
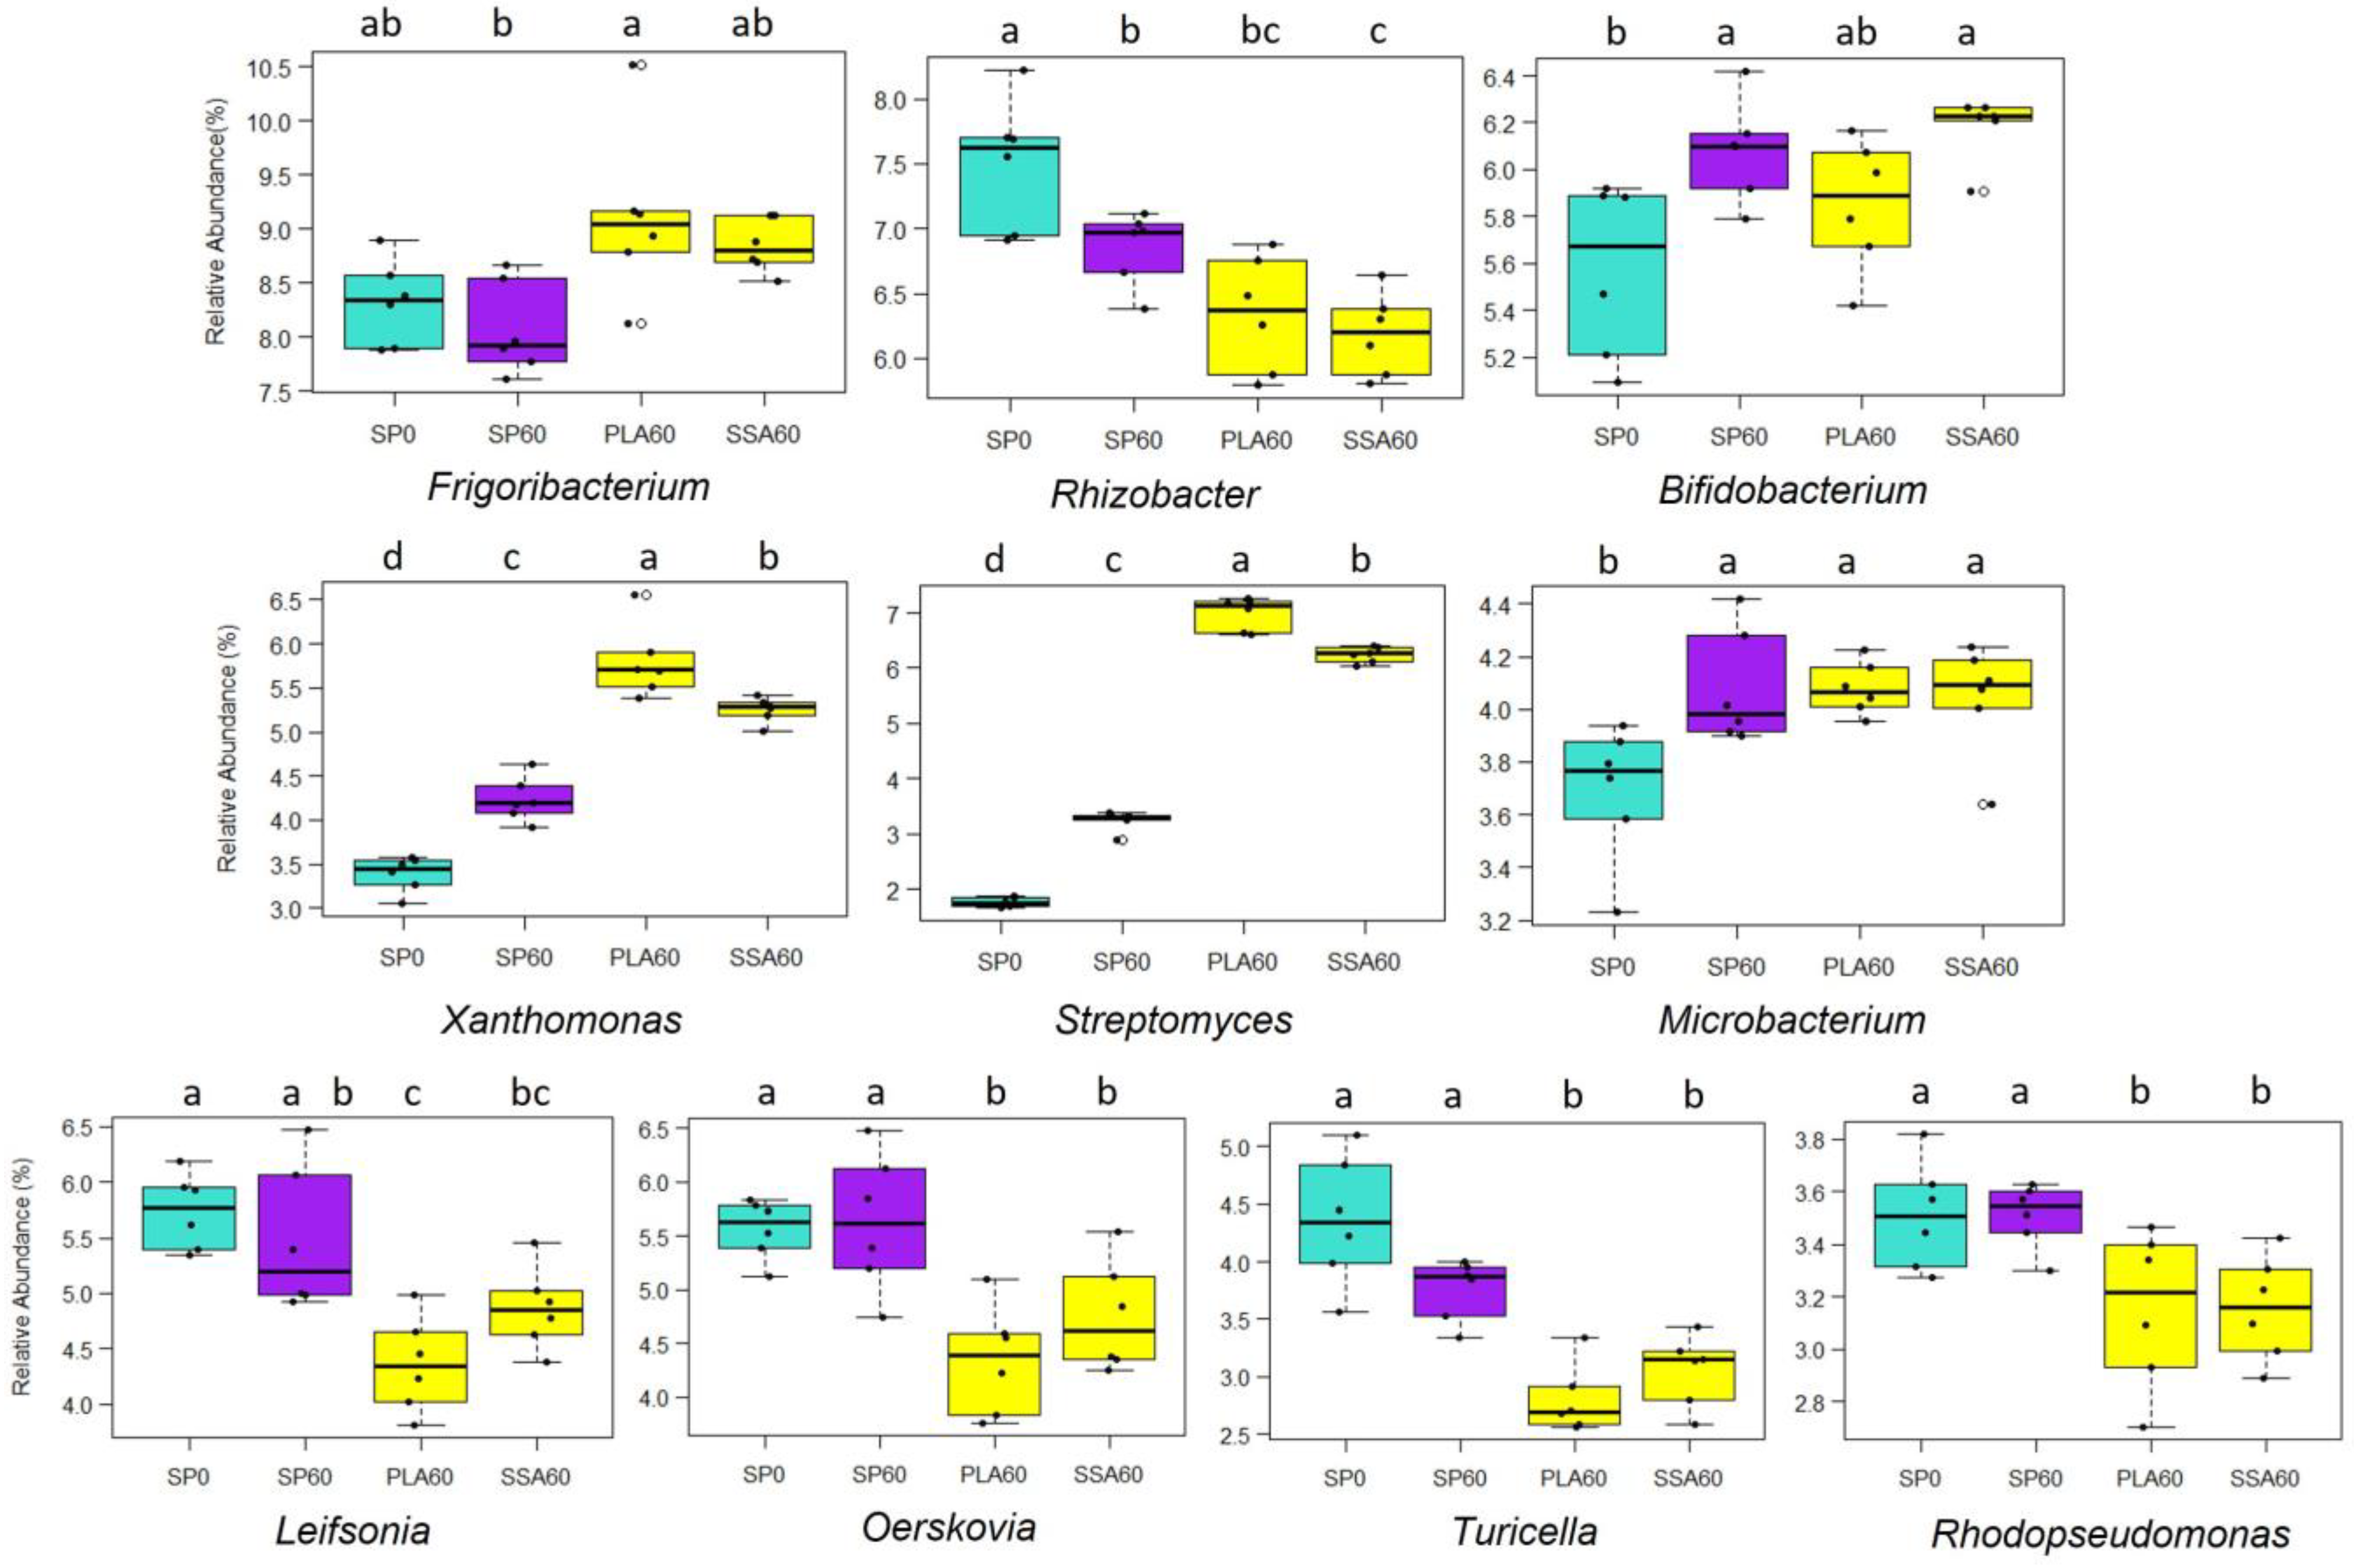
3.5. Bacterial Community Analysis

The 16S PCR-DGGE analysis of the bacterial community in the rhizosphere soil of the microcosm trial resulted in significant separation of the treatments (p < 0.01), as shown in the CCA biplot in Figure 1. The treatments SP0, SP60 and PLA60 were separated from SSA60 on the first axis, and PLA60 was separated from all other treatments on the second axis. Pairwise comparison via PERMANOVA of all treatments using Benjamini–Hochberg correction confirmed significant differences (p ≤ 0.05) in the bacterial community for all treatments. Significant parameters (p ≤ 0.05) involved in the shift of the bacterial communities in the treatments SSA60 and PLA60 were plant available P, shoot dry weight yield, soil pH, phosphonate and phytate utilizing bacteria, phoC and phoD copy number and vesicular root colonization.
For the 16S rRNA amplicon NGS analysis of DNA extracted from the rhizosphere soil of the microcosm trial, a total of 4,195,879 demultiplexed sequences were received from the sequencing facility. After filtering, merging and chimera detection using DADA2, an average of 51,380 features (29.5%) per sample were obtained for further analysis in the QIIME2 platform. None of the alpha diversity estimators were statistically significantly different (Supplementary Table S2). Shannon index ranged from 5.8 to 6.2, while Simpson index exceeded 0.995.
A CCA biplot of the ASV matrix obtained from the 16S rRNA amplicon sequencing results (Figure 2) revealed clear separations of all four treatments. The treatments SP0 and SP60 are separated from the two ash RDF treatments on the first axis, and SP60 and SSA60 are separated from SP0 and PLA60 on the second axis. A pairwise comparison using PERMANOVA confirmed significant separation (p ≤ 0.05) of all treatments after Benjamini–Hochberg correction for multiple testing. Canonical analysis environmental variable analysis revealed that vesicle colonization, P-mobilization capability from phytate and phosphonoacetic acid, bioavailable P, shoot dry weight, soil pH and phoC and phoD copy number significantly affected the bacterial community structures (p ≤ 0.05).
The ten most abundant phyla represented over 90% of the overall phyla present (Supplementary Figure S2). In decreasing relative abundance these were Actinobacteria, Firmicutes, Proteobacteria, Planctomycetes, Verrucomicrobia, Chloroflexi, Acidobacteria, Patescibacteria, Bacteriodetes and Thaumarchaeota. Post-hoc analyses of their relative abundance between treatments revealed significant differences (p ≤ 0.05) in all but two of the ten most abundant phyla. Actinobacteria and Bacteroidetes were the only of the top 10 phyla that were not significantly different in abundance (p > 0.05) across the four treatments (Figure 3). While the phyla Firmicutes and Patescibacteria were significantly relative lower in abundance in the two ash RDF treatments when compared to SP0 and SP60, the opposite was observed for the phyla Chloroflexi and Planctomycetes. Acidobacteria and Thaumarchaeota were significantly relative higher in abundance in PLA60 than all other treatments, and still significantly relative higher in abundance in SSA60 than in the SP0 treatment. Verrucomicrobia were significantly relative higher in abundance in SP60 as well as PLA60. Proteobacteria was the only phylum which had a significantly higher relative abundance in the SSA60 treatment. At genus level, no significant differences between the treatments had been detected for the bacterial community.

3.6. Bacterial Community Analysis Based on phoD

There were 3,169,711 phoD functional gene paired-end sequences obtained from the sequencing facility, out of which 1,934,508 (60.9%) were successfully merged in USEARCH. Of the merged sequences, 612,338 were matched with zero differences. In total, 1,285,676 (66.6%) of the merged number of sequences passed the filter criteria and 765,090 (88.4%) of those were singletons. In total, 5051 OTUs were picked at a 75% similarity threshold and 2476 chimeral sequences (2.5%) were removed. Finally, 1,449,560 sequences were mapped to OTUs. The alpha diversity index Simpson was significantly lower for the PLA60 treatment (0.987 vs. 0.988–0.989) compared to all other treatments, and all other alpha diversity estimators (i.e., Shannon, ACE, Chao1) showed no significant differences between the treatments (Supplementary Table S3). The phoD amplicon NGS data based CCA biplot showed significant separation (p ≤ 0.05) of all treatments (Figure 4; PERMANOVA, Adonis, confirmed via Benjamini–Hochberg correction). PLA60 and SSA60 were separated from the SP0 and SP60 treatment on the first axis, and on the second axis a separation between PLA60 and SSA60 is visible. Various environmental parameters were significantly affecting the phoD harboring community that included available P, L. perenne dry weight, soil pH, phoC and phoD gene copy numbers, phosphonate and phytate utilizing bacteria (MPN).
The ten most abundant genera detected in the analysis of the phoD sequences were, with decreasing relative abundance: Frigoribacterium, Rhizobacter, Bifidobacterium, Leifsonia, Oerskovia, Xanthomonas, Streptomyces, Microbacterium, Turicella and Rhodopseudomonas. These genera comprised around 50% of the total genera in each treatment (Supplementary Figure S3) and their relative abundance was significantly different for all (Figure 5).
The genera Leifsonia, Oerskovia, Rhodopseudomonas and Turicella were significantly relatively lower in abundance (p ≤ 0.05) in the ash RDF treatments compared to the control SP0 and SP60 fertilizer. Rhizobacter displayed the highest relative abundance in the P-free SP0 treatment. For the genera Frigoribacterium, Streptomyces and Xanthomonas the PLA60 treatment had the highest relative abundance, followed by SSA60, while the SP60 treatments displayed significantly lower relative abundances. The genus Microbacterium seemed to be positively affected by the P addition, all P-fertilized treatments had a significantly higher relative abundance compared to SP0. Lastly, the genus Bifidobacterium was significantly relative higher in abundance in the SP60 and SSA60 treatment, while it was similarly relative abundant in PLA60 and SP0.

4. Discussion

This study investigated the effects of ash RDF treatments at P concentration of 60 kg P ha−1 on a second growing season of perennial ryegrass alongside a positive (orthophosphate) and negative control (no P). Microbial capacities in rhizosphere P cycling were investigated that included phosphonate and phytate utilization, phosphatase activities and the related absolute gene copy numbers, as well as bacterial community structures were assessed (16S, phoD) alongside mycorrhization of ryegrass roots. The present hypothesis was that ash RDFs derived from incineration of poultry litter and sewage sludge positively affect the abundance and function of P mobilizing bacteria and arbuscular mycorrhizal fungi and have less impact on the soil microbial community than mineral P fertilizer in the long-term, while demonstrating plant growth promotion in L. perenne in a second growing season.
Sewage sludge and manure incineration is practiced as a sanitary way to destroy organic pollutants (pathogens, pharmaceutic compounds such as antibiotics, tranquilizers, diuretics, and hormones). In countries such as Switzerland and the Netherlands, 100% of sewage sludge is incinerated [49]. The resulting ash is nutrient-rich and under the right processing conditions it can be applied as fertilizer. The utilization of ashes derived from various nutrient-rich waste streams as fertilizer can be seen as product valorisation and likely reduces the amount of sewage sludge going to landfill, thus supporting the circular economy [50]. There is also potential for energy generation in the form of electricity or heat during the thermal process of such wastes, as described for the poultry litter ash used in this experiment [51]. Furthermore, the application of pyrolyzed biomass under oxygen limiting conditions (biochar), has shown positive effects in terms of soil fertility and the P cycling microbial community [52], raising interest in investigating the fate of ash application to soil. Due to the high incineration temperatures of 900 and 1000 °C respectively for the sewage (SSA) and poultry litter ash (PLA), only limited amounts of carbon is expected to remain in the ashes [24]. Instead, high levels of Ca, P, K, Mg, Fe and Al were determined in both ashes with the sewage sludge ash having particularly high levels of Fe and Al (Supplementary Information S1). Therefore, one may assume that most of the P in the ashes is present as Ca, Al or Fe -phosphate secondary mineral which may become plant available due to microbial dissolution activities [25]. The short-term study of the ashes fertilization that occurred prior to the present study investigated the mobilization of P from tri-calcium phosphates (TCP) as indicator for the microbial capacity to mobilize inorganically bound P [25]. There, significantly higher bacterial abundances were found in the PLA but not in the SSA treatment in comparison to the P-free control. However, both ashes were also applied in a field trial and there, TCP effects were only observed within the first three months of application, while from five months onwards, significant differences on TCP plates were no longer present [53]. The present microcosm study that reused fertilized soils to simulate a long-term ashes fertilizer event focused on the microbial processes of organically bound P mobilization (i.e., mineralization) under the assumption that significant proportions of the inorganic fertilizer P has been converted into organic forms by the time the microcosm study took place. Indeed in a previous grassland column study, phosphatase activity increased with orthophosphate fertilization, suggesting that significant amounts of inorganic P was first immobilized into organic forms [18] and then putatively mineralized again.
Treatment with mineral P (SP60) in the present study resulted in the lowest agronomic efficiency (difference method by yield) when compared to the ash treatments. However, AE does not account for the P plant uptake, which was highest in SP60. Statistical significance could not be determined for the plant elemental analysis, because the treatments had to be pooled to acquire a reasonable sample size for elemental analysis, thus further studies producing larger amounts of plant biomass would be needed to assess these trends. As already indicated above, both ashes from the present study were also investigated for their fertilizing effects at application rates of 40 kg P ha−1 in comparison to superphosphate and struvites under L. perenne cultivation in a field trial. There, no differences between treatments were detected regarding biomass yields within two years but apparent recovery efficiency (RE) of PLA was lower than for superphosphate fertilization (Patrick Forrestal, oral communication). While the present study is based on soils with low P availability (Irish P index of 2, which is typical for Ireland) and a single application of P fertilizer, it is worth noting that in other regions, soils may have a high P availability due to repeated fertilization. In the latter case, a P saturation may occur, where a larger fraction of the applied P will remain plant available [54]. According to Barrow [54] this higher plant availability is rooted in a saturation effect where inorganic P is sorbed onto and into soil particles to a point where sorption processes slow down and desorption increases to create a higher equilibrium of orthophosphate in soil solution. In the present study however, one can expect that both PLA and SSA contain P in the form of particulate secondary minerals with Ca, Fe and Al. While the present study has not investigated the inorganic chemistry of soil and fertilizer P, we speculated that the presence of PLA and SSA in the soil beyond a growing season would lead to the (partial) transformation of the phosphate secondary minerals in the ashes into organic forms. Hence, this study investigated primarily (micro)biological factors in P cycling (i.e., mineralization).
In the present study, the P fertilization effect in a second growing season had significantly shifted the bacterial community in both the fingerprinting as well as the amplicon-based sequencing analysis for all treatments. The vesicular AMF colonization of the roots (VC) significantly affected the bacterial community structures as demonstrated by the DGGE and the amplicon-based sequencing of 16S rRNA gene fragments. Interestingly, at DGGE level VC appeared to separate SSA60 from the remaining bacterial communities, while for the amplicon-based analysis this was the case for PLA60. The remaining factors such as plant available P, dry matter yield, phosphonate and phytate utilization, phoC and phoD gene copy numbers and soil pH appeared to be important for the distinction of SP60 from the bacterial communities from the RDF treatments.
High supply rates of P for plant growth have been previously linked to reduced rates of root mycorrhization [55,56]. Even a single application of 20 kg P ha−1 to grassland columns significantly reduced arbuscular colonization (AC) [18]. In the present study SSA60 had the lowest P availability among the P fertilizer treatments while at the same time the highest levels of AC, although this was only a trend (did not reach significance). The opposite trend was observed for vesicular colonization (VC) in SSA60, which was the lowest in this study of all treatments. Vesicles function as lipid storage bodies and are described as a potential C sink [57]. Previously, limited photosynthate supply from the plant host has been identified to lower VC rates [58], hence this could indicate that SAA60 treated plants are nutrient limited, even with higher AC rates possibly due to low P availability. Further studies would be necessary to confirm this hypothesis as the current results are only trends and did not reach significance.
Soil pH had one of the strongest effects on the soil bacterial community. This is likely due to the retained liming effect of the ash RDF treatments. Even a year after their application, soil pH was still significantly higher than in SP60 and SP0, although the soil pH still had to be considered rather acidic (pH 5.3). Soil pH is acknowledged as one of the main stimulators of change for the microbial community structure [59] and it also affects P availability in soil [60] as well as plant growth [61]. Liming is a common practice in acidic temperate soils to improve P plant availability [62].
Neither ACP nor ALP activity in soil were affected by the treatments in the long term in this current study, but nonetheless, significant higher phoC copy numbers were detected in SSA60, and phoD copy numbers for both the PLA60 and SSA60 treatment. A negative correlation between ALP activity and P plant availability was described recently [63], while in the current study a significantly higher amount of plant available P for all P fertilized treatments did not result in a lower ALP activity. However, P mineralization processes can be steered not only through available P deficiencies in soils but by a demand for C instead [64]. External carbon inputs (manure, sewage sludge, cellulose) to soil have reportedly increased soil respiration and therefore indicate facilitated microbial growth [65]. Thus, the ash C input in the present study, in particular PLA60, could have contributed to the increased abundance of phosphonate and phosphate-ester utilizing bacteria.
Detailed analysis of the bacterial 16S rRNA gene analysis revealed two out of the ten highest relative abundant phyla were significantly higher in relative abundance in both ash treatments compared to SP0 and SP60, namely Chloroflexi and Planctomycetes. Additionally, PLA60 had significantly higher abundance of Acidobacteria and Thaumarchaeota compared to SP0 and SP60. The phyla Acidobacteria, Planctomycetes, and Chloroflexi were also described as part of the phoX (phosphatase)-harboring community [66]. Likewise, Actinobacteria, Firmicutes and Planctomycetes, that were some of the highest relative abundant phyla in this current study, have also been found to commonly contain phoD [66]. However, Firmicutes were significantly lower in relative abundance in the ash RDF treatments, while Actinobacteria relative abundance was not significantly affected by any of the treatments. Actinobacteria were reported to be effective inorganic P solubilizer via organic acid exudation [67]. Increasing amounts of mineral P applications (5, 10, 20 kg P ha−1) have previously reduced relative abundance of Actinobacteria and Firmicutes in grassland columns [18], which suggests that mineral P application can negatively affect both phyla.
To study the functional diversity at the phosphatase gene level, the present study decided to focus on phoD over phoC as for phoD, both ash treatments resulted in significantly higher gene abundances over the control and conventional P fertilizer. Furthermore, the same type of analysis was carried out with the same soils previously [25] as a short-term study, where no significant shifts of the phoD community were identified. This was different to the present study, where the presumptive long-term effect affected the phoD community structure. Significant separation of the phoD-harboring community in this current study was driven by the same environmental parameters as the overall bacterial structure, except for VC. In this current study, ash fertilization demonstrated positive as well as negative effects on the relative abundance of phoD-harboring genera. Some of the genera with higher relative abundance for the ash treatments were generally also predominantly abundant in other studies investigating organic fertilization. The genus Xanthomonas was also detected in chicken manure and vegetable waste composting samples [68]. Xanthomonas phoD sequences were also identified in black truffle inoculated pine seedlings [69]. Streptomyces was one of the genera dominating long-term organically fertilized soil in the Jiangxi Province in China [70] and was one of the abundant phoD harbouring bacteria in composts containing biochar [71]. Yet to date, neither genus has been reported in perennial ryegrass in connection to phoD. It therefore transpires that both genera may represent important members of the phosphate-ester mineralizing communities that are related to fertilizers and/or soil improvers. Therefore, their presence may suggest a potential benefit for plant P availability.

5. Conclusions

In conclusion, ash RDF application was beneficial to the abundance of microbial P mobilizers, as indicated by significantly higher PAA and phytate utilization and higher phoC and phoD copy numbers and a shift in the phoD harbouring community, although this did not translate into a higher phosphatase activity in soil compared to the mineral P treatment. However, Pav was also increased in the ash treatments, likely due to P release from phosphonates and phytates and high ACP activity in general, therefore it can be assumed that the phoD-harbouring community in the ash RDF treatments might induce ALP production when the soil becomes more P deficient. At the same time, the mineral SP60 treatment demonstrated reduced microbial P mobilization capabilities, which suggests a higher dependency on external P inputs upon plant available P depletion. Further studies at field scale are necessary to study the potential use of ashes as P fertilizer. A particularly interesting option would be to test combinations of quickly available P sources with ashes in order to see whether the putative beneficial effects of the ashes at the microbial level can be maintained while at the same time optimising crop yields.

Supplementary Materials

The following supporting information can be downloaded at: https://www.mdpi.com/article/10.3390/environments11030049/s1, Figure S1. Example of arbuscules (A) and vesicles (B) in L. perenne roots after cultivation in soils fertilized with ashes, visualized at 600× magnification (BX60, Olympus, Tokyo, Japan); Figure S2: Mean relative abundance of the top 10 abundant genera obtained from 16S rRNA amplicon sequencing of the microcosm trial, all other genera collapsed in “others”, n = 6; Figure S3: Mean relative abundance of the top 10 abundant genera obtained from phoD amplicon sequencing of the microcosm trial, all other genera collapsed in “others”, n = 6. Table S1: AMF colonization of the L. perenne roots after cultivation in microcosms for 54 days in soil amended with P fertilizers SP, PLA and SSA a year prior to the experiment, arbuscular (AC), vesicular (VC) and hyphal (HC) colonization were recorded via microscopic investigation at 600× magnification after root staining with trypan blue, 100 observations per sample, ± represents standard error, n = 6; Table S2: Alpha diversity measures of 16S rRNA amplicon sequencing results of the microcosm trial, significance determined via Kruskal-Wallis test and Wilcoxon post-hoc analysis and Benjamini–Hochberg correction, different letters within a column indicate statistically significant difference, n = 6; Table S3: Alpha diversity measures of phoD functional gene sequencing results of the microcosm trial, significance determined via Kruskal–Wallis test and Wilcoxon post-hoc analysis and Benjamini-Hochberg correction, different letters within a column indicate statistically significant difference, n = 6. Reference [72] is cited in the supplementary materials.

Author Contributions

Conceptualization, A.S.; methodology, A.S. and L.D.; software, L.D.; validation, L.D.; formal analysis, L.D.; investigation, L.D.; resources, A.S.; data curation, L.D. and A.S.; writing—original draft preparation, L.D.; writing—review and editing, A.S. and L.D.; visualization, L.D.; supervision, A.S.; project administration, A.S.; funding acquisition, A.S. All authors have read and agreed to the published version of the manuscript.

Funding

This research was funded by the North-West Europe Interreg project ReNu2Farm Nutrient Recycling—from pilot production to farms and fields (NWE601).

Data Availability Statement

All sequencing data have been deposited in the Sequence Read Archive (SRA) and is available in BioProject PRJNA1043576 (SUB13990651).

Acknowledgments

We would like to acknowledge the ReNu2Farm consortium members for their general support in completing this project as well as the technical team of Biological Sciences.

Conflicts of Interest

The authors declare no conflicts of interest. The funders had no role in the design of the study; in the collection, analyses, or interpretation of data; in the writing of the manuscript; or in the decision to publish the results.

References

  1. United Nations. Growing at a Slower Pace, World Population is Expected to Reach 9.7 Billion in 2050 and Could Peak at Nearly 11 Billion around 2100. Available online: https://www.un.org/sustainabledevelopment/blog/2019/06/growing-at-a-slower-pace-world-population-is-expected-to-reach-9-7-billion-in-2050-and-could-peak-at-nearly-11-billion-around-2100-un-report/ (accessed on 24 January 2022).
  2. Liu, Y.; Villalba, G.; Ayres, R.U.; Schroder, H. Global Phosphorus Flows and Environmental Impacts from a Consumption Perspective. J. Ind. Ecol. 2008, 12, 229–247. [Google Scholar] [CrossRef]
  3. Reijnders, L. Phosphorus Resources, Their Depletion and Conservation, A Review. Resour. Conserv. Recycl. 2014, 93, 32–49. [Google Scholar] [CrossRef]
  4. Ruttenberg, K.C. The Global Phosphorus Cycle. In Treatise on Geochemistry; Elsevier: Amsterdam, The Netherlands, 2003; pp. 585–643. [Google Scholar]
  5. Smit, A.L.; Bindraban, P.S.; Schröder, J.J.; Conijn, J.G.; van der Meer, H.G. Phosphorus in Agriculture: Global Resources, Trends and Developments; Plant Research International: Wageningen, The Netherlands, 2009. [Google Scholar]
  6. Geissdoerfer, M.; Savaget, P.; Bocken, N.M.P.; Hultink, E.J. The Circular Economy—A New Sustainability Paradigm? J. Clean. Prod. 2017, 143, 757–768. [Google Scholar] [CrossRef]
  7. Powers, S.M.; Chowdhury, R.B.; MacDonald, G.K.; Metson, G.S.; Beusen, A.H.W.; Bouwman, A.F.; Hampton, S.E.; Mayer, B.K.; McCrackin, M.L.; Vaccari, D.A. Global Opportunities to Increase Agricultural Independence Through Phosphorus Recycling. Earth’s Future 2019, 7, 370–383. [Google Scholar] [CrossRef]
  8. Mackey, K.; Paytan, A. Phosphorus Cycle. Encycl. Microbiol. 2009, 3, 322–334. [Google Scholar]
  9. Barrow, N.J. Comparing two theories about the nature of soil phosphate. Eur. J. Soil Sci. 2021, 72, 679–685. [Google Scholar] [CrossRef]
  10. Gerke, J. Phytate (Inositol Hexakisphosphate) in Soil and Phosphate Acquisition from Inositol Phosphates by Higher Plants. A Review. Plants 2015, 4, 253–266. [Google Scholar] [CrossRef] [PubMed]
  11. Barea, J.-M.; Richardson, A.E. Phosphate Mobilisation by Soil Microorganisms. In Principles of Plant-Microbe Interactions; Lugtenberg, B., Ed.; Springer International Publishing: Cham, Switzerland, 2015; pp. 225–234. [Google Scholar]
  12. Bindraban, P.S.; Dimkpa, C.O.; Pandey, R. Exploring Phosphorus Fertilizers and Fertilization Strategies for Improved Human and Environmental Health. Biol. Fertil. Soils 2020, 56, 299–317. [Google Scholar] [CrossRef]
  13. Wang, T.; Camps-Arbestain, M.; Hedley, M.; Bishop, P. Predicting Phosphorus Bioavailability from High-Ash Biochars. Plant Soil 2012, 357, 173–187. [Google Scholar] [CrossRef]
  14. Richardson, A.E.; Simpson, R.J. Soil Microorganisms Mediating Phosphorus Availability Update on Microbial Phosphorus. Plant Physiol. 2011, 156, 989–996. [Google Scholar] [CrossRef] [PubMed]
  15. Seeling, B.; Zasoski, R.J. Microbial Effects in Maintaining Organic and Inorganic Solution Phosphorus Concentrations in a Grassland Topsoil. Plant Soil 1993, 148, 277–284. [Google Scholar] [CrossRef]
  16. Mozumder, P.; Berrens, R.P. Inorganic Fertilizer Use and Biodiversity Risk: An Empirical Investigation. Ecol. Econ. 2007, 62, 538–543. [Google Scholar] [CrossRef]
  17. Liu, J.; Zhang, J.; Li, D.; Xu, C.; Xiang, X. Differential Responses of Arbuscular Mycorrhizal Fungal Communities to Mineral and Organic Fertilization. MicrobiologyOpen 2020, 9, e00920. [Google Scholar] [CrossRef] [PubMed]
  18. Ikoyi, I.; Fowler, A.; Schmalenberger, A. One-Time Phosphate Fertilizer Application to Grassland Columns Modifies the Soil Microbiota and Limits Its Role in Ecosystem Services. Sci. Total Environ. 2018, 630, 849–858. [Google Scholar] [CrossRef] [PubMed]
  19. Huotari, N.; Tillman-Sutela, E.; Moilanen, M.; Laiho, R. Recycling of Ash—For the Good of the Environment? For. Ecol. Manag. 2015, 348, 226–240. [Google Scholar] [CrossRef]
  20. Rosenberg, O.; Persson, T.; Högbom, L.; Jacobson, S. Effects of Wood-Ash Application on Potential Carbon and Nitrogen Mineralisation at Two Forest Sites with Different Tree Species, Climate and N Status. For. Ecol. Manag. 2010, 260, 511–518. [Google Scholar] [CrossRef]
  21. Jacobson, S.; Lundström, H.; Nordlund, S.; Sikström, U.; Pettersson, F. Is Tree Growth in Boreal Coniferous Stands on Mineral Soils Affected by the Addition of Wood Ash? Scand. J. For. Res. 2014, 29, 675–685. [Google Scholar] [CrossRef]
  22. Perkiömäki, J.; Fritze, H. Does Simulated Acid Rain Increase the Leaching of Cadmium from Wood Ash to Toxic Levels to Coniferous Forest Humus Microbes? FEMS Microbiol. Ecol. 2003, 44, 27–33. [Google Scholar] [CrossRef] [PubMed]
  23. Huygens, D.; Saveyn, H.G.M. Agronomic Efficiency of Selected Phosphorus Fertilisers Derived from Secondary Raw Materials for European Agriculture. A Meta-Analysis. Agron. Sustain. Dev. 2018, 38, 52. [Google Scholar] [CrossRef]
  24. Hermann, L.; Schaaf, T. Outotec (AshDec®) Process for P Fertilizers from Sludge Ash. In Phosphorus Recovery and Recycling; Ohtake, H., Tsuneda, S., Eds.; Springer: Singapore, 2019; pp. 221–233. [Google Scholar]
  25. Deinert, L.; Ikoyi, I.; Egeter, B.; Forrestal, P.; Schmalenberger, A. Short-Term Impact of Recycling-Derived Fertilizers on Their P Supply for Perennial Ryegrass (Lolium perenne). Plants 2023, 12, 2762. [Google Scholar] [CrossRef]
  26. Gahan, J.; O’Sullivan, O.; Cotter, P.D.; Schmalenberger, A. Arbuscular Mycorrhiza Support Plant Sulfur Supply through Organosulfur Mobilizing Bacteria in the Hypho- and Rhizosphere. Plants 2022, 11, 3050. [Google Scholar] [CrossRef]
  27. Murphy, J.; Riley, J.P. A Modified Single Solution Method for the Determination of Phosphate in Natural Waters. Anal. Chim. Acta 1962, 27, 31–36. [Google Scholar] [CrossRef]
  28. Tabatabai, M.A.; Bremner, J.M. Use of p-Nitrophenyl Phosphate for Assay of Soil Phosphatase Activity. Soil Biol. Biochem. 1969, 1, 301–307. [Google Scholar] [CrossRef]
  29. Fox, A.; Kwapinski, W.; Griffiths, B.S.; Schmalenberger, A. The Role of Sulfur- and Phosphorus-Mobilizing Bacteria in Biochar-Induced Growth Promotion of Lolium perenne. FEMS Microbiol. Ecol. 2014, 90, 78–91. [Google Scholar] [CrossRef] [PubMed]
  30. McGonigle, T.P.; Miller, M.H.; Evans, D.G.; Fairchild, G.L.; Swan, J.A. A New Method Which Gives an Objective Measure of Colonization of Roots by Vesicular-Arbuscular Mycorrhizal Fungi. New Phytol. 1990, 115, 495–501. [Google Scholar] [CrossRef] [PubMed]
  31. Muyzer, G.; de Waal, E.C.; Uitterlinden, A.G. Profiling of Complex Microbial Populations by Denaturing Gradient Gel Electrophoresis Analysis of Polymerase Chain Reaction-Amplified Genes Coding for 16S rRNA. Appl. Environ. Microbiol. 1993, 59, 695–700. [Google Scholar] [CrossRef] [PubMed]
  32. Ragot, S.A.; Kertesz, M.A.; Bünemann, E.K. phoD Alkaline Phosphatase Gene Diversity in Soil. Appl. Environ. Microbiol. 2015, 81, 7281–7289. [Google Scholar] [CrossRef] [PubMed]
  33. Fraser, T.D.; Lynch, D.H.; Gaiero, J.; Khosla, K.; Dunfield, K.E. Quantification of Bacterial Non-Specific Acid (phoC) and Alkaline (phoD) Phosphatase Genes in Bulk and Rhizosphere Soil from Organically Managed Soybean Fields. Appl. Soil Ecol. 2017, 111, 48–56. [Google Scholar] [CrossRef]
  34. Sakurai, M.; Wasaki, J.; Tomizawa, Y.; Shinano, T.; Osaki, M. Analysis of Bacterial Communities on Alkaline Phosphatase Genes in Soil Supplied with Organic Matter. Soil Sci. Plant Nutr. 2008, 54, 62–71. [Google Scholar] [CrossRef]
  35. Bolyen, E.; Rideout, J.R.; Dillon, M.R.; Bokulich, N.A.; Abnet, C.C.; Al-Ghalith, G.A.; Alexander, H.; Alm, E.J.; Arumugam, M.; Asnicar, F.; et al. Reproducible, Interactive, Scalable and Extensible Microbiome Data Science Using QIIME 2. Nat. Biotechnol. 2019, 37, 852–857. [Google Scholar] [CrossRef] [PubMed]
  36. Callahan, B.J.; McMurdie, P.J.; Rosen, M.J.; Han, A.W.; Johnson, A.J.A.; Holmes, S.P. DADA2: High-Resolution Sample Inference from Illumina Amplicon Data. Nat. Methods 2016, 13, 581–583. [Google Scholar] [CrossRef] [PubMed]
  37. Katoh, K.; Standley, D.M. MAFFT Multiple Sequence Alignment Software Version 7: Improvements in Performance and Usability. Mol. Biol. Evol. 2013, 30, 772–780. [Google Scholar] [CrossRef] [PubMed]
  38. Price, M.N.; Dehal, P.S.; Arkin, A.P. FastTree 2—Approximately Maximum-Likelihood Trees for Large Alignments. PLoS ONE 2010, 5, e9490. [Google Scholar] [CrossRef] [PubMed]
  39. Faith, D.P. Conservation Evaluation and Phylogenetic Diversity. Biol. Conserv. 1992, 61, 1–10. [Google Scholar] [CrossRef]
  40. Lozupone, C.A.; Hamady, M.; Kelley, S.T.; Knight, R. Quantitative and Qualitative β Diversity Measures Lead to Different Insights into Factors That Structure Microbial Communities. Appl. Environ. Microbiol. 2007, 73, 1576–1585. [Google Scholar] [CrossRef] [PubMed]
  41. Bokulich, N.A.; Kaehler, B.D.; Rideout, J.R.; Dillon, M.; Bolyen, E.; Knight, R.; Huttley, G.A.; Gregory Caporaso, J. Optimizing Taxonomic Classification of Marker-Gene Amplicon Sequences with QIIME 2′s q2-feature-classifier Plugin. Microbiome 2018, 6, 90. [Google Scholar] [CrossRef] [PubMed]
  42. Quast, C.; Pruesse, E.; Yilmaz, P.; Gerken, J.; Schweer, T.; Yarza, P.; Peplies, J.; Glöckner, F.O. The SILVA ribosomal RNA Gene Database Project: Improved Data Processing and Web-Based Tools. Nucleic Acids Res. 2013, 41, D590–D596. [Google Scholar] [CrossRef] [PubMed]
  43. Yilmaz, P.; Parfrey, L.W.; Yarza, P.; Gerken, J.; Pruesse, E.; Quast, C.; Schweer, T.; Peplies, J.; Ludwig, W.; Glöckner, F.O. The SILVA and “All-species Living Tree Project (LTP)” taxonomic frameworks. Nucleic Acids Res. 2014, 42, D643–D648. [Google Scholar] [CrossRef] [PubMed]
  44. Martin, M. Cutadapt Removes Adapter Sequences from High-Throughput Sequencing Reads. EMBnet J. 2011, 17, 10. [Google Scholar] [CrossRef]
  45. Edgar, R.C. Search and Clustering Orders of Magnitude Faster than BLAST. Bioinformatics 2010, 26, 2460–2461. [Google Scholar] [CrossRef] [PubMed]
  46. Edgar, R.C. UPARSE: Highly Accurate OTU Sequences from Microbial Amplicon Reads. Nat. Methods 2013, 10, 996–998. [Google Scholar] [CrossRef] [PubMed]
  47. Fraser, T.D.; Lynch, D.H.; Bent, E.; Entz, M.H.; Dunfield, K.E. Soil Bacterial phoD Gene Abundance and Expression in Response to Applied Phosphorus and Long-Term Management. Soil Biol. Biochem. 2015, 88, 137–147. [Google Scholar] [CrossRef]
  48. Fish, J.A.; Chai, B.; Wang, Q.; Sun, Y.; Brown, C.T.; Tiedje, J.M.; Cole, J.R. FunGene: The Functional Gene Pipeline and Repository. Front. Microbiol. 2013, 4, 291. [Google Scholar] [CrossRef] [PubMed]
  49. Herzel, H.; Krüger, O.; Hermann, L.; Adam, C. Sewage Sludge Ash—A Promising Secondary Phosphorus Source for Fertilizer Production. Sci. Total Environ. 2016, 542, 1136–1143. [Google Scholar] [CrossRef] [PubMed]
  50. Gherghel, A.; Teodosiu, C.; De Gisi, S. A Review on Wastewater Sludge Valorisation and Its Challenges in the Context of Circular Economy. J. Clean. Prod. 2019, 228, 244–263. [Google Scholar] [CrossRef]
  51. Choudhury, A.; Felton, G.; Moyle, J.; Lansing, S. Fluidized bed combustion of poultry litter at farm-scale: Environmental impacts using a life cycle approach. J. Clean. Prod. 2020, 276, 124231. [Google Scholar] [CrossRef]
  52. Lehmann, J.; Rillig, M.C.; Thies, J.; Masiello, C.A.; Hockaday, W.C.; Crowley, D. Biochar Effects on Soil Biota—A Review. Soil Biol. Biochem. 2011, 43, 1812–1836. [Google Scholar] [CrossRef]
  53. Deinert, L.; Ashekuzzaman, S.; Forrestal, P.; Schmalenberger, A. The impact of struvite and ash recycling-derived fertilizers on microbial phosphorus mobilization capabilities and community structure in a Lolium perenne field trial. bioRxiv 2024, arXiv:bioRxiv:2024.2001.2016.575387. [Google Scholar]
  54. Barrow, N.J. How understanding soil chemistry can lead to better phosphate fertilizer practice: A 68 year journey (so far). Plant Soil 2022, 476, 117–131. [Google Scholar] [CrossRef]
  55. Bakhshandeh, S.; Corneo, P.E.; Mariotte, P.; Kertesz, M.A.; Dijkstra, F.A. Effect of Crop Rotation on Mycorrhizal Colonization and Wheat Yield Under Different Fertilizer Treatments. Agric. Ecosyst. Environ. 2017, 247, 130–136. [Google Scholar] [CrossRef]
  56. Gryndler, M.; Larsen, J.; Hršelová, H.; Řezáčová, V.; Gryndlerová, H.; Kubát, J. Organic and Mineral Fertilization, Respectively, Increase and Decrease the Development of External Mycelium of Arbuscular Mycorrhizal Fungi in a Long-Term Field Experiment. Mycorrhiza 2006, 16, 159–166. [Google Scholar] [CrossRef] [PubMed]
  57. Dodd, J.C. Mycelium of Arbuscular Mycorrhizal Fungi (AMF) From Different Genera: Form, Function and Detection. Plant Soil 2000, 226, 131–151. [Google Scholar] [CrossRef]
  58. Thompson, J.P. Soilless Culture of Vesicular–Arbuscular Mycorrhizae of Cereals: Effects of Nutrient Concentration and Nitrogen Source. Can. J. Bot. 1986, 64, 2282–2294. [Google Scholar] [CrossRef]
  59. Tripathi, B.M.; Stegen, J.C.; Kim, M.; Dong, K.; Adams, J.M.; Lee, Y.K. Soil pH Mediates the Balance Between Stochastic and Deterministic Assembly of Bacteria. ISME J. 2018, 12, 1072–1083. [Google Scholar] [CrossRef] [PubMed]
  60. Penn, C.J.; Camberato, J.J. A Critical Review on Soil Chemical Processes that Control How Soil pH Affects Phosphorus Availability to Plants. Agriculture 2019, 9, 120. [Google Scholar] [CrossRef]
  61. Barrow, N.J.; Lambers, H. Phosphate-solubilising microorganisms mainly increase plant phosphate uptake by effects of pH on root physiology. Plant Soil 2022, 476, 397–402. [Google Scholar] [CrossRef]
  62. Mijangos, I.; Albizu, I.; Epelde, L.; Amezaga, I.; Mendarte, S.; Garbisu, C. Effects of Liming on Soil Properties and Plant Performance of Temperate Mountainous Grasslands. J. Environ. Manag. 2010, 91, 2066–2074. [Google Scholar] [CrossRef]
  63. Fraser, T.; Lynch, D.H.; Entz, M.H.; Dunfield, K.E. Linking Alkaline Phosphatase Activity with Bacterial phoD Gene Abundance in Soil from a Long-Term Management Trial. Geoderma 2015, 257–258, 115–122. [Google Scholar] [CrossRef]
  64. Spohn, M.; Treichel, N.S.; Cormann, M.; Schloter, M.; Fischer, D. Distribution of Phosphatase Activity and Various Bacterial Phyla in the Rhizosphere of Hordeum vulgare L. Depending on P Availability. Soil Biol. Biochem. 2015, 89, 44–51. [Google Scholar] [CrossRef]
  65. Gómez-Muñoz, B.; Efthymiou, A.; Dubey, M.; Sølve, J.; Nicolaisen, M.; Jensen, D.F.; Nybroe, O.; Larsen, J. Cellulose Amendment Promotes P Solubilization by Penicillium aculeatum in Non-Sterilized Soil. Fungal Biol. 2022, 126, 356–365. [Google Scholar] [CrossRef] [PubMed]
  66. Ragot, S.A.; Kertesz, M.A.; Mészáros, É.; Frossard, E.; Bünemann, E.K. Soil phoD and phoX Alkaline Phosphatase Gene Diversity Responds to Multiple Environmental Factors. FEMS Microbiol. Ecol. 2017, 93, fiw212. [Google Scholar] [CrossRef] [PubMed]
  67. Solans, M.; Messuti, M.I.; Reiner, G.; Boenel, M.; Vobis, G.; Wall, L.G.; Scervino, J.M. Exploring the Response of Actinobacteria to the Presence of Phosphorus Salts Sources: Metabolic and Co-Metabolic Processes. J. Basic Microbiol. 2019, 59, 487–495. [Google Scholar] [CrossRef] [PubMed]
  68. Wan, W.; Wang, Y.; Tan, J.; Qin, Y.; Zuo, W.; Wu, H.; He, H.; He, D. Alkaline Phosphatase-Harboring Bacterial Community and Multiple Enzyme Activity Contribute to Phosphorus Transformation During Vegetable Waste and Chicken Manure Composting. Bioresour. Technol. 2020, 297, 122406. [Google Scholar] [CrossRef] [PubMed]
  69. Zhang, X.; Li, X.; Ye, L.; Huang, Y.; Kang, Z.; Zhang, B.; Zhang, X. Colonization by Tuber melanosporum and Tuber indicum affects the growth of Pinus armandii and phoD alkaline phosphatase encoding bacterial community in the rhizosphere. Microbiol. Res. 2020, 239, 126520. [Google Scholar] [CrossRef]
  70. Liu, W.; Ling, N.; Luo, G.; Guo, J.; Zhu, C.; Xu, Q.; Liu, M.; Shen, Q.; Guo, S. Active phoD-Harboring Bacteria are Enriched by Long-Term Organic Fertilization. Soil Biol. Biochem. 2021, 152, 108071. [Google Scholar] [CrossRef]
  71. Yin, Y.; Yang, C.; Li, M.; Yang, S.; Tao, X.; Zheng, Y.; Wang, X.; Chen, R. Biochar reduces bioavailability of phosphorus during swine manure composting: Roles of phoD-harboring bacterial community. Sci. Total Environ. 2023, 858, 159926. [Google Scholar] [CrossRef]
  72. Sigurnjak, I.; Saju, A.; Schmalenberger, A.; Lagrange, H.; Forrestal, P.; Postma, R.; van Scholl, L.; Verleden, I.; Ryan, D.; Krapinska, A.; et al. Product Information Sheets (WPT1_D3.4). Interreg North-West Europe; ReNu2Farm. Available online: https://www.nmi-agro.nl/wp-content/uploads/2019/09/21022022_WPT1_D3.4-Product-factsheets.pdf (accessed on 26 January 2024).
Figure 1. 16S rRNA gene PCR-DGGE based CCA biplot with environmental parameters plant dry weight (dwt), phoC and phoD copy numbers, soil pH, phosphonate (PAA) and phytate (Phy) utilizing MPN counts, plant available P (Pav) and AMF vesicle colonization (VC), significantly (p < 0.05) affecting the rhizosphere soil bacterial community; CCA1 explains 30.02% and CCA2 14.16% of the total variation of the data, n = 6.
Environments 11 00049 g001
Figure 2. CCA plot of the 16S rRNA amplicon sequencing data of the microcosm trial, significantly correlated environmental parameters are perennial ryegrass dry weight (dwt), bioavailable P determined via Morgan’s P (Pav), phosphonate-P mobilizing bacteria (PAA), phytate−P mobilizing bacteria (Phy), acid (phoC) and alkaline phosphatase (phoD) gene copy numbers, soil pH (pH), vesicular root colonisation by AMF (VC), CCA1 explains 5.03% and CCA2 4.64% of the total variation of the data, n = 6.
Environments 11 00049 g002
Figure 3. Horizontal bar plot of top 10 relative abundance phyla for SP0 (blue, 1st top), SP60 (purple, 2nd top), PLA60 (yellow, 3rd top) and SSA60 (red, bottom) (16S rRNA NGS data), error bars state standard error, significance determined via Kruskal–Wallis test and Wilcoxon post-hoc analysis and Benjamini–Hochberg correction, different letters a–c indicate statistically significant differences for each phylum (p ≤ 0.05), n = 6.
Environments 11 00049 g003
Figure 4. CCA biplot of the phoD bacterial community structure of the microcosm trial, CCA1 explains 6.68% and CCA2 4.49% of the total variation of the data environmental parameters; plant available P (Pav), phytate (Phy) and phosphonate (PAA) utilizing bacteria, L. perenne shoot dry weight (dwt), phoC and phoD copy numbers and soil pH affected the community structure significantly (p < 0.05), n = 6.
Environments 11 00049 g004
Figure 5. Mean relative abundance (%) bar plots of top 10 genera of the phoD functional amplicon sequencing with significantly different abundance, significance determined via Kruskal-Wallis test and Wilcoxon post-hoc analysis and Benjamini-Hochberg correction, different letters a–d state significant difference, P0 control (SP0) data depicted in light blue, mineral fertilizer (SP60) in purple and ash fertilizer treatments (PLA60, SSA60) in yellow, n = 6.
Environments 11 00049 g005
Table 1. Average values for fresh weight (FW) and dry weight (DW) of Lolium perenne harvest, shoot count, dry weight to shoot ratio, and agronomic efficiency (AE).
TreatmentBiomass FW (g)Biomass DW (g)Shoot CountDW:Shoot Ratio (g Shoot−1)AE
SP011.87 b±0.331.49 b±0.1687.3 a±2.730.017 a±1.7 × 10−03
SP6014.63 a±0.311.71 ab±0.0587.2 a±3.720.020 a±7.8 × 10−0413.5
PLA6013.13 ab±0.241.84 a±0.0286.3 a±2.890.021 a±5.5 × 10−0420.8
SSA6012.76 b±0.711.77 ab±0.0484.5 a±3.120.021 a±1.1 × 10−0317.0
54 d of growth, n = 6, letters a,b indicate significant difference per column, ± = standard error.
Table 2. Mass balance of total perennial ryegrass shoot dry weight (pooled) per treatment after 54 days of growth.
TreatmentMacronutrients [µg]
CaKMgNPS
SP0137951353254070157291
SP60138142903603911214292
PLA60102542382633094136245
SSA60115740362823565151263
TreatmentMicronutrients [µg]
BCuFeMbMnZn
SP00.751.3235.200.0122.194.63
SP600.671.2821.210.0216.864.58
PLA600.610.9317.790.0216.813.87
SSA600.581.0224.740.0116.033.95
Calcium (Ca), potassium (K), magnesium (Mg), nitrogen (N), phosphorus (P), sulphur (S), boron (B), copper (Cu), iron (Fe), molybdenum (Mb), manganese (Mn), zinc (Zn).
Table 3. MPN values of phosphonoacetic acid utilizing (PAA) and phytate utilizing (Phy) bacteria, and MPN values of total heterotrophic bacteria (R2A) in rhizosphere soil of L. perenne.
TreatmentPAA (MPN g−1 Soil)Phy (MPN g−1 Soil)R2A (MPN g−1 Soil)
SP06.2 × 1005 b±2.0 × 10053.5 × 1006 b±7.2 × 10052.0 × 1008 a±1.4 × 1008
SP601.6 × 1006 b±1.1 × 10066.7 × 1006 b±1.3 × 10068.7 × 1007 a±2.1 × 1007
PLA603.2 × 1006 a±4.2 × 10051.8 × 1007 a±5.1 × 10061.1 × 1008 a±4.7 × 1007
SSA603.7 × 1006 ab±1.1 × 10061.0 × 1007 ab±3.0 × 10067.8 × 1007 a±1.1 × 1007
54 d of growth, n = 6, letters a,b indicate significant difference per column, ± = standard error.
Table 4. Mean values for soil pH (bulk soil) and plant available P (Morgan’s; rhizosphere soil from L. perenne in microcosms.
TreatmentSoil pHMorgan’s P (mg P L−1)
SP04.75 c±0.011.53 b±0.11
SP605.06 b±0.033.12 a±0.15
PLA605.34 a±0.033.20 a±0.55
SSA605.30 a±0.042.43 a±0.16
54 d of growth, n = 6, letters a–c indicate significant difference per column, ± = standard error.
Table 5. Potential acid (ACP) and alkaline phosphatase (ALP) and absolute phoC and phoD gene copy numbers per gram of L. perenne rhizosphere soil in microcosms.
TreatmentACP
(µg pNP g−1 Soil h−1)
ALP
(µg pNP g−1 Soil h−1)
phoC
(phoC Copies g−1 Soil)
phoD
(phoD Copies g−1 Soil)
SP01504.9 a±79.0121.9 a±11.11.1 × 1007 b±1.7 × 10061.5 × 1009 b±1.8 × 1008
SP601556.1 a±65.2109.7 a±8.31.1 × 1007 b±9.7 × 10051.5 × 1009 b±5.8 × 1007
PLA601608.1 a±91.4117.4 a±6.52.2 × 1007 ab±3.3 × 10062.8 × 1009 a±2.7 × 1008
SSA601322.1 a±94.0115.9 a±6.72.2 × 1007 a±8.0 × 10052.5 × 1009 a±1.1 × 1008
54 d of growth, n = 6, letters a,b indicate significant difference per column, ± = standard error.
Disclaimer/Publisher’s Note: The statements, opinions and data contained in all publications are solely those of the individual author(s) and contributor(s) and not of MDPI and/or the editor(s). MDPI and/or the editor(s) disclaim responsibility for any injury to people or property resulting from any ideas, methods, instructions or products referred to in the content.

