Article

Correlating Quantitative and Genomic SARS-CoV-2 Wastewater Data with Clinical Metrics in Metropolitan Perth, Western Australia

1
PathWest Laboratory Medicine WA, Department of Microbiology, Queen Elizabeth II Medical Centre, Nedlands, WA 6009, Australia
2
Communicable Disease Control Directorate, Public and Aboriginal Health Division, Department of Health Western Australia, East Perth, WA 6004, Australia
3
Water Corporation, Leederville, WA 6007, Australia
4
School of Medicine, University of Western Australia, Crawley, WA 6009, Australia
5
Wesfarmers Centre of Vaccines and Infectious Diseases, Telethon Kids Institute, Nedlands, WA 6009, Australia
6
School of Biomedical Sciences, University of Western Australia, Crawley, WA 6009, Australia
*
Author to whom correspondence should be addressed.
Environments 2024, 11(4), 62; https://doi.org/10.3390/environments11040062
Submission received: 4 March 2024 / Revised: 18 March 2024 / Accepted: 22 March 2024 / Published: 24 March 2024
(This article belongs to the Special Issue Wastewater-Based Epidemiology Assessment)

Abstract

:
Wastewater-based epidemiology (WBE) has emerged as a key method for the continuous monitoring of COVID-19 prevalence including circulating SARS-CoV-2 lineages. WBE addresses the limitations of traditional clinical COVID-19 surveillance such as clinical test availability, fluctuating testing rates, and increased reliance on rapid antigen tests. Our study in Perth, Western Australia found a significant positive correlation between SARS-CoV-2 concentrations in wastewater and clinical PCR positivity rates (rs = 0.772; p < 0.001) over an 18-month period that included four successive COVID-19 waves. A strong positive correlation was apparent between the proportions of SARS-CoV-2 lineages in wastewater and clinical cases within the same region (rs = 0.728, p < 0.001), including earlier detection of Omicron and recombinant lineages in wastewater before clinical case confirmation. The successful integration of WBE with healthcare data underscores its critical role in enhancing public health decision-making and pandemic management. This approach not only demonstrates the value of WBE in current global health surveillance efforts but also highlights the potential of WBE to address future public health challenges, as a comprehensive disease monitoring and response approach.

1. Introduction

Communicable disease surveillance systems are essential in understanding the prevalence and characterizing the transmission of pathogens in the community. Traditional surveillance systems rely heavily on the continuous and systematic collection of clinical case data (clinical surveillance). This includes diagnostic test results, patient-reported symptoms, and information from healthcare providers, including hospitalizations [1]. Clinical surveillance is essential in tracking the spread of respiratory pathogens such as influenza, respiratory syncytial virus (RSV), and severe acute respiratory syndrome coronavirus 2 (SARS-CoV-2). However, passive surveillance systems that rely solely on individuals seeking healthcare under-represent the true disease prevalence in the community, particularly when symptoms are either mild or completely absent [2].
The effectiveness of clinical surveillance systems is dependent on the timing and completeness of the system end-to-end. Where prompt public health responses are critical, such as during the initial stages of an outbreak, delays in notifications, data collection, analysis, and reporting can impact the ability to undertake effective and timely public health action [3]. These challenges were highlighted during the COVID-19 pandemic [4], underlining the necessity for timely and representative surveillance systems. This is exacerbated with self-testing, which bypasses communicable disease notification systems, such as the use of rapid antigen testing (RAT) on self-collected specimens for respiratory viruses [5].
Wastewater-based epidemiology (WBE) has emerged as a significant complementary addition to traditional clinical surveillance systems. WBE involves the analysis of raw wastewater to detect markers of disease at the population level, and offers insights independent of individual healthcare-seeking behaviors and medical practitioner testing practices [1]. WBE for SARS-CoV-2 evolved rapidly due to the requirement for improved surveillance driven by the COVID-19 pandemic [6]. Studies have demonstrated a positive correlation between SARS-CoV-2 viral concentrations in wastewater and associated clinical metrics in the corresponding region [7,8,9]. Recently, this has also been demonstrated for a range of other respiratory viruses including other seasonal coronaviruses, rhinovirus, human metapneumovirus, parainfluenza virus, RSV, and influenza [10,11,12]. This suggests that WBE is able to provide an understanding of the transmission of diseases at the community level, and is less prone to biases, which often implicate clinical surveillance systems. Furthermore, there is emerging evidence of WBE’s ability to act as an early warning system ahead of increases in clinical case numbers [13] or hospitalizations [14].
Recent advancements in next-generation sequencing and bioinformatic analysis have enabled the monitoring of intra-species viral lineages in wastewater samples [15,16]. This cost-effective capability has the potential to provide a genomic epidemiological understanding of viral dynamics at the community level, permitting a better understanding of the progression and burden of communicable diseases. Given that wastewater matrices are a mixed sample from diverse individuals, the SARS-CoV-2 sequencing data generated from wastewater requires deconvolution into interpretable data. This process has been primarily applied to SARS-CoV-2 for assessing community-wide genomic epidemiology, utilizing bioinformatics tools such as Freyja [16], which recovers relative lineage abundances from mixed SARS-CoV-2 samples. Research has shown that these methods support the early detection of emerging variants within communities [9,17], and has also established a significant positive correlation between the variants of concern in wastewater and clinical cases in corresponding communities [18,19,20]. While SARS-CoV-2 lineage proportion data in wastewater have been publicly available in many jurisdictions since 2022 [21,22,23], the temporal correlation analysis between Omicron and recombinant sub-lineages detected in wastewater and clinical cases has been limited [18,24].
This study demonstrates that WBE of SARS-CoV-2 correlates with clinical metrics such as COVID-19 case notifications and polymerase chain reaction (PCR) test positivity rates in Perth, Western Australia (WA)—a city with approximately 2,100,000 residents [25]. Our approach involves a detailed examination of the relative abundance of key Omicron and recombinant SARS-CoV-2 lineages in wastewater and their correlation to the percentage of clinical cases identified with these specific lineages in the corresponding region. The data produced were available in real time to public health agencies and were used to inform disease prevention and control.

2. Materials and Methods

2.1. Wastewater Sample Collection

Since July 2022, bi-weekly wastewater samples were collected from three metropolitan wastewater treatment plants (WWTPs) in Perth, WA as part of a SARS-CoV-2 wastewater surveillance program; these included Subiaco (approximate population 250,000), Woodman Point (approximate population 750,000), and Beenyup (approximate population 700,000). The three catchments represent approximately 79% of metropolitan Perth’s population [25].
Sample collection involved flow-paced, continuous auto-samplers at each plant. Hourly, 400 mL samples were pooled to form a 24 h composite sample, which was retained at 4 °C during the sampling window. These composite samples were homogenized, and 250 mL aliquots were sampled and transported on ice to the laboratory on the day of collection. Samples were stored between 2 °C and 8 °C until testing, which occurred within seven days of collection.
From 4 July 2022 to 31 December 2023, a total of 447 composite wastewater samples were collected from these WWTPs.

2.2. Wastewater Concentration and Extraction

Each wastewater sample was pre-treated, concentrated, and nucleic-acid-purified using 50 mL aliquots, as per a previously described procedure [26]. Briefly, sample aliquots were pre-treated with MgCl2 and centrifuged to remove solids. The supernatant was concentrated on an electronegative filter membrane and nucleic acid purification was performed on the filter membrane using the MagMAX Microbiome Ultra Nucleic Acid Isolation Kit (ThermoFisher, Waltham, MA, USA). All samples were spiked with MS2 bacteriophage, an internal process control, prior to nucleic acid purification.

2.3. SARS-CoV-2 Real-Time PCR

SARS-CoV-2 PCR analysis was performed on all wastewater samples collected between 4 July 2022 and 31 December 2023 (N = 447). Quantitative real-time PCR (qPCR) was employed for SARS-CoV-2 quantitation, using the PerkinElmer SARS-CoV-2 Real-time RT-PCR assay (PerkinElmer, Shelton, USA). This assay targets the nucleocapsid and ORF1ab genomic regions of SARS-CoV-2. Sequences for primers and probes in this commercial kit, identified as the China CDC set by Water Research Australia [27], are detailed in Table 1 [28]. Additionally, MS2 bacteriophage is targeted as an internal process control (IPC). Following initial verification, the volume of reagents used in each qPCR reaction was halved. Each wastewater sample, alongside negative template controls, was assayed in duplicate technical replicates. Purified SARS-CoV-2 RNA was included as a positive amplification control. Pre-established expected cycle threshold (Ct) values and their 95% confidence intervals were used as benchmarks for the positive control, with repeat batch analysis when the control results did not fall within these confidence intervals.
The limits of detection (LoDs) and quantification (LoQs) were established at 5 copies/reaction (equivalent to 200 copies/50 mL) and 12.5 copies/reaction (equivalent to 500 copies/50 mL), respectively, for both SARS-CoV-2 targets.

2.4. Molecular Inhibition Assessment

MS2 Ct values served as the indicators of extraction issues and to monitor for PCR inhibition. The 95% confidence limits for these values in negative template controls were established. Samples that yielded MS2 Ct values outside these established limits were repeated. In the repeat analysis, both 5 µL and 2 µL aliquots of purified nucleic acid were used per reaction. Sample results with MS2 Ct values within the 95% confidence limits were considered valid. Those that consistently fell outside these limits were excluded from further quantification and the result was reported as indeterminate.

2.5. Wastewater SARS-CoV-2 Viral Quantification

Commercially acquired, quantified SARS-CoV-2 RNA (Twist Bioscience, United States) was used to generate standard curves in the PerkinElmer SARS-CoV-2 Real-time RT-PCR assay. Upon receipt, the RNA stock, transported on dry ice, was promptly stored at −80 °C. For assay preparation, the RNA was thawed and serially diluted to create a range of concentrations from 10−2 to 10−5 (equivalent to 10 to 10,000 copies/µL). These dilutions were then dispensed into 20 µL volumes, maintained on ice during the process, and subsequently stored at −80 °C. Individual aliquots were thawed for each analytical batch to ensure consistency across different runs.
Triplicate 5 µL template volumes of four serial dilution levels (50 to 50,000 copies/reaction) were used. Each PCR batch used fresh aliquots of RNA for standard curve production.
To express the sample quantitation results as genome copies per 50 mL of wastewater, the concentrations deduced from the standard curve were multiplied by the concentration factor of 40. qPCR assays were executed using the CFX96 Touch Real-Time PCR Detection System (Bio-Rad Laboratories, Hercules, USA), with quantification calculated through CFX Maestro Software v2.3 (Bio-Rad Laboratories, USA). The final quantified outcome for each specimen, denoted as genome copies/50 mL, represented the mean of the values from dual replicates across both the ORF1ab and nucleocapsid targets. Results from templates diluted below 5 µL were manually recalibrated by the corresponding dilution factor.
All samples collected after the 9th of October 2023 were quantified exclusively using the average results from the ORF1ab target due to a mutation identified in all BA.2.86 sub-lineages, which impacted the nucleocapsid assay performance.
Results below the LoQ were considered in the correlation analysis.

2.6. SARS-CoV-2 Genome Sequencing

SARS-CoV-2 genome sequencing (GS) was performed weekly on one wastewater sample from each WWTP for the complete study period (N = 239).
Upon completion of the SARS-CoV-2 quantification, cDNA synthesis was performed on each purified nucleic acid extract using SuperScript VILO mastermix (ThermoFisher, Waltham, MA, USA) or LunaScript RT SuperMix (New England Biolabs, Ipswich, MA, USA). These reverse transcription chemistries were validated to ensure comparable results. The genome of SARS-CoV-2 was amplified using a modified ARTIC V3 primer set (400 bp) in combination with Q5 Hot Start DNA Polymerase (New England BioLabs, Ipswich, MA, USA), following the manufacturer’s recommended protocol. Weekly sequencing included a positive control of a known lineage, a non-template control that underwent parallel nucleic acid purification, and a non-template control of ultra-pure H2O.
Libraries for sequencing were prepared using the Illumina Nextera XT kit (Illumina, San Diego, CA, USA), adhering to the manufacturer’s recommendations but with half the volume of reagents and employing unique dual indexing. Sequencing was conducted on Illumina platforms (iSeq, 150 bp reads; MiniSeq 150 bp reads; and MiSeq, 300 bp reads) (Illumina, USA). Quality control of the sequencing runs was carried out using a custom in-house pipeline involving mapping of trimmed reads to reference strain Wuhan-Hu-1 (accession NC_045512.2) and SARS-CoV-2 lineage assignment with Pangolin v4.3.1 (https://github.com/cov-lineages/pangolin) in clinical cases.
Before January 24, 2023, a custom in-house pipeline was employed for the routine reporting of SARS-CoV-2 lineage abundance in wastewater. On January 24, 2023, all historical wastewater sequencing data were reanalyzed using Freyja v1.3.9 [16], applying the most recent lineage-determining mutational “barcodes” available at that time, which were derived from the Ultrafast Sample placement on Existing tRees (UShER) global phylogeny (https://github.com/andersen-lab/Freyja/). From this date, Freyja was used as detailed in Supplementary Material File S1, Table S1. SARS-CoV-2 genome coverage was calculated for each sample using a 10× depth. Samples with a genome coverage of <60% were not reported or used for subsequent correlation analysis. Sub-lineages were condensed into their respective parent lineages to facilitate results presentation and data analysis as per Supplementary Material File S1, Table S4.

2.7. Clinical Data

PathWest Laboratory Medicine WA (PathWest) is the sole public pathology provider in WA, offering clinical and environmental microbiology testing. For this study, we calculated the clinical PCR test positivity rate, defined as the number of positive molecular clinical tests divided by the total number of molecular tests conducted for SARS-CoV-2 at PathWest. The tests used to calculate the PCR positivity were restricted to residents from metropolitan Perth, enabling comparison with SARS-CoV-2 wastewater concentrations from the three metropolitan WWTPs.
PathWest is the sole laboratory in WA undertaking clinical whole-genome sequencing (WGS) for SARS-CoV-2. This study incorporates data from all sequenced SARS-CoV-2 cases in the Perth metropolitan area throughout the duration of the analysis, including the assigned Pangolin designation [29]. Sub-lineages designated by Pangolin were condensed into their respective parent lineages to facilitate results presentation and data analysis as per Supplementary Material File S1, Table S5.
In WA, COVID-19 is a notifiable infectious disease under the Public Health Act 2016 [30], mandating all pathology laboratories and medical or nursing practitioners to report any detections of COVID-19 to the WA Department of Health. From 7 February 2022, under the provisions of the Emergency Management Act 2005 [31], individuals with a positive RAT for SARS-CoV-2 were mandated to self-report their results to the WA Department of Health via an online portal. The portal to report RATs to the WA Department of Health ceased operations on 9 October 2023. This study utilizes notification data of only PCR-confirmed COVID-19 clinical cases with a residential address in metropolitan Perth that were reported to the WA Department of Health to allow for comparison with wastewater concentration levels from the three metropolitan WWTPs.

2.8. Data Processing, Correlation and Statistical Significance

Each week, the average SARS-CoV-2 concentrations in wastewater were calculated by aggregating quantified results from samples across all three WWTPs, excluding indeterminate results. Concurrently, the corresponding rate of clinical PCR positivity and the total number of weekly PCR-positive clinical notifications were collated (Supplementary Material File S2, Table S1).
The weekly relative abundance of SARS-CoV-2 parent lineages in both clinical and wastewater samples was determined (Supplementary Material File S2, Tables S2 and S3). Information on the number of wastewater samples used each week for calculating the average concentrations and relative lineage abundances is available in Supplementary Material File S2, Table S4.
To analyze the relationship between the wastewater and clinical datasets, Spearman’s rank correlation coefficient (rs) was employed. Additionally, the statistical significance of the correlation was determined (p) [32].

3. Results

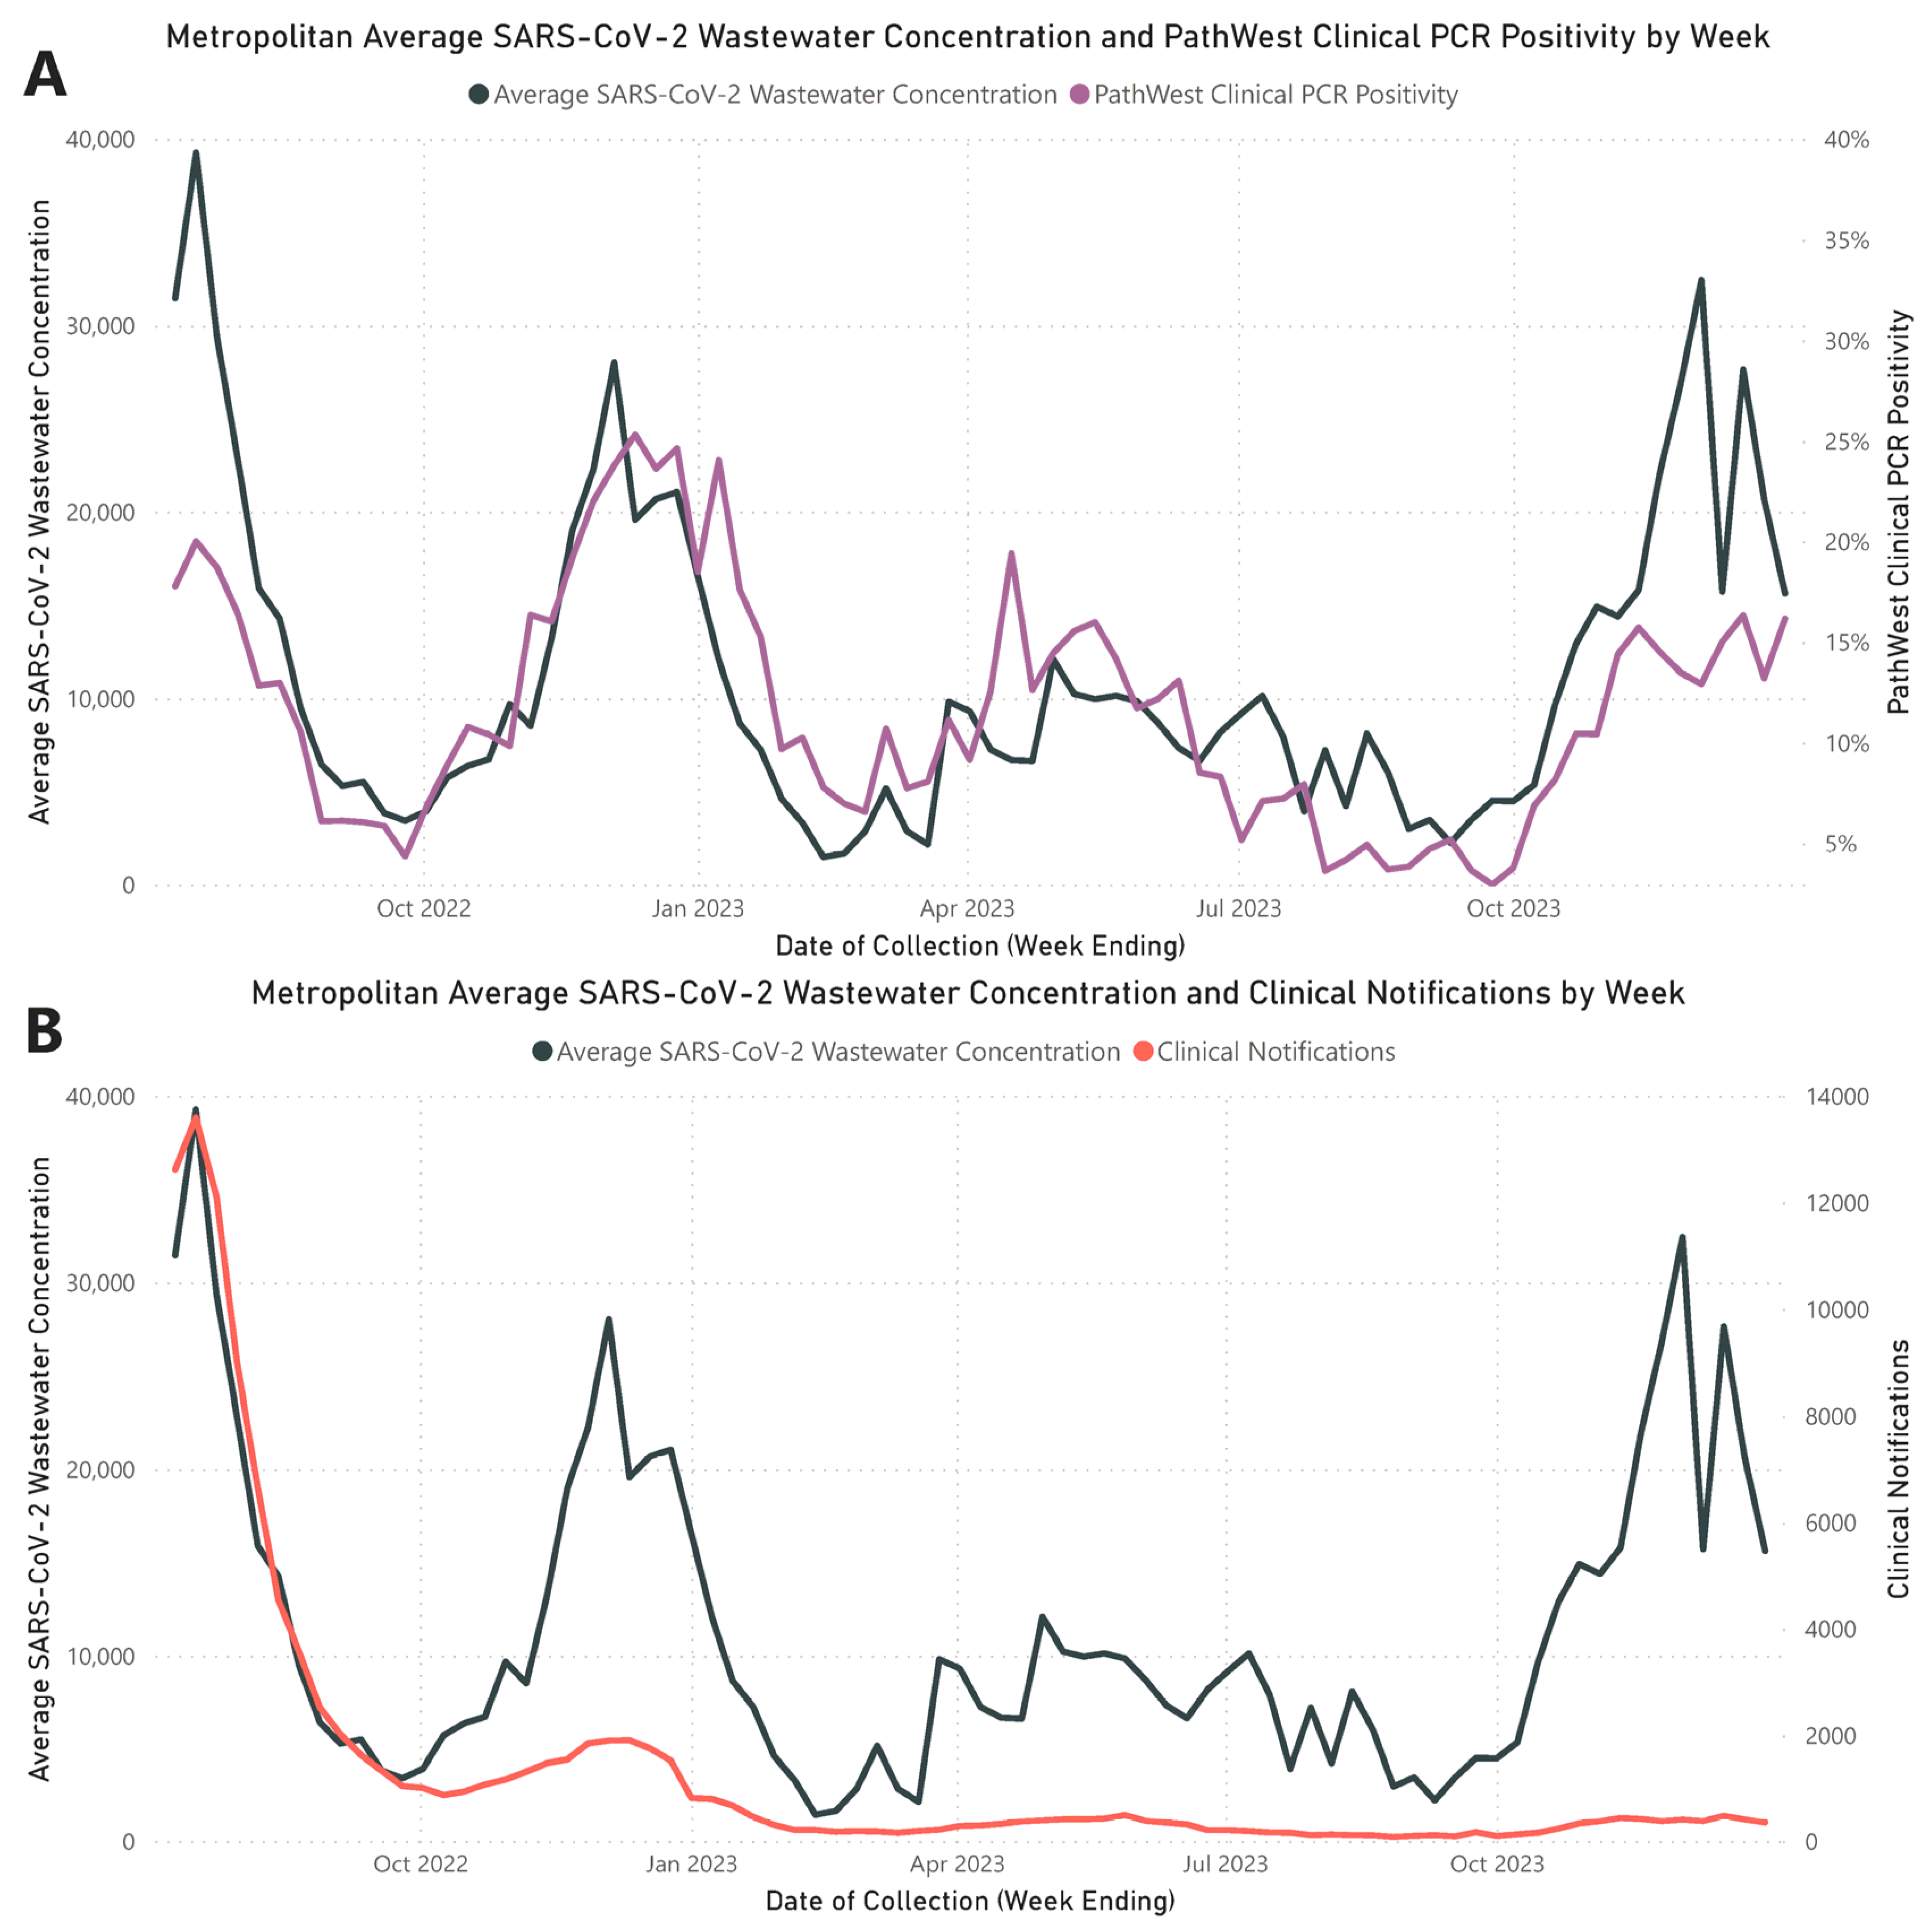
3.1. Quantitative Correlation of Respiratory Clinical Metrics to Wastewater Concentrations

From 4 July 2022 to 31 December 2023, 447 raw wastewater samples were analyzed for SARS-CoV-2 using qPCR, with a detection rate of 100%.
Throughout the study period, the analysis of weekly average wastewater concentrations from the three metropolitan WWTPs identified four distinct waves of increased SARS-CoV-2 RNA levels, aligning with peaks in clinical counts (Figure 1). These wastewater waves peaked on the following dates: Wave 1 on 17 July 2022; Wave 2 on 4 December 2022; Wave 3 on 30 April 2023; and Wave 4 on 3 December 2023. A strong and statistically significant positive correlation was established between the metropolitan average weekly SARS-CoV-2 wastewater RNA concentrations and clinical PCR positivity rates reported by PathWest (rs = 0.772; p < 0.001). A significant but weaker positive correlation was noted between average weekly wastewater RNA concentrations and metropolitan PCR-confirmed COVID-19 case notifications (rs = 0.577; p < 0.001). Detailed values of the weekly average SARS-CoV-2 wastewater concentrations, PathWest clinical PCR positivity rates, and metropolitan PCR-confirmed clinical notifications are documented in Supplementary Material File S2, Table S1.
A total of 11 out of 447 samples (2.46%) did not yield quantifiable results as their MS2 Ct values were outside the 95% confidence limit. Seven samples from Subiaco WWTP exhibited MS2 Ct values lower than anticipated, suggesting an intrinsic presence of MS2 that surpassed the spiked reference. Three samples from Woodman Point WWTP consistently showed high Ct values that were not resolved by dilution. One sample had a quantification level below the established LoQ, with less than 500 genome copies per 50 mL.

3.2. SARS-CoV-2 Wastewater Genomic Coverage and Correlation to Quantitation

The average genome coverage across the 239 wastewater samples that underwent GS was 87.01% (median 91.30%, range 39.40% to 99.31%). Seventeen samples (7.11%) did not meet the quality control standards for the relative lineage abundance assessment, as their genome coverage fell below 60% (Supplementary Material File S1, Table S1).
A significant negative correlation was observed between genome coverage and the average MS2 Ct value (rs = −0.293, p < 0.001). A positive and significant correlation was noted between the concentration of SARS-CoV-2 in wastewater and genome coverage (rs = 0.596, p < 0.001). The paired data for each of these correlations are available in Supplementary Material File S1, Table S2 and Table S3.

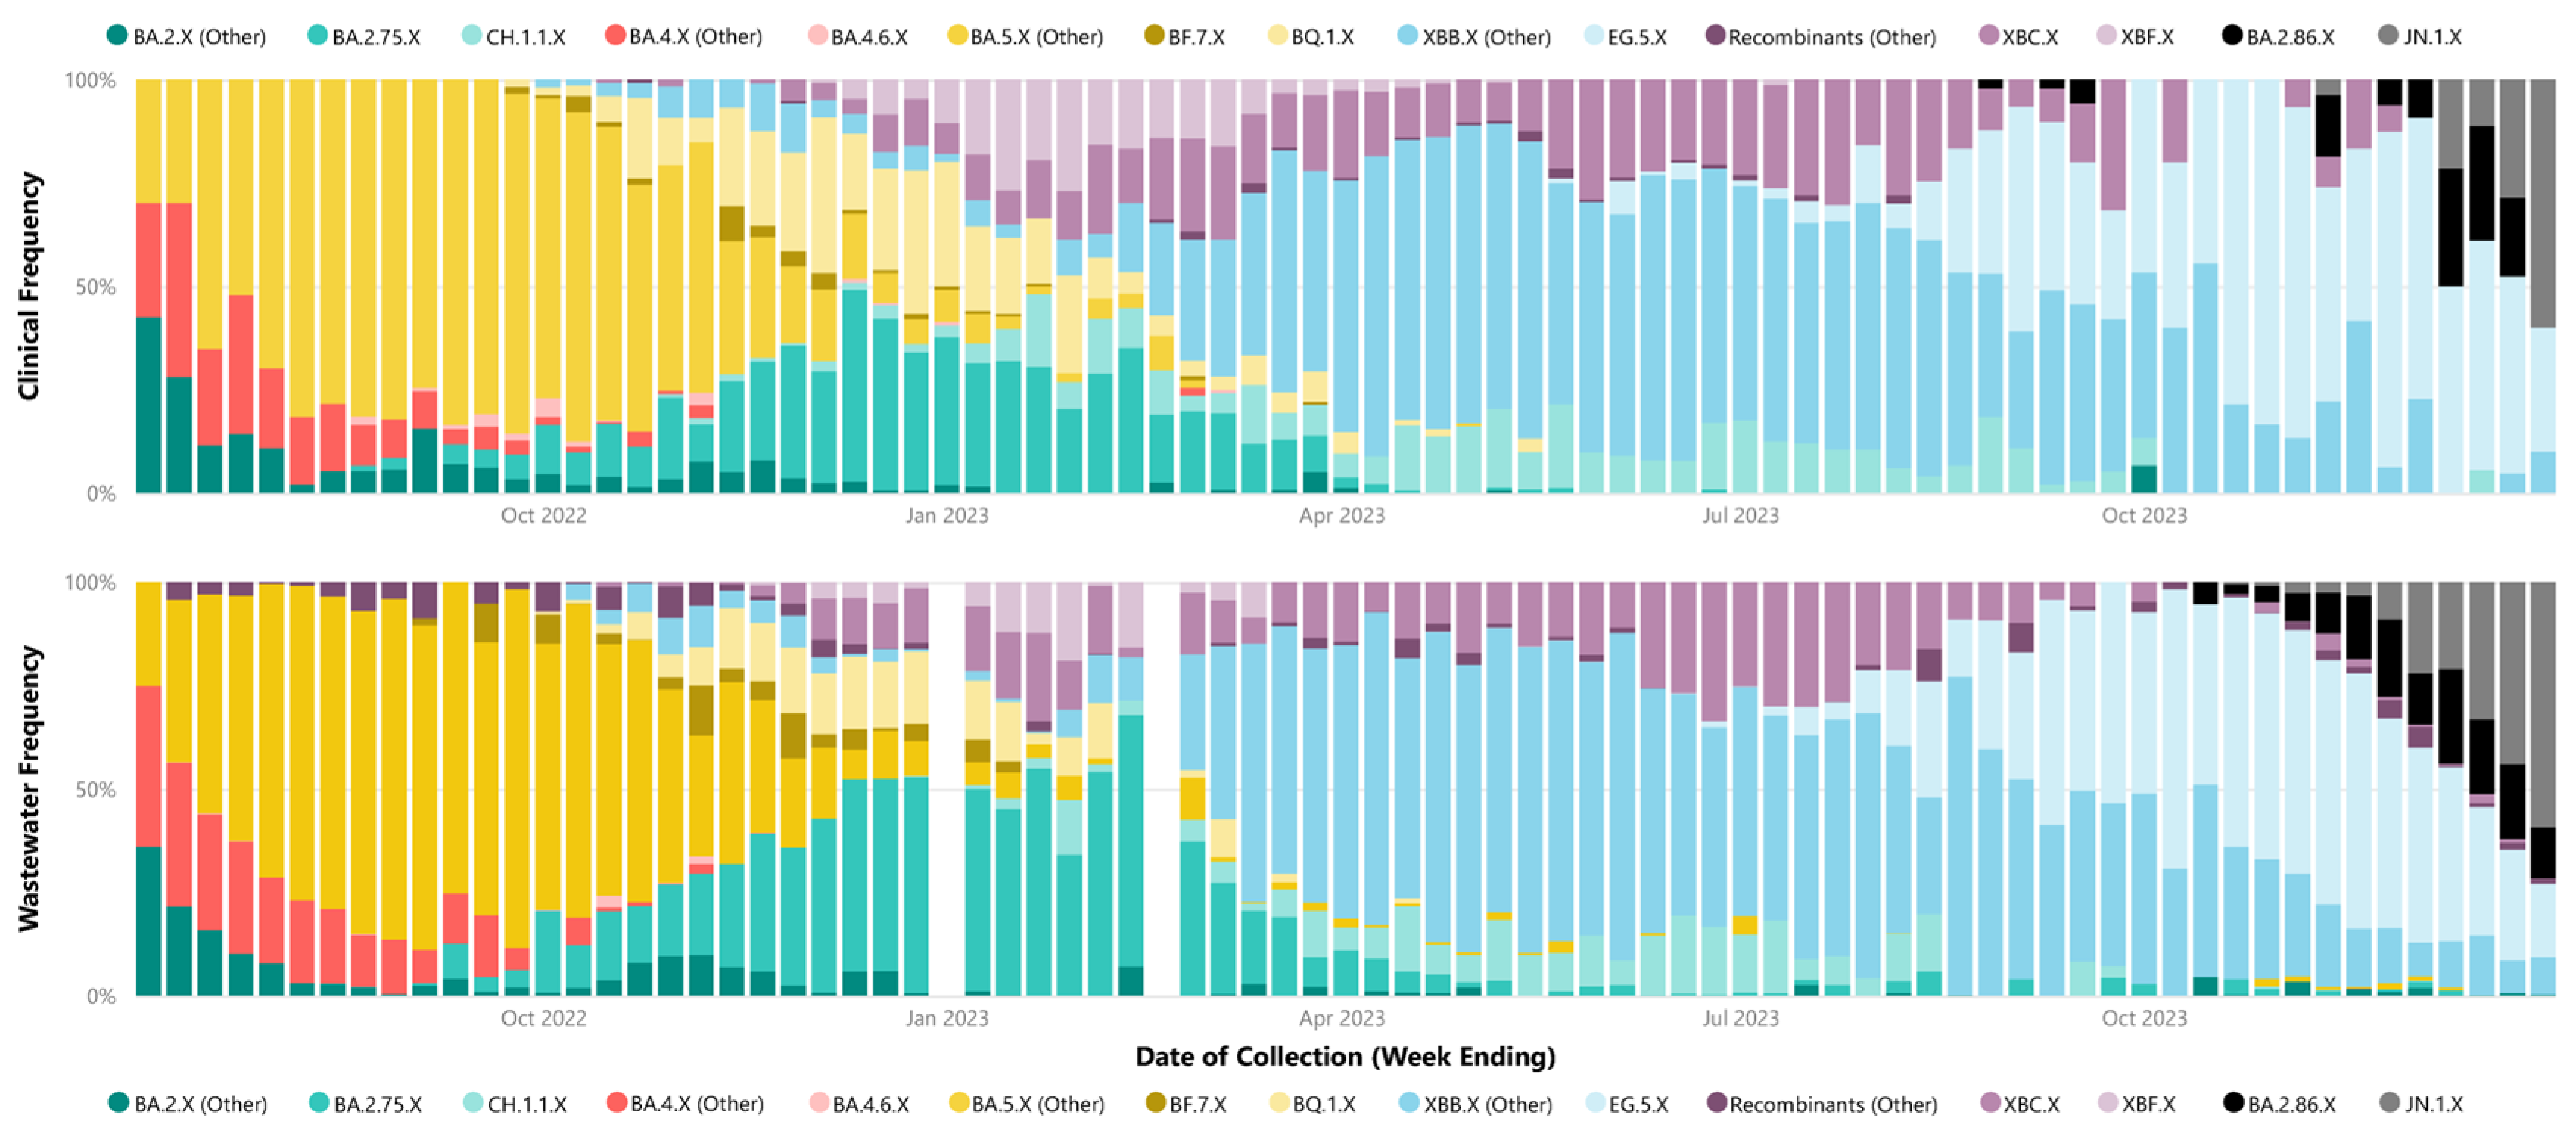
3.3. SARS-CoV-2 Relative Lineage Abundance Correlation

The analysis of relative weekly parent lineage abundance in wastewater accurately captured the dominance of specific parent lineages during the identified waves, consistent with clinical data. Wave 1 was predominantly characterized by BA.4.X and BA.5.X sub-lineages. Wave 2 was mainly dominated by BA.2.75.X sub-lineages. In Wave 3, XBB.X sub-lineages were prevalent, and Wave 4 initially saw the dominance of the XBB.X sub-lineage EG.5.X, later transitioning to the BA.2.86.X sub-lineages taking precedence, including JN.1.X (Figure 2). Parent lineage grouping for each identified sub-lineage in each wastewater and clinical samples are recorded in Supplementary Material File S1, Table S4 and Table S5, respectively.
The paired analyses of weekly wastewater relative parent lineage abundance and the proportion of clinical cases in the metropolitan area showed a strong positive correlation (rs = 0.728, p < 0.001) (Figure 3). The correlation coefficients varied across separate parent lineages. Notably, stronger positive correlations were observed for parent lineages with moderate to high abundance in clinical patients. These included BA.4.X (other) (rs = 0.916, p < 0.001), BA.5.X (other) (rs = 0.908, p < 0.001), XBB.X (other) (rs = 0.883, p < 0.001), EG.5.X (rs = 0.845, p < 0.001), BA.2.75.X (rs = 0.823, p < 0.001), BQ.1.X (rs = 0.788, p < 0.001), XBF.X (rs = 0.770, p < 0.001), JN.1.X (rs = 0.717, p = 0.009), BA.2.86.X (rs = 0.597, p = 0.019), CH.1.1.X (rs = 0.555, p < 0.001), and BA.2.X (other) (rs = 0.491, p < 0.001). In contrast, parent lineages that were sporadically detected in both clinical cases and wastewater showed either no or a negative correlation, such as BF.7.X (rs = 0.045, p = 0.838), BA.4.6.X (rs = −0.040, p = 0.870), and recombinants (other) (rs = −0.456, p < 0.001) (Figure 4).
Throughout the study, there was a decrease in the weekly number of clinical cases sequenced due to changes in funding of clinical GS. From Quarter 3 (Q3) 2022 to Quarter 4 (Q4) 2023, a significant positive correlation was consistently observed between the proportions of parent lineages in clinical and wastewater samples. However, the correlation in Q4 2023 was comparatively lower (rs = 0.670, p < 0.001) (Table 2).

3.4. Initial Detection of Lineage Groups—Wastewater vs. Clinical

The initial detection dates for each parent lineage group were compared between clinical and wastewater samples. Sub-lineages including recombinants (other), BA.2.X, BA.4.X, BA.5, and BA.2.75.X were excluded from this comparison, as their primary parent lineage had been assigned a Pangolin designation more than a day prior to the commencement of the study. Among the analyzed parent lineages, 5 out of 10 were identified in wastewater prior to their detection in clinical samples. The range of this lead time varied, with the earliest being 65 days prior to clinical detection for BF.7.X and the latest being 52 days post-clinical detection for CH.1.1.X (Table 3).

4. Discussion

Our 18-month investigation established a strong positive correlation between average wastewater viral loads and PathWest clinical PCR positivity rates (rs = 0.772, p < 0.001). However, this correlation was weaker when compared to confirmed PCR case notifications (rs = 0.577, p < 0.001), which can be expected due to reporting bias and shifts in testing modality. This finding supports the globally recognized observation that SARS-CoV-2 concentrations in wastewater are indicative of the prevalence of clinical cases within the associated community [33] and reinforces the role of WBE as a complementary surveillance tool to clinical epidemiology in enhancing public health surveillance efforts, especially when clinical data may be limited.
As our study progressed, there was an increasing divergence between wastewater SARS-CoV-2 concentrations and PCR COVID-19 clinical case notifications, as illustrated in Figure 1B. The divergence can be primarily attributed to decreased COVID-19 clinical testing, with a notable shift from higher rates of PCR testing in Q3 2022 to the increased adoption of self-conducted RATs as the predominant testing modality throughout the remaining quarters [34]. This shift was contributed to by state- and workplace-led programs that offered free RATs [35], making them more accessible and affordable compared to PCR testing. The attenuation in PCR testing was further influenced by several factors, including the rescindment of testing mandates for clinical cases and close contacts, the closure of independent and free COVID-19 testing clinics (which reduced access to PCR testing centers) [36], and changes in community attitudes towards COVID-19, leading to decreased testing and reduced medical attendance for COVID-19 symptoms. Over the period of July 2022 to December 2023, the decrease in PCR testing and notification for COVID-19 highlights major limitations in traditional clinical surveillance systems in understanding the true community burden of disease, due to the factors discussed above. In the context of our study, WBE continued to provide a strong understanding of the population-wide burden of COVID-19 despite reduced PCR testing, demonstrating a significant benefit of WBE over traditional clinical surveillance systems in its representativeness and ability to provide additional surveillance information.
Our correlation between SARS-CoV-2 parent lineage proportions in wastewater and clinical cases over an 18-month period (rs = 0.728, p < 0.001) underscores the effectiveness of wastewater GS in accurately measuring the prevalence of Omicron and recombinant lineages within a community. By condensing lineages into their respective parent lineages, we navigated the challenges posed by identifying numerous low-frequency sub-lineages. This approach makes the data more accessible to audiences with limited genomic epidemiology expertise, facilitating a clearer understanding of virus dynamics in the population. Table 2 demonstrates a decreasing trend in the number of clinical samples undergoing GS from Q3 2022 to Q4 2023, primarily attributed to decreased funding towards the clinical WGS of PCR samples. The reduction in the clinical WGS of SARS-CoV-2 has also led to the reduced strength of the correlation between the lineages identified in clinical WGS and wastewater GS. As the denominator for clinical WGS (number of samples sequenced) reduces, the overall scale for comparison is also reduced. This means that smaller changes in the numerator (each individual clinical WGS result) have a greater and more pronounced effect on the overall frequency or proportion identified. This numerator–denominator bias does not affect the results from wastewater GS. This is because the wastewater GS results rely on the proportion of lineages identified in a sample, which is inherently representative of the population. The wastewater GS denominator encompasses all lineages identified in that specific sample, mitigating potential biases associated with variations in the sample size.
Despite efforts, challenges were encountered in accurately correlating wastewater data with clinical metrics for closely related sub-lineages within the same parent lineage, such as XBB.1.5, XBB.1.9, and XBB.1.16. These difficulties likely stem from a small number (<5) of single-nucleotide polymorphisms between these highly related sub-lineages. Additionally, reduced sequencing depth in important genomic regions and the limitations of short-read sequencing technologies may hinder bioinformatics tools’ ability to distinguish between these lineages at the read level. Long-read sequencing holds the potential to improve the differentiation between closely related sub-lineages due to its capacity to identify a greater number of mutations within a single read. However, the fragmentation of SARS-CoV-2 RNA in wastewater could impede the success of long-read sequencing.
The representative identification of SARS-CoV-2 lineages in wastewater provides a foundation for applying similar genomic techniques to characterize other pathogens present in wastewater, as has been recently demonstrated for polioviruses [15], RSV [37], and influenza [38]. This methodological approach not only reinforces the utility of WBE for SARS-CoV-2 surveillance but also underscores its potential for broader pathogen detection and characterization [39], offering a scalable and non-invasive tool for public health monitoring and response planning.
Our research highlights the potential of WBE to preemptively identify SARS-CoV-2 variants in the community, with wastewater surveillance occasionally detecting variants before clinical confirmation (Table 3). In WA, clinical PCR testing predominantly targets symptomatic individuals, with GS performed on a select group of these samples. Conversely, our wastewater surveillance sampling involved bi-weekly collections of two 24 h composite samples from three WWTPs, each representing the same weekly timeframe. This bi-weekly sampling schedule, while systematic, limits the timeliness of WBE as an early detection tool due to the frequency of data points. Enhancing wastewater sampling frequency or adopting continuous surveillance could markedly improve early variant detection capabilities.
In our correlation analyses, we aligned the week of sample collection for both clinical and wastewater specimens to ensure comparability. However, the inherent delay in laboratory analysis and results reporting presents a barrier to the immediate utility of WBE as an early warning system. Although samples are collected systematically, GS on both clinical and wastewater specimens was conducted weekly in WA, with wastewater GS results reported approximately seven days post-collection. Addressing these reporting delays is critical for maximizing WBE’s effectiveness as a proactive tool in public health surveillance. Reducing lag times, while being mindful of logistical and economic limitations, could significantly enhance public health response agility by offering timely insights into emergent trends, thereby optimizing early detection and intervention strategies for infectious diseases. Additional correlation analyses, incorporating reporting dates, are required to gain a clearer understanding of the utility of WBE as an early predictor in WA.
Despite the advantages of WBE, the importance of maintaining clinical sequencing alongside wastewater surveillance should not be overstated. Ultimately, WBE provides information at the population level. Clinical sequencing, however, offers insights into the clinical implications of new lineages [40], including their implications on disease severity, antiviral suitability, and vaccine efficacy [41]. Moreover, it allows confirmation of the presence and effects of specific sub-lineages in individual patients, a dimension beyond the scope of wastewater analysis. Clinical sequencing also validates and complements wastewater findings, ensuring a comprehensive understanding of the virus’s behavior and evolution. Thus, integrating both wastewater and clinical sequencing approaches is fundamental to a robust, holistic surveillance strategy in the context of COVID-19. The strong and significant correlations noted throughout this study indicate that the relative abundances of lineages in wastewater may continue to reflect community clinical trends, despite the evolving dynamics of clinical surveillance strategies.
The implementation of WBE provides significant benefits for public health monitoring, yet it faces numerous challenges. The accurate quantification of viral concentrations in wastewater is complicated by its heterogeneity and PCR inhibition from various compounds [42]. The interpretation of WBE data is further complicated by limitations in understanding pathogen fecal shedding kinetics and the critical role of sampling site and method selection in influencing the accuracy of epidemiological analyses [43]. Although external factors like stormwater ingress can dilute viral concentrations, necessitating normalization techniques for accurate measurement [43], such methods were not performed in this study. The reason for this omission is attributed to the moderate to strong positive correlation observed between clinical outcomes and WBE data throughout the study period, suggesting that, despite these challenges, WBE can still provide valuable insights into disease prevalence in WA. Moreover, the separation of stormwater and wastewater systems in WA minimizes the impact of rainfall on the wastewater analysis, though normalization markers like pepper mild mottle virus (ppMoV) could enhance quantification data interpretation by accounting for population dynamics and changes in water use.
Our study encountered specific challenges, notably during the week ending 19 February 2023, when all wastewater samples failed GS due to SARS-CoV-2 genome coverage below 60%, attributed to low SARS-CoV-2 wastewater concentrations. However, these instances were relatively rare, mitigated by our testing protocols designed for low viral concentrations in response to stringent border controls in WA [44] and the need to detect and characterize virus importation events [26]. Collaboration with the Australian WBE consortium (ColoSSoS, WaterRA) enabled the selection of a qPCR kit resistant to common wastewater inhibitors, enhancing the reliability of SARS-CoV-2 RNA quantification. This approach effectively addressed most challenges associated with WBE, demonstrating the critical dependency of GS efficacy on sufficient viral load and highlighting the importance of overcoming molecular assay inhibitors to generate reliable results.
Maximizing the effectiveness of WBE necessitates the facilitation of data exchange and integration between wastewater surveillance networks and healthcare systems. The ability to efficiently share data is vital for aligning WBE insights with clinical data. However, this process can be hindered by logistical and regulatory barriers, which may result in delays in data comparison and introduce gaps in the overall epidemiological understanding. Overcoming these data-sharing obstacles is essential for improving the precision and applicability of WBE in public health monitoring and intervention strategies. In WA, the presence of a well-established environmental microbiology unit within the state public health laboratory, PathWest, facilitated simple and rapid data exchange between the laboratory and state public health authorities. This arrangement helped to overcome numerous data-sharing challenges and regulatory constraints, attributable to the laboratory’s status as a government health service provider.
The proactive use of this WBE surveillance program by the WA Department of Health exemplifies a forward-thinking approach to pandemic and public health management. The department used wastewater data to facilitate a better understanding of COVID-19 prevalence and trends within the community, guiding public health decisions and strategies. The decision to make this data publicly accessible via an online dashboard [23], updated weekly, ensured the transparent communication of the latest trends to the public and the media. This initiative not only facilitated timely information dissemination but also enabled individuals to make informed personal risk assessments, contributing to a more informed public discourse during the pandemic. This strategy, blending advanced genomic surveillance with traditional epidemiological methods, significantly bolstered the overall response to COVID-19, fostering an environment of informed decision-making crucial for effectively managing a public health challenge of this scale.

5. Conclusions

Our study demonstrates the benefits of wastewater viral quantification and lineage determination in understanding community-wide trends of SARS-CoV-2. This approach, integrating total viral RNA concentration measurement with prevalent lineage identification, offers vital insights into the intensity and patterns of SARS-CoV-2 transmission waves and provides a window into genetic shifts and lineage predominance. These insights are invaluable for understanding the true burden of COVID-19 in the community and variant distribution, and ultimately aided in shaping informed public health responses throughout the pandemic and beyond. Our study demonstrates that wastewater surveillance reflects community-wide virus activity and serves as a timely and efficient tool for public health management, with the benefits of WBE having the potential to be applied to other communicable diseases.

Supplementary Materials

The following supporting information can be downloaded at https://www.mdpi.com/article/10.3390/environments11040062/s1, File S1—Table S1—Wastewater samples that underwent WGS, the associated SARS-CoV-2 genome coverage and date of Freyja bioinformatics processing. File S1—Table S2—Paired wastewater data including SARS-CoV-2 genome coverage and MS2 Ct value used for correlation. File S1—Table S3—Paired wastewater data including SARS-CoV-2 genome coverage and SARS-CoV-2 wastewater concentration used for correlation. File S1—Table S4—SARS-CoV-2 sub-lineages detected in wastewater and the associated parent lineage grouping File S1—Table S5—SARS-CoV-2 sub-lineages detected in clinical cases and the associated parent lineage grouping. File S2—Table S1—Weekly average SARS-CoV-2 wastewater concentrations, PathWest SARS-CoV-2 PCR Clinical PCR positivity and total metropolitan PCR-confirmed notifications. File S2—Table S2—Weekly average SARS-CoV-2 grouped lineage abundances in wastewater. File S2—Table S3—Weekly average SARS-CoV-2 grouped lineages abundances in clinical cases. File S2—Table S4—Number of samples used each week to calculate the average for SARS-CoV-2 concentration and grouped lineage abundances.

Author Contributions

Conceptualization, J.G., T.L. and A.L.; methodology and validation, J.G., T.L., D.R.K. and A.L.; bioinformatics software development and implementation, T.L. and D.R.K.; data provision, D.D.B., A.S., J.M., P.K. and P.A.; data analysis and visualization, J.G., D.D.B. and P.K.; writing—original draft preparation, J.G.; writing—review and editing, J.G., T.L., A.L., D.R.K., M.H., S.S., D.S., D.D.B., A.S., J.M., P.K. and P.A.; sample collection coordination, C.G.; supervision, A.L., S.S., M.H., D.S., C.G., J.M. and P.A.; project administration, A.L., S.S., M.H., D.S., C.G., J.M. and P.A. All authors have read and agreed to the published version of the manuscript.

Funding

This work was funded by the Western Australian Department of Health and PathWest Laboratory Medicine WA. This surveillance program received no external funding.

Data Availability Statement

The authors confirm that the data supporting the findings of this study are available within the article and its supplementary materials. Additional data that support the findings of this study are available from the corresponding author, JG, upon reasonable request and approval by the Western Australia Wastewater Advisory Committee.

Acknowledgments

We appreciate and thank all the extended staff involved with this work at WA Department of Health, PathWest Laboratory Medicine WA, and Water Corporation, including sample collectors, laboratory scientists and technicians and staff involved in administration and logistics.

Conflicts of Interest

The authors declare no conflict of interest.

References

  1. World Health Organization. Environmental Surveillance for SARS-CoV-2 to Complement Other Public Health Surveillance; WHO: Geneva, Switzerland, 2023. [Google Scholar]
  2. Galanti, M.; Comito, D.; Ligon, C.; Lane, B.; Matienzo, N.; Ibrahim, S.; Shittu, A.; Tagne, E.; Birger, R.; Ud-Dean, M.; et al. Active surveillance documents rates of clinical care seeking due to respiratory illness. Influenza Other Respir. Viruses 2020, 14, 499–506. [Google Scholar] [CrossRef]
  3. Bonačić Marinović, A.; Swaan, C.; van Steenbergen, J.; Kretzschmar, M. Quantifying reporting timeliness to improve outbreak control. Emerg. Infect. Dis. 2015, 21, 209–216. [Google Scholar] [CrossRef]
  4. Kretzschmar, M.E.; Rozhnova, G.; Bootsma, M.C.J.; van Boven, M.; van de Wijgert, J.H.H.M.; Bonten, M.J.M. Impact of delays on effectiveness of contact tracing strategies for COVID-19: A modelling study. Lancet Public Health 2020, 5, e452–e459. [Google Scholar] [CrossRef] [PubMed]
  5. Australian Government COVID-19 Rapid Antigen Tests: Guidance on Performance Requirements and Risk Mitigation Strategies; Version 3.0; Department of Health and Aged Care—Therapeutic Goods Administration: Canberra, Australia, 2023.
  6. Lodder, W.; de Roda Husman, A.M. SARS-CoV-2 in wastewater: Potential health risk, but also data source. Lancet Gastroenterol. Hepatol. 2020, 5, 533–534. [Google Scholar] [CrossRef] [PubMed]
  7. Feng, S.; Roguet, A.; McClary-Gutierrez, J.S.; Newton, R.J.; Kloczko, N.; Meiman, J.G.; McLellan, S.L. Evaluation of Sampling, Analysis, and Normalization Methods for SARS-CoV-2 Concentrations in Wastewater to Assess COVID-19 Burdens in Wisconsin Communities. ACS EST Water 2021, 1, 1955–1965. [Google Scholar] [CrossRef]
  8. Weidhaas, J.; Aanderud, Z.T.; Roper, D.K.; VanDerslice, J.; Gaddis, E.B.; Ostermiller, J.; Hoffman, K.; Jamal, R.; Heck, P.; Zhang, Y.; et al. Correlation of SARS-CoV-2 RNA in wastewater with COVID-19 disease burden in sewersheds. Sci. Total Environ. 2021, 775, 145790. [Google Scholar] [CrossRef] [PubMed]
  9. Bagutti, C.; Alt Hug, M.; Heim, P.; Maurer Pekerman, L.; Ilg Hampe, E.; Hübner, P.; Fuchs, S.; Savic, M.; Stadler, T.; Topolsky, I.; et al. Wastewater monitoring of SARS-CoV-2 shows high correlation with COVID-19 case numbers and allowed early detection of the first confirmed B.1.1.529 infection in Switzerland: Results of an observational surveillance study. Swiss Med. Wkly. 2022, 152, w30202. [Google Scholar] [CrossRef]
  10. Boehm, A.B.; Hughes, B.; Duong, D.; Chan-Herur, V.; Buchman, A.; Wolfe, M.K.; White, B.J. Wastewater concentrations of human influenza, metapneumovirus, parainfluenza, respiratory syncytial virus, rhinovirus, and seasonal coronavirus nucleic-acids during the COVID-19 pandemic: A surveillance study. Lancet Microbe 2023, 4, e340–e348. [Google Scholar] [CrossRef] [PubMed]
  11. Hughes, B.; Duong, D.; White, B.J.; Wigginton, K.R.; Chan, E.M.G.; Wolfe, M.K.; Boehm, A.B. Respiratory Syncytial Virus (RSV) RNA in Wastewater Settled Solids Reflects RSV Clinical Positivity Rates. Environ. Sci. Technol. Lett. 2022, 9, 173–178. [Google Scholar] [CrossRef]
  12. de Melo, T.; Islam, G.; Simmons, D.B.D.; Desaulniers, J.P.; Kirkwood, A.E. An alternative method for monitoring and interpreting influenza A in communities using wastewater surveillance. Front. Public Health 2023, 11, 1141136. [Google Scholar] [CrossRef]
  13. Assoum, M.; Lau, C.L.; Thai, P.K.; Ahmed, W.; Mueller, J.F.; Thomas, K.V.; Choi, P.M.; Jackson, G.; Selvey, L.A. Wastewater Surveillance Can Function as an Early Warning System for COVID-19 in Low-Incidence Settings. Trop. Med. Infect. Dis. 2023, 8, 211. [Google Scholar] [CrossRef]
  14. Li, X.; Liu, H.; Gao, L.; Sherchan, S.P.; Zhou, T.; Khan, S.J.; van Loosdrecht, M.C.M.; Wang, Q. Wastewater-based epidemiology predicts COVID-19-induced weekly new hospital admissions in over 150 USA counties. Nat. Commun. 2023, 14, 4548. [Google Scholar] [CrossRef]
  15. Shaw, A.G.; Mampuela, T.K.; Lofiko, E.L.; Pratt, C.; Troman, C.; Bujaki, E.; O’Toole, Á.; Akello, J.O.; Aziza, A.A.; Lusamaki, E.K.; et al. Sensitive poliovirus detection using nested PCR and nanopore sequencing: A prospective validation study. Nat. Microbiol. 2023, 8, 1634–1640. [Google Scholar] [CrossRef]
  16. Karthikeyan, S.; Levy, J.I.; De Hoff, P.; Humphrey, G.; Birmingham, A.; Jepsen, K.; Farmer, S.; Tubb, H.M.; Valles, T.; Tribelhorn, C.E.; et al. Wastewater sequencing reveals early cryptic SARS-CoV-2 variant transmission. Nature 2022, 609, 101–108. [Google Scholar] [CrossRef] [PubMed]
  17. Gupta, P.; Liao, S.; Ezekiel, M.; Novak, N.; Rossi, A.; LaCross, N.; Oakeson, K.; Rohrwasser, A. Wastewater Genomic Surveillance Captures Early Detection of Omicron in Utah. Microbiol. Spectr. 2023, 11, e0039123. [Google Scholar] [CrossRef] [PubMed]
  18. Yousif, M.; Rachida, S.; Taukobong, S.; Ndlovu, N.; Iwu-Jaja, C.; Howard, W.; Moonsamy, S.; Mhlambi, N.; Gwala, S.; Levy, J.I.; et al. SARS-CoV-2 genomic surveillance in wastewater as a model for monitoring evolution of endemic viruses. Nat. Commun. 2023, 14, 6325. [Google Scholar] [CrossRef]
  19. Li, L.; Uppal, T.; Hartley, P.D.; Gorzalski, A.; Pandori, M.; Picker, M.A.; Verma, S.C.; Pagilla, K. Detecting SARS-CoV-2 variants in wastewater and their correlation with circulating variants in the communities. Sci. Rep. 2022, 12, 16141. [Google Scholar] [CrossRef]
  20. Kaya, D.; Falender, R.; Radniecki, T.; Geniza, M.; Cieslak, P.; Kelly, C.; Lininger, N.; Sutton, M. Correlation between Clinical and Wastewater SARS-CoV-2 Genomic Surveillance, Oregon, USA. Emerg. Infect. Dis. 2022, 28, 1906–1908. [Google Scholar] [CrossRef] [PubMed]
  21. Norwegian Institute of Public Health. Weekly Reports on COVID-19, Inflenza and Other Respiratory Viruses. Available online: https://www.fhi.no/publ/statusrapporter/luftveisinfeksjoner/ (accessed on 25 February 2024).
  22. Centre for Disease Control & Prevention USA. COVID-19 Variants in Wastewater. Available online: https://www.cdc.gov/nwss/rv/COVID19-variants.html (accessed on 26 February 2024).
  23. COVID-19 Wastewater Surveillance [Internet]. 2024. Available online: https://www.health.wa.gov.au/articles/a_e/coronavirus/covid19-wastewater-surveillance (accessed on 25 February 2024).
  24. Rajput, V.; Pramanik, R.; Malik, V.; Yadav, R.; Samson, R.; Kadam, P.; Bhalerao, U.; Tupekar, M.; Deshpande, D.; Shah, P.; et al. Genomic surveillance reveals early detection and transition of delta to omicron lineages of SARS-CoV-2 variants in wastewater treatment plants of Pune, India. Environ. Sci. Pollut. Res. 2023, 30, 118976–118988. [Google Scholar] [CrossRef]
  25. Australian Bureau of Statistics. Greater Perth, 2021 Census All Persons QuickStats; 2021. Available online: https://abs.gov.au/census/find-census-data/quickstats/2021/5GPER (accessed on 25 February 2024).
  26. Levy, A.; Gazeley, J.; Lee, T.; Jardine, A.; Gordon, C.; Cooper, N.; Theobald, R.; Huppatz, C.; Sjollema, S.; Hodge, M.; et al. Whole genome sequencing of SARS-CoV-2 from wastewater links to individual cases in catchments. Sci. Total Environ. 2022, 851, 158266. [Google Scholar] [CrossRef]
  27. Water Research Australia. ColoSSoS|Method Evaluation and Optimisation: Investigation of PCR-Based Methods and Feasibility Study for Whole-Genome Sequencing. 2021. Available online: https://www.waterra.com.au/project/colossos-method-evaluation-and-optimisation-investigation-of-pcr-based-methods-and-feasibility-study-for-whole-genome-sequencing/ (accessed on 18 March 2024).
  28. Suo, T.; Liu, X.; Feng, J.; Guo, M.; Hu, W.; Guo, D.; Ullah, H.; Yang, Y.; Zhang, Q.; Wang, X.; et al. ddPCR: A more accurate tool for SARS-CoV-2 detection in low viral load specimens. Emerg. Microbes Infect. 2020, 9, 1259–1268. [Google Scholar] [CrossRef] [PubMed]
  29. Rambaut, A.; Holmes, E.C.; O’Toole, Á.; Hill, V.; McCrone, J.T.; Ruis, C.; du Plessis, L.; Pybus, O.G. A dynamic nomenclature proposal for SARS-CoV-2 lineages to assist genomic epidemiology. Nat. Microbiol. 2020, 5, 1403–1407. [Google Scholar] [CrossRef] [PubMed]
  30. Government of Western Australia. Public Health Act; 2016. Available online: https://www.legislation.wa.gov.au/legislation/statutes.nsf/main_mrtitle_13791_homepage.html (accessed on 25 February 2024).
  31. Government of Western Australia. Emergency Management Act; 2005. Available online: https://www.legislation.wa.gov.au/legislation/statutes.nsf/main_mrtitle_294_homepage.html (accessed on 25 February 2024).
  32. Cohen, J. Statistical Power Analysis for the Behavioral Sciences; Elsevier Science: Amsterdam, The Netherlands, 2013. [Google Scholar]
  33. Shah, S.; Gwee, S.X.W.; Ng, J.Q.X.; Lau, N.; Koh, J.; Pang, J. Wastewater surveillance to infer COVID-19 transmission: A systematic review. Sci. Total Environ. 2022, 804, 150060. [Google Scholar] [CrossRef]
  34. Government of Western Australia—Department of Health. COVID-19 Weekly Surveillance Report 1–7 January 2024. Available online: https://www.health.wa.gov.au/Articles/F_I/Infectious-disease-data/COVID19-Weekly-Surveillance-Report (accessed on 25 February 2024).
  35. Department of Health—Government of Western Australia. Free RAT Program Ends. Available online: https://www.healthywa.wa.gov.au/News/2023/Free-RAT-program-ends (accessed on 25 February 2024).
  36. Government of Western Australia. Announcements—Western Australian Government News Stories, Media Releases and Community Updates. Available online: https://www.wa.gov.au/government/announcements (accessed on 25 February 2024).
  37. Allen, D.M.; Reyne, M.I.; Allingham, P.; Levickas, A.; Bell, S.H.; Lock, J.; Coey, J.D.; Carson, S.; Lee, A.J.; McSparron, C.; et al. Genomic Analysis and Surveillance of Respiratory Syncytial Virus (RSV) Using Wastewater-Based Epidemiology (WBE). medRxiv 2023, 2023, 23293016. [Google Scholar] [CrossRef]
  38. Vo, V.; Harrington, A.; Chang, C.L.; Baker, H.; Moshi, M.A.; Ghani, N.; Itorralba, J.Y.; Tillett, R.L.; Dahlmann, E.; Basazinew, N.; et al. Identification and genome sequencing of an influenza H3N2 variant in wastewater from elementary schools during a surge of influenza A cases in Las Vegas, Nevada. Sci. Total Environ. 2023, 872, 162058. [Google Scholar] [CrossRef]
  39. Tisza, M.; Javornik Cregeen, S.; Avadhanula, V.; Zhang, P.; Ayvaz, T.; Feliz, K.; Hoffman, K.L.; Clark, J.R.; Terwilliger, A.; Ross, M.C.; et al. Wastewater sequencing reveals community and variant dynamics of the collective human virome. Nat. Commun. 2023, 14, 6878. [Google Scholar] [CrossRef] [PubMed]
  40. Berno, G.; Fabeni, L.; Matusali, G.; Gruber, C.E.M.; Rueca, M.; Giombini, E.; Garbuglia, A.R. SARS-CoV-2 Variants Identification: Overview of Molecular Existing Methods. Pathogens 2022, 11, 1058. [Google Scholar] [CrossRef]
  41. Goswami, C.; Sheldon, M.; Bixby, C.; Keddache, M.; Bogdanowicz, A.; Wang, Y.; Schultz, J.; McDevitt, J.; LaPorta, J.; Kwon, E.; et al. Identification of SARS-CoV-2 variants using viral sequencing for the Centers for Disease Control and Prevention genomic surveillance program. BMC Infect. Dis. 2022, 22, 404. [Google Scholar] [CrossRef]
  42. Mao, K.; Zhang, K.; Du, W.; Ali, W.; Feng, X.; Zhang, H. The potential of wastewater-based epidemiology as surveillance and early warning of infectious disease outbreaks. Curr. Opin. Environ. Sci. Health 2020, 17, 1–7. [Google Scholar] [CrossRef]
  43. Kumblathan, T.; Liu, Y.; Uppal, G.K.; Hrudey, S.E.; Li, X.F. Wastewater-Based Epidemiology for Community Monitoring of SARS-CoV-2: Progress and Challenges. ACS Environ. 2021, 1, 18–31. [Google Scholar] [CrossRef]
  44. Government of Western Australia. Review of Western Australia’s COVID-19 Management and Response—July 2023; 2023. Available online: https://www.wa.gov.au/organisation/department-of-the-premier-and-cabinet/review-of-was-covid-19-management-and-response (accessed on 25 February 2024).
Figure 1. Assessment of SARS-CoV-2 trends in metropolitan Perth wastewater. (A) Comparative view of the weekly average SARS-CoV-2 concentrations in wastewater (black) against the PathWest clinical positivity rate per week (purple). (B) Comparative view of the weekly average SARS-CoV-2 concentrations in wastewater (black) against weekly PCR-confirmed metropolitan notifications of SARS-CoV-2 (red).
Environments 11 00062 g001
Figure 2. Weekly proportion of SARS-CoV-2 parent lineages in metropolitan Perth, WA—July 2022 to December 2023. Clinical cases (top) compared to weekly metropolitan wastewater relative abundance bottom (bottom). The X following the lineage name indicates the inclusion of all corresponding sub-lineages unless otherwise separated (e.g., BA.2.75.X is not inclusive of CH.1.1.X).
Environments 11 00062 g002
Figure 3. Scatter plot of the combined weekly proportion of SARS-CoV-2 parent lineages in metropolitan Perth, WA wastewater (y-axis) and clinical cases (x-axis). Data that are not paired were excluded (i.e., weeks where clinical data are available and wastewater data are not). Dashed line indicates the line of best fit.
Environments 11 00062 g003
Figure 4. Scatter plots of the combined weekly proportion of SARS-CoV-2 parent lineages in metropolitan Perth, WA wastewater (y-axis) and clinical cases (x-axis). Data that are not paired were excluded (i.e., weeks where clinical data are available, and wastewater data are not). Dashed line indicates the line of best fit.
Environments 11 00062 g004
Table 1. Primer and probe sequences for SARS-CoV-2 nucleocapsid and ORF1ab targets within the PerkinElmer SARS-CoV-2 Real-time RT-PCR assay as determined by Water Research Australia [27] and described by Suo at al., 2020 [28]. Due to the proprietary nature of the kit, information regarding probe quenchers and detailed sequences for the IPC-targeting primers and probes is not disclosed.
Target [Fluorophore]TypeNucleotide Sequence (5′ to 3′)
Nucleocapsid [FAM]Forward PrimerGGGGAACTTCTCCTGCTAGAAT
Reverse PrimerCAGACATTTTGCTCTCAAGCTG
ProbeTTGCTGCTGCTTGACAGATT
ORF1ab [ROX]Forward PrimerCCCTGTGGGTTTTACACTTAA
Reverse PrimerACGATTGTGCATCAGCTGA
ProbeCCGTCTGCGGTATGTGGAAAGGTTATGG
Table 2. The number of clinical SARS-CoV-2 sequences that were assigned a lineage and the number of wastewater samples successfully sequenced (genome coverage >60%). The associated Spearman correlation rank (rs) and statistical significance (p) between clinical and wastewater proportions of all parent lineages from the week ending in Q3 2022 to Q4 2023.
Quarter-YearNumber of Clinical Cases SequencedNumber of Wastewater Samples Sequencedrsp
Q3 20221411430.806<0.001
Q4 20221737390.747<0.001
Q1 20231613260.773<0.001
Q2 20231736380.703<0.001
Q3 2023708360.771<0.001
Q4 2023210400.670<0.001
Table 3. Earliest collection date of positive samples for select parent lineage groups between wastewater and clinical specimen types.
LineagePangolin Designation DateWastewater
(Earliest Date of Collection)
Clinical
(Earliest Date of Collection)
Difference
(Number of Days)
BA.4.6.X03/07/202205/07/202215/08/2022−41
BF.7.X16/07/202219/07/202222/09/2022−65
BQ.1.X03/09/202229/09/202225/09/2022+4
XBB.X (Other)18/09/202206/10/202230/09/2022+6
XBC.X25/09/202213/10/202213/10/20220
CH.1.1.X12/10/202221/12/202230/10/2022+52
XBF.X04/11/202217/11/202201/12/2022−14
JN.1.X13/01/202319/10/202312/11/2023−24
EG.5.X23/04/202320/04/202316/05/2023−26
BA.2.86.X17/08/202312/10/202322/08/2023+51
Disclaimer/Publisher’s Note: The statements, opinions and data contained in all publications are solely those of the individual author(s) and contributor(s) and not of MDPI and/or the editor(s). MDPI and/or the editor(s) disclaim responsibility for any injury to people or property resulting from any ideas, methods, instructions or products referred to in the content.

