Innovation’s Performance: A Transnational Analysis Based on the Global Innovation Index


1
Department of Economics, Management, Industrial Engineering and Tourism, Campus Universitário de Santiago, University of Aveiro, 3810-193 Aveiro, Portugal
2
Research Unit on Governance, Competitiveness and Public Policies, Campus Universitário de Santiago, University of Aveiro, 3810-193 Aveiro, Portugal
3
INESC TEC—Institute for Systems and Computer Engineering, Technology and Science, 4200-465 Porto, Portugal
*
Author to whom correspondence should be addressed.
Adm. Sci. 2024, 14(2), 32; https://doi.org/10.3390/admsci14020032
Submission received: 20 December 2023
/
Revised: 30 January 2024
/
Accepted: 9 February 2024
/
Published: 16 February 2024
(This article belongs to the Special Issue The Evolutionary Path of Performance Measurement and Management in Light of Global Challenges)
Abstract
:The pandemic marked the beginning of a succession of events on a global scale (not the least of which is a greater concern for the environment and for quality of life/distance work) with a major impact on the economy. Innovation plays a key role in meeting the challenges of the future, but despite investment in innovation, global economic growth has fallen short of the expected performance. The aim of this study is to identify the factors with the greatest impact on the performance of innovation ecosystems based on the performance of the innovation ecosystems of 64 countries assessed by the Global Innovation Index 2022. The methodology consists of multiple hierarchical linear regressions, in which the impact factors on innovation ecosystems, measured through indicators, are the independent variables and innovation performance, in knowledge and technology and in creativity, are the dependent variables in an iterative process, using STATA/MP 18.0 data analysis software. The results indicate that human capital and research (the basis of business and innovative products aimed at filling gaps in the market are people with a good higher education, which is also linked to local university rankings) and business sophistication (highly qualified work, leveraging strategic partnerships, and with knowledge absorption capacity) are the main pillars determining innovation performance at a global level. Education (an educated workforce is of growing importance in the knowledge era), R&D investment (including support from the state in the form of tax incentives for whoever invests in R&D), innovation partnerships (for a faster, more open innovation effort), ecological sustainability (a new reinforced priority after COVID-19) and knowledge absorption (to absorb one must first detain valuable knowledge in the area) are the variables with the greatest impact on innovation performance. The work provides guidance on which areas should be prioritized in the development of policies and strategies to accelerate innovation in countries. The study is limited by the time frame and reveals, by comparison with pre-pandemic studies, that the determinants of innovation can be dynamic, varying according to the countries and, consequently, the global context of the analysis.
1. Introduction
In recent years, the world has faced several challenges that have put the resilience of the economy and societies to the test. The pandemic (Serban 2022; Sharma et al. 2022), escalating inflation (Manpower Group 2022, 2023), the war in Europe, and the conflict in the Middle East have added to environmental and socio-economic challenges, as new geopolitics (WIPO 2022) emerge, in addition to the fear of superhuman artificial intelligence. As in the past, innovation is considered a key element in meeting the challenges of the future; innovation has helped to improve productivity, which has increased economic output, which, in turn, has improved the socio-economic level of populations (WIPO 2022). In recent decades, there has been an unprecedented global investment in innovation by both the public and private sectors (WIPO 2022), but supporting innovation remains the main challenge for governments and managers, while the very concept of innovation is evolving from the business perspective to the regional, national, or global perspective (micro, meso, macro), increasingly becoming an area of research (Bielińska-Dusza and Hamerska 2021; Andrijauskiene et al. 2021; Akhmadi and Tsakalerou 2023; Bate et al. 2023).
Global demand for new products is high and growing exponentially as knowledge-based economies (unlike traditional economies) generate more income and employment (Powell and Snellman 2004; Hadad 2017; Bielińska-Dusza and Hamerska 2021). The competitiveness of economies increasingly depends on their ability to produce and use knowledge, and the importance of this has increased post-pandemic (Q. Wang et al. 2021; Serban 2022; Mohamed et al. 2022; Marule 2022; Xie et al. 2023). On the other hand, it is important to note that innovations depend to a large extent on a suitable market environment (i.e., one conducive to innovation) and that improving a country’s capacity for innovation improves companies’ capacity for innovation. The creation of an innovative environment can be linked to legal provisions, financial support, support for processes and products, foreign investment, and support for specific sectors with greater capacity for innovation and can also involve strategic and operational decisions in the field of commercial activity, such as international cooperation initiatives. It is, therefore, extremely important to have information that allows decision-makers to make informed decisions supported by the evaluation and measurement of existing activities in the field of innovation (broadly understood). It is, therefore, essential to understand which factors most influence innovation performance, with the aim of directing policies and investment towards the areas with the greatest impact on results.
One of the ways of assessing innovation performance is to use statistical and mathematical methods based on indices, indicators, and performance measures, with their own methodology, reported in reports distributed by various institutions worldwide. The Global Innovation Index (GII) published by the World Intellectual Property Organization reports the results of assessing the performance of 132 innovation ecosystems worldwide and is one of the most widely used tools in innovation research from a global perspective (Bielińska-Dusza and Hamerska 2021; Bate et al. 2023). The methodology involves a set of indicators that make it possible to assess the position of each country in terms of innovation (WIPO 2022). The GII considers that the innovation ecosystem is based on five pillars: institutions (Do they work, e.g., the judicial system; can it be trusted institutions and their good functioning are the pillars of progress and advancement towards a more modern society? Also, what effect does culture have on the conducting of business—namely, are meritocracy and efficiency relevant factors?), human capital and research (how qualified for research is the human capital? To what search/research tools and databases does the human capital have access, and are they taught these in higher education, even if only at the doctoral level?), infrastructure (including roads, railways, and ports, for example, and their state of digitalization, also for sustainability purposes; what information and communication technology suites and platforms do firms use?), market sophistication (how interconnected, or independent, are rival firms? How informed and organized is the consumer? How well do banks and credit lines function, and are the terms (credit rates) offered realistic and accessible?), and business sophistication (How good is intellectual property protection? Are patents duly enforced? How is knowledge absorbed by firms? Do they have that capacity?), which are considered inputs. Those ecosystems have two outputs: knowledge and technology, as well as creativity.
This paper aims to identify the pillars (inputs) of innovation that have the greatest impact on the performance of innovation ecosystems, considering the performance (outputs) of innovation ecosystems in 64 countries. The analysis was carried out using hierarchical multiple linear regression, using STATA data analysis software. The conclusions of the study are in line with the work of other authors (Bate et al. 2023) and contribute to the knowledge of the main factors impacting innovation, providing clues to entrepreneurs, government officials, the scientific community, and civil society on the priority areas for action with a view to improving innovation performance.
Hence, the main research questions of the study are as follows: What does innovation performance depend on? Additionally, despite investment in innovation, why has global economic growth fallen short of the expected performance output level?
2. Literature Review and Hypothesis Development
The determinants of the performance of countries’ innovation ecosystems are innovation policies, knowledge and skills, research and development (R&D) investment policies, intellectual property, trade and openness to the outside world, knowledge sharing and market information, legal and regulatory issues, and access to infrastructure (Queirós et al. 2019; Andrijauskiene et al. 2021; Bielińska-Dusza and Hamerska 2021; Papa et al. 2022; Bate et al. 2023). According to the methodology used by the GII (WIPO 2022), the determinants of innovation are grouped under five pillars: institutions, human capital and research, infrastructure, market sophistication, and business sophistication, which are considered inputs to the innovation ecosystem. The methodology used by the GII considers two outputs of the ecosystem: the results of knowledge and technology and the results of creativity. The following paragraphs address the impact of each of these pillars on innovation performance based on the existing scientific literature.
2.1. Institutions
In the institutions pillar, the GII considers the indicators political environment, regulatory environment, and business environment, measured through sub-indicators based on information collected in the various countries. Political and government stability, the quality of laws, incentives for entrepreneurship, and culture are among the aspects considered (WIPO 2022). Institutions can be formal or informal (Minto-Coy and McNaughton 2016; Okrah and Hajduk-Stelmachowicz 2020; Akhmadi and Tsakalerou 2023; Bate et al. 2023); property rights, contracts, policies, regulations, laws, and constitutions are formal institutions, while culture and social norms are informal institutions (Minto-Coy and McNaughton 2016; Bate et al. 2023). Low belief in a country’s institutions deteriorates the trust of investors, customers, and companies (Jovovic et al. 2017; Szalacha-Jarmużek and Pietrowicz 2018; WIPO 2022; Bate et al. 2023; Klett and Cozzi 2023). Trust in political systems encourages innovation, and a solid legal and regulatory framework fosters growth and the ability of companies to innovate (Nyarku and Oduro 2018); the same is true of government support and the protection of intellectual property by legal institutions (C. Wang et al. 2020; L. Wang et al. 2020). Reinforcing the role of institutions in innovation and economic performance, Castaño-Martínez et al. (2015) revealed that the difficulty experienced by entrepreneurs in setting up new companies due to complex administrative procedures negatively affects the growth of the economy and, consequently, societies with complex legal systems and difficult access to credit have a lower level of economic performance. The culture of countries influences organizational culture, which, in turn, is closely related to knowledge management. In companies with a high level of mutual trust, collaboration and learning and knowledge exchange activities (creation, storage, and transfer) are more likely to occur frequently and effectively (Lam et al. 2021). Similarly, the establishment of a collaborative network with external partners, essential for benefiting from the experience and knowledge of others, is influenced by organizational culture. Since organizational sustainability is increasingly linked to the ability to manage new knowledge and ideas and transform them into new business value (Pereira et al. 2021; Scaliza et al. 2022), the role of culture is central to the growth of companies. In this context, the first research hypothesis is formulated:
H1.
There is a positive and statistically significant relationship between institutions and innovation performance.
2.2. Human Capital and Research
In the human capital and research pillar, the GII considers indicators relating to education, tertiary education, and research and development. Investment in education, the length of schooling, science and engineering graduates, the mobility of people with higher education, investment in research and development, and university rankings are among the aspects considered (WIPO 2022). Investment in human capital by policymakers has positive effects on business innovation, and countries that invest more in human capital achieve greater business culture and economic performance (Castaño-Martínez et al. 2015; Nunes et al. 2019; CastroSilva and Lima 2023). Human capital is an essential determinant of innovation since education improves capacities for the creation, dissemination, and sharing of knowledge (You et al. 2021; Bate et al. 2023; Coutinho and Au-Yong-Oliveira 2023), and the lack of highly qualified resources limits the absorption of knowledge (CastroSilva and Lima 2023). The availability of skilled labor in a certain territory increases opportunities for knowledge exchange, which may have been created in the region or elsewhere (Nunes et al. 2019). The study by C. Wang et al. (2020) and L. Wang et al. (2020) reveal that human capital and R&D are essential factors that explain innovation, particularly technological innovation in advanced economies. In this context, the second research hypothesis is drawn up:
H2.
There is a positive and statistically significant relationship between human capital and research and innovation performance.
2.3. Infrastructure
In the infrastructure pillar, the GII considers indicators relating to information and communication technologies, general infrastructure, and ecological sustainability. The access to and use of ICT, participation in networks and certification, and environmental performance are among the aspects considered (WIPO 2022). Information and communication technology infrastructures and digital technologies facilitate the storage, dissemination, and exchange of information, making knowledge more accessible, and highly innovative SMEs are distinguished from those that are not very innovative in terms of knowledge and information technology infrastructures (Popa et al. 2022). Innovation-oriented companies are more likely to use new methodologies and technologies (Dobni and Klassen 2021; Wilson and Dobni 2022; Wilson et al. 2023). A high level of innovation and technological complexity is often associated with dynamic economic development, which allows companies to achieve better financial results and strengthen their competitive advantage (Nawrocki and Jonek-Kowalska 2022). The work by Wilson et al. (2023) explores the relationship between companies’ orientation towards innovation and performance in a global context; identifies crowdsourcing, design thinking, open innovation, stage-gate systems, big data analytics, innovation management software, innovation measurements, scientific research and prototyping as common practices of innovators with a high orientation; and shows that the dimensions of this orientation are consistent with company performance, although there are differences in this agreement between countries in different regions of the world. In fact, countries with greater environmental awareness, fewer restrictions on foreign investment, and greater business sophistication provide the perfect setting for the establishment of large companies with a strong innovative profile (Puertas et al. 2022). In this context, the third research hypothesis is drawn up:
H3.
There is a positive and statistically significant relationship between infrastructure and innovation performance.
2.4. Market Sophistication
In the market sophistication pillar, the GII considers the availability of credit lines to support innovation in companies; the formation of start-ups or scale-ups; investment in companies; and access to international markets, diversification, and market size, including competition and the protection of small companies (WIPO 2022). The study by Akhmadi and Tsakalerou (2023) revealed that most of the companies studied consider the main barriers to innovation to be the very high costs of innovation and the lack of investment on the part of companies. Difficulties in obtaining state support and high competition in the target market are considered relevant factors, as are the lack of skilled workers and the lack of partnerships. When examining the relative importance of barriers to innovation and, consequently, economic growth, company size is the most significant variable (Akhmadi and Tsakalerou 2023). Compared to large companies, SMEs can be more agile and flexible in response to changes in the markets. However, they face more difficulties in turning innovation into new businesses, as they usually have limited financial, human, and technological resources compared to large companies (Queirós et al. 2019; Nunes et al. 2019). The lack of specialized knowledge to navigate the processes of commercializing innovation can create additional obstacles for SMEs, namely, greater difficulty in obtaining market research, protecting intellectual property, and developing products and marketing strategies; greater difficulty in accessing markets and establishing brand presence; more limited distribution channels and competition from larger, established operators; greater risk aversion due to limited resources and the potential impact of failure; and limited access to strategic partnerships and regulatory and legal obstacles in target markets. The study by Wellalage and Fernandez (2019) on innovation and SME financing in developing countries revealed a positive relationship between financing (formal and informal) and a company’s capacity for innovation (product and process). In this context, the fourth research hypothesis is formulated:
H4.
There is a positive and statistically significant relationship between market sophistication and innovation performance.
2.5. Business Sophistication
In the business sophistication pillar, the GII considers indicators relating to highly qualified work, strategic partnerships, and knowledge absorption. Highly qualified employment, strategic alliances and patents, intellectual property, and high-tech imports are among the aspects considered (WIPO 2022). According to Kirikkaleli and Ozun (2019), business sophistication is based on the quality of the country’s business networks and the strategies and operations practiced by individual players and, along with innovation, are essential components of competitiveness. Organizations with a high innovation orientation engage in value-creation strategies such as market segmentation, developing new products/services for new markets, and customizing products or services. Organizations with a low innovation orientation generally practice less aggressive strategies focused on internal competencies, underestimating strategies based on cooperation, partnerships, and alliances (Dobni 2010). The creation, dissemination, and sharing of knowledge as well as the free access to information, collaboration, and knowledge transfer between different players, such as universities, research institutions, companies, and individuals, are drivers of innovation and productivity and translate into economic results and competitive advantages for companies (Tubbs 2007; Costa et al. 2021; Boiko 2022; Scaliza et al. 2022). The protection of intellectual property rights is crucial to ensure that creators and inventors benefit from their ideas and creations; patents, copyrights, and trademarks safeguard the value of knowledge. Networking with multiple organizations is a performance enhancer, promoting access to a wider range of knowledge, which increases the likelihood of finding specific resources capable of responding to internal needs (Nunes et al. 2019; Wilson and Dobni 2022; Wilson et al. 2023). Networks are the organizational support that allows economic agents to exploit new business opportunities through joint efforts, resources, and skills (Nunes et al. 2019; Öber 2019; Costa et al. 2021; Ferreira et al. 2021; Scaliza et al. 2022; Costa and Moreira 2022; Coutinho and Au-Yong-Oliveira 2023). Entrepreneurs with larger and more diversified networks tend to be more successful than those with smaller networks (Nunes et al. 2019). In this context, the fifth and final research hypothesis is formulated:
H5.
There is a positive and statistically significant relationship between business sophistication and innovation performance.
3. Methodology
The quantitative, cross-sectional study consists of the statistical analysis of data on the performance of innovation ecosystems in 64 countries using the 2022 Global Innovation Index, which assesses the performance of innovation ecosystems in 132 countries (48.5% of 132). The selection of countries covered various regions of the world, various levels of GDP per capita, and the fact that complete data existed for all the parameters under analysis for each of the selected countries (Appendix A), which led to the exclusion of several countries, particularly in less developed regions of the world.
For the purposes of this work, the terms defined in the Oslo Manual (OECD/Eurostat 2018) are used. The concept of innovation is defined as a new or improved product or process (or combination thereof) that differs significantly from the unit’s previous products or processes and which was made available to potential users (product) or put into use by the unit (process). Factors influencing innovation performance (innovation barriers and drivers) are defined as internal or external factors that hinder or encourage innovation efforts. Innovation indicators are defined as a statistical measure of an innovation phenomenon (activity, product, expenditure, etc.) observed in a population or a sample thereof at a given time or place. Indicators are usually corrected (or normalized) to allow comparisons between units that differ in size or other characteristics.
Hierarchical regression is used to demonstrate whether certain independent variables have a statistically significant impact on the dependent variable. In this methodology, several regression models are created by iteratively adding variables to a previous model, with the aim of determining whether the newly added variables have a significant increase in R2 (the proportion of the variance of the dependent variable explained by the model). This method is considered suitable for studying the impact of innovation indicators on innovation performance and was validated in previous studies (Wiklund and Shepherd 2005; Bate et al. 2023).
3.1. Description of Variables
The GII considers that the inputs to innovation ecosystems are based on five pillars: institutions, human capital and research, infrastructures, market sophistication, and business sophistication, and that the outputs are categorized into two types: those resulting from knowledge and technology and those resulting from creativity. Each pillar is, in turn, broken down into innovation indicators, the theoretical framework for which was presented in Section 2 and which is shown in Table 1. The values of the pillars and innovation indicators are standardized to allow comparison between countries, and the value varies between zero and 100. The data were collected by indicator and by country. The pillars and their indicators are independent variables, while the results (outputs) are dependent variables. The code of each variable is presented in the right-hand column of each pillar and indicator since its description is very extensive. The expected association between indicators and pillars and between these and the dependent variables is positive. Table 1 shows the association between the research hypotheses and the pillars and indicators.
Using STATA software, linear regressions were carried out to measure the contribution of each indicator to the respective pillar (input) and the contribution of each indicator to innovation performance (output), according to the equations below (Daniels and Minot 2020). The null hypothesis H0 can be written as β1 = β2 = β3 = 0.
Y = β0 + β1 × I1 + β2 × I2 + β3 × I3 + μ,
y = innovation pillar or performance;
In = indicator;
β = correlation coefficient of the indicator;
μ = the error or residue.
The equations below show the Pearson correlation coefficients (β) and the coefficients of determination (R2). In the institutions, infrastructure, market sophistication, and business sophistication pillars, each indicator contributes one-third to the pillar score, with the pillar value being the average of the indicator scores. In the human capital and research pillar, education has a slightly higher coefficient (β = 0.345) than tertiary education (β = 0.327). As expected, all the indicators have an R2 equal to or close to 100%.
Institutions = −0.306 + 0.337 × pol + 0.334 × reg + 0.332 × bus; R2 = 99.9%
Human capital and research = −0.655 + 0.345 × ed + 0.327 × ted + 0.337 × rd; R2 = 99.7%
Infrastructure = 0.018 + 0.333 × ict + 0.334 × geinf + 0.334 × ecosus; R2 = 100%
Market sophistication = −0.425 + 0.339 × cred + 0.331 × invest + 0.338 × trade; R2 = 99.9%
Business sophistication = −0.017 + 0.333 × kw + 0.334 × inlink + 0.334 × kabs; R2 = 100%
For innovation performance as measured by knowledge and technology output and creativity output, the results of the linear regressions are as follows. For the knowledge and technology output, the impact of knowledge has a slightly higher coefficient (β = 0.347) than the diffusion of knowledge (β = 0.325). Regarding creativity output, intangible assets have twice the contribution of the other two indicators (β = 0.500). All the indicators have an R2 equal to or close to 100%.
Know. & tech. output = −0.324 + 0.339 × kcreat + 0.347 × kimpct + 0.325 × kdif; R2 = 99.8%
Creativity output = −0.141 + 0.500 × intasst + 0.250 × cgs + 0.250 × olc; R2 = 100%
3.2. Model Description
The five research hypotheses consider that the five pillars of innovation have a statistically significant and positive effect on innovation performance. To determine the most appropriate predictive model, hierarchical linear regressions were carried out in an iterative process. The hierarchical analysis begins with a conventional multiple linear regression, to which new independent variables are added. The addition of more independent variables sets up another model (Figure 1). The value of R2, the variation in R2 with the addition of another independent variable, and F are evaluated. The interaction effect is considered if the interaction value shows a statistically significant contribution. Three levels of significance were considered: 5% (95% confidence level), 1% (99% confidence level), and 0.1% (99.9% confidence level) for the analysis of p and the null hypothesis.
4. Results and Discussion
This section presents the test of hypotheses, the determinants of innovation performance in knowledge and technology, and the determinants of innovation for creative performance.
Table 2 shows the test of the hypotheses, identifying the Pearson correlation coefficients (β) and the coefficients of determination (R2) obtained in the linear regressions of each pillar with the outputs of innovation in knowledge and technology as well as creativity. The β coefficient explains the magnitude of the pillar’s correlation with innovation performance and indicates whether the correlation is positive or negative, while R2 explains the proportion of the variance in innovation performance that is explained by the pillar in question. All the pillars: institutions, human capital and research, infrastructure, market sophistication, and business sophistication, have a positive correlation with innovation performance. Business sophistication is the pillar with the highest correlation, explaining 85% of innovation performance in knowledge and technology (R2 = 0.707) and 73% of performance in creativity (R2 = 0.602). This is followed by the human capital and research pillar, which explains 80% of innovation performance in knowledge and technology (R2 = 0.651) and 72% of creativity performance (R2 = 0.579). The other pillars have correlation coefficients above 60%, although they explain lower variations in innovation performance.
Together, the pillars (inputs) predict 73% and 66% (R2 adjusted) of the variance in innovation performance in knowledge and technology as well as creativity, respectively (Table 3). Except for institutions, all the other pillars have a positive correlation with innovation performance. The first hypothesis (H1), which postulates a statistically significant effect and a positive relationship between institutions and innovation performance, is, thus, rejected, meaning that institutions may be important for innovation performance, but their role is less than that of the other pillars. Business sophistication is the pillar with the greatest impact on innovation performance, with statistical significance, explaining 72% of the output in knowledge and technology (β = 0.718; p = 0.000) and 34% of the output in creativity (β = 0.340; p = 0.029), validating H5. Human capital and research have a positive impact on innovation performance, although with less statistical significance, and market sophistication is statistically significant for creativity output, explaining 25% of the results, but it is not significant for knowledge and technology results. Infrastructure explains a small part of innovation performance without statistical significance. Thus, hypotheses H2, H3, and H4 are partially confirmed (positive correlation but low statistical significance). These conclusions are in line with those obtained by Bate et al. (2023).
As each pillar incorporates different variables, it is necessary to analyze the indicators to better understand the determinants of innovation. Table 4 shows the hierarchical linear regressions between innovation indicators and innovation performance in knowledge and technology. In the first regression, considering only institution variables, the political environment is the strongest and most statistically significant predictor of knowledge and technology results with β = 0.470 and p = 0.035. In the next stage, considering the human capital and research variables, the political environment loses its significance, and research and development becomes the most significant predictor, explaining 31.8% of the knowledge and technology results (β = 0.318; p = 0.000); education shows lower significance (p = 0.027) and explains 32% of the results (β = 0.320). Education and research and development are variables with a positive and significant impact on the performance of innovation in knowledge and technology, in line with previous studies which state that intellectual capital and R&D are factors with an impact on innovation (De Silva et al. 2018; Lam et al. 2021; Scaliza et al. 2022; Popa et al. 2022; Yu et al. 2022). In the third stage, the infrastructure variables are integrated; the predictive capacity of research and development increases to 33.5% (β = 0.335; p = 0.000), as does education (β = 0.329; p = 0.024), while ecological sustainability explains 23.8% (β = 0.238; p = 0.021) in a statistically significant way. However, the variation in R2 (0.028) is statistically insignificant. Information and communication technologies and infrastructures, in general, show an impact, albeit less significant. The same is true of Model 4, with a variation in the R2 of 0.025, with the market sophistication variables (credit system, investment, trade, diversification, and market scale) playing a role of little statistical significance in explaining the knowledge and technology results.
Finally, in Model 5, the variables research and development, education, and ecological sustainability lose the statistical significance seen in the previous models, and the variable innovation partnerships emerge as the only one with statistical significance (p = 0.007), explaining 37.7% of the results (β = 0.377). The results are in line with previous studies, which indicate a significant relationship between knowledge management and innovation partnerships with innovation in companies (Bate et al. 2023; Boiko 2022; De Silva et al. 2018; Ferreira et al. 2020; Lam et al. 2021; O’Connell et al. 2022; Popa et al. 2022; Queirós et al. 2019; Scaliza et al. 2022; Townsend and Busenitz 2015; Wilson et al. 2023; Coutinho and Au-Yong-Oliveira 2023).
Table 5 shows the hierarchical linear regressions between innovation indicators and creative innovation performance.
The variables in the institutions pillar are not statistically significant in the creativity output in any of the models. The human capital and research pillar emerges as the most significant, which is not surprising considering that the relationship is with creative output (Model 2: β = 0.364; p = 0.015), (Model 3: β = 0.387; p = 0.009), (Model 4: β = 0.427; p = 0.004), with the education variable explaining 44.6% of the results of creative innovation (β = 0.446; p= 0.003) in Model 5, being variable with the greatest statistical significance. Research and development show statistical significance in Model 2 (β = 0.226; p = 0.000), Model 3 (β = 0.242; p = 0.0000) and Model 4 (β = 0.164; p = 0.036) but loses significance in Model 5. Contrary to what one might suppose, higher education has a negative, non-significant correlation. Ecological sustainability shows a positive and statistically significant correlation in Model 2 and Model 3 (β = 0.206; p = 0.046) (β = 0.206; p = 0.042), losing significance in Model 5. The credit system and knowledge absorption show a positive and statistically significant correlation in Model 5 (β = 0.197; p = 0.034) and (β = 0.285; p = 0.022), respectively; however, the variation in R2 (0.041) is statistically insignificant.
The results show that the innovation indicators are better at explaining innovation performance than the pillars themselves, explaining 75% of the output in knowledge and technology and 69% of the output in creativity (R2 adjusted). Among the regression models, Model 5 provides the best prediction for innovation performance, both in knowledge and technology and in creativity.
5. Conclusions and Implications
The study is based on data from 64 countries from various regions of the world (please see Appendix A). Note that some data on regions simply were not available, as was to be expected of less developed countries. Multiple linear regressions were carried out, and five hypotheses were tested regarding the impact of the innovation pillars on innovation performance in knowledge and technology as well as creativity. The hierarchical linear regression of innovation indicators (inputs) was carried out to identify those that best predict innovation (outputs) and to determine the model that best estimates innovation performance. The fundamental pillars found, with a positive and statistically significant correlation, were business sophistication (for example, the advanced or not-so-advanced state of technology which may be used by highly qualified workers to leverage knowledge absorption and creation—including information and management systems, as advocated in the strategy model of (Lafley and Martin 2013); management systems are the support systems to support our strategic shorter- and longer-term choices) and human capital and research and, less significantly, infrastructure. The pillar of business sophistication makes a significant contribution to both knowledge and technology results and creativity results, especially regarding innovation partnerships and knowledge absorption. Similarly, education and research and development play a decisive role in innovation performance, both in knowledge and technology results and in creativity results. With a lesser contribution to innovation performance comes ecological sustainability, a variable in the infrastructure pillar.
The study reveals that the model that determines innovation performance must integrate the business and political environment, promote higher education and research and development, strengthen ecological sustainability, consider the credit system and business investment, as well as ensure knowledge management and innovation partnerships. Innovation can be accelerated by fostering innovation partnerships between scientific entities and companies, as well as between companies and the state and among companies; effective knowledge management in its various aspects, i.e., creation, sharing, transfer, and dissemination; education and improving qualifications in the labor market, including investment in research and development; investment in ecological sustainability and the optimization of natural resources and access to credit lines for the development of innovative projects. Finally, it should be noted that the factors that impact innovation differ from country to country, from region to region (Bate et al. 2023), and due to the global context. Although the factors are fundamentally the same, the level of priority and importance in innovation performance will vary. For example, Portugal (included in the analysis) has historically felt a lack of financial resources, especially by startups, in what is a poorer and more peripheral EU economy, so finance may be a priority there (market sophistication and efficient and effective access to credit lines). On the other hand, Greece is rather averse to change (Hofstede 2001) and so may be slower to adopt new technology than, say, the Germans (technology such as artificial intelligence—chatbots including ChatGPT), which may hinder their progress along the infrastructure dimension. Finally, a country such as South Africa, though advanced in African terms, will feel a general lack of support along a number of dimensions, which, if we had the data, would be expected to be more serious in certain other African countries such as Mozambique—where it is hard to obtain access to a good education—because it is expensive for the locals and because there is a general lack of qualified human resources to fill the local universities, which are, therefore, not ranked very high, in global terms (human capital and research deficit). In such circumstances as those found in less developed countries, innovation partnerships (for example, between universities, local and foreign—the latter being better placed in international university rankings) to foster learning and knowledge transfer will be of paramount importance (hence contributing to the pillar of business sophistication).
Limitations and Suggestions for Future Work
This study shows that the analysis of the GII pillars is too aggregated to provide the necessary visibility of the determinants of innovation performance. In fact, the indicators that are considered in a single pillar contribute with different weights and have different statistical significance. Based on the statistical results, future work suggests studying the model for calculating the ranking of global innovation ecosystems and possibly redefining it, considering the most statistically representative variables. The work should include geographical, demographic, and socio-economic factors of the countries since it is to be expected that the weighting of the various determinants of innovation for overall performance will be different in countries with different levels of development.
Author Contributions
Conceptualization, E.M.O.C. and M.A.-Y.-O.; methodology, E.M.O.C.; software, E.M.O.C.; validation, E.M.O.C. and M.A.-Y.-O.; formal analysis, E.M.O.C.; investigation, E.M.O.C.; writing—original draft preparation, E.M.O.C.; writing—review and editing, E.M.O.C. and M.A.-Y.-O.; supervision, M.A.-Y.-O. All authors have read and agreed to the published version of the manuscript.
Funding
This research received no external funding.
Institutional Review Board Statement
Not applicable.
Informed Consent Statement
Not applicable.
Data Availability Statement
Data are contained within the article.
Conflicts of Interest
The authors declare no conflicts of interest.
Appendix A
The selected countries, covering the various regions of the world and the various levels of GDP per capita, with complete data for all the parameters under analysis, are presented in Table A1.

Table A1.
Countries.
| Countries | |
|---|---|
| Albania | Luxembourg |
| Argentina | Malaysia |
| Armenia | Malta |
| Austria | Mexico |
| Australia | Montenegro |
| Belgium | Morocco |
| Brazil | Netherlands |
| Bulgaria | New Zealand |
| Canada | Norway |
| Chile | Panama |
| China | Poland |
| Colombia | Portugal |
| Croatia | Republic of Korea |
| Cyprus | Romania |
| Czech | Russian Federation |
| Denmark | Serbia |
| Estonia | Singapore |
| Finland | Slovakia |
| France | Slovenia |
| Germany | South Africa |
| Greece | Spain |
| Hong Kong | Sweden |
| Hungary | Switzerland |
| Iceland | Thailand |
| India | Tunisia |
| Indonesia | Türkiye |
| Ireland | Ukraine |
| Israel | United Arab Emirates |
| Italy | United Kingdom |
| Japan | United States of America |
| Latvia | Uruguay |
| Lithuania | Vietnam |
References
- Akhmadi, Saltanat, and Mariza Tsakalerou. 2023. Shades of innovation: Is there an East-West cultural divide in the European Union? International Journal of Innovation Science 15: 260–78. [Google Scholar] [CrossRef]
- Andrijauskiene, Meda, Daiva Dumciuviene, and Jovita Vasauskaite. 2021. Redeveloping the National Innovative Capacity Framework: European Union Perspective. Economies 9: 201. [Google Scholar] [CrossRef]
- Bate, Adisu Fanta, Esther Wanjiru Wachira, and Sándor Danka. 2023. The determinants of innovation performance: An income-based cross-country comparative analysis using the Global Innovation Index (GII). Journal of Innovation and Entrepreneurship 12: 1–17. [Google Scholar] [CrossRef]
- Bielińska-Dusza, Edyta, and Monika Hamerska. 2021. Methodology for Calculating the European Innovation Scoreboard-Proposition for Modification. Sustainability 13: 2199. [Google Scholar] [CrossRef]
- Boiko, Kseniia. 2022. R&D activity and firm performance: Mapping the field. Management Review Quarterly 72: 1051–87. [Google Scholar] [CrossRef]
- Castaño-Martínez, María-Soledad, María-Teresa Méndez-Picazo, and Miguel-Ángel Galindo-Martín. 2015. Policies to promote entrepreneurial activity and economic performance. Management Decision 53: 2073–87. [Google Scholar] [CrossRef]
- Castro-Silva, Hugo, and Francisco Lima. 2023. The struggle of small firms to retain high skill workers: Job duration and the importance of knowledge intensity. Small Business Economics 60: 537–72. [Google Scholar] [CrossRef]
- Costa, Joana, Ana Rita Neves, and João Reis. 2021. Two Sides of the Same Coin. University-Industry Collaboration and Open Innovation as Enhancers of Firm Performance. Sustainability 13: 3866. [Google Scholar] [CrossRef]
- Costa, Joana, and António Carrizo Moreira. 2022. Public Policies, Open Innovation Ecosystems and Innovation Performance. Analysis of the Impact of Funding and Regulations. Journal of Open Innovation: Technology, Market, and Complexity 8: 210. [Google Scholar] [CrossRef]
- Coutinho, Evelina Maria Oliveira, and Manuel Au-Yong-Oliveira. 2023. Factors Influencing Innovation Performance in Portugal: A Cross-Country Comparative Analysis Based on the Global Innovation Index and on the European Innovation Scoreboard. Sustainability 15: 10446. [Google Scholar] [CrossRef]
- Daniels, Lisa, and Nicholas Minot. 2020. An Introduction to Statistics and Data Analysis Using STATA: From Research Design to Final Report. Thousand Oaks: SAGE Publications, Inc. ISBN 9781506371832. [Google Scholar]
- De Silva, Muthu, Jeremy Howells, and Martin Meyer. 2018. Innovation intermediaries and collaboration: Knowledge-based practices and internal value creation. Research Policy 47: 70–87. [Google Scholar] [CrossRef]
- Dobni, C. Brooke. 2010. The Relationship Between an Innovation Orientation and Competitive Strategy. International Journal of Innovation Management 14: 331–57. [Google Scholar] [CrossRef]
- Dobni, C. Brooke, and Mark Klassen. 2021. The decade of innovation: From benchmarking to execution. Journal of Business Strategy 42: 23–31. [Google Scholar] [CrossRef]
- Ferreira, Jorge, Arnaldo Coelho, and Luiz Moutinho. 2020. Dynamic capabilities, creativity and innovation capability and their impact on competitive advantage and firm performance: The moderating role of entrepreneurial orientation. Technovation 92: 102061. [Google Scholar] [CrossRef]
- Ferreira, Jorge, Arnaldo Coelho, and Luiz Moutinho. 2021. Strategic alliances, exploration and exploitation and their impact on innovation and new product development: The effect of knowledge sharing. Management Decision 59: 524–67. [Google Scholar] [CrossRef]
- Hadad, Shahrazad. 2017. Knowledge Economy: Characteristics and Dimensions. Management Dynamics in the Knowledge Economy 5: 203–25. [Google Scholar] [CrossRef]
- Hofstede, Geert. 2001. Culture’s Consequences: Comparing Values, Behaviours, Institutions, and Organisations across Nations, 2nd ed.Thousand Oaks: Sage. [Google Scholar]
- Jovovic, Radislav, Mimo Draskovic, Milica Delibasic, and Miroslav Jovovic. 2017. The concept of sustainable regional development-institutional aspects, policies and prospects. Journal of International Studies 10: 255–66. [Google Scholar] [CrossRef]
- Kirikkaleli, Dervis, and Alper Ozun. 2019. Innovation capacity, business sophistication, and macroeconomic stability: Empirical evidence from OECD countries. Journal of Business Economics and Management 20: 351–67. [Google Scholar] [CrossRef]
- Klett, Tomas Casas, and Guido Cozzi. 2023. Elite Quality Report 2023. Country Scores and Global Rankings. The Sustainable Value Creation of Nations. Measuring Long-Term Economic and Human Development Prospects. St. Gallen: Foundation for Value Creation. Available online: https://ssrn.com/abstract=4418550 (accessed on 10 May 2023).
- Lafley, Alan G., and Roger Martin. 2013. Playing to Win—How Strategy really Works. Boston: Harvard Business Review Press. [Google Scholar]
- Lam, Long, Phuong Nguyen, Nga Le, and Khoa Tran. 2021. The Relation among Organizational Culture, Knowledge Management, and Innovation Capability: Its Implication for Open Innovation. Journal of Open Innovation: Technology, Market, and Complexity 7: 66. [Google Scholar] [CrossRef]
- Manpower Group Global QMR Q2. 2022. Quarterly Market Report. Global Market Report—Q2 2022 | ManpowerGroup Talent Solutions. Available online: https://workforce-resources.manpowergroup.com/workforce-analytics/global-market-report-q2-2022 (accessed on 27 April 2023).
- Manpower Group Global QMR Q1. 2023. Quarterly Market Report. Global Market Report—Q1 2023 | ManpowerGroup Talent Solutions. Available online: https://workforce-resources.manpowergroup.com/white-papers/q1-2023-manpowergroup-employment-outlook-survey (accessed on 27 April 2023).
- Marule, Nontombi Pearl. 2022. The Role of Technology Commercialization in the Operationalization of Innovation and Industrial Policies in South Africa. Triple Helix 9: 119–37. [Google Scholar] [CrossRef]
- Minto-Coy, Indianna, and Maurice McNaughton. 2016. Barriers to entrepreneurship and innovation: An institutional analysis of mobile banking in Jamaica and Kenya. Social and Economic Studies 65: 99–131. [Google Scholar]
- Mohamed, Maha Mohamed Alsebai, Pingfeng Liu, and Guihua Nie. 2022. Do Knowledge Economy Indicators Affect Economic Growth? Evidence from Developing Countries. Sustainability 14: 4774. [Google Scholar] [CrossRef]
- Nawrocki, Tomasz L., and Izabela Jonek-Kowalska. 2022. Is Innovation a Risky Business? A Comparative Analysis in High-Tech and Traditional Industries in Poland. Journal of Open Innovation: Technology, Market, and Complexity 8: 155. [Google Scholar] [CrossRef]
- Nunes, Sérgio, Raul Lopes, and Nerys Fuller-Love. 2019. Networking, Innovation, and Firms’ Performance: Portugal as Illustration. Journal of the Knowledge Economy 10: 899–920. [Google Scholar] [CrossRef]
- Nyarku, Kwamena Minta, and Stephen Oduro. 2018. Effect of legal and regulatory framework on SMEs growth in the Accra Metropolis of Ghana. International Journal of Entrepreneurship and Innovation 19: 207–17. [Google Scholar] [CrossRef]
- O’Connell, Vincent, Naser AbuGhazaleh, Yasean Tahat, and Garvan Whelan. 2022. The Impact of R&D Innovation Success on the Relationship between R&D Investment and Financial Leverage. Journal of Open Innovation: Technology, Market, and Complexity 8: 129. [Google Scholar] [CrossRef]
- Öber, Christina. 2019. The role of business networks for innovation. Journal of Innovation & Knowledge 4: 124–28. [Google Scholar] [CrossRef]
- OECD/Eurostat. 2018. Oslo Manual 2018: Guidelines for Collecting, Reporting and Using Data on Innovation, 4th ed. The Measurement of Scientific, Technological and Innovation Activities. Paris: OECD Publishing. [Google Scholar] [CrossRef]
- Okrah, James, and Marzena Hajduk-Stelmachowicz. 2020. Political stability and innovation in Africa. Journal of International Studies 13: 234–46. [Google Scholar] [CrossRef]
- Papa, Armando, Alice Mazzucchelli, Luca Vincenzo Ballestra, and Antonio Usai. 2022. The open innovation journey along heterogeneous modes of knowledge-intensive marketing collaborations: A cross-sectional study of innovative firms in Europe. International Marketing Review 39: 602–25. [Google Scholar] [CrossRef]
- Pereira, Leandro, António Fernandes, Mariana Sempiterno, Álvaro Dias, Renato Lopes da Costa, and Nélson António. 2021. Knowledge Management Maturity Contributes to Project-Based Companies in an Open Innovation Era. Journal of Open Innovation: Technology, Market, and Complexity 7: 126. [Google Scholar] [CrossRef]
- Popa, Simona, Pedro Soto-Acosta, and Daniel Palacios-Marqués. 2022. A discriminant analysis of high and low-innovative firms: The role of IT, human resources, innovation strategy, intellectual capital and environmental dynamism. Journal of Knowledge Management 26: 1615–32. [Google Scholar] [CrossRef]
- Powell, Walter W., and Kaisa Snellman. 2004. The Knowledge Economy. Annual Review of Sociology 30: 199–220. [Google Scholar] [CrossRef]
- Puertas, Rosa, Patricia Carracedo, Marta Garcia, and Virginia Vega. 2022. Analysis of the determinants of market capitalization: Innovation, climate, change policies and business context. Technological Forecasting & Social Change 179: 121644. [Google Scholar] [CrossRef]
- Queirós, Maria, Vítor Braga, and Aldina Correia. 2019. Cross-country analysis to high-growth business: Unveiling its determinants. Journal of Innovation & Knowledge 4: 146–53. [Google Scholar] [CrossRef]
- Scaliza, Janaina Aparecida Alves, Daniel Jugend, Charbel Jose Chiappetta Jabbour, Hengky Latan, Fabiano Armellini, David Twigg, and Darly Fernando Andrade. 2022. Relationships among organizational culture, open innovation, innovative ecosystems, and performance of firms: Evidence from an emerging economy context. Journal of Business Research 140: 264–79. [Google Scholar] [CrossRef]
- Serban, Octavian. 2022. The Multilevel Knowledge Economy Pyramid Model as a Flexible Solution to Address the Impact of Adverse Events in the Economy. Sustainability 14: 12332. [Google Scholar] [CrossRef]
- Sharma, Gagan Deep, Sascha Kraus, Mrinalini Srivastava, Ritika Chopra, and Andreas Kallmuenzer. 2022. The changing role of innovation for crisis management in times of COVID-19: An integrative literature review. Journal of Innovation & Knowledge 7: 100281. [Google Scholar] [CrossRef]
- Szalacha-Jarmużek, Joanna, and Krzysztof Pietrowicz. 2018. Missing causality and absent institutionalization. A case of Poland and methodological challenges for future studies of interlocking directorates. Economics and Sociology 11: 157–72. [Google Scholar] [CrossRef]
- Townsend, David M., and Lowell W. Busenitz. 2015. Turning water into wine? Exploring the role of dynamic capabilities in early-stage capitalization processes. Journal of Business Venturing 30: 292–306. [Google Scholar] [CrossRef]
- Tubbs, Michael. 2007. The Relationship Between R&D and Company Performance. Research-Technology Management 50: 23–30. [Google Scholar] [CrossRef]
- Wang, Chengqi, Mario Kafouros, Jingtao Yi, Junjie Hong, and Panagiotis Ganotakis. 2020. The role of government affiliation in explaining firm innovativeness and profitability in emerging countries: Evidence from China. Journal of World Business 55: 101047. [Google Scholar] [CrossRef]
- Wang, Lu, Gong-li Luo, Arif Sari, and Xue-Feng Shao. 2020. Technological forecasting & social change what nurtures the fourth industrial revolution? An investigation of economic and social determinants of technological innovation in advanced economies. Technological Forecasting & Social Change 161: 120305. [Google Scholar] [CrossRef]
- Wang, Qing’E., Luwei Zhao, Alice Chang-Richards, Yuanyuan Zhang, and Hujun Li. 2021. Understanding the Impact of Social Capital on the Innovation Performance of Construction Enterprises: Based on the Mediating Effect of Knowledge Transfer. Sustainability 13: 5099. [Google Scholar] [CrossRef]
- Wellalage, Nirosha Hewa, and Viviana Fernandez. 2019. Innovation and SME finance: Evidence from developing countries. International Review of Financial Analysis 66: 101370. [Google Scholar] [CrossRef]
- Wiklund, Johan, and Dean Shepherd. 2005. Entrepreneurial Orientation and Small Business Performance: A Configurational Approach. Journal of Business Venturing 20: 71–91. [Google Scholar] [CrossRef]
- Wilson, Grant Alexander, and C. Brooke Dobni. 2022. Which Innovative Methodologies and Technologies Help Improve Firm Performance? A Global Study of SMEs. Research-Technology Management 65: 50–60. [Google Scholar] [CrossRef]
- Wilson, Grant Alexander, Tyler Case, and C. Brooke Dobni. 2023. A global study of innovation-oriented firms: Dimensions, practices, and performance. Technological Forecasting & Social Change 187: 122257. [Google Scholar] [CrossRef]
- WIPO. 2022. Global Innovation Index 2022: What Is the Future of Innovation-Driven Growth? Geneva: World Intellectual Property Organization. [Google Scholar] [CrossRef]
- Xie, Zuomiao, Shiqi Yuan, Jinjing Zhu, and Alistair Palferman. 2023. Dynamic value sharing based on employee contribution as a competitiveness-enhancing device. Humanities and Social Sciences Communication 10: 1–13. [Google Scholar] [CrossRef]
- You, Shuyang, Kevin Zheng Zhou, and Liangding Jia. 2021. How does human capital foster product innovation? The contingent roles of industry cluster features. Journal of Business Research 130: 335–47. [Google Scholar] [CrossRef]
- Yu, Qi, Sumaira Aslam, Majid Murad, Wang Jiatong, and Nausheen Syed. 2022. The Impact of Knowledge Management Process and Intellectual Capital on Entrepreneurial Orientation and Innovation. Frontiers in Psychology 13: 772668. [Google Scholar] [CrossRef] [PubMed]
Figure 1.
Hierarchical multiple linear regression model.
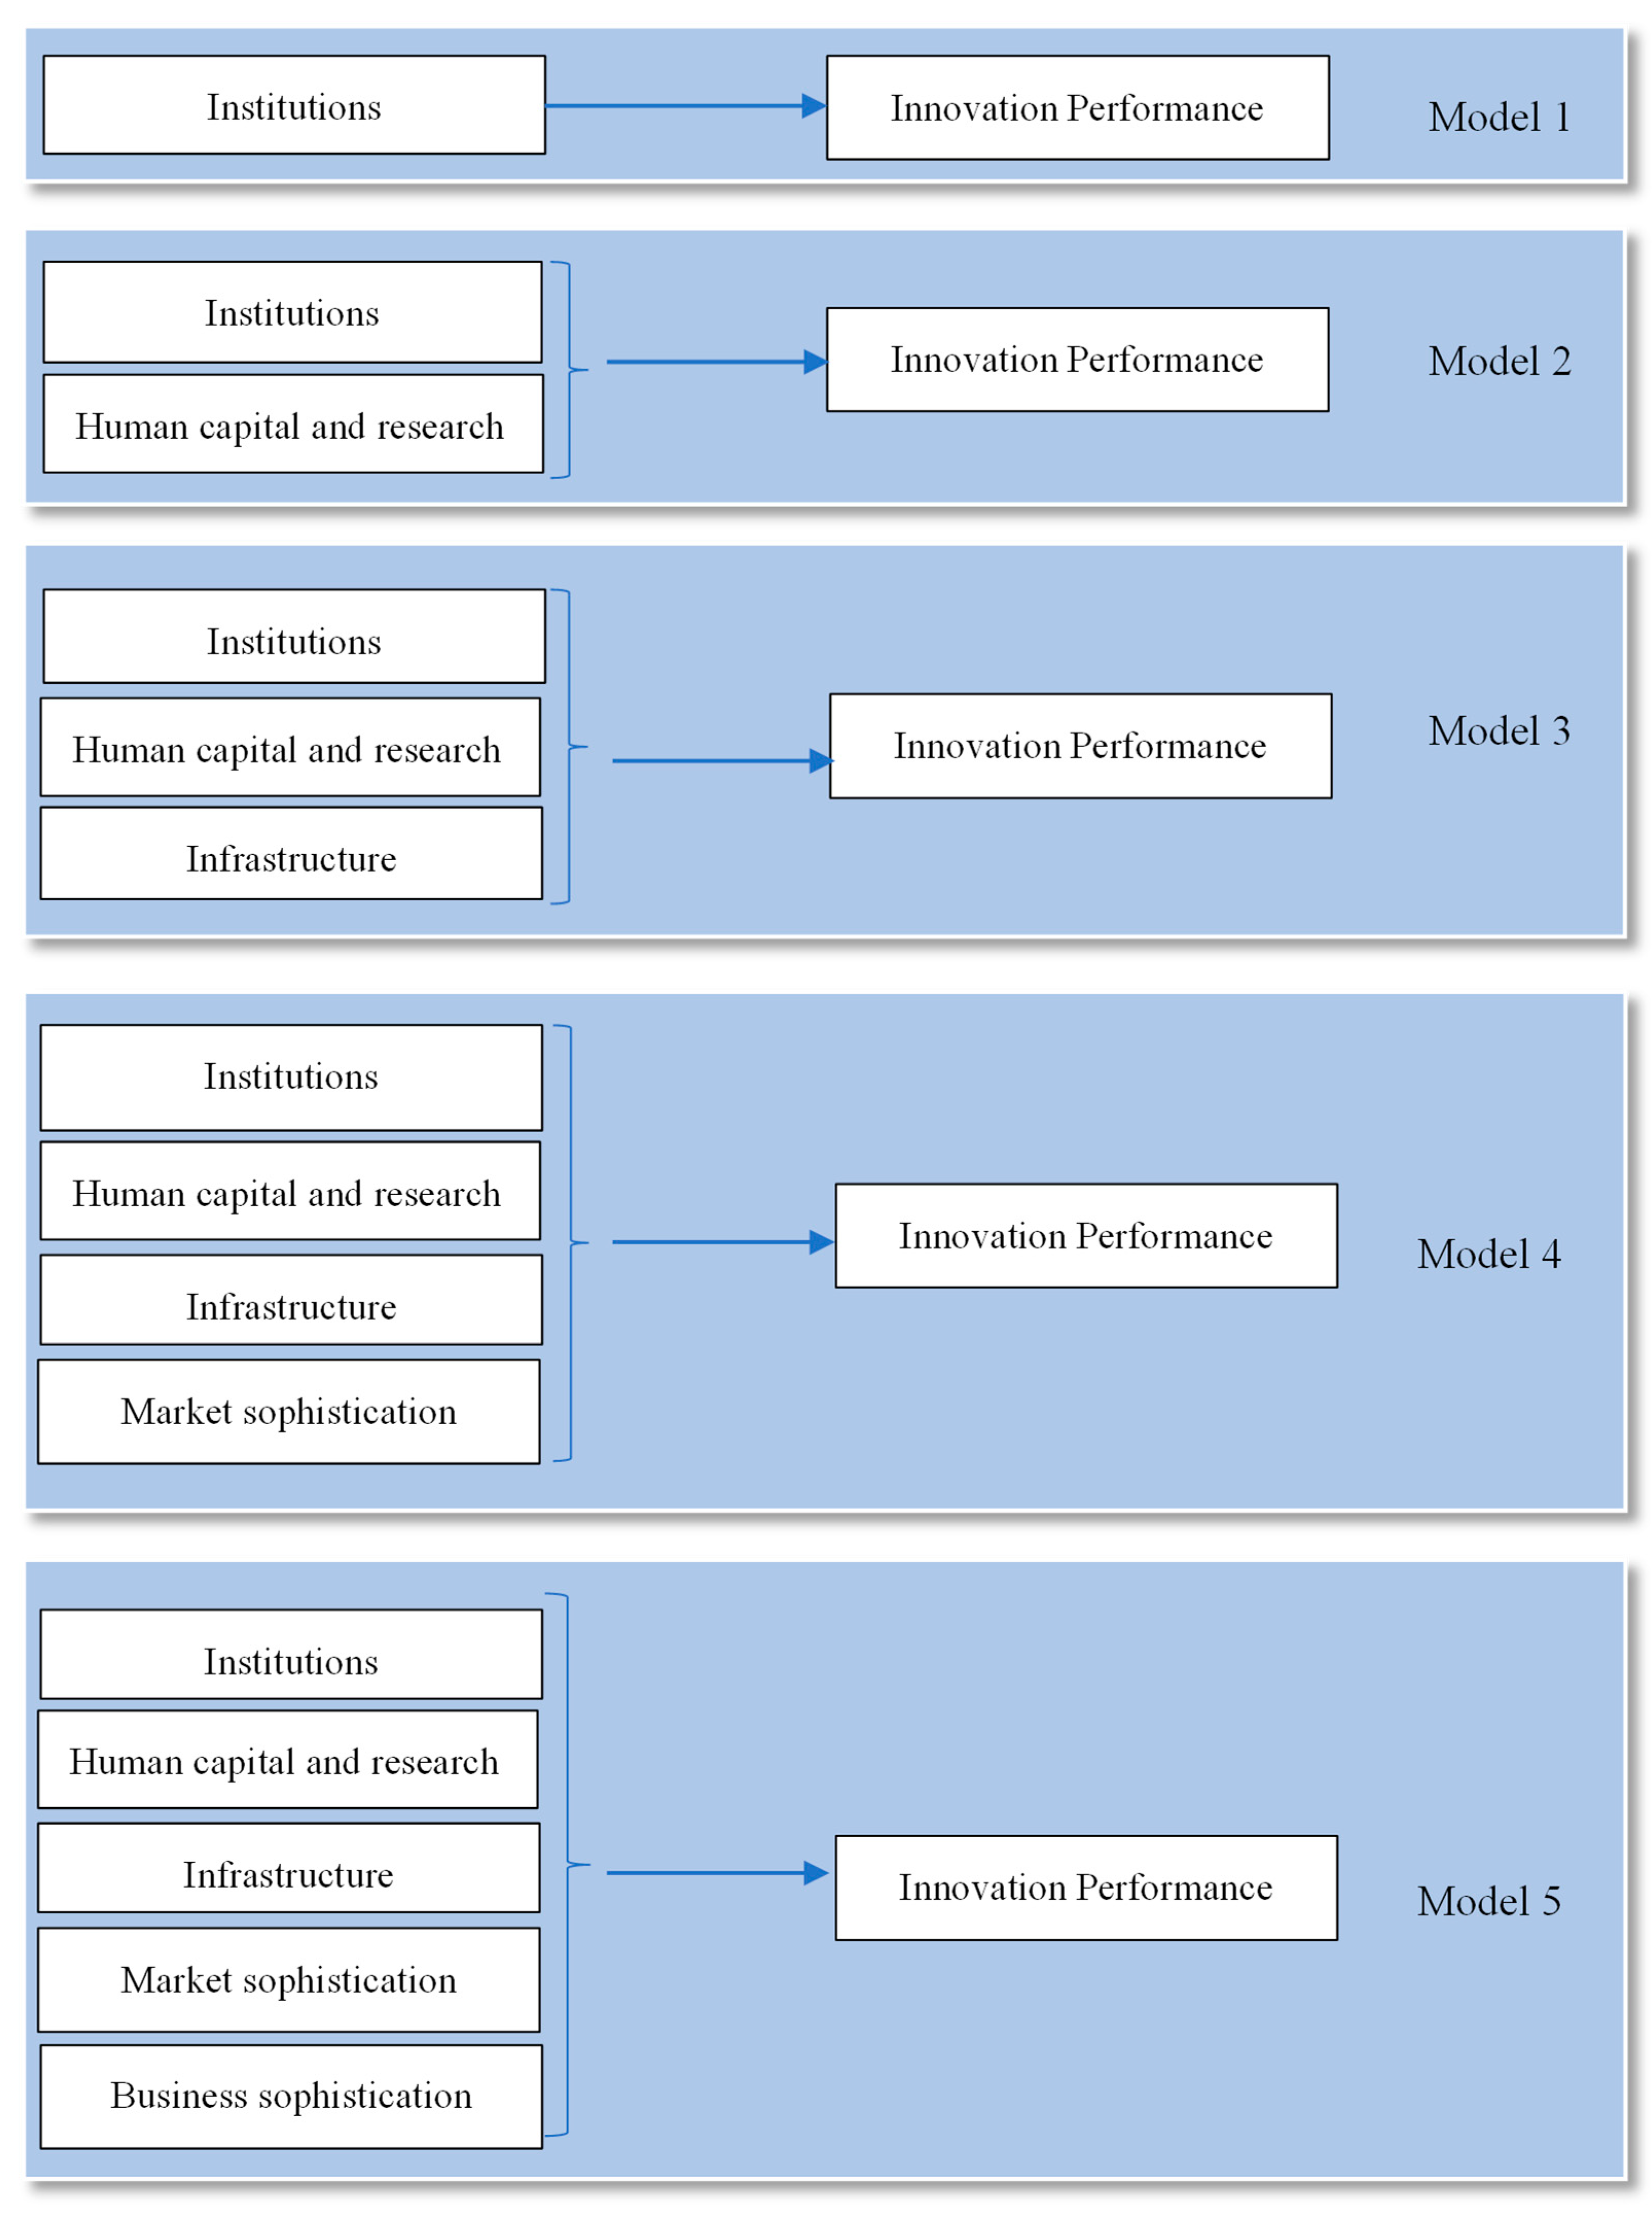
Table 1.
Description of variables.
| Type of Variable | Pilar | Indicators/Variables | Hypothesis | |
|---|---|---|---|---|
|
Independent (inputs) | Institutions | Political environment | (pol) | H1 |
| Regulatory environment | (reg) | |||
| Business environment | (bus) | |||
| Human capital and research | Education | (ed) | H2 | |
| Tertiary education | (ted) | |||
| Investment in R&D | (rd) | |||
| Infrastructure | Information and communication technologies | (ist) | H3 | |
| General infrastructure | (geinf) | |||
| Ecological sustainability | (ecosus) | |||
| Market sophistication | Credit | (cred) | H4 | |
| Investment | (invest) | |||
| Trade, diversification, and market size | (trade) | |||
| Business sophistication | Highly qualified work | (kw) | H5 | |
| Innovation partnerships | (inlink) | |||
| Knowledge absorption | (kabs) | |||
|
Dependent (outputs) | Knowledge and technology results | Knowledge creation | (kcreat) | |
| Impact of knowledge | (kimpct) | |||
| Spreading knowledge | (kdif) | |||
| Creativity results | Intangible assets | (intasst) | ||
| Creative products and services | (cgs) | |||
| Creativity online | (olc) | |||
Table 2.
Hypothesis test. Linear regressions of each pillar with innovation performance. Own elaboration.
Table 2.
Hypothesis test. Linear regressions of each pillar with innovation performance. Own elaboration.
| Hypotheses | βkt | Rkt2 | βc | Rc2 |
|---|---|---|---|---|
| H1. There is a positive and statistically significant relationship between institutions and innovation performance. | 0.621 | 0.382 | 0.604 | 0.423 |
| H2. There is a positive and statistically significant relationship between human capital and research and innovation performance. | 0.799 | 0.651 | 0.723 | 0.579 |
| H3. There is a positive and statistically significant relationship between infrastructure and innovation performance. | 1.171 | 0.500 | 1.070 | 0.486 |
| H4. There is a positive and statistically significant relationship between market sophistication and innovation performance. | 0.622 | 0.387 | 0.649 | 0.492 |
| H5. There is a positive and statistically significant relationship between business sophistication and innovation performance. | 0.849 | 0.707 | 0.726 | 0.602 |
Table 3.
Linear regression of the pillars of innovation with the innovation performance of knowledge and technology (kt) and creativity (c). Own elaboration.
Table 3.
Linear regression of the pillars of innovation with the innovation performance of knowledge and technology (kt) and creativity (c). Own elaboration.
| Pillars | βkt | pkt | βc | pc |
|---|---|---|---|---|
| Constant | −0.2112 | 0.998 | −6.487 | 0.369 |
| Institutions | −0.292 | 0.023 * | −0.127 | 0.333 |
| Human capital and research | 0.269 | 0.051 | 0.241 | 0.090 |
| Infrastructure | 0.197 | 0.341 | 0.231 | 0.284 |
| Market sophistication | 0.070 | 0.474 | 0.253 | 0.015 * |
| Business sophistication. | 0.718 | 0.000 *** | 0.340 | 0 029 * |
| R2 | 0.7496 | 0.6846 | ||
| R2 adjusted | 0.7280 | 0.6575 |
* p < 0.05; *** p < 0.001.
Table 4.
Hierarchical multiple linear regressions–predictors of innovation performance in knowledge and technology. Own elaboration.
Table 4.
Hierarchical multiple linear regressions–predictors of innovation performance in knowledge and technology. Own elaboration.
| Independent Variables | Regressions | |||||
|---|---|---|---|---|---|---|
| Model 1 | Model 2 | Model 3 | Model 4 | Model 5 | ||
| Constant | −11.131 | −0.738 | −2.748 | −9.945 | −9.612 | |
| Institutions | Political environment | 0.470 * | 0.112 | 0.039 | 0.136 | 0.001 |
| Regulatory environment | 0.149 | 0.072 | −0.0178 | −0.033 | −0.378 | |
| Business environment | 0.047 | −0.003 | 0.028 | −0.006 | −0.016 | |
| Human capital and research | Education | 0.321 * | 0.329 * | 0.298 * | 0.252 | |
| Tertiary education | −0.151 | −0.161 | −0.163 | −0.118 | ||
| Research and development | 0.318 *** | 0.335 *** | 0.321 *** | 0.176 | ||
| Infrastructure | Information and communication technologies | 0.018 | 0.050 | −0.002 | ||
| General infrastructure | 0.030 | 0.046 | −0.092 | |||
| Ecological sustainability | 0.238 * | 0.257 * | 0.180 | |||
| Market sophistication | Credit systems | −0.155 | −0.044 | |||
| Investment | 0.077 | −0.325 | ||||
| Trade, diversification, market | 0.08 | 0.114 | ||||
| Business sophistication | Qualified work | 0.064 | ||||
| Innovation partnerships | 0.377 *** | |||||
| Knowledge absorption | 0.164 | |||||
| R2 | 0.404 | 0.712 | 0.740 | 0.765 | 0.810 | |
| R2 adjusted | 0.374 | 0.682 | 0.697 | 0.710 | 0.750 | |
| ΔR2 | 0.404 | 0.308 | 0.028 | 0.025 | 0.045 | |
| F | 13.56 | 23.52 | 17.08 | 13.85 | 13.60 | |
| ΔF | 13.56 | 9.96 | −6.44 | −3.23 | −0.25 | |
Dependent variable: knowledge and technology results. * p < 0.05; *** p < 0.001.
Table 5.
Hierarchical multiple linear regressions–predictors of innovation performance in creativity. Own elaboration.
Table 5.
Hierarchical multiple linear regressions–predictors of innovation performance in creativity. Own elaboration.
| Independent Variables | Regression 1 | Regression 2 | Regression 3 | Regression 4 | Regression 5 | |
|---|---|---|---|---|---|---|
| Model 1 | Model 2 | Model 3 | Model 4 | Model 5 | ||
| Constant | −9.658 | −5.473 | −23.820 | −25.873 | −23.543 | |
| Institutions | Political environment | 0.343 | 0.039 | −0.031 | −0.004 | −0.137 |
| Regulatory environment | 0.149 | 0.052 | −0.037 | −0.056 | −0.042 | |
| Business environment | 0.133 | 0.108 | 0.139 | 0.104 | 0.102 | |
| Human capital and research | Education | 0.364 * | 0.387 ** | 0.427 ** | 0.446 ** | |
| Tertiary education | −0.066 | −0.110 | −0.086 | −0.589 | ||
| Research and development | 0.226 *** | 0.242 *** | 0.164 * | 0.096 | ||
| Infrastructure | Information and communication technologies | 0.295 | 0.170 | 0.079 | ||
| General infrastructure | −0.091 | −0.101 | −0.212 | |||
| Ecological sustainability | 0.206 * | 0.206 * | 0.157 | |||
| Market sophistication | Credit system | 0.132 | 0.197 * | |||
| Investment | 0.050 | −0.0318 | ||||
| Trade, diversification, market | 0.117 | 0.133 | ||||
| Business sophistication | Qualified work | −0.033 | ||||
| Innovation partnerships | 0.233 | |||||
| Knowledge absorption | 0.285 * | |||||
| R2 | 0.426 | 0.647 | 0.695 | 0.723 | 0.764 | |
| R2 adjusted | 0.397 | 0.609 | 0.644 | 0.657 | 0.690 | |
| ΔR2 | 0.426 | 0.221 | 0.048 | 0.028 | 0.041 | |
| F | 14.84 | 17.38 | 13.66 | 11.07 | 10.35 | |
| ΔF | 14.84 | 2.54 | −3.72 | −2.59 | −0.72 | |
Dependent variable: creativity results. * p < 0.05; ** p < 0.01; *** p < 0.001.
Disclaimer/Publisher’s Note: The statements, opinions and data contained in all publications are solely those of the individual author(s) and contributor(s) and not of MDPI and/or the editor(s). MDPI and/or the editor(s) disclaim responsibility for any injury to people or property resulting from any ideas, methods, instructions or products referred to in the content. |
© 2024 by the authors. Licensee MDPI, Basel, Switzerland. This article is an open access article distributed under the terms and conditions of the Creative Commons Attribution (CC BY) license (https://creativecommons.org/licenses/by/4.0/).
Share and Cite
MDPI and ACS Style
Coutinho, E.M.O.; Au-Yong-Oliveira, M. Innovation’s Performance: A Transnational Analysis Based on the Global Innovation Index. Adm. Sci. 2024, 14, 32. https://doi.org/10.3390/admsci14020032
AMA Style
Coutinho EMO, Au-Yong-Oliveira M. Innovation’s Performance: A Transnational Analysis Based on the Global Innovation Index. Administrative Sciences. 2024; 14(2):32. https://doi.org/10.3390/admsci14020032
Chicago/Turabian StyleCoutinho, Evelina Maria Oliveira, and Manuel Au-Yong-Oliveira. 2024. "Innovation’s Performance: A Transnational Analysis Based on the Global Innovation Index" Administrative Sciences 14, no. 2: 32. https://doi.org/10.3390/admsci14020032
Note that from the first issue of 2016, this journal uses article numbers instead of page numbers. See further details here.