Strategic Design of a Business Model for Providing Services over the 5G Network in Peru


1
Departamento de Comunicaciones, Universitat Politècnica de València, 46022 Valencia, Spain
2
Facultad de Economia, Universitat de València, 46022 Valencia, Spain
3
Departamento de Ingeniería Ambiental, Universidad Nacional Jose María Arguedas, Andahuaylas 03701, Peru
4
Departamento de Tecnología de Alimentos, Universitat Politècnica de València, 46022 Valencia, Spain
*
Author to whom correspondence should be addressed.
Adm. Sci. 2024, 14(3), 55; https://doi.org/10.3390/admsci14030055
Submission received: 10 January 2024
/
Revised: 4 March 2024
/
Accepted: 8 March 2024
/
Published: 13 March 2024
Abstract
:The advance of the fifth generation (5G) network globally has completely changed business models, giving rise to the birth of new companies with their business models and the adaptation of existing companies. This change is greatest in developing countries where 5G network deployment is scarce and key to their economy. This article aims to analyze the strategic design of a business model to provide 5G network equipment installation services in Peru. In addition, the article includes the design of a business structure for the implementation of the business model, as well as the evaluation of economic and financial projections to determine the economic viability of its implementation. The methodological approach covers business management applied to business design, examining several key areas such as business management, human resource management, finance, accounting, marketing, and operations management. The study of the business model is based on business management theory, using accounting and finance concepts to analyze the most significant financial indicators. The information and data used to analyze the aspects of the business model are extracted from the databases of Peruvian institutions. Our results reveal that implementing a business model for providing 5G network equipment installation services in Peru is economically viable since the economic and financial projections show that a Net Present Value of 146,931.02 monetary units is obtained. Also, the results justify the design of the business structure based on the value proposition of experience and specialization focused on 5G networks in Peru.
1. Introduction
The continuous advancement of communications technologies and implementing the fifth-generation (5G) network are key to the development and efficiency of telecommunications in a country. The global expansion of the 5G network has given rise to new companies and led to the adaptation of existing ones to technological change. The rapid adoption and deployment of 5G networks in developing countries offer improvements in their economic growth. These countries can leverage the capabilities of 5G technologies by focusing on the application layer within key sectors of their existing economies (Campbell et al. 2017; Najjuuko et al. 2021). Proper 5G network equipment installation stands out as a critical component to ensure optimal deployment and performance of this advanced infrastructure. In addition, the 5G network implies more comprehensive access to online services, motivating network operators to migrate from fourth-generation (4G) network technologies to the 5G network (Suthar et al. 2020). This transition represents an opportunity for established and new entrants to provide services to network operators, provided they offer value propositions backed by 5G network expertise and training. In developed countries, higher education institutions are partnering with communications companies to equip graduates with technical skills and business acumen in 5G technology and application scenarios (Liu et al. 2021). So, in the context of telecommunications entrepreneurship, expertise and specialized training are key, as are planning and organizational structure.
This article focuses on the telecommunications sector in Peru. In this developing country, 5G network deployment is still in its early stages, presenting challenges and opportunities for companies in this evolving market (MTC 2021).
In this article, we look at analyzing the strategic design of a business model for the provision of 5G network equipment installation services in Peru. We will analyze the opportunities offered by the telecommunications market in Peruvian territory, focusing on 5G networks (Al-Falahy and Alani 2017). We will propose a business model based on a value proposition that focuses on the experience and specialization of the technical/administrative staff. Furthermore, we will develop a business structure for materializing the business model through a company. In addition, we will explore in detail each of the key aspects of the design of the business structure, such as external agents, the market, marketing, organizational design and human resources (HR.HH), legal and juridical form, and economic and financial plan. Finally, we will evaluate economic projections and financial indicators, such as net present value (NPV) and economic and financial profitability. These evaluations will allow us to determine whether implementing a business model for providing 5G network equipment installation services in Peru within the telecommunications sector is economically viable or not.
Therefore, based on the above, we can define that the main hypothesis of this article, which we will seek to confirm or reject, is that the implementation of a business model for the provision of 5G network equipment installation services in Peru is viable from an economic point of view.
On the other hand, the main contributions of this article are presented below.
- A business model for the 5G network equipment installation service and the design of a business structure based on this model are proposed. Various aspects are explored, such as external agents, market, marketing, organization and human resources, legal and juridical form, and the company’s economic and financial plan.
- Concepts from accounting and finance are used to examine the most significant financial indicators.
- The article sets out the necessary requirements for the business model to be viable.
Finally, this article adds to the current research on the services within the 5G network and the organizational structure in which the business model is executed. Furthermore, this article aligns with current trends, showing parallels with certain studies referenced in the next subsection.
The rest of the article is organized as follows. Section 2 presents the theoretical background of business models, their implementation, entrepreneurship, and related work. Section 3 provides the methodological framework for our article. Section 4 presents and discusses the main results obtained with a focus on defining, analyzing, and solving each aspect of the business model, as well as the results of economic and financial projections. Section 5 show the conclusions of the research. Finally, in Section 6, we describe the limitations and suggest of work for the future.
2. Theoretical Background
Throughout the evolution of telecommunications, business models have changed according to the generation of network technology. Therefore, the business model definition lacks a standardized definition, and different definitions have been adopted. Demil and Lecocq (2010) define a business model as a system of interdependent components, such as resources and competencies, organizations, customer value proposition, and costs and revenues. However, for the 5G network, Camps-Aragó et al. (2019) analyze the changes in telecommunications business models with the adoption of the 5G network and define the business model as an organization that creates, delivers, and captures value. Therefore, the business model is the logic through which a company can provide value within its service to its users. This enables the company to generate revenue and profit within the 5G network ecosystem. Furthermore, a business model is related to three strategic business processes: exploring and exploiting opportunities, co-creating and co-capturing value, and exploiting competitive advantages while delivering value to customers (Chesbrough 2010; Teece 2010; Zott and Amit 2010).
The implementation of many business models is done through entrepreneurship. Vettik-Leemet and Mets (2024) present a literature review on process models of entrepreneurship and innovation, focusing on the structuring and progress of the entrepreneurial process, as entrepreneurship is key to designing and implementing a business model. On the other hand, Acs et al. (2008) define entrepreneurship as a mechanism for economic development through employment, innovation, and welfare effects. Likewise, entrepreneurship refers to the process of creating, developing, and managing a business model. Therefore, entrepreneurship involves taking risks, identifying opportunities, managing resources to provide a service, and making profits by satisfying the needs of its customers (Moreno-Cardenas 2019). Furthermore, entrepreneurship is a function of the country and its level of economic development (Autio 2007). Consequently, Peru’s economy affects the dynamics of entrepreneurship. However, Peru has had a high level of implementation of business models through entrepreneurship in recent years. One out of every four Peruvians undertakes a given business model (Amorós and Bosma 2013). This index shows that the implementation of business models in emerging markets is twice as high as in developed markets due to the number of underserved needs and segments (Habiby and Coyle 2010). Likewise, Lima is a strategic place to establish a company, as it is favored by the economic and business advantages Peru’s capital offers (Vergara 2010).
On the other hand, there are several studies on business models and their implementation in Peru. Ruiz et al. (2016) explore social entrepreneurship in Peru, identifying a social divide and highlighting the concentration in the third sector in Lima. Although they highlight the importance of training, their analysis focuses on social rather than economic aspects. Canto et al. (2022) propose and analyze a business model in a commercial area that addresses challenges such as reducing market share. They present a Business-to-Consumer (B2C) marketplace specializing in clothing aimed at retailers and customers in Gamarra. In addition, Condezo et al. (2021) propose and analyze a business plan focused on an online holistic wellness platform, connecting individuals with professionals and providing tools to improve their overall well-being, including videos, virtual classes, and wellness products. Likewise, Contreras et al. (2021) propose and analyze a business model that addresses financial management issues for micro-enterprises and SMEs, offering an accessible platform with technologies such as Business Intelligence and Machine Learning to facilitate financial management and promote finance in business strategies. Although this research covers the value proposition, the business model, the design of the company structure, and the different aspects of the business model (business management, human resource management, finance and accounting, marketing, and operations management), and demonstrates the economic profitability of their proposed business model, it does not belong to the telecommunications and 5G network market. Based on the above, our work not only analyses a business model design and company structure in the telecommunications field focusing on 5G networks and focusing on the private sector in Peru but also assesses the economic feasibility of implementing it through a for-profit company. Our work addresses all business aspects.
Finally, Quesada et al. (2008) analyze a business model focused on digital telephony, emphasizing economic savings for businesses and households in national and international calls. In addition, they present an alternative to reduce telephony costs in Peru and address the telecommunications market. However, although this research analyzes the economic viability of the proposed business model conducted within the Peruvian telecommunications industry, it does not focus on 5G networks.
3. Methodology
The methodology followed in this article is based on the scientific method (Cohen 2011), whose approach consists of acquiring new knowledge through systematic and organized observation. It is also based on the methodology adopted by (Kaššaj and Peráček 2024). This article aims to analyze the strategic design of a business model for the provision of 5G network equipment installation services in Peru. The article is supported by statistical data on the deployment of 5G networks in Peru and the growth of the Peruvian population. The analysis of this data serves as the basis for the approach of a value proposition so that the description of the value proposition incorporates a configuration of the technical and administrative team for the implementation of the business model through a company, as well as the design of the business structure for this business model within the telecommunications industry in Peru and adapted to the 5G network (Al-Falahy and Alani 2017).
The business structure’s design for implementing the business model is based on the literature review on business management (Drucker 2012; Easterby-Smith et al. 2021; Lominé et al. 2019). Therefore, the business model analysis includes developing and analyzing seven important aspects to determine the feasibility of the proposed business model. These aspects mentioned are as follows. External agents, market, marketing, organizational design and HR.HH., legal and juridical form, economic and financial plan. The development of the external agents is based on PESTEL analysis (Yusop 2018) and Porter’s five forces (Michaux and Cadiat 2016), to determine the general and competitive environment facing the proposed company for implementing the business model. The information gathering is based on the Peruvian government databases of the OSIPTEL (Organismo Supervisor de Inversión Privada en Telecomunicaciones). The market development is based on the choice of the strategy that follows the business model and the analysis of TAM, SAM, and SOM techniques to determine the market demand (Pazos 2018). The collection of information on statistical data on the number of installations and services required by a mobile network operator in Peru has been obtained by one of the main network operators in the Peruvian territory; these network operators can be viewed in detail in the OSIPTEL database. Marketing development is based on the marketing strategy that follows the business model, focusing on four components. The marketing objective, segmentation strategies, marketing mix, and marketing plan budget (Best and Ibáñez 2007). Also, the development of this aspect analyses the budget required for the development of the strategic plan, so that the statistical database of the INEI (Instituto Nacional de Estadística e Informática) is used. The organizational and HR.HH. design development is based on developing a design in line with the proposed business model focused on the telecommunications industry and 5G networks in Peru. This design is based on the work of Navas and Guerras (1998). This design incorporates an organizational chart, the positions, functions of the positions, and the overall spending budget. The development of the legal form is based on the choice of the legal and juridical form that the business model should adopt for its implementation based on the law of capital companies of the government of Peru. The law is extracted from the Peruvian government database. The development of the economic and financial plan is based on the choice of the type of investment for implementing the business model and the choice of own or third-party financing. The development of this plan is based on the strategic importance of financial planning (Correa et al. 2010). The development and analysis of each of the aspects of the business model is carried out within the Peruvian territory, in the telecommunications industry, with a focus on 5G networks and based on the concepts of business management. These concepts cover business management, human resource management, finance and accounting, marketing, and operations management (Drucker 2012; Easterby-Smith et al. 2021; Lominé et al. 2019). Finally, numerical calculations and economic and financial projections of the business model are performed to determine its economic viability for implementation.
In general, the research methodology followed in the article has a wide variety of sources, such as institutions’ databases within Peru, including legislative documents, statistical data, and official reports. The exploration of the environment of the telecommunications industry and the implementation of a business model through entrepreneurship guarantees a comprehensive view, as well as the identification of the opportunities and challenges with the deployment of 5G networks in developing countries, as is the case of Peru. The processing of the article is based on the methods already listed above. We use logic to understand legal order and management practices because these methods are universal and applicable in different sciences. Also, the methods of logic establish human reasoning (Knapp 2003). Based on the above, the development of the article involved an analysis of each of the aspects of the business model, from the theoretical concepts of business management, telecommunications, and 5G networks, as well as the synthesis of different sources of information. In addition, the legislative analysis was conducted (for the determination of the legal and juridical form the business model should take), the documentary research method (whose aim is the acquisition and analysis of existing documents and data), and finally, the financial analysis (analyzing the financial indicators of the results of economic and financial projections). Therefore, these methods and materials give us an overview of the opportunities and threats the telecommunications market offers in Peru, focusing on 5G networks. For a better understanding, the findings obtained are described in detail in the following sections, from the business model and the value proposition to the projections of the economic and financial results.
4. Results and Discussion
In this section, we present the main results of the article, which are divided into three subsections. First, we present the business model’s description based on the value proposition and the business structure’s strategic design. Secondly, we present the overall results, which incorporate the development and analysis of each aspect of the business model. Third, we show the results of the economic and financial projections to determine the business model’s viability.
4.1. Description of the Business Model
We describe the most important aspects of a business model based on a business idea (value proposition). A business model is proposed for a company that provides technical services to network operators to install 5G network equipment. The service provided is only oriented to a single network operator, so there is no competition between operators. The business model is based on observation, the over-deployment of the 5G network, and the absence of business models and companies oriented towards this technology in Peru; consequently, the business idea arises, and a value proposition is proposed. The value proposition is based on the experience (technical knowledge of 5G networks and business administration) and specialization (acquired outside their country of origin) of a team of professionals proposed so that the company, through them, offers the service to network operators and carries out the administration in the different departments of the company. Therefore, the business model and the business structure (company) design start with the value proposition, specialization, and expertise (Liu et al. 2021). On the other hand, for the design of the business structure, we have employed the concepts of business management (Lominé et al. 2019), which encompasses business organization and environment, marketing, finance and accounts, human resources management, and operational management. For this reason, the business design encompasses different aspects of the proposed business model, as shown in Figure 1.
These aspects are the following: the external agents, market, marketing, organizational and HR.HH, legal and juridical plan, and economic and financial plan. In Figure 2, each of these aspects is seen in detail.
4.2. Overall Results
In this section, we present the design of the company, description, and analysis of the aspects of the business model based on the existing literature in this field (Drucker 2012; Easterby-Smith et al. 2021; Lominé et al. 2019).
4.2.1. External Agents
The external analysis of the Peruvian market is divided into the general and competitive environment. Thus, on the one hand, the political, economic, social, technological, ecological, and legal factors influencing Peru are analyzed and evaluated based on the PESTEL analysis (Yusop 2018). Political instability generates a negative perception of investment despite overcoming the COVID-19 crisis. However, the external economy has shown sustained growth. In addition, the adoption of internet-connected devices has increased, driving network upgrades by mobile network operators. Also, as the 5G network is being implemented, the government is promoting policies to reduce the connectivity gap.
On the other hand, the analysis of the competitive environment is based on Porter’s 5 Forces Model (Michaux and Cadiat 2016), which evaluates the dynamics of the Peruvian telecommunications market, the threat of new competitors, the threat of substitute services, and the bargaining power with suppliers, as well as the bargaining power with customers. It shows that the 5G data network infrastructure growth trend factor represents the most incredible opportunity, while the customer bargaining power factor represents the most significant threat.
4.2.2. Market
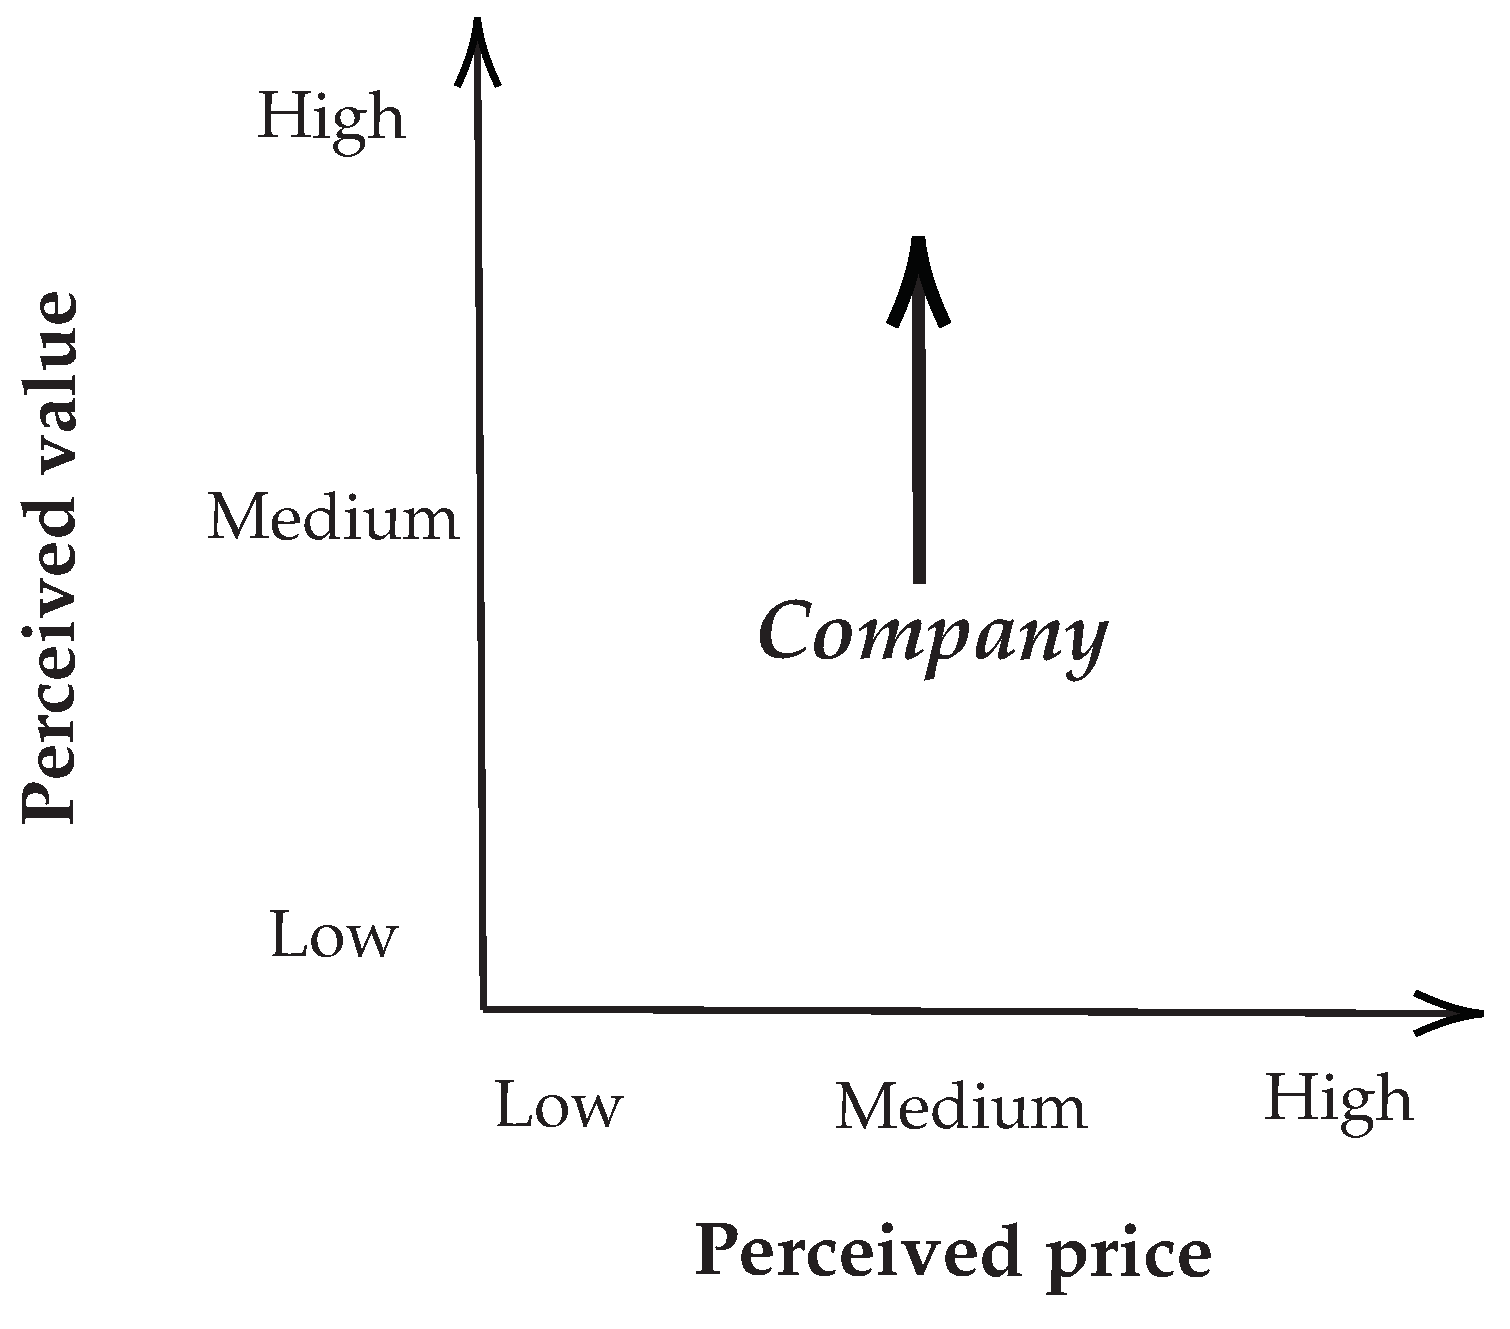
The market analysis is carried out with a focus on providing technical services for installing 5G network equipment. The choice of the differentiation strategy decision is based on the proposed technical team (Johnson et al. 2006; Navas and Guerras 1998), whose specialization and experience in 5G technology obtained abroad is high, which represents a difference from the competition. Consequently, the competitive advantage lies in the quality of services. In addition, the other part of the management team has a background in the business environment and experience in data networks. Figure 3 shows the competitive path that the company will follow based on Bowman’s clock (Bowman and Faulkner 1997); as the price of the service is set by the operator, the company seeks to offer a higher quality of service in its services, differentiating itself from the competition.
On the other hand, the target customer profile (network operators) who offer Internet and telephone services at the corporate level has been identified and defined. These customers have a high need for services in Metropolitan Lima. This situation represents market opportunities. Therefore, we determined a market share projection based on information provided by a Peruvian mobile network operator. The market share calculation is obtained after applying the TAM (Total Addressable Market), SAM (Serviceable Available Market), and SOM (Serviceable Obtainable Market) techniques (Pazos 2018). This technique lets us know a network operator’s daily, monthly, and annual movements of installation services. The values of TAM, SAM, and SOM of the most important network operators in the country, can be seen in Table 1. So, we have 2880 network equipment installations per year, 1152 installations per year, and finally, 756 installations per year; these values represent the TAM, SAM, and SOM and the short and medium-term market. These data will be used in later sections.
4.2.3. Marketing
The marketing strategy is structured in four essential components: marketing objective, segmentation strategies, marketing mix, and marketing plan budget (Best and Ibáñez 2007).
So, first of all, the marketing objective is to position the company’s brand based on the proposed business model as unique in the market. Secondly, the segmentation strategy focuses on network operators based on geographic, demographic, psychographic, and behavioral segmentation in the Peruvian territory since Peru exhibits a significant economic centralization in its capital, the city of Lima (Caro 2019), as can be seen in Figure 4, which shows the economic concentration of the different regions of Peru. Therefore, Lima is the choice following the segmentation analysis.
Thirdly, the marketing mix is structured based on the 4Ps of marketing, which comprise product/service, price, distribution, and promotion (Galarza et al. 2021). So, the service offered is the quick installation of 5G network equipment with a high quality of service, while the pricing structure is designed based on the six steps involved in each installation, detailed in Table 2. Likewise, the company’s distribution fixation is planned in locations close to the headquarters of network operators and corporate areas. Likewise, promotion encompasses advertising in print media, social media platforms, newsletters, and public relations, allowing a solid and recognizable presence in the market.
Fourthly, the marketing plan budget is set based on what is required for the company to become more visible. A higher initial investment is allocated due to the company’s launch, ensuring a strategic entry into the market. The marketing budget determined is shown in detail in Table 3.
4.2.4. Organizational Design and HR.HH.
A company design is proposed with a strategic approach based on the work of Navas and Guerras (1998), which is adapted to the dynamics of the sector and customers’ precise needs. This design is structured in four main parts.
Firstly, we propose a structure and organizational chart that adjusts for growth with a 3-year projection. Likewise, this proposal establishes hierarchical levels, departments, and roles, ensuring flexibility to market changes, as shown in Figure 5.
Secondly, human resource management is addressed as a key part (Schneider and Bowen 1993), and roles are defined. The general manager leads the overall strategy and oversees key departments involving coordination, financial planning, and strategic decision-making. The director is responsible for accounting, customer relationship management, and human resources, ensuring comprehensive and effective management, while the operations director oversees technical staff, 5G network equipment installation, and growth strategy development; similarly, the commercial director resolves commercial and marketing challenges; and finally, installation technicians are responsible for installation, configuration, and quality of service management to ensure compliance with quality and security standards.
Thirdly, based on Table 1, the number of staff required and the corresponding annual salaries are sized and presented so that the budget can be seen in Table 4.
Finally, the human resources policies and behavioral orientation that guide the company’s operation are described. Competence development focuses on the acquisition of qualified talent and the continuous development of staff competencies through recruitment, training, and compensation for success in the jobs offered by the company (Rueda et al. 2015). Recruitment is developed through platforms such as LinkedIn, prioritizing qualifications and experience in telecommunications, while training is done through internal training focused on procedures and processes, given their previous experience. Social interaction and job satisfaction programs are also implemented. In the same way, bonuses linked to the achievement or overcoming of training are established, and the participation of employees in the company’s decision-making is encouraged. On the other hand, information systems are used to analyze customer behavior and preferences, optimize marketing strategies and process improvement, and continuously improve the provision of network equipment installation services.
4.2.5. Legal and Juridical Form
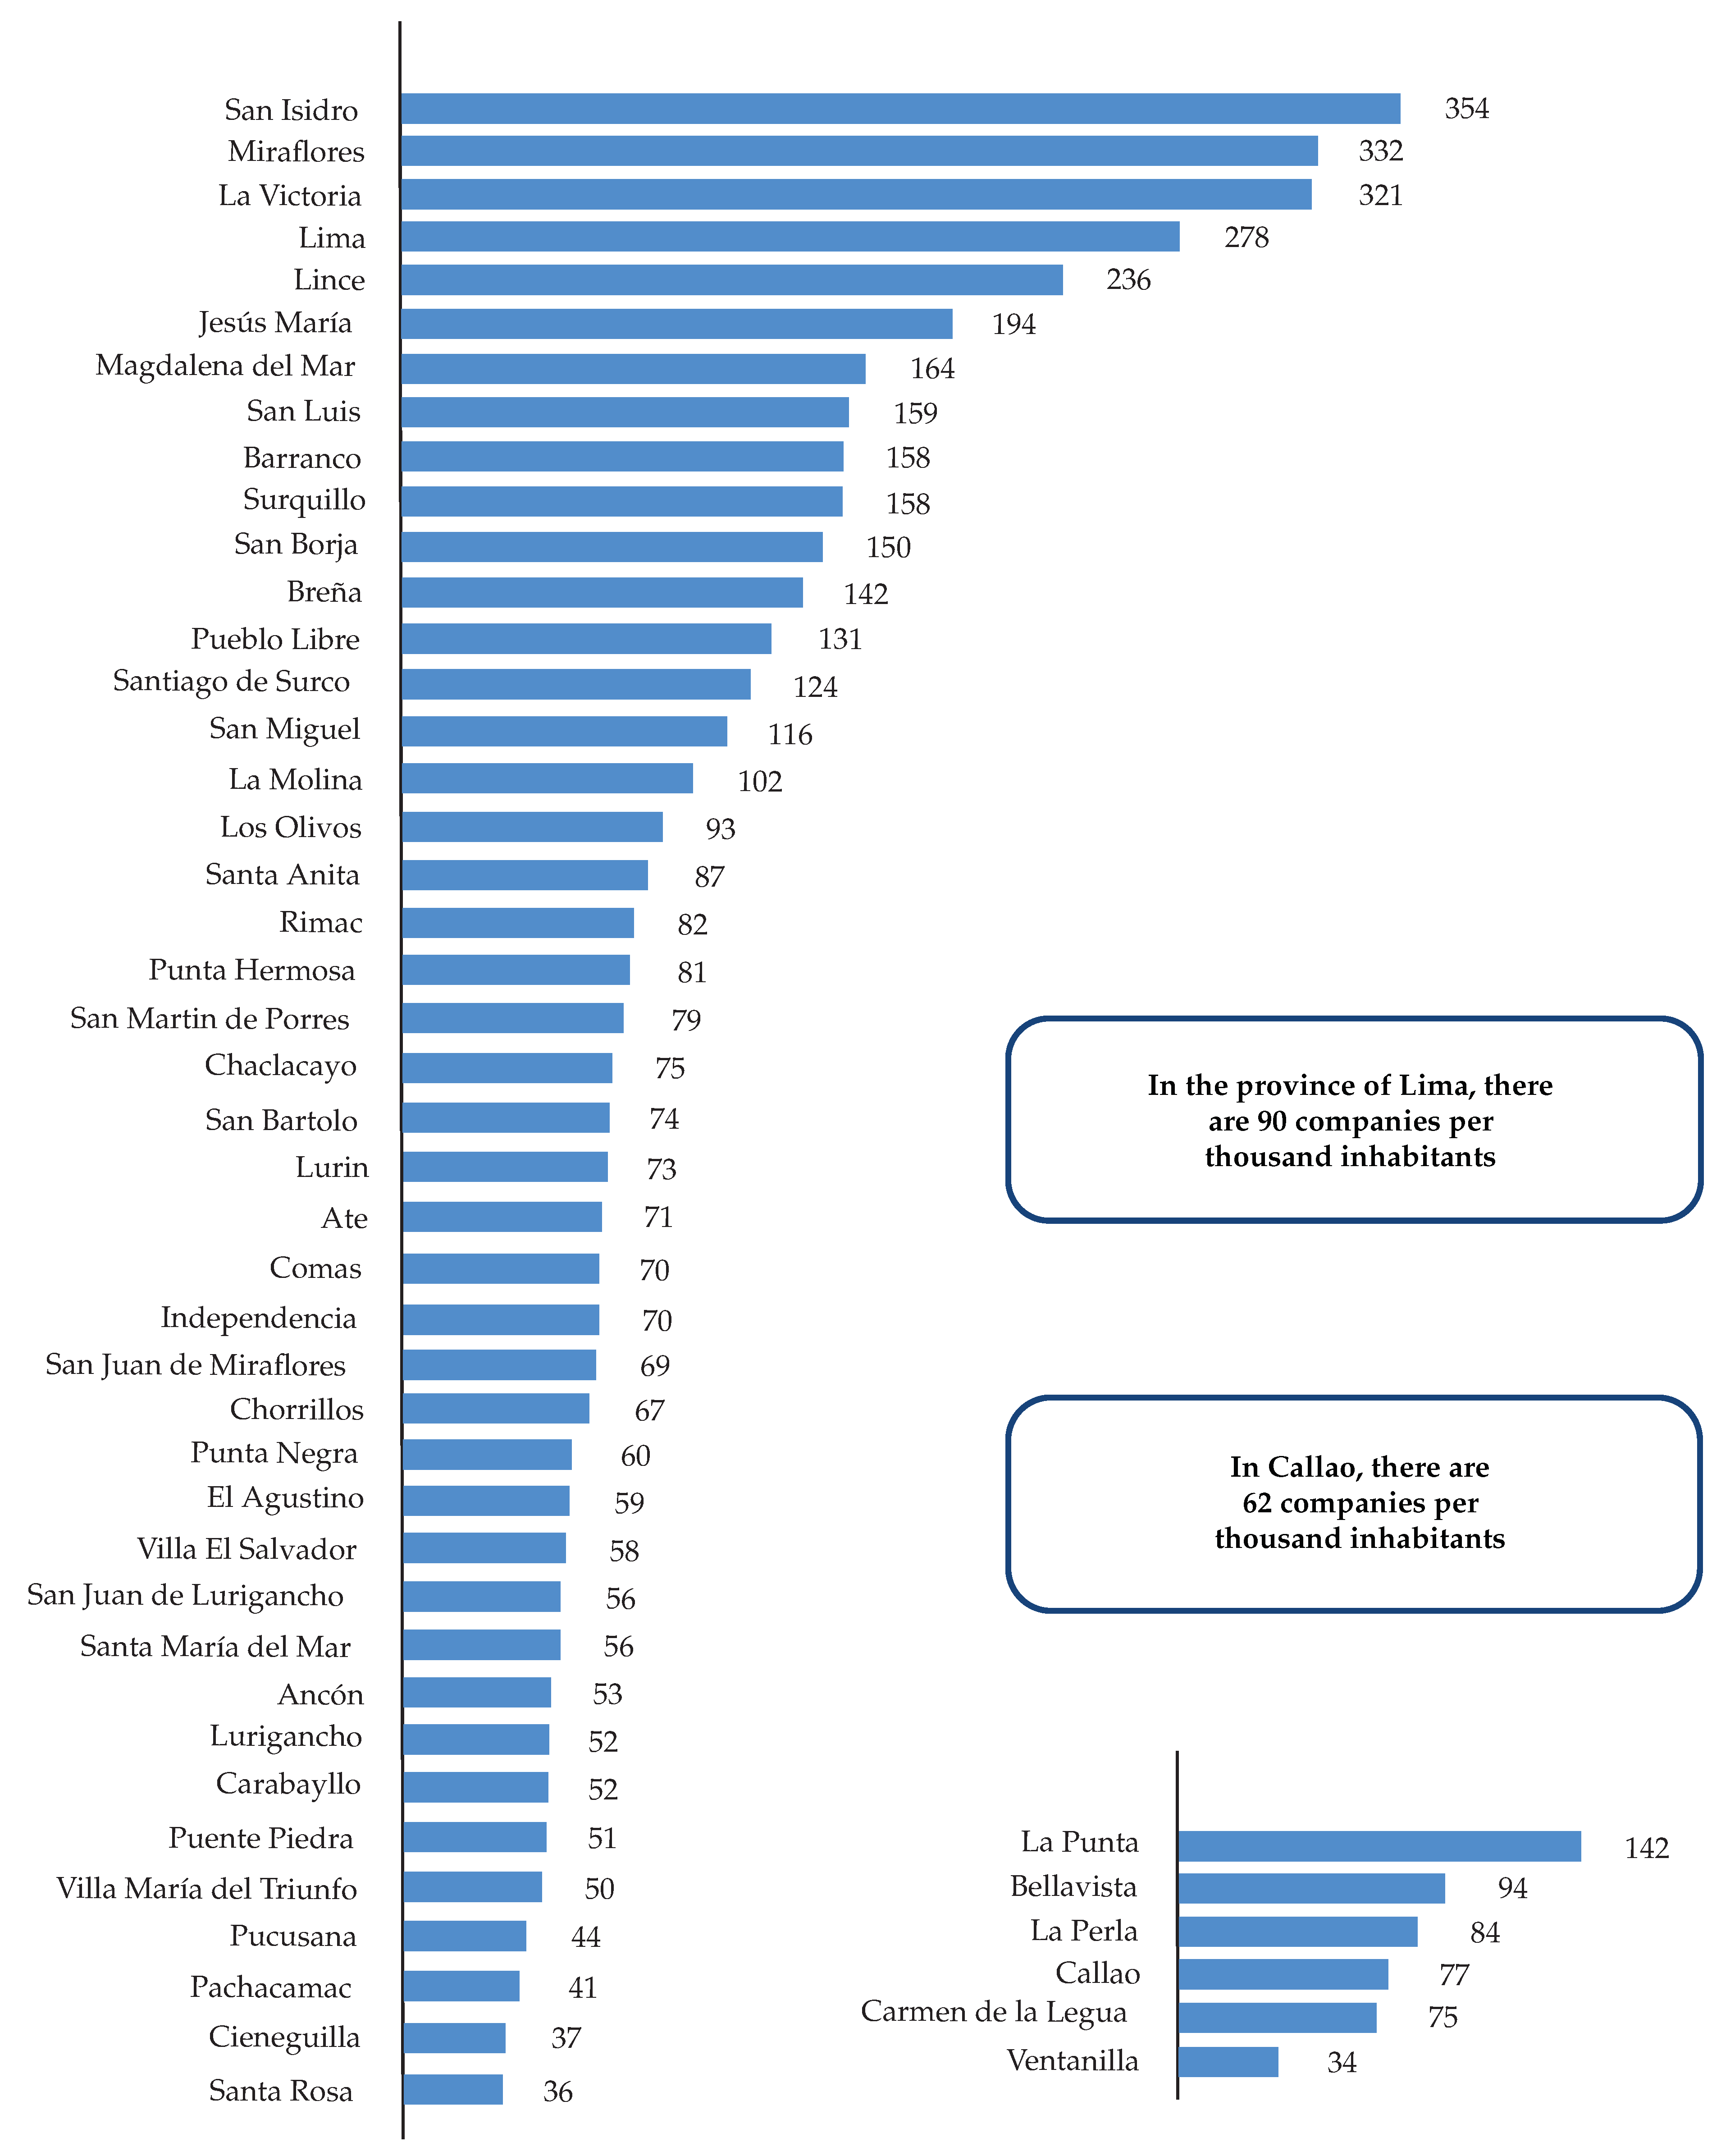
We define the legal form for the proposed company as a Sociedad Anónima Cerrada (S.A.C.) according to the General Law of Companies in Peru (Salas 2017), as it meets the legal requirements, such as the number of partners, as well as the required investment in the company as the company’s capital. In addition, this legal form offers asset protection to the partners and facilitates the obtaining of credit and the hiring of labor. On the other hand, the business name and logo of the proposed company reflect the industry to which it belongs and which, in addition, has greater recognition in the market; the business name and logo are kept anonymous for the authors’ legal reasons. Finally, the name registration with the National Superintendence of Public Registries (SUNARP) is concluded. The company’s location is established in Surquillo, Lima, Peru because the headquarters of the most important network operators in the country and the concentration of business density in the city of Lima are located in this district, as shown in Figure 6.
4.2.6. Economic and Financial Plan
An economic and financial plan is presented based on the aspects of the business model described above. The economic and financial plan for the implementation of the company requires an investment in fixed assets and an investment in current assets. At the same time, the financing part is based on its resources. The form of financing determines the reduction of the complexity of the article. In Table 5, the investment in fixed and current assets can be seen in a generalized way. The investments in fixed assets include intangible assets as well as tangible fixed assets, which are described in detail in Table A1, Appendix A.
The investment for implementing the business model through the company is financed with the partners’ resources; for this case, six partners are fixed, each with a contribution of 100,000.00 m.u., totaling an initial capital of 600,000.00 m.u. The establishment of 6 partners is because the company is constituted as a SAC in Peru, so it complies with the law of capital company, which demands requirements such as having at least two partners; in addition, this legal form, according to the law does not demand a minimum capital.
Figure 6.
Business Density, 2014. (Per thousand inhabitants).

4.3. Results of the Economic and Financial Projections
In this section, we present the numerical results of the economic and financial projections obtained for the business model. The projections of the numerical results are set for the first three years of the company’s activity because of the changing telecommunications market. Likewise, the revenue projections are based on Table 1, Section 4.2.2 and Table 2, Section 4.2.3, while the expenditure projections are shown in Table A2, Appendix B these results were obtained based on Table 3, Section 4.2.3 and Table 4, Section 4.2.4.
On the other hand, Appendix B presents the numerical results of the accounting and financial projections that are complementary to those presented in this section.
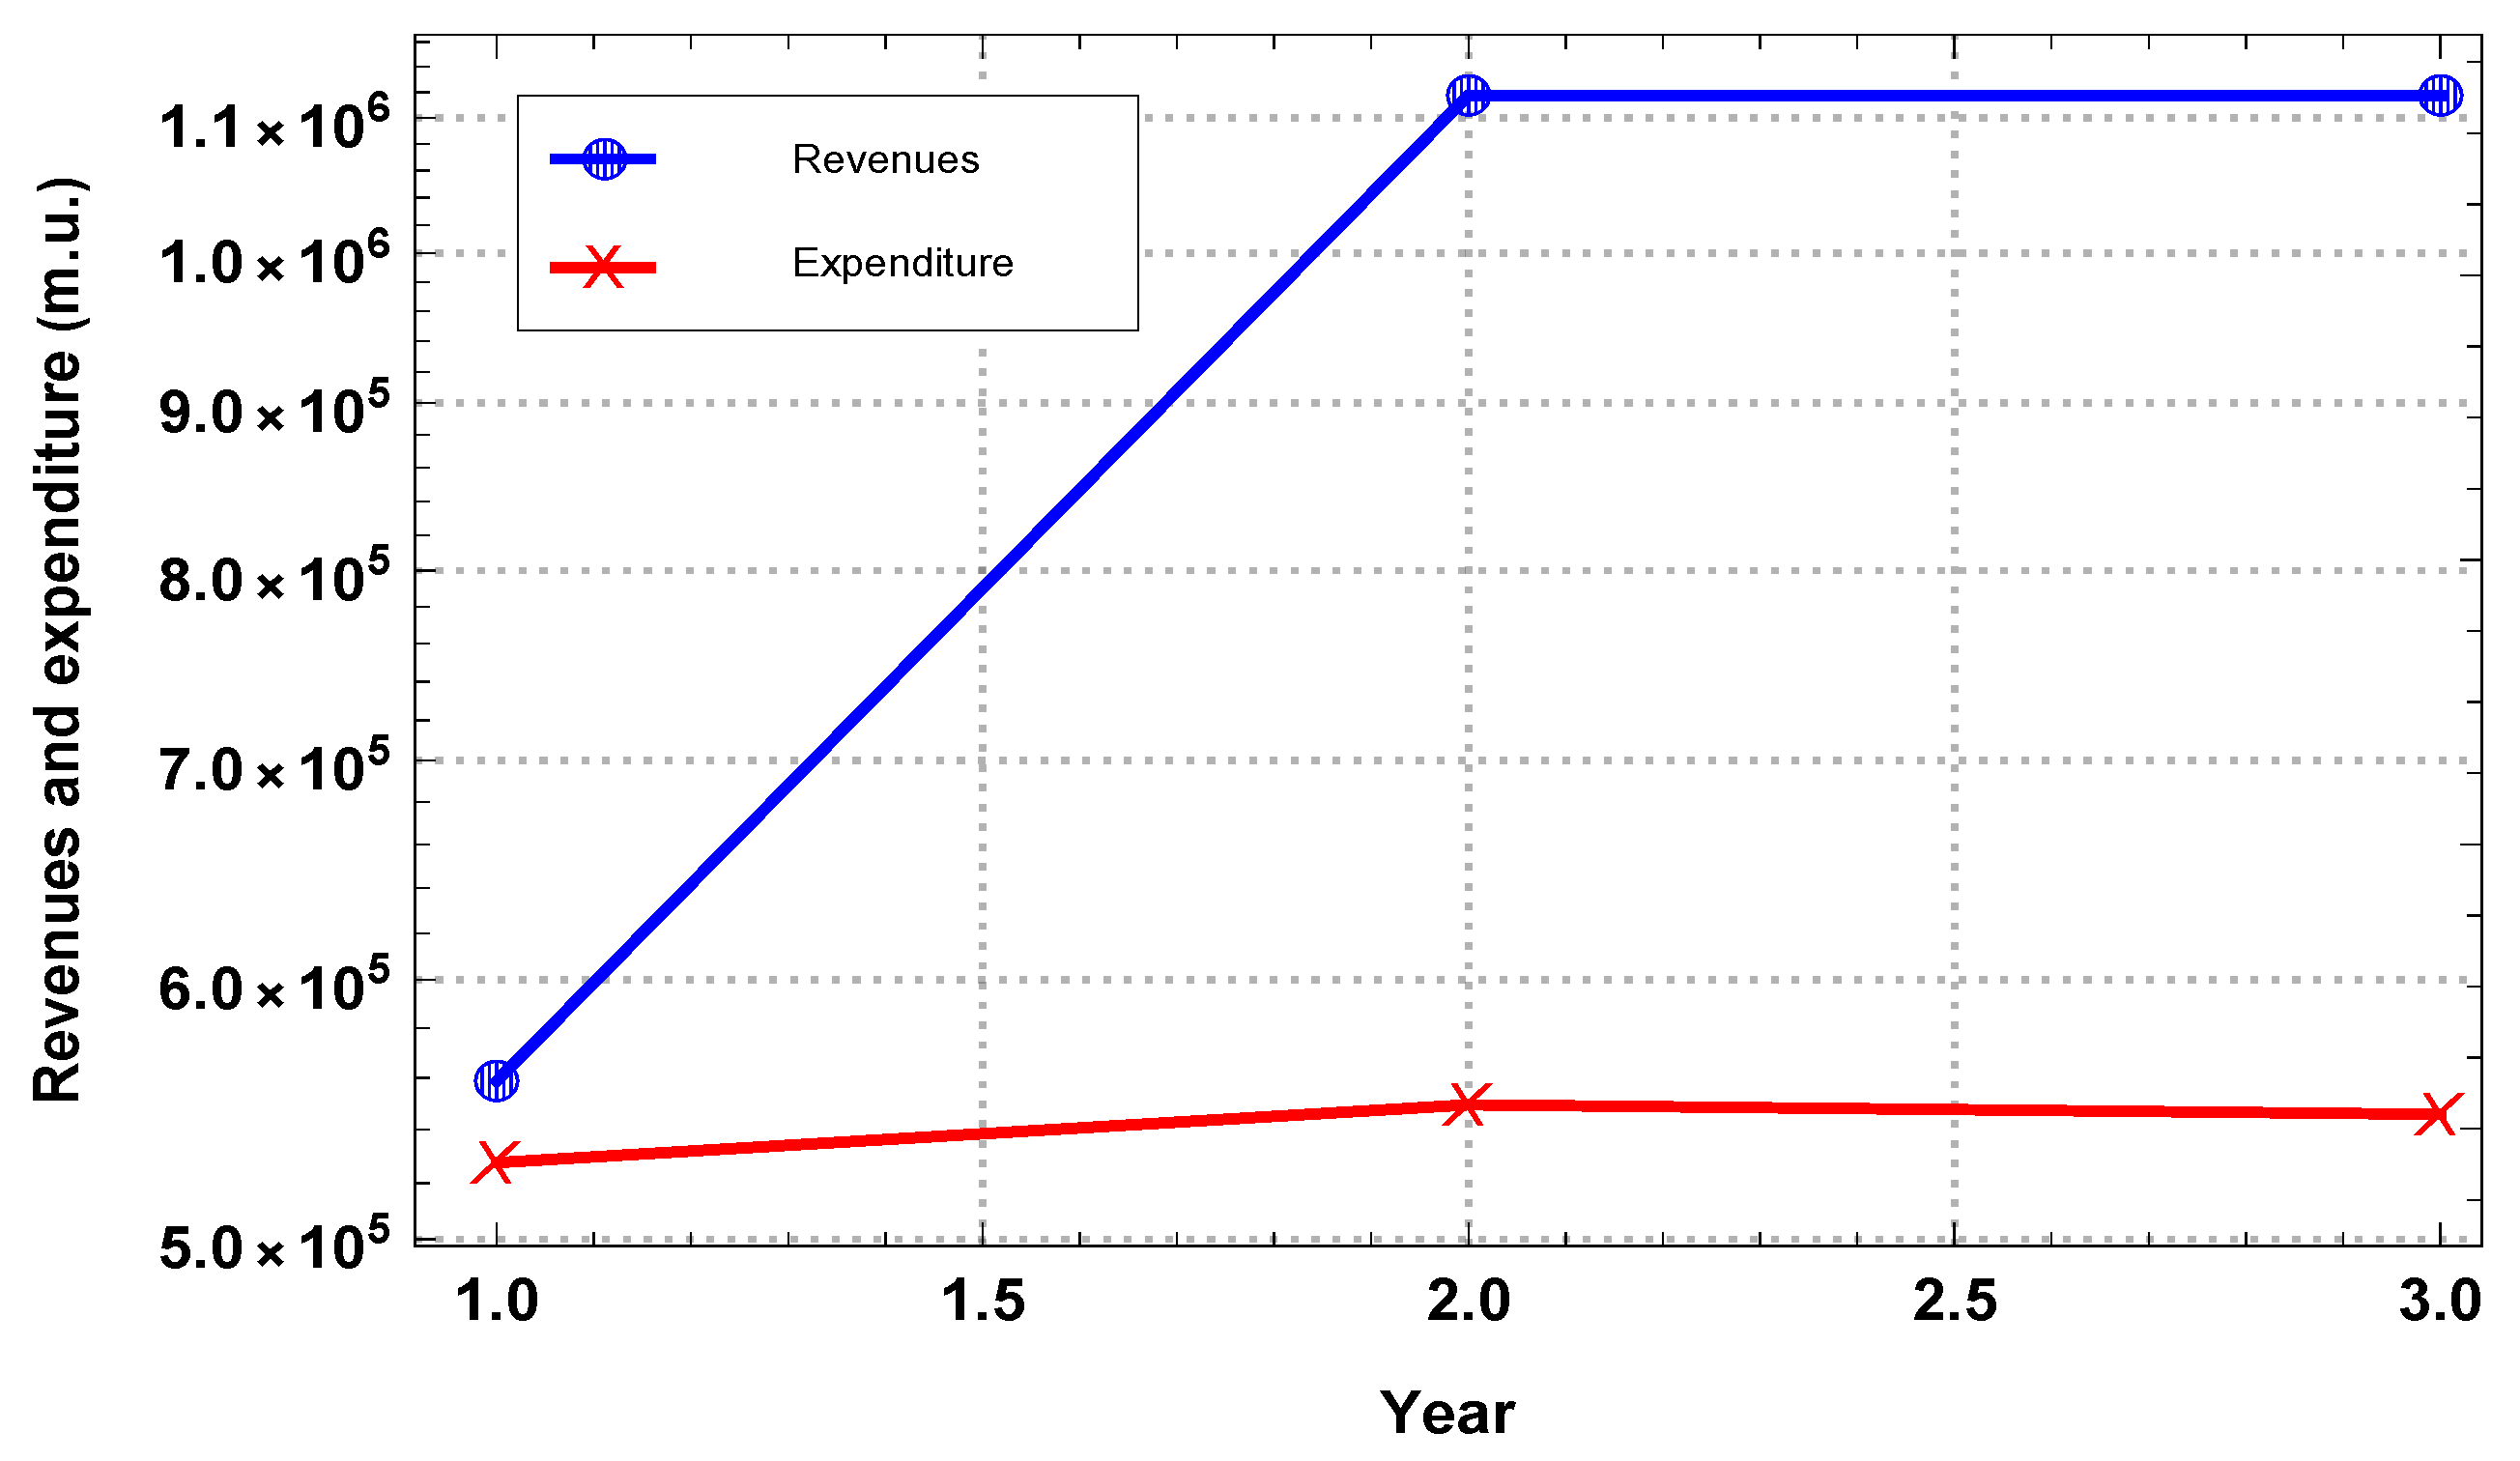
4.3.1. Projections of Revenues and Expenditures
Figure 7 shows the revenues and expenditures projections as a time function. We can observe that the revenues increases as time increases; specifically, it increases by 50% in years 2 and 3 concerning year 1. While the expenditures experience a slight growth as time increases, the costs remain below the revenues; therefore, this result shows that a more significant profit is obtained from the company’s activity.
4.3.2. Benefit
In Figure 8, we can observe the projections of gross profit (BAI) and net profit. The BAI, as well as the net profit, has a positive increase between year one and year 2, while it decreases slightly for year 3. This result is consistent because, for year 3, the operating expenditures resulted from increased demand for the service offered work. Also, we can observe that the net profit is positive in all three years; this result makes sense, as revenues are higher than expenditures, as shown in Figure 7.
4.3.3. Working Capital and Ratios
In Table 6, we can see that the working capital in the first three years of the company’s activity is positive; this result shows financial stability because it demonstrates that the current assets are more than sufficient to meet the short-term debts. The company will have a surplus once all its payment obligations have been settled in the short term.
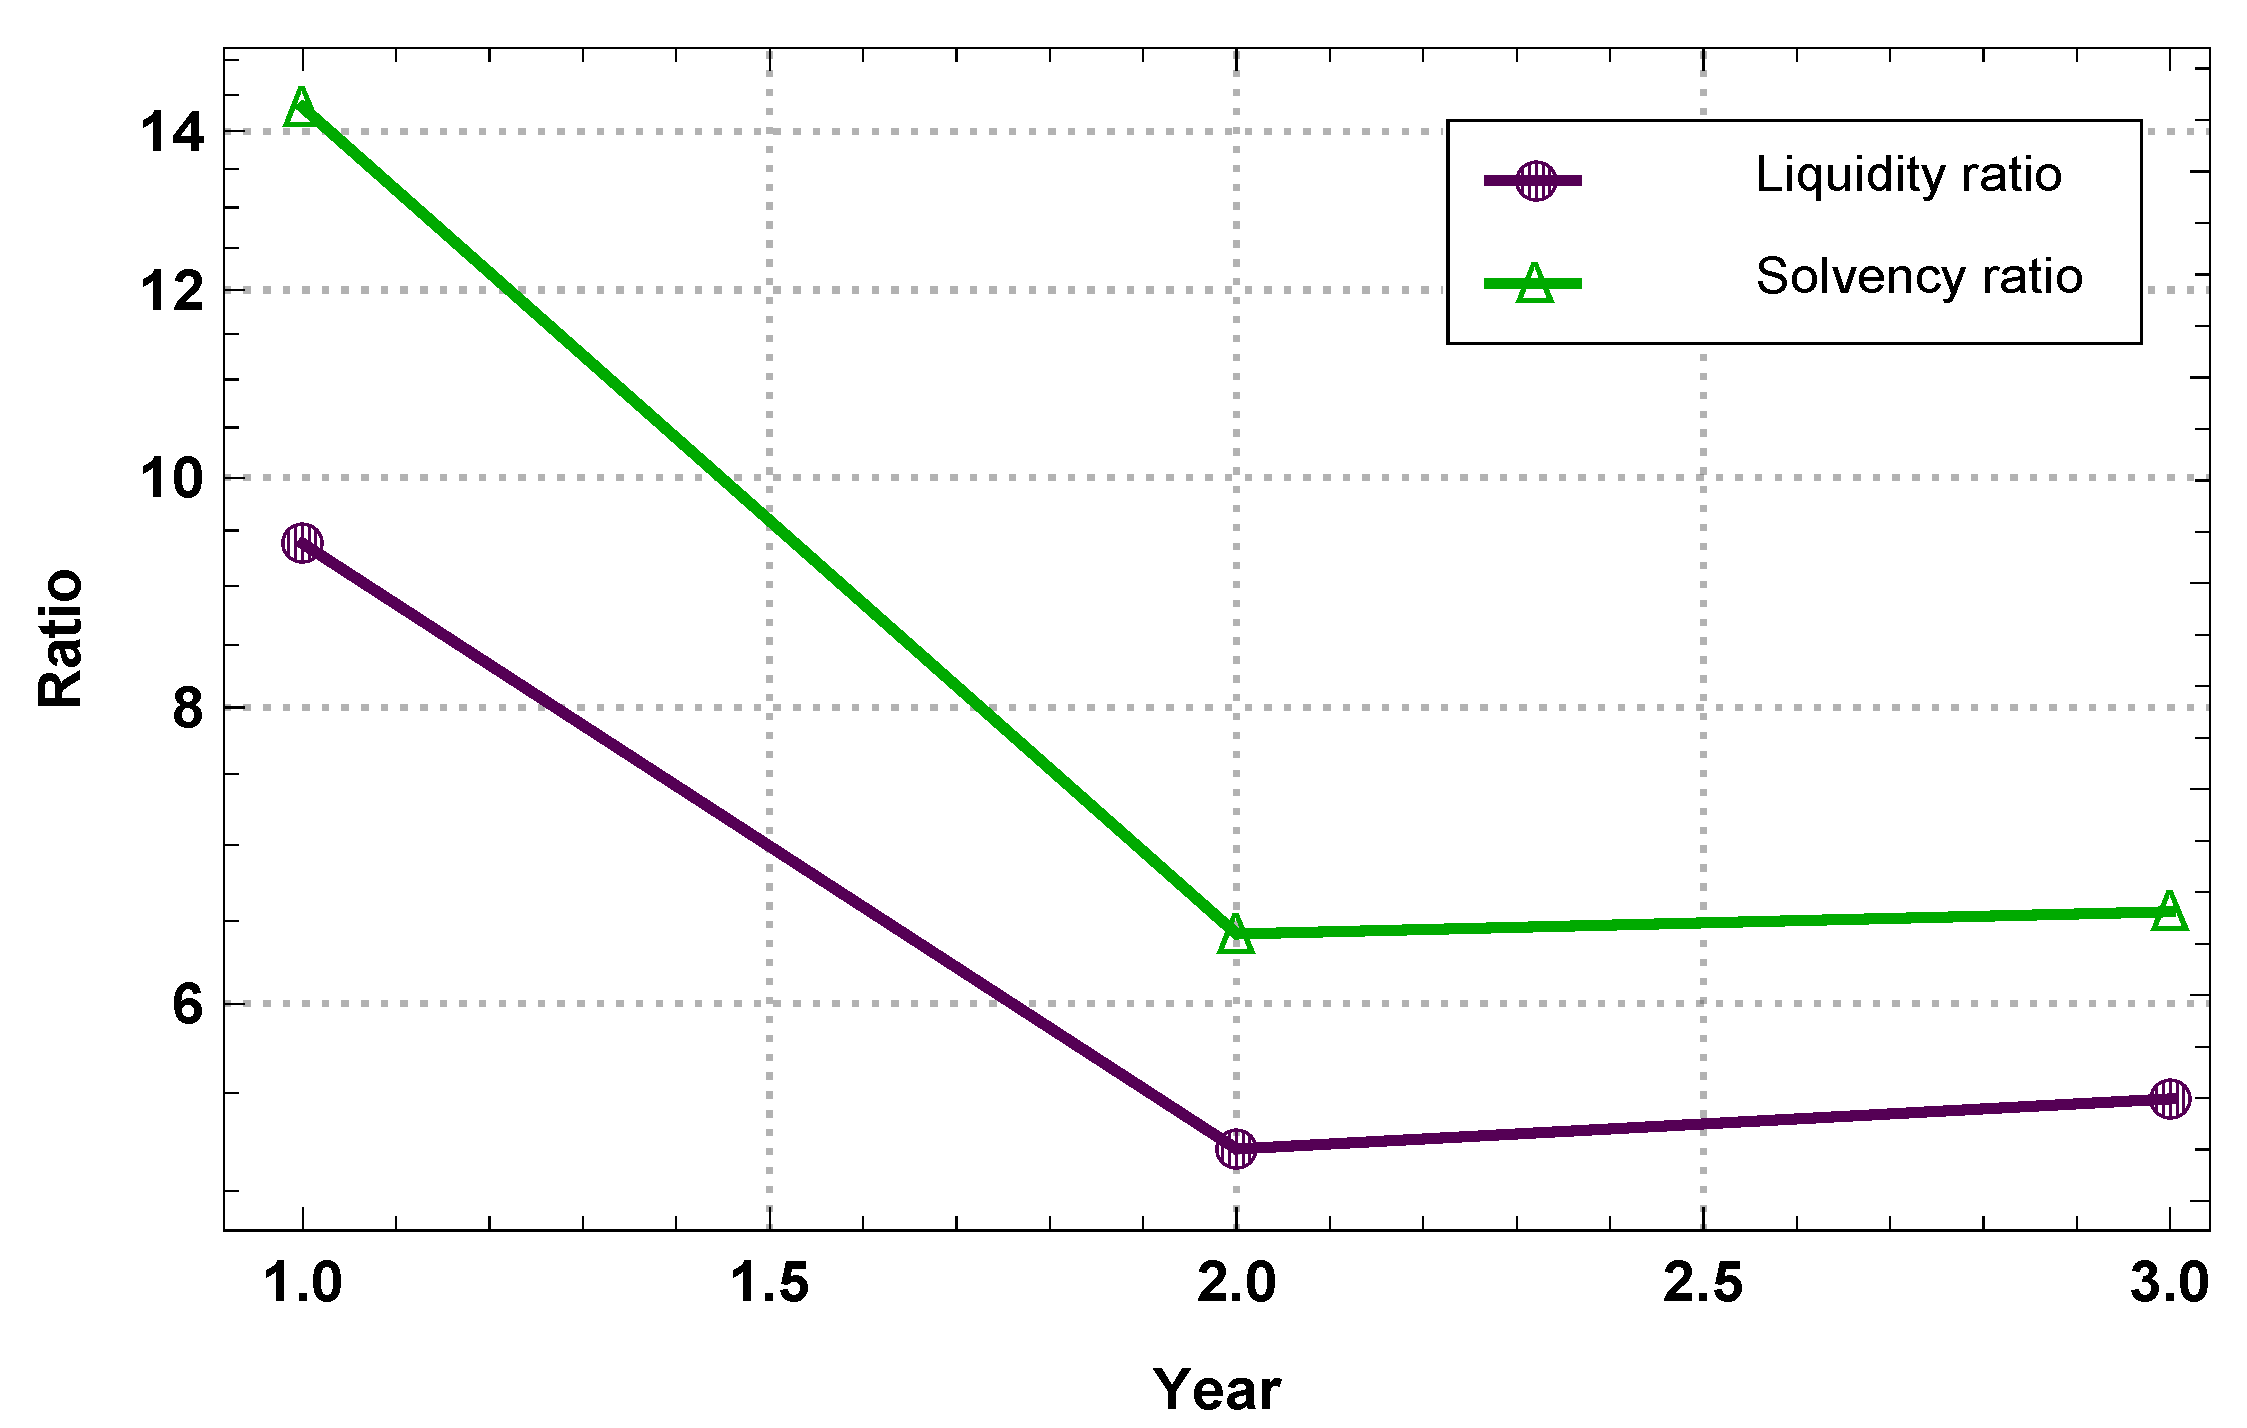
4.3.4. Liquidity and Solvency Ratios
Figure 9 shows the behavior of the liquidity and solvency ratios in the first three years of the company’s activity. We can observe that the liquidity ratio decreases from year 1 to year 2. The company would incur excess liquidity as its current assets are more than nine times its current liabilities (see Table A4 and Table A5, Appendix B). It would be losing profitability in its current assets, so it would be required to analyze its existing assets to seek greater profitability. Likewise, we can observe that the solvency ratio follows a similar behavior to the liquidity ratio; however, as the solvency ratio is greater than 1, the company can meet its payment obligations at a given moment.
4.3.5. Economic and Financial Profitability
Figure 10 shows the behavior of the profitability of assets (ROA) and profitability of equity (ROE) in the first three years of the company’s activity. We can observe that ROA increases in the first three years and is positive; this result makes sense since there is an increase in sales, and, therefore, the company can generate revenues from assets. Likewise, in the same way as ROA, ROE increases and is positive. This result shows that the capital invested by the partners generates positive net profits. These ratios lead us to the conclusion that the business model is profitable.
4.3.6. NPV y IRR
Finally, based on Table A9, Appendix B, the initial investment for year 0 is 312,544.00 m.u., and with an opportunity cost of 10% for the implementation of the company, an NPV of 146,931.02 m.u. is calculated, and an IRR of 26%. These results show that implementing the business model through the proposed enterprise is economically viable. This result shows that the investment will be recovered and that a profit of 146,931.02 m.u. will be obtained. The opportunity cost is based on other entrepreneurial projects in the telecommunications sector in the Peruvian market.
These results suggest that the analysis of every aspect of the design of the proposed company structure is justified. In addition, the value proposition of experience and specialization in 5G networks is key to the proposed business model. Also, as the Peruvian market is growing about 5G networks at full speed, most companies focus on 3G and 4G networks and only some on 5G networks; therefore, the proposed business model makes sense. Complementary, the following is concluded for each aspect of the company structure design: In external agents, the increase in device interconnection and government involvement influence the feasibility of implementing the proposed business model. In the market, the amount of 5G network equipment installation work demanded by the Peruvian telecommunications market influences the economic revenues, which, in turn, influences the company’s profits. In marketing, segmentation strategies, the marketing mix, and the budget of the marketing plan provide positive results, thus influencing the final results. In the organizational design and HR.HH., the design of the organizational structure is feasible, as the personnel cost budget would have little influence on the final economic results. In the economic-financial plan, the financing for implementing the business model is feasible, as the initial investment would be recovered with the results of the economic-financial projections. Finally, implementing the business model would have a positive social impact, as it would generate jobs and contribute to the country’s economic development.
In summary, the financial results of the projections show that the business model’s implementation, based on the value proposition, experience, and specialization, is economically viable. Therefore, the planted hypothesis is confirmed, i.e., the implementation of a business model for the provision of 5G network equipment installation services in Peru is viable from an economic point of view. Furthermore, the results show that the strategic design for the business model is appropriate in the Peruvian market from a financial point of view.
5. Conclusions
The article investigates and analyses a business model for providing 5G network equipment installation services based on a value proposition, experience, and specialization in 5G networks. In addition, a business structure design for implementing the business model is proposed, as well as the evaluation of economic projections and financial indicators. The business model proposes technical services for installing 5G network equipment exclusively for one network operator, avoiding conflict of interests and competencies between them. Aspects in the design of the company structure are addressed, such as external agents, marketing, organization, human resources, legal form, and economic and financial plan. The results reveal that an NPV of 146,931.02 monetary units is obtained so that both the proposed business model and the design of the company structure are economically viable and support its implementation. These results justify the design of the proposed company structure based on the value proposition of experience and specialization in 5G networks in the growing Peruvian market. The viability of this business model is supported by different reasons, such as government involvement in promoting the deployment of 5G networks, increased demand for 5G network equipment installation services, positive results in the marketing plan, organizational design, and management of personnel costs, the feasibility of the financial and economic plan. Therefore, the planted hypothesis is confirmed, i.e., the implementation of a business model for the provision of 5G network equipment installation services in Peru is viable from an economic point of view. Finally, implementing the business model would have a positive impact on society through job creation and development in the country’s economy. Overall, these results suggest that implementing the business model through the proposed company is economically viable, allowing the company’s and the service’s coexistence.
This article comprehensively analyzes the business model for 5G network equipment installation services.
6. Limitations and Future Research
This article only focuses on analyzing a model for providing a single service: installing 5G network equipment within the network operator’s premises and the premises of the network operator’s corporate customers. Thus, it remains to explore the feasibility of models offering multiple services, such as preventive maintenance, corrective maintenance, and design consultancy. Also, as the analysis of the model in this article is developed in Lima city and on fiber optic links, this would mean that in future research, an analysis could be carried out not only for the city of Lima but also for other major cities in the country. This analysis could be developed in proportion to the progress of deploying 5G networks throughout the Peruvian territory. Finally, models for the provision of services will be analyzed not only in fiber optics but also in microwave links or wireless links. The results obtained from these investigations can be compared with the results of this article.
Author Contributions
Conceptualization, E.M.-C.; Validation, E.M.-C.; Formal analysis, E.M.-C. and Y.M. and A.I.B.-L.; Investigation, E.M.-C. and Y.M. and A.I.B.-L.; Writing—original draft, E.M.-C. and Y.M.; Writing—review and editing, E.M.-C. and A.I.B.-L. All authors have read and agreed to the published version of the manuscript.
Funding
The authors received no financial support for the research, authorship, and/or publication of this manuscript.
Institutional Review Board Statement
Not applicable.
Informed Consent Statement
Not applicable.
Data Availability Statement
Data legislation and information available online at www.gob.pe, www.gob.pe/osiptel and www.gob.pe/inei/ (accessed on 1 November 2022).
Conflicts of Interest
The authors declare no potential conflicts of interest.
Appendix A. Investments in Fixed Assets

Table A1.
Investments in fixed assets detailed.
| Price (m.u.) | Quantity (und.) | TOTAL (m.u.) | |||
|---|---|---|---|---|---|
| Intangible | Computer | SecureCRT | 0.00 | 3 | |
| assets | applications | TFGEN | 30.00 | 3 | 10,485.00 |
| SAP | 10,395.00 | 1 | |||
| Desks | 500.00 | 6 | |||
| Chairs | 400.00 | 6 | |||
| Cupboard | 400.00 | 2 | |||
| Furniture | Office shelving | 380.00 | 3 | 9790.00 | |
| Mesa | 700.00 | 1 | |||
| Waste bins | 50.00 | 5 | |||
| Chests of drawers | 500.00 | 3 | |||
| Computer | Computers | 3000.00 | 6 | ||
| equipment | Printers | 930.00 | 2 | 24,060.00 | |
| Mobile phones | 700.00 | 6 | |||
| Tangible fixed | Multimeter | 200.00 | 3 | ||
| assets | Tester | 36.00 | 3 | ||
| Labeller | 160.00 | 2 | |||
| Tool kit | 160.00 | 3 | |||
| Work | Huincha | 23.00 | 3 | 2309.00 | |
| tools | Torch | 50.00 | 3 | ||
| Large scissors | 25.00 | 3 | |||
| Brush | 17.00 | 3 | |||
| Crimping | 120.00 | 3 | |||
| Tool box | 32.00 | 3 | |||
| Transport elements | Minibus (Vehicle) | 57,750.00 | 2 | 115,500.00 | |
| Air conditioning system | 3200.00 | 3 | |||
| Refurbishment | Lighting system | 200.00 | 4 | 150,400.00 | |
| Other (refurbishment) | 140,000.00 | 1 | |||
Appendix B. Numerical Results of the Complementary Projections
Table A2.
Projection of the profit and loss account for years 1, 2, and 3.
| Expenditure | Year 1 | Year 2 | Year 3 |
|---|---|---|---|
| Staff (m.u.) | 318,000.00 | 354,000.00 | 354,000.00 |
| Marketing (m.u.) | 109,000.00 | 82,000.00 | 65,000.00 |
| Rental (m.u.) | 87,780.00 | 97,020.00 | 106,260.00 |
| Supplies (m.u.) | 9600.00 | 13,200.00 | 16,800.00 |
| Office cleaning (m.u.) | 2832.00 | 3312.00 | 3792.00 |
| Operating Licence(m.u.) | 414.40 | 0.00 | 0.00 |
| TOTAL (m.u.) | 527,626.40 | 549,532.00 | 545,852.00 |
Table A3.
Projection of the profit and loss account for year 1, 2 and 3.
| Profit and Loss Account | Year 1 | Year 2 | Year 3 |
|---|---|---|---|
| Operating revenues (m.u.) | 558,720.00 | 1,117,440.00 | 1,117,440.00 |
| (a) Provision of services | 558,720.00 | 1,117,440.00 | 1,117,440.00 |
| Consumption of goods and materials (−) | −13,152.00 | −19,728.00 | −19,728.00 |
| Salaries (−) | −318,000.00 | −354,000.00 | −354,000.00 |
| Gross revenues (m.u.) | 227,568.00 | 743,712.00 | 743,712.00 |
| Other operating expenditures (−) (m.u.) | −2832.00 | −3312.00 | −3792.00 |
| (a) External services | 2832.00 | 3312.00 | 3792.00 |
| (b) Taxes | 0.00 | 0.00 | 0.00 |
| Depreciation of fixed assets (m.u.) | −39,267.67 | −69,473.57 | −99,679.47 |
| Operating result (m.u.) | 185,468.33 | 670,926.43 | 640,240.53 |
| Financial revenues (+) | 0.00 | 0.00 | 0.00 |
| Financial expenditures (−) | −144.00 | −144.00 | −144.00 |
| Financial result | −144.00 | −144.00 | −144.00 |
| Ordinary profit before tax (m.u.) | 185,324.33 | 670,782.43 | 640,096.53 |
| Corporate revenues tax (29.5%) | −54,670.68 | −197,880.82 | −188,828.48 |
| Profit from ordinary activities (m.u.) | 130,653.65 | 472,901.61 | 451,268.05 |
| Extraordinary revenues | 0.00 | 0.00 | 0.00 |
| Extraordinary expenditures | 0.00 | 0.00 | 0.00 |
| Profit from extraordinary activities (m.u.) | 0.00 | 0.00 | 0.00 |
| Profit for the year (m.u.) | 130,653.65 | 472,901.61 | 451,268.05 |
Table A4.
Projection of assets for years 1, 2, and 3.
| Year 1 | Year 2 | Year 3 | |
|---|---|---|---|
| (A) FIXED ASSETS (m.u.) | 271,179.33 | 238,876.43 | 206,573.53 |
| Intangible fixed assets (m.u.) | 8388.00 | 6291.00 | 4194.00 |
| Tangible fixed assets (m.u.) | 262,791.33 | 232,585.43 | 202,379.53 |
| Other fixed assets (m.u.) | 0.00 | 0.00 | 0.00 |
| (B) CURRENT ASSETS (m.u.) | 514,289.00 | 1,032,050.00 | 1,033,667.00 |
| Inventories (m.u.) | 0.00 | 0.00 | 0.00 |
| Accounts receivable (m.u.) | 0.00 | 0.00 | 0.00 |
| Other assets (m.u.) | 0.00 | 0.00 | 0.00 |
| Cash and cash equivalents (m.u.) | 514,289.00 | 1,032,050.00 | 1,033,667.00 |
| TOTAL (m.u.) | 785,468.33 | 1,270,926.43 | 1,240,240.53 |
Table A5.
Projection of net worth and liabilities for years 1, 2, and 3.
| Year 1 | Year 2 | Year 3 | |
|---|---|---|---|
| (A) NET WORTH (m.u.) | 730,653.65 | 1,072,901.61 | 1,051,268.05 |
| Shareholders’ equity (m.u.) | 730,653.65 | 1,072,901.61 | 1,051,268.05 |
| Share capital (m.u.) | 600,000.00 | 600,000.00 | 600,000.00 |
| Profit for the year (m.u.) | 130,653.65 | 472,901.61 | 451,268.05 |
| Reserves (m.u.) | 0.00 | 0.00 | 0.00 |
| (B) FIXED PASSIVE (m.u.) | 0.00 | 0.00 | 0.00 |
| Long-term liabilities (m.u.) | 0.00 | 0.00 | 0.00 |
| Other fixed liabilities (m.u.) | 0.00 | 0.00 | 0.00 |
| Provisions (m.u.) | 0.00 | 0.00 | 0.00 |
| (C) CURRENT PASSIVE (m.u.) | 54,814.68 | 198,024.82 | 188,972.48 |
| Financial liabilities (m.u.) | 144.00 | 144.00 | 144.00 |
| Trade payables (m.u.) | 0.00 | 0.00 | 0.00 |
| Other liquid passive (m.u.) | 54,670.68 | 197,880.82 | 188,828.48 |
| .TOT., NET WORTH AND PASSIVE (m.u.) | 785,468.33 | 1,270,926.43 | 1,240,240.53 |
Table A6.
Projection of liquidity and solvency ratio for years 1, 2, and 3.
| Year 1 | Year 2 | Year 3 | |
|---|---|---|---|
| Liquidity ratio | 9.38 | 5.21 | 5.47 |
| Solvency ratio | 14.33 | 6.42 | 6.56 |
Table A7.
Projection of economic profitability for years 1, 2, and 3.
| Year 1 | Year 2 | Year 3 | |
|---|---|---|---|
| ROA (%) | 23.61 | 52.79 | 51.62 |
Table A8.
Projection of financial profitability for years 1, 2, and 3.
| Year 1 | Year 2 | Year 3 | |
|---|---|---|---|
| ROE (%) | 25.36 | 62.52 | 60.89 |
Table A9.
Projection of cash flow for years 1, 2, and 3.
| Year 0 | Year 1 | Year 2 | Year 3 | |
|---|---|---|---|---|
| CHARGES (m.u.) | 558,720.00 | 1,117,440.00 | 1,117,440.00 | |
| Service provision (m.u.) | 558,720.00 | 1,117,440.00 | 1,117,440.00 | |
| PAYMENTS (m.u.) | 683,185.59 | 741,873.09 | 768,398.99 | |
| Purchase of fixed assets(m.u.) | 103,139.52 | 103,139.52 | 103,139.52 | |
| Personnel expenditures (m.u.) | 318,000.00 | 354,000.00 | 354,000.00 | |
| Marketing expenditure (m.u.) | 109,000.00 | 82,000.00 | 65,000.00 | |
| Rental expenditure (m.u.) | 87,780.00 | 97,020.00 | 106,260.00 | |
| Supplies expenditures (m.u.) | 9600.00 | 13,200.00 | 16,800.00 | |
| Office cleaning expenditures (m.u.) | 2832.00 | 3312.00 | 3792.00 | |
| Operating expenditures (m.u.) | 52,419.67 | 89,201.57 | 119,407.47 | |
| Operating licence fee (m.u.) | 414.40 | 0.00 | 0.00 | |
| CASH FLOW (m.u.) | −312,544.00 | −124,465.59 | 375,566.91 | 349,041.01 |
References
- Acs, Zoltan, Desai Sameeksha, and Jolanda Hessels. 2008. Entrepreneurship, economic development and institutions. Small Business Economics 31: 219–34. [Google Scholar] [CrossRef]
- Al-Falahy, Naser, and Omar Alani. 2017. Technologies for 5G networks: Challenges and opportunities. It Professional 19: 12–20. [Google Scholar] [CrossRef]
- Amorós, José, and Niels Bosma. 2013. Global Entrepreneurship Monitor. Global Report. London: Global Entrepreneurship Research Association. [Google Scholar]
- Autio, Erkko. 2007. Global Entrepreneurship Monitor: 2007 Global Report on High-Growth Entrepreneurship. Wellesley: Babson College. [Google Scholar]
- Best, Roger, and Dionisio Ibáñez. 2007. Marketing Estratégico. Madrid: Pearson Educación. [Google Scholar]
- Bowman, Cliff, and David Faulkner. 1997. Competitive and Corporate Strategy. Martinsville: Irwin. [Google Scholar]
- Campbell, Karen, Jim Diffley, Bob Flanagan, Bill Morelli, Brendan O’Neil, and Francis Sideco. 2017. The 5G economy: How 5G technology will contribute to the global economy. IHS Economics and IHS Technology 4: 1. [Google Scholar]
- Camps-Aragó, Pol, Simon Delaere, and Pieter Ballon. 2019. 5G Business Models: Evolving Mobile Network Operator Roles in New Ecosystems. Paper presented at 2019 CTTE-FITCE: Smart Cities & Information and Communication Technology (CTTE-FITCE), IEEE, Ghent, Belgium, September 25–27; pp. 1–6. [Google Scholar]
- Canto, Fany, Luis Roman, Enrique Sanchez, and Jean Paul Rojas. 2022. Plan y Diseño de la Puesta en Marcha del Negocio “Mall Virtual” en Gamarra. Peru: PUCP. [Google Scholar]
- Caro, Jorge. 2019. La Descentralización como Mecanismo del Desarrollo en la Región San Martín–2017. San Isidro: ALICIA. [Google Scholar]
- Chesbrough, Henry. 2010. Business model innovation: Opportunities and barriers. Long Range Planning 43: 354–63. [Google Scholar] [CrossRef]
- Cohen, Morris. 2016. An Introduction to Logic and Scientific Method. Redditch: Read Books Ltd. [Google Scholar]
- Condezo, Jhor, Eduardo De la Piedra, Boris Ljubicic, and Elías Maya. 2021. Plan y Diseño de la Puesta en Marcha de una Plataforma Online de Wellness. Peru: PUCP. [Google Scholar]
- Contreras, Anguie, Gerardo Andoa, and Milagros Contreras. 2021. Plan y Diseño de la Puesta en Marcha del Negocio: Sistema de Inteligencia Financiera para Pymes. Peru: PUCP. [Google Scholar]
- Correa, Jaime, Leidy Ramírez, and Carlos Castaño. 2010. La importancia de la planeación financiera en la elaboración de los planes de negocio y su impacto en el desarrollo empresarial. Revista Facultad de Ciencias Económicas: Investigación y Reflexión 18: 179–94. [Google Scholar] [CrossRef]
- Demil, Benoît, and Xavier Lecocq. 2010. Business model evolution: In search of dynamic consistency. Long Range Planning 43: 227–46. [Google Scholar] [CrossRef]
- Drucker, Peter. 2012. Management. London: Routledge. [Google Scholar]
- Easterby-Smith, Mark, Lena Jaspersen, Richard Thorpe, and Danat Valizade. 2021. Management and Business Research. Newcastle upon Tyne: Sage. [Google Scholar]
- Galarza, Génesis, Nayle Izquierdo, and Ruth Bustamante. 2021. El marketing mix como estrategia de posicionamiento en las MIPYMES ecuatorianas. Polo del Conocimiento: Revista Científico-Profesional 6: 2045–69. [Google Scholar]
- Habiby, Anne, and Deirdre Coyle. 2010. El emprendedor de alta intensidad. Harvard Business Review 88: 76–80. [Google Scholar]
- Johnson, Gerry, Kevan Scholes, and Richard Whittington. 2006. Dirección Estratégica. Hoboken: Prentice Hall, vol. 5. [Google Scholar]
- Kaššaj, Michal, and Tomáš Peráček. 2024. Sustainable Connectivity—Integration of Mobile Roaming, WiFi4EU and Smart City Concept in the European Union. Sustainability 16: 788. [Google Scholar] [CrossRef]
- Knapp, Viktor. 2003. Vědecká Propedeutika pro Právníky. Prague: Eurolex Bohemia. [Google Scholar]
- Liu, Feiping, Qiuling Gong, and Junjie Zhou. 2021. Reform of the Practice Teaching System of Entrepreneurship Education Based on 5G Fog Computing in Colleges and Universities. Scientific Programming 2021: 1–12. [Google Scholar] [CrossRef]
- Lominé, Loykie, Martin Muchena, and Robert Pearce. 2019. Business Management. Oxford: Oxford University Press. [Google Scholar]
- Michaux, Stéphanie, and Anne-Christine Cadiat. 2016. Las cinco fuerzas de Porter: Cómo distanciarse de la competencia con éxito. 50Minutos.es. [Google Scholar]
- Moreno-Cardenas, Edison. 2019. Internet service quality and customer satisfaction. Industrial Data 22: 2. [Google Scholar]
- MTC. 2021. Ministerio de Transportes y Comunicaciones Autoriza el Despliegue Inicial de Tecnología 5G en Nuestro País. Lima: Peruvian government. [Google Scholar]
- Najjuuko, Claire, Georginah Ayebare, Ronald Lukanga, Edwin Mugume, and Dorothy Okello. 2021. A survey of 5G for rural broadband connectivity. Paper presented at 2021 IST-Africa Conference (IST-Africa), IEEE, Virtual, May 10–14; pp. 1–10. [Google Scholar]
- Navas, José, and Luis Guerras. 1998. La Dirección Estratégica de la Empresa. Teoría y Aplicaciones. London: Civitas, vol. 107. [Google Scholar]
- Pazos, Jay. 2018. Valuation of utility tokens based on the quantity theory of money. The Journal of The British Blockchain Association 1: 1–7. [Google Scholar] [CrossRef] [PubMed]
- Quesada, Carmen, Martha Sarmiento, and Ivonne Hinojosa. 2008. Plan de Negocios para la Implementación de una Empresa que Ofrece Servicios de Telefonía Digital. Peru: UPC. [Google Scholar]
- Rueda, Cynthia, Karla Jiménez, and Yesenia Sanchez. 2015. Perceptions of the impact of training, compensation and recruitment on project effectiveness. AD-Minister 17: 5–26. [Google Scholar]
- Ruiz, Angela, María Valle, Rosa Ángeles, Agustín Pezzia, Miguel Obando, and Erle López. 2016. Hacia una comprensión del ecosistema emprendedor social peruano: Contexto y características del emprendimiento social en lima. Ciências Sociais Unisinos 52: 343–53. [Google Scholar] [CrossRef]
- Salas, Julio. 2017. Sociedades Reguladas por la Ley General de Sociedades. Lima: Fondo Editorial de la PUCP, vol. 25. [Google Scholar]
- Schneider, Benjamin, and David Bowen. 1993. The service organization: Human resources management is crucial. Organizational Dynamics 21: 39–52. [Google Scholar] [CrossRef]
- Suthar, Prakash, Vivek Agarwal, Rajaneesh Shetty, and Anil Jangam. 2020. Migration and Interworking between 4G and 5G. Paper presented at 2020 IEEE 3rd 5G World Forum (5GWF), IEEE, Virtual, September 10–12; pp. 401–406. [Google Scholar]
- Teece, David. 2010. Business models, business strategy and innovation. Long Range Planning 43: 172–94. [Google Scholar] [CrossRef]
- Vergara, Ricardo. 2010. Lima Horrible y Demoniaca. Perú hoy, 1–5. [Google Scholar]
- Vettik-Leemet, Piia, and Tõnis Mets. 2024. Entrepreneurship and Innovation—Process Overlap or the Same? Systematic Overview and Converging Process-Dynamic Model. Administrative Sciences 14: 38. [Google Scholar] [CrossRef]
- Yusop, Zaid. 2018. Pestel Analysis. Paper persented at COMRAP 2018, Kuala Lumpur, Malaysia, November 24; pp. 34–39. [Google Scholar]
- Zott, Christoph, and Raphael Amit. 2010. Business model design: An activity system perspective. Long Range Planning 43: 216–26. [Google Scholar] [CrossRef]
Figure 1.
Business idea and value proposition.

Figure 2.
Aspects of the business model.

Figure 3.
Competitive path of the company according to the Bowman clock.

Figure 4.
Average monthly revenues from work (Peru).

Figure 5.
Proposed organizational structure.

Figure 7.
Projections of revenues and expenditure.

Figure 8.
Benefit.

Figure 9.
Liquidity and solvency ratios.

Figure 10.
ROA and ROE.

Table 1.
TAM, SAM, SOM of the number of installations.
| Average Number of Installations | ||||||
|---|---|---|---|---|---|---|
| Network Operator | Daily | Monthly | Yearly | TAM | SAM | SOM |
| Claro | 3 | 72 | 864 | |||
| Movistar | 3 | 72 | 864 | 2880 | 1152 | 576 |
| Entel | 2 | 48 | 576 | |||
| Bitel | 2 | 48 | 576 | |||
Table 2.
Pricing policy for service by a mobile network operator.
| Steps | Activity | Item | Description of Activities | Price (m.u.) |
|---|---|---|---|---|
| Installation on the network | 1.1 | Installation of last-mile equipment, jumpers, patch cords, and hardware verification. | ||
| operator’s side | 1.2 | Necessary labeling according to industry standards. Taking photos for documentation. | ||
| 1 | 1.3 | Necessary connectivity testing at layer 2 and 3 (IP) level, validation of the link, and software verification, including decommissioning or removal of equipment from the POP side. | 145.00 | |
| 1.4 | Documentation and final service report according to the network operator’s standards. | |||
| 1.5 | Mobilities for equipment pick-up from storage, installation and returns. | |||
| Network operator | 2.1 | Installation of last mile equipment, router, cabinets, trays, jumpers, patch cord, and hardware verification. | ||
| client-side installation | 2.2 | Necessary labeling according to industry standards. Take photos for documentation. | ||
| 2 | 2.3 | Necessary connectivity testing at layer 2 and 3 (IP) level, validation of the link, and software verification, including decommissioning or removal of customer-side equipment. | 210.00 | |
| 2.4 | Configuration of the router involved, upgrade or downgrade (according to requirements). Basic configuration. | |||
| 2.5 | Necessary labeling according to industry standards. Taking photos for documentation. | |||
| 2.6 | Mobility is for picking up equipment from the warehouse, installation, and returns. | |||
| Advanced | 3.1 | Configuration of the routers involved in the installation, a maximum of three devices. | ||
| setting | 3.2 | Advanced configurations based on network operator operation guides. | ||
| 3 | 3.3 | Configuration of IP telephony equipment up to 4 IP telephones or similar equipment. | 210.00 | |
| 3.4 | Verification of equipment hardware, ports, memories, and software upgrades according to the network operator’s standards and validation tests. | |||
| 3.5 | Necessary mobilities. | |||
| External | 4.1 | Relocation of equipment between different customer premises (up to 4 relocated services). | ||
| 4 | relocation | 4.2 | Dismantling and installation of last-mile equipment (UTP cables, fiber optic jumpers, etc.). | 210.00 |
| of | 4.3 | Take photos and upload documentation to the system according to the network operator’s standards. | ||
| equipment | 4.4 | Mobility is for picking up equipment from the warehouse, installation, and returns. | ||
| Internal | 5.1 | Moving of equipment within the customer’s premises (up to 4 services moved). | ||
| 5 | transfer | 5.2 | Dismantling and installation of last-mile equipment (UTP cables, fiber optic jumpers, etc.). | 210.00 |
| of | 5.3 | Take photos and upload documentation to the system according to the network operator’s standards. | ||
| equipment | 5.4 | Mobility for collection of equipment from the warehouse, installation and returns. | ||
| Equipment | 6.1 | Delivery of equipment and/or materials to the client. | 80.00 | |
| 6 | delivery | 6.2 | Mobility for collection of equipment from the warehouse, installation and returns. |
Table 3.
Budget of the marketing plan.
| Concept | Year | |||
|---|---|---|---|---|
| 1 | 2 | 3 | ||
| Total (m.u.) | 43,000.00 | 15,000.00 | 13,000.00 | |
| Promotion in print media | Content creation | 3000.00 | 0.00 | 3000.00 |
| Content distribution | 40,000.00 | 15,000.00 | 10,000.00 | |
| Total (m.u.) | 25,000.00 | 28,000.00 | 15,000.00 | |
| Social media promotion | Content creation | 10,000.00 | 13,000.00 | 5000.00 |
| Content distribution | 15,000.00 | 15,000.00 | 10,000.00 | |
| Total (m.u.) | 13,000.00 | 11,000.00 | 9000.00 | |
| Newsletters | Content creation | 3000.00 | 3000.00 | 3000.00 |
| Content distribution | 10,000.00 | 8000.00 | 6000.00 | |
| Total (m.u.) | 28,000.00 | 28,000.00 | 28,000.00 | |
| Public relations | Content creation | 28,000.00 | 28,000.00 | 28,000.00 |
| Content distribution | 0.00 | 0.00 | 0.00 | |
| Total annual cost (m.u.) | 109,000.00 | 82,000.00 | 65,000.00 | |
Table 4.
Staff cost budget.
| Position | Quantity | Year 1 | Year 2 | Year 3 |
|---|---|---|---|---|
| Salary (m.u.) | Salary (m.u.) | Salary (m.u.) | ||
| Director general | 1 | 72,000.00 | 72,000.00 | 72,000.00 |
| Administrative director | 1 | 54,000.00 | 54,000.00 | 54,000.00 |
| Operations director | 1 | 60,000.00 | 60,000.00 | 60,000.00 |
| Commercial director | 1 | 60,000.00 | 60,000.00 | 60,000.00 |
| Specialised technician | 2 | 72,000.00 | 108,000.00 | 108,000.00 |
| TOTAL (m.u.) | 318,000.00 | 354,000.00 | 354,000.00 | |
Table 5.
Investments in fixed assets.
| Investment (m.u.) | |
|---|---|
| FIXED ASSETS | 312,544.00 |
| Intangible fixed assets | 10,485.00 |
| Computer software | 10,485.00 |
| Tangible fixed assets | 302,059.00 |
| Furniture | 9790.00 |
| Computer equipment | 24,060.00 |
| Work tools | 2309.00 |
| Transport equipment | 115,500.00 |
| Refurbishment | 150,400.00 |
Table 6.
Working capital.
| Year 1 | Year 2 | Year 3 | |
|---|---|---|---|
| Working Capital (m.u.) | 459,474.32 | 834,025.18 | 844,694.52 |
Disclaimer/Publisher’s Note: The statements, opinions and data contained in all publications are solely those of the individual author(s) and contributor(s) and not of MDPI and/or the editor(s). MDPI and/or the editor(s) disclaim responsibility for any injury to people or property resulting from any ideas, methods, instructions or products referred to in the content. |
© 2024 by the authors. Licensee MDPI, Basel, Switzerland. This article is an open access article distributed under the terms and conditions of the Creative Commons Attribution (CC BY) license (https://creativecommons.org/licenses/by/4.0/).
Share and Cite
MDPI and ACS Style
Moreno-Cardenas, E.; Moreno, Y.; Barrial-Lujan, A.I. Strategic Design of a Business Model for Providing Services over the 5G Network in Peru. Adm. Sci. 2024, 14, 55. https://doi.org/10.3390/admsci14030055
AMA Style
Moreno-Cardenas E, Moreno Y, Barrial-Lujan AI. Strategic Design of a Business Model for Providing Services over the 5G Network in Peru. Administrative Sciences. 2024; 14(3):55. https://doi.org/10.3390/admsci14030055
Chicago/Turabian StyleMoreno-Cardenas, Edison, Yackelin Moreno, and Abel I. Barrial-Lujan. 2024. "Strategic Design of a Business Model for Providing Services over the 5G Network in Peru" Administrative Sciences 14, no. 3: 55. https://doi.org/10.3390/admsci14030055
Note that from the first issue of 2016, this journal uses article numbers instead of page numbers. See further details here.