Factors Influencing User Perception and Adoption of E-Government Services

 , , , , ,
Abstract
:1. Introduction
- Recent advancements in ICT technologies, including Artificial Intelligence (AI), blockchain, and the Internet of Things (IoT) can enhance the methods and channels of e-government (Ivić et al. 2022).
- The dynamics, uncertainty, and complexity of the economic landscape influence users’ requirements, preferences, and habits. As technologies evolve, expectations and demands of users for the channels delivering e-public services are increasingly shifting online (Solvak et al. 2019).
- The existing methods for customer satisfaction research can be expanded through the incorporation of machine learning (ML) (AlHadid et al. 2022), fuzzy logic, big data, and other intelligent techniques or their combinations.
- Propose a methodological framework that facilitates the systematic analysis of customer data and can reveal hidden relationships between factors influencing the adoption of new information technologies (IT) in the public sector;
- Collect and systemize a customer dataset about their experiences and preferences regarding online public services (gender, age, residential area, monthly income, attitudes and opinions);
- Create and validate a Structural Equation Model (SEM) based on factors from the literature review and assess their influence on customer attitude toward e-administrative services;
- Identify the key factors affecting customer use and intention to use e-administrative services according to the obtained model;
- Create and evaluate alternative ML and MCDA models for prediction of user perception and adoption of e-administrative services.
2. State of the Art Review of Digital Administrative Services
2.1. Key Features and Taxonomy of Electronic Public Services
2.2. Assessing Electronic Public Services
2.3. Challenges in Evaluating Electronic Public Services
3. Related Work
3.1. Customer Satisfaction with Digital Public Services and Its Measurement
3.2. Comparison of Existing Models of Customer Satisfaction with E-Government Services
3.3. Main Factors Affecting Consumer Attitudes and Intention to Adopt E-Government Services
- 1.
- Perceived Usefulness
- 2.
- Perceived Ease of Use
- 3.
- Social Influence
- 4.
- Facilitating Conditions
- 5.
- Perceived Trust
- 6.
- Perceived Risk
- 7.
- Service Quality
4. Materials and Methods
4.1. Designing the Questionnaire and Collecting Data
4.2. Measuring and Scaling the Questionnaire
4.3. Data Analysis Methods
5. Results
5.1. Customer Data Collection
- Data storage
- Data encoding
- Data preprocessing
5.2. Statistical Analysis
- Main Characteristics of the Sample
- Feature Selection
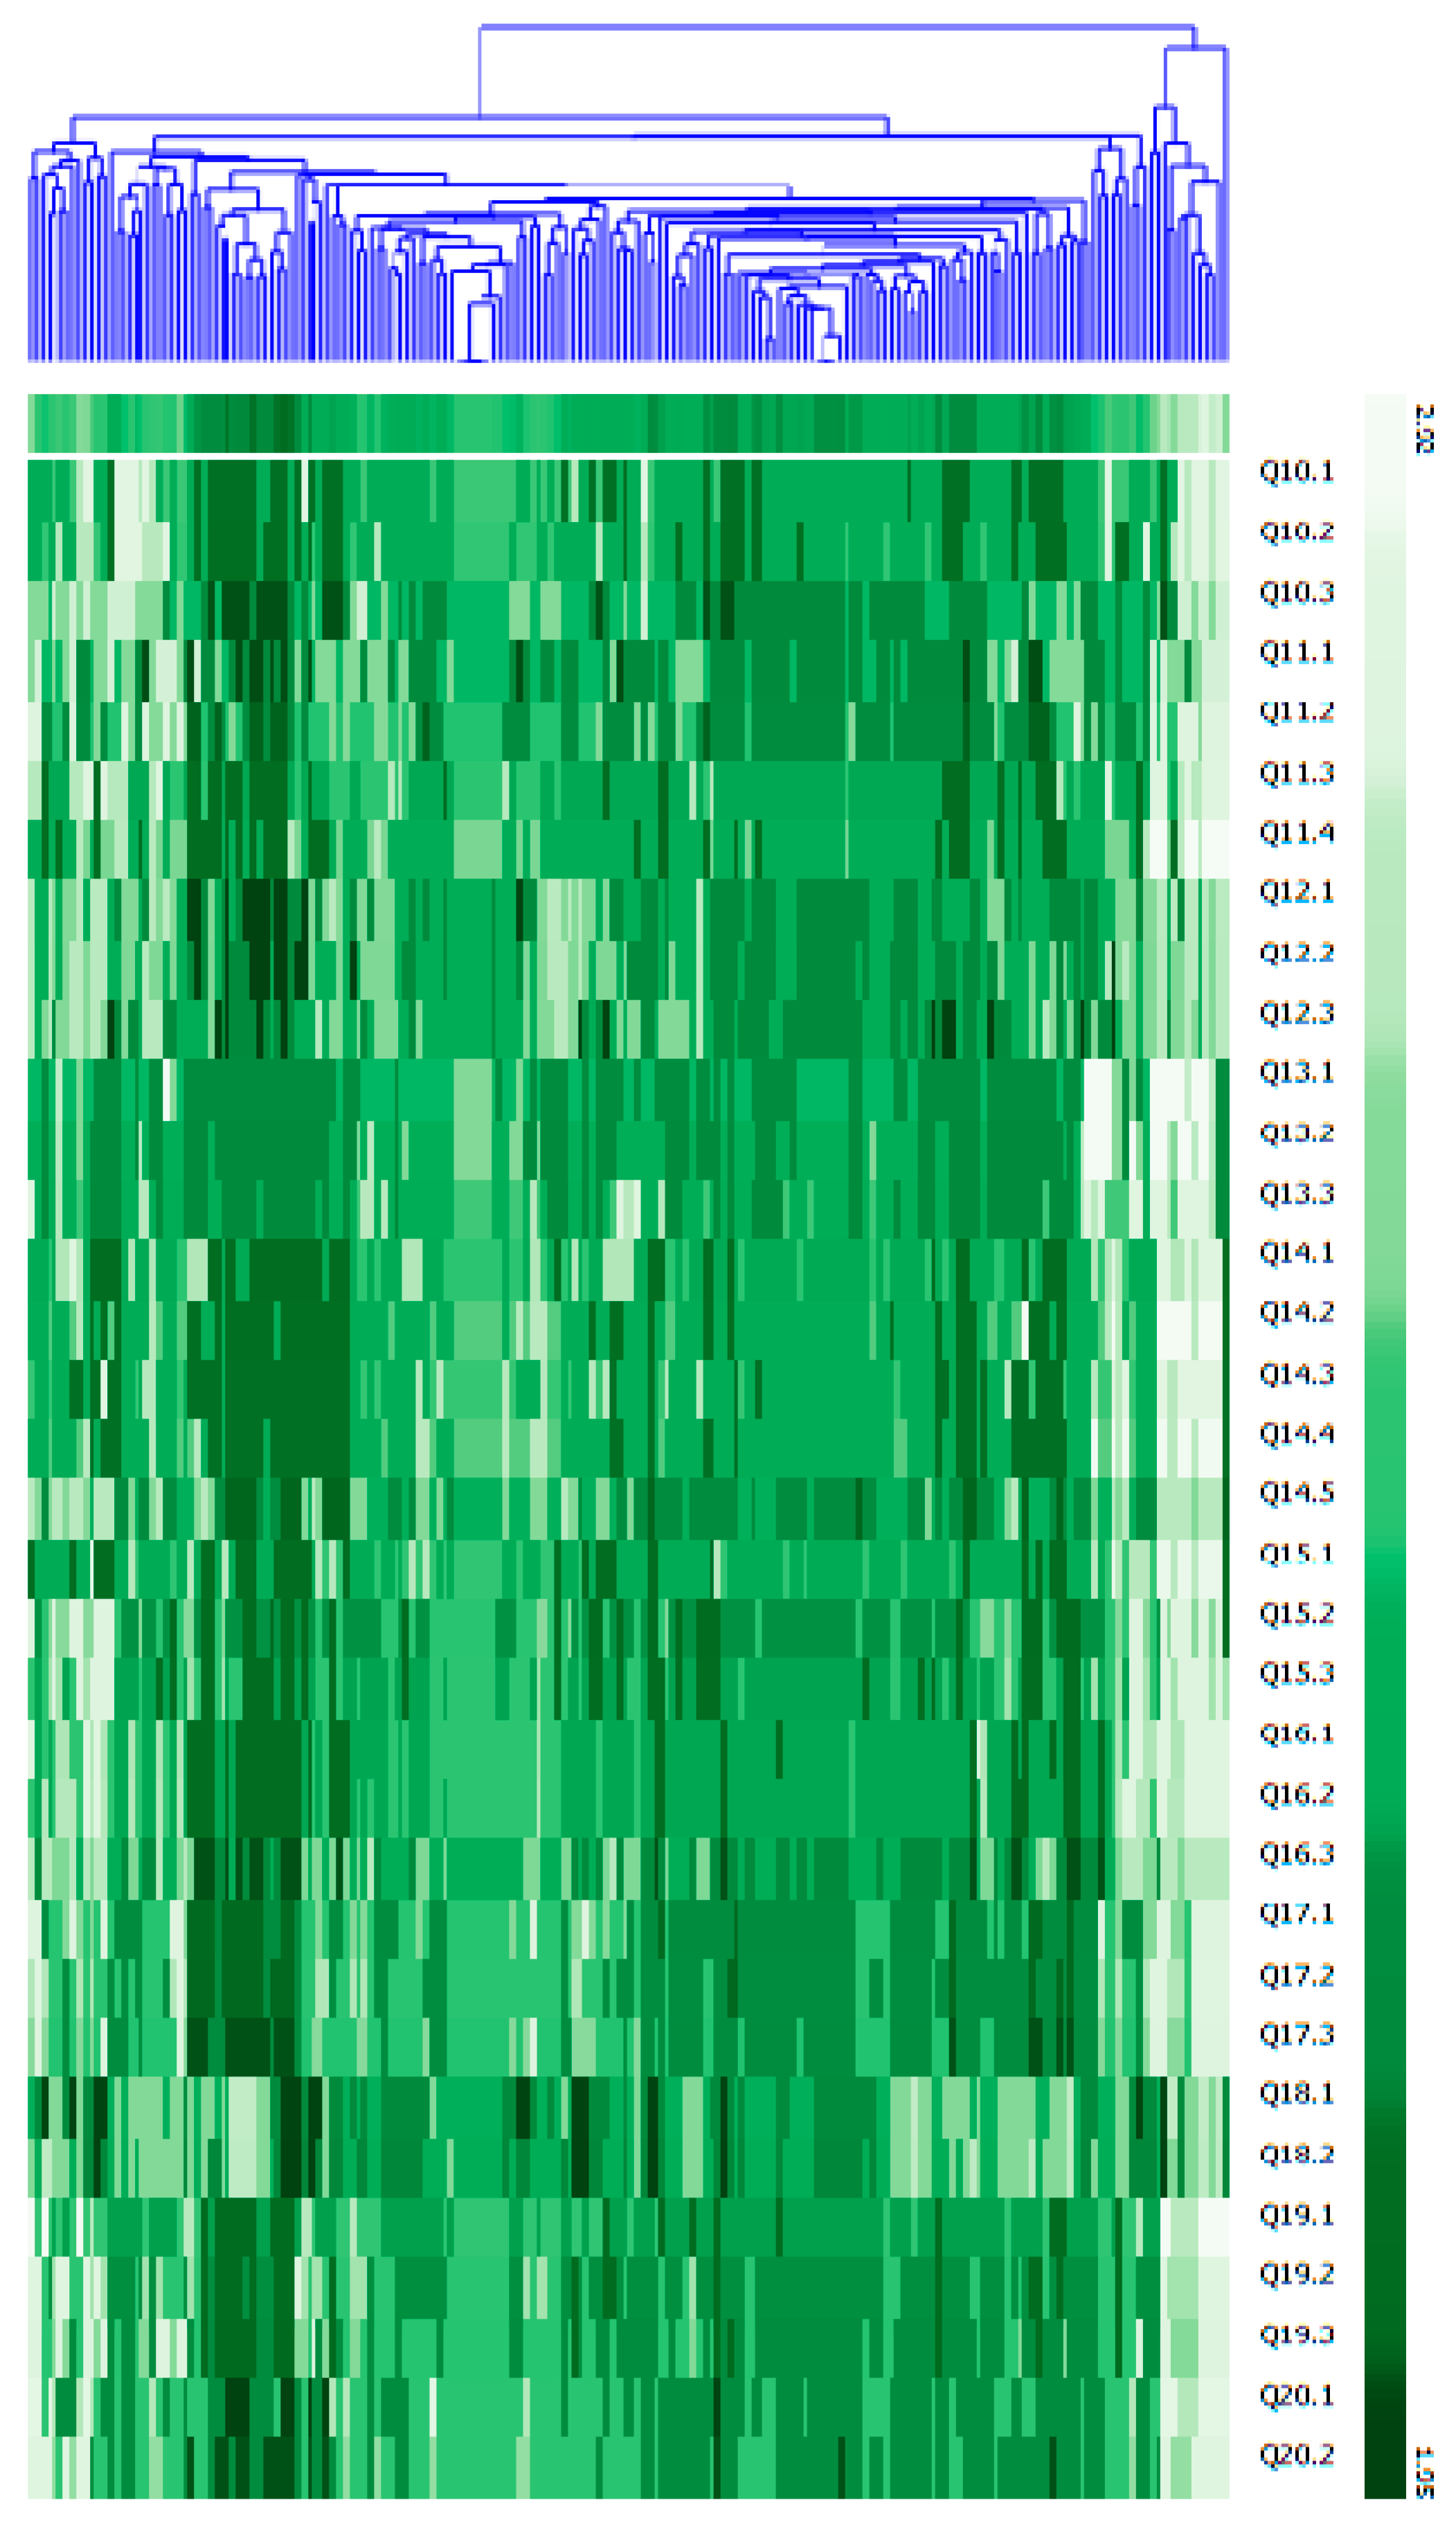
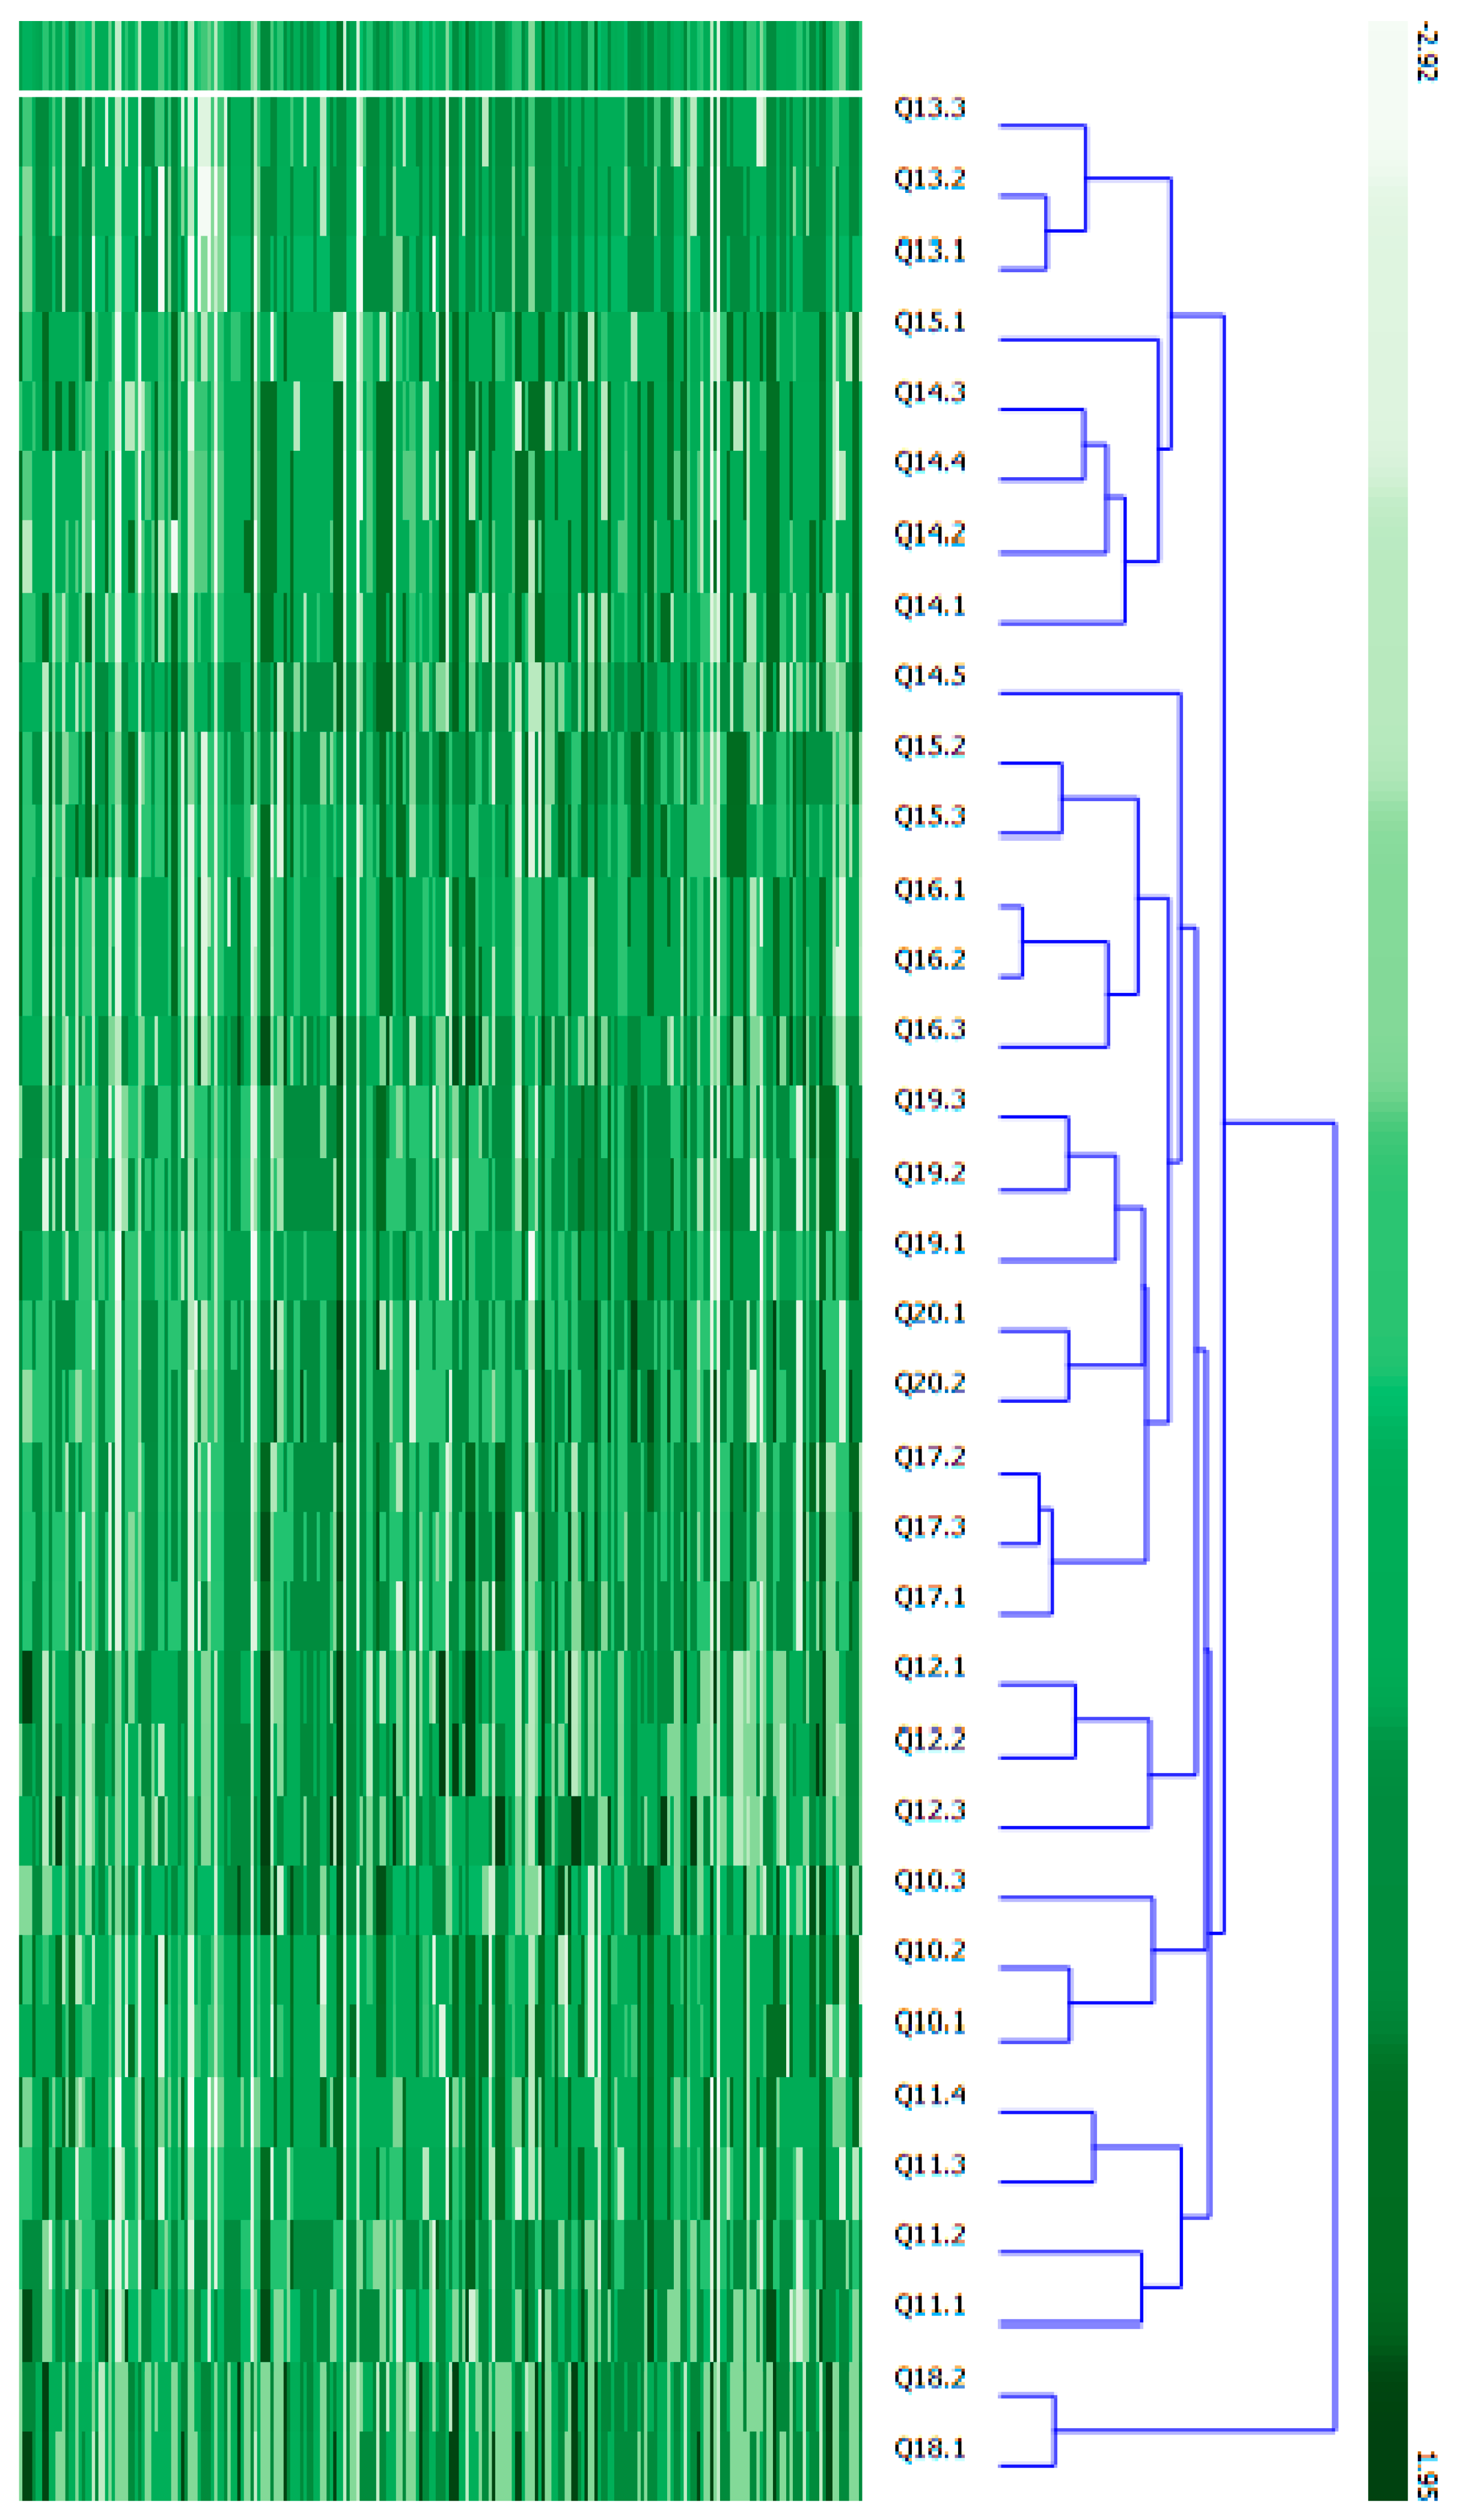
- Clustering
- Sentiment Analysis
- Online systems could provide technical support to users and response to user queries in real time;
- The structure and navigation system of websites could be optimised;
- The citizens’ easy access to e-services could be ensured without additional requirements, such as electronic signatures or training in accounting;
- Cybersecurity measures and data protection could be strengthened.
5.3. SEM Model of Customer Attitudes towards E-Government Services
- Formulate hypotheses about constructs and their interrelationships.
- Identify indicators for each construct.
- Execute the modelling procedure and assess the model fit.
- Evaluate the quality of the model; if satisfactory, proceed to Step 5, otherwise return to Step 3 to enhance the model.
- Discuss the obtained results.
- Construct Validity and Reliability
- Factor Loadings
- Indicator Multicollinearity
- Reliability Analysis
- Convergent Validity
- Discriminant Validity
- Heterotrait–Monotrait Ratio (HTMT)
- Assessment of Structural Model
5.4. Other Models of Customer Attitude towards E-Government Services
6. Conclusions
- A primary dataset was collected encompassing users’ opinions regarding their use and intention to adopt e-government administrative services. A distribution analysis determined the socioeconomic status of the respondents. A significant portion of respondents (2/3) were below the age of 30, with half of these belonging to Generation Z, and the other half to Millennials. The remaining third consisted of participants with an older age. The majority of participants (96%) resided in urban areas, and 74% were female. In terms of education level, 60% of respondents had completed only high school. Approximately three quarters of respondents (75%) reported using e-government services. Analysis of customer sentiment revealed that the majority of reviews (77%) expressed a non-negative attitude toward e-public services as a convenient tool for e-government interactions. Only a quarter (25%) of the respondents reported that they would recommend the use of e-public services.
- Users of e-government administrative services were classified into two statistically significant clusters. The first “unsatisfied” cluster comprised respondents who reported lower levels of satisfaction in Perceived Ease of Use, Social Influence, Perceived Trust, Perceived Risk, and Service Quality. The second cluster included those with relatively higher levels of satisfaction in Perceived Usefulness and Facilitating Conditions. The minimal distance was observed between user evaluations of Perceived Risk, while the maximal range was detected in Perceived Trust.
- The developed SEM-based model revealed that hypotheses H4, H5, H6, and H7, which respectively postulated significant impacts on customer attitudes toward e-public services on the part of Facilitating Conditions, Perceived Trust, Perceived Risk, and Service Quality, were verified after a series of predefined checks. Conversely, hypotheses H1, H2, and H3, which respectively suggested that Perceived Usefulness, Perceived Ease of Use, and Social Influence do not affect customer attitude, were rejected. Our analysis found that customers’ usage of e-government services was unaffected by gender, place of residence, average income, or educational level, with only age group showing a significant effect on attitude (H8).
Author Contributions
Funding
Institutional Review Board Statement
Informed Consent Statement
Data Availability Statement
Acknowledgments
Conflicts of Interest
References
- AlHadid, Issam, Evon Abu-Taieh, Rami S. Alkhawaldeh, Sufian Khwaldeh, Ra’ed Masa’deh, Khalid Kaabneh, and Ala’A. Alrowwad. 2022. Predictors for E-government adoption of SANAD App services integrating UTAUT, TPB, TAM, Trust, and perceived risk. International Journal of Environmental Research and Public Health 19: 8281. [Google Scholar] [CrossRef]
- Alkraiji, Abdullah, and Nisreen Ameen. 2021. The impact of service quality, trust and satisfaction on young citizen loyalty towards government e-services. Information Technology & People 35: 1239–70. [Google Scholar]
- Al-Mushayt, Omar S. 2019. Automating E-government services with artificial intelligence. IEEE Access 7: 146821–29. [Google Scholar] [CrossRef]
- Al-Sadiq, A. J. 2021. The Role of E-Government in Promoting Foreign Direct Investment Inflows. Washington, DC: International Monetary Fund. [Google Scholar]
- Al-Sakran, Hasan O., and Mohammed A. Alsudairi. 2021. Usability and accessibility assessment of Saudi Arabia mobile e-government websites. IEEE Access 9: 48254–75. [Google Scholar] [CrossRef]
- Bansal, Malti, Varun Sirpal, and Mitul K. Choudhary. 2022. Advancing e-government using internet of things. In Proceedings of the Mobile Computing and Sustainable Informatics (ICMCSI), Tribhuvan, Nepal, 29–30 January 2021. Singapore: Springer, pp. 123–37. [Google Scholar]
- Batmetan, Johan R., Muhammad Nur, Omega S. M. Turang, Merry M. Sumampouw, and Gabriel M. Lahengking. 2022. IT Infrastructure Library Framework Approach to the Measurement of e-Government Maturity. International Journal of Information Technology and Education 1: 119–28. [Google Scholar]
- Beran, Tanya N., and Claudio Violato. 2010. Structural Equation Modeling in Medical Research: A Primer. BMC Research Notes 3: 267. [Google Scholar] [CrossRef]
- Camilleri, Mark A. 2020. The online users’ perceptions toward electronic government services. Communication and Ethics in Society 18: 221–35. [Google Scholar] [CrossRef]
- Capgemini, Sogeti, IDC, and Politecnico Milano. 2023. eGovernment Benchmark 2023 Insight Report. Available online: https://prod.ucwe.capgemini.com/wp-content/uploads/2023/08/Capgemini_Public-Sector_eGovernment-Benchmark-2023-report.pdf (accessed on 15 January 2024).
- Chatzopoulou, Chrysanthi, Dimitrios Tsolkanakis, Symelia M. Vasileiadou, Konstantinos Kyriakidis, Konstantina Skoutzouri, Despina Kirtikidou, Syed I. H. Shah, and Vassilios Peristeras. 2021. E-Government and COVID-19: An empirical study in Greece. Paper presented at the Research Conference on Metadata and Semantics Research (MTSR), Madrid, Spain, November 29–December 3; Cham: Springer International Publishing, pp. 307–21. [Google Scholar]
- Cheng, Tsang-Hsiang, Shih-Chih Chen, and Taqwa Hariguna. 2021. The empirical study of usability and credibility on Intention usage of government-to-citizen services. Journal of Applied Data Sciences, 2. [Google Scholar] [CrossRef]
- Council of Ministers. 2020. Report on the State of the Administration 2020. Available online: https://iisda.government.bg/annual_report/623 (accessed on 15 January 2024).
- Council of Ministers. 2021. Report on the State of the Administration 2021. Available online: https://iisda.government.bg/annual_report_file/564_2747 (accessed on 15 January 2024).
- Council of Ministers. 2022. Report on the State of the Administration 2022. Available online: https://iisda.government.bg/annual_report_file/504_2307 (accessed on 15 January 2024).
- Davis, Fred D. 1989. Perceived usefulness, perceived ease of use, and user acceptance of information technology. MIS Quarterly 13: 319–40. [Google Scholar] [CrossRef]
- Dener, Cem, Hubert Nii-Aponsah, Love E. Ghunney, and Kimberly D. Johns. 2021. GovTech Maturity Index: The State of Public Sector Digital Transformation. Washington, DC: World Bank Publications. [Google Scholar]
- Doran, Nicoleta M., Silvia Puiu, Roxana M. Bădîrcea, Marilen G. Pirtea, Marius D. Doran, George Ciobanu, and Lavinia D. Mihit. 2023. E-government development—A key factor in government administration effectiveness in the European Union. Electronics 12: 641. [Google Scholar] [CrossRef]
- EC. 2023. e-Government Benchmark. Available online: https://digital-strategy.ec.europa.eu/en/library/egovernment-benchmark-2023 (accessed on 5 March 2024).
- ElKheshin, Sara A., and Noha Saleeb. 2020. Assessing the adoption of e-government using TAM model: Case of Egypt. International Journal of Managing Information Technology (IJMIT) 12: 1–14. [Google Scholar] [CrossRef]
- EN 301549:2018. 2018. Accessibility Requirements Suitable for Public Procurement of ICT Products and Services in Europe. Available online: https://www.etsi.org/deliver/etsi_en/301500_301599/301549/02.01.02_60/en_301549v020102p.pdf (accessed on 5 March 2024).
- Fakhruzzaman, Muhammad N., and Daniela V. Dimitrova. 2020. Factors influencing e-government adoption in Indonesia: The importance of perceived risk. Journal of Advanced Research in Dynamical and Control Systems 12: 125–31. [Google Scholar]
- Firmandayu, Nilam, and Khalid E. Elfaki. 2023. The electronic government policy-based green constitution towards good governance. Journal of Sustainable Development and Regulatory Issues 1: 108–21. [Google Scholar] [CrossRef]
- Fornell, Claes, and Fred L. Bookstein. 1982. Two Structural Equation Models: LISREL and PLS Applied to Consumer Exit-voice Theory. Journal of Marketing Research 19: 440–52. [Google Scholar] [CrossRef]
- Garcia-Rio, Esther, Pedro R. Palos-Sanchez, Pedro Baena-Luna, and Mariano Aguayo-Camacho. 2023. Different approaches to analyzing e-government adoption during the COVID-19 pandemic. Government Information Quarterly 40: 101866. [Google Scholar] [CrossRef]
- Gomez-Trujillo, Ana M., and Maria A. Gonzalez-Perez. 2021. Digital transformation as a strategy to reach sustainability. Smart and Sustainable Built Environment 11: 1137–62. [Google Scholar] [CrossRef]
- Hair, Joseph F., Jr., William C. Black, Barry J. Babin, and Rolph E. Anderson. 2014. Multivariate Data Analysis, 7th ed. Edinburgh: Pearson. [Google Scholar]
- Hernández, Ana C. C., María E. P. Prieto, Leonardo B. Pinto, and Efraín G. Martínez. 2024. Analysis of the e-Government development index in the regions. Procedia Computer Science 231: 559–65. [Google Scholar] [CrossRef]
- Hochstetter, Jorge, Felipe Vásquez, Mauricio Diéguez, Ana Bustamante, and Jeferson Arango-López. 2023. Transparency and E-Government in Electronic Public Procurement as Sustainable Development. Sustainability 15: 4672. [Google Scholar] [CrossRef]
- Hodzic, Sabina, Dejan Ravselj, and Dubravka J. Alibegovic. 2021. E-Government Effectiveness and Efficiency in EU-28 and COVID-19. Central European Public Administration Review 19: 159. [Google Scholar] [CrossRef]
- Holzer, Marc, Aroon Manoharan, and James Melitski. 2019. E-Government and Information Technology Management: Concepts and Best Practices. Irvine: Melvin & Leigh Publishers. [Google Scholar]
- Hujran, Omar, Ayman Alarabiat, and Mohammed AlSuwaidi. 2023. Analysing e-government maturity models. Electronic Government, an International Journal 19: 1–21. [Google Scholar] [CrossRef]
- Ilieva, Galina, Tania Yankova, Margarita Ruseva, Yulia Dzhabarova, Veselina Zhekova, Stanislava Klisarova-Belcheva, and Angel Dimitrov. 2024. Examining User Perception and Adoption of Electronic Public Services. In Mendeley Data. Amsterdam: Elsevier. [Google Scholar]
- ISO/IEC 20000-1:2018. 2018. Information Technology–Service Management–Part 1: Service Management System Requirements. Available online: https://www.iso.org/standard/70636.html (accessed on 5 March 2024).
- ISO/IEC 27001:2022. 2022. Information Technology–Security Techniques–Information Security Management Systems–Requirements. Available online: https://www.iso.org/standard/27001 (accessed on 5 March 2024).
- Ivić, Aleksandar, Anđela Milićević, Dušan Krstić, Nina Kozma, and Sara Havzi. 2022. The Challenges and Opportunities in Adopting AI, IoT and Blockchain Technology in E-Government: A Systematic Literature Review. Paper presented at the International Conference on Communications, Information, Electronic and Energy Systems (CIEES), Veliko Tarnovo, Bulgaria, November 24–26; pp. 1–6. [Google Scholar]
- Junnonyang, Ekkaphap. 2021. Integrating TAM, perceived risk, trust, relative advantage, government support, social influence and user satisfaction as predictors of mobile government adoption behavior in Thailand. International Journal of eBusiness and eGovernment Studies 13: 159–78. [Google Scholar]
- Kawashita, Ilka, Ana A. Baptista, and Delfina S. Soares. 2020. An assessment of open government data benchmark instruments. Paper presented at the IFIP WG 8.5 International Conference EGOV-CeDEM-ePart 2020, Linköping, Sweden, August 31–September 2; pp. 29–40. [Google Scholar]
- Kurfali, Murathan, Ali Arifoğlu, Gül Tokdemir, and Yudum Paçin. 2017. Adoption of e-government services in Turkey. Computers in Human Behavior 66: 168–78. [Google Scholar] [CrossRef]
- Lallmahomed, Muhammad Z. I., Naguib Lallmahomed, and Gias M. Lallmahomed. 2017. Factors influencing the adoption of e-Government services in Mauritius. Telematics and Informatics 34: 57–72. [Google Scholar] [CrossRef]
- Layne, Karen, and Jungwoo Lee. 2001. Developing fully functional E-government: A four stage model. Government Information Quarterly 18: 122–36. [Google Scholar] [CrossRef]
- Lemke, Florian, Kuldar Taveter, Regina Erlenheim, Ingrid Pappel, Dirk Draheim, and Marijn Janssen. 2020. Stage Models for Moving from E-Government to Smart Government. In Electronic Governance and Open Society: Challenges in Eurasia (EGOSE), 13–14 November 2019, St. Petersburg. Russia. Communications in Computer and Information Science, Vol. 1135 CCIS. Edited by Andrei Chugunov, Igor Khodachek, Yuri Misnikov and Dmitrii Trutnev. Cham: Springer, pp. 152–64. [Google Scholar]
- Li, Wenjuan. 2021. The Role of Trust and Risk in Citizens’ E-Government Services Adoption: A perspective of the extended UTAUT model. Sustainability 13: 7671. [Google Scholar] [CrossRef]
- Li, Yan, and Huping Shang. 2020. Service quality, perceived value, and citizens’ continuous-use intention regarding e-government: Empirical evidence from China. Information & Management 57: 103197. [Google Scholar]
- Lykidis, Ioannis, George Drosatos, and Konstantinos Rantos. 2021. The use of blockchain technology in e-government services. Computers 10: 168. [Google Scholar] [CrossRef]
- Majo, Lorraine T. 2023. Analysis of E-government and Digital Society Indicators in Selected Countries. Master Thesis, University of Pardubice, Pardubice, Czechia. [Google Scholar]
- Medina-Quintero, José M., Demian Ábrego-Almazán, and Osiris Echeverría-Ríos. 2021. Satisfaction, ease of use and citizen trust in electronic government. Investigación Administrativa 50: 12704. [Google Scholar]
- Mensah, Isaac K., Guohua Zeng, and Chuanyong Luo. 2020. E-Government services adoption: An extension of the unified model of electronic government adoption. Sage Open 10: 2158244020933593. [Google Scholar] [CrossRef]
- NCPS. 2023. National Center for Parliamentary Studies—Electronic Government in Bulgaria–Public Expectations and Attitudes. Available online: https://www.parliament.bg/pub/ncpi/20230426163756_NCPI_EGovernment_2023.pdf (accessed on 15 January 2024).
- Nugroho, Rino A., Annisaa N. Imania, and Annisa A. Rahmawati. 2022. Public Acceptance of Mobile Civic Service in Indonesia Using a Unified Model of E-Government Acceptance. KnE Social Sciences 7: 214–28. [Google Scholar] [CrossRef]
- Othman, Mohamed H., Rozilawati Razali, and Mohammad F. Nasrudin. 2020. Key factors for e-government towards sustainable development goals. International Journal of Advanced Science and Technology 29: 2864–76. [Google Scholar]
- Pan, Ji. 2020. Temporality alignment: How WeChat transforms government communication in Chinese cities. Chinese Journal of Communication 13: 241–57. [Google Scholar] [CrossRef]
- Papadomichelaki, Xenia, and Gregoris Mentzas. 2012. e-GovQual: A multiple-item scale for assessing e-government service quality. Government Information Quarterly 29: 98–109. [Google Scholar] [CrossRef]
- Parasuraman, Ananthanarayanan, Leonard Berry, and Valerie Zeithaml. 1991. Refinement and Reassessment of the SERVQUAL scale. Journal of Retailing 67: 57–67. [Google Scholar]
- Pedrosa, Glauco V., Ricardo A. D. Kosloski, Vitor G. de Menezes, Gabriela Y. Iwama, Wander C. M. P. da Silva, and Rejane M. da C. Figueiredo. 2020. A systematic review of indicators for evaluating the effectiveness of digital public services. Information 11: 472. [Google Scholar] [CrossRef]
- Pedrosa, Glauco V., Wander C. P. Silva, and Rejane M. da C. Figueiredo. 2022. Evaluating the Impact of Trust in Government on Satisfaction with Public Services. Paper presented at the Electronic Government: 21st IFIP WG 8.5 International Conference, EGOV 2022, Linköping, Sweden, September 6–8; Cham: Springer Nature, 13391 vols, p. 3. [Google Scholar]
- Prorok, Thomas. 2020. CAF 2020: A Major Contribution to Public Administration Reform and European Integration. Transforming Public Administration with CAF. Vienna: Centre For Public Administration Research. [Google Scholar]
- Rahmati, Mohammad H., and Mohammad R. Jalilvand. 2023. An optimal organizational excellence model for the public sector. International Journal of Quality & Reliability Management 41: 944–63. [Google Scholar]
- Ringe, Christian M., Sven Wende, and Jan-Michael Becker. 2015. SmartPLS 3. Bönningstedt: SmartPLS GmbH. [Google Scholar]
- Rita, Paulo, Tiago Oliveira, and Almira Farisa. 2019. The impact of e-service quality and customer satisfaction on customer behavior in online shopping. Heliyon 5: e02690. [Google Scholar] [CrossRef] [PubMed]
- Sarwar, Muhammad I., Qaiser Abbas, Tahir Alyas, Ali Alzahrani, Turki Alghamdi, and Yazed Alsaawy. 2023. Digital transformation of public sector governance with IT service management—A pilot study. IEEE Access 11: 6490–512. [Google Scholar] [CrossRef]
- Seljan, Sanja, Ivan Miloloža, and Mirjana Pejićbach. 2020. e-Government in European countries: Gender and ageing digital divide. Interdisciplinary Management Research 16: 1563–84. [Google Scholar]
- Shayganmehr, Masoud, Anil Kumar, Jose A. Garza-Reyes, and Edmundas K. Zavadskas. 2023. A framework for assessing trust in e-government services under uncertain environment. Information Technology & People 36: 2718–55. [Google Scholar]
- Solvak, Mihkel, Taavi Unt, Dmitri Rozgonjuk, Andres Võrk, Märten Veskimäe, and Kristjan Vassil. 2019. E-governance diffusion: Population level e-service adoption rates and usage patterns. Telematics and Informatics 36: 39–54. [Google Scholar] [CrossRef]
- Stefanovic, Darko, Andjela Milicevic, Sara Havzi, Teodora Lolic, and Aleksandar Ivic. 2021. Information systems success models in the E-government: Context: A systematic literature review. Paper presented at the 20th International Symposium INFOTEH-JAHORINA (INFOTEH), East Sarajevo, Bosnia and Herzegovina, March 17–19; pp. 1–6. [Google Scholar]
- Stoyanova, Petia, and Desislava Popova. 2023. Over 1200 Electronic Services Improve Administrative Services in Our Country. Available online: https://www.investor.bg/a/566-novini-i-analizi/367714-nad-1200-elektronni-uslugi-podobryavat-administrativnoto-obsluzhvane-u-nas (accessed on 15 January 2024).
- Talukder, Shamim, Raymond Chiong, Yukun Bao, and Babur H. M. Talukder. 2019. Acceptance and use predictors of fitness wearable technology and intention to recommend: An empirical study. Industrial Management & Data Systems 119: 170–88. [Google Scholar]
- Tangi, Luca, Michele Benedetti, Luca Gastaldi, Giuliano Noci, and Claudio Russo. 2021. Mandatory provisioning of digital public services as a feasible service delivery strategy: Evidence from Italian local governments. Government Information Quarterly 38: 101543. [Google Scholar] [CrossRef]
- Tokovska, Miroslava, Vanessa N. Ferreira, Anna Vallušova, and Andrea Seberíni. 2023. E-Government—The Inclusive Way for the Future of Digital Citizenship. Societies 13: 141. [Google Scholar] [CrossRef]
- Torres, Lourdes, Vicente Pina, and Basilio Acerete. 2005. E-government developments on delivering public services among EU cities. Government Information Quarterly 22: 217–38. [Google Scholar] [CrossRef]
- Ubaldi, Barbara, and Tomoya Okubo. 2020. OECD Digital Government Index (DGI): Methodology and 2019 Results. Paris: OECD. [Google Scholar]
- Uchenna, Michael N. 2020. E-service Quality Dimensions and Users Satisfaction with E-Governance Service Portals. International Journal of Innovative Information Systems & Technology Research 8: 68–80. [Google Scholar]
- UN DESA. 2022. United Nations E-Government Survey 2022. Available online: https://publicadministration.un.org/egovkb/en-us/Reports/UN-E-Government-Survey-2022 (accessed on 15 January 2024).
- UN General Assembly. 2015. Transforming Our World: The 2030 Agenda for Sustainable Development. A/RES/70/1. Available online: https://www.refworld.org/docid/57b6e3e44.html (accessed on 15 January 2024).
- Venkatesh, Viswanath, Michael G. Morris, Gordon B. Davis, and Fred D. Davis. 2003. User acceptance of information technology: Toward a unified view. MIS Quarterly 27: 425–78. [Google Scholar] [CrossRef]
- Xie, Qijun, Wei Song, Xiaobao Peng, and Muhammad Shabbir. 2017. Predictors for e-government adoption: Integrating TAM, TPB, trust and perceived risk. The Electronic Library 35: 2–20. [Google Scholar] [CrossRef]
- Zeebaree, Mosleh, Mary Agoyi, and Musbah Aqel. 2022. Sustainable adoption of E-Government from the UTAUT perspective. Sustainability 14: 5370. [Google Scholar] [CrossRef]


| Assessment Tool | Measurement Goal(s) | Appraisal Dimensions | Evaluation Scope |
|---|---|---|---|
| EGDI (UN DESA 2022) | E-government development | EGDI evaluates online services, telecommunication infrastructure, human capital | Global and regional |
| e-Government Benchmark (EC 2023) | E-government development | The index consists of assessments of online services, online cross-border services, eID, e-documents, pre-filled forms | European |
| Digital Government Index (Ubaldi and Okubo 2020) | E-government development | This index comprises six e-government measures: digital-by-design, data-driven, platform-based, open, user-driven, and proactive | Global and regional |
| GovTech Maturity Index (Dener et al. 2021) | E-government maturity | GTMI includes four components: core government systems, public service delivery, digital citizen engagement, and GovTech enablers | Global and regional |
| ISO 20000 (ISO/IEC 2018) | Performance, Quality Management | Standard for IT service management, focusing on efficiency and performance | Organizational |
| ISO 27001 (ISO/IEC 2022) | Security | Standard for information security management systems, ensuring confidentiality, integrity, and availability of information | Organizational |
| EN 301549 (European Standardization Committees 2018) | Accessibility | This standard contains detailed requirements for websites, web-delivered documents, and mobile applications | European organizational |
| CAF (Prorok 2020) | Organizational Performance Assessment | The framework has nine criteria: leadership, personnel, partnerships, budget, knowledge, IT, processes, citizens and customers, social responsibility, and key performance | European organizational |
| SERVQUAL (Parasuraman et al. 1991) | Service Quality | This framework assesses service quality based on five factors: tangibles, reliability, responsiveness, assurance, and empathy map | Organizational |
| TAM (Davis 1989) | User Acceptance | Model evaluating user acceptance of technology, focusing on factors influencing users’ willingness to adopt and use e-services | User-centric |
| UTAUT (Venkatesh et al. 2003) | User Behaviour | Model integrating various factors to predict user acceptance and behaviour toward e-public services | User-centric |
| UX Evaluation * | Usability, Satisfaction | Metric assessing overall user experience, encompassing usability, accessibility, and satisfaction with e-administrative services | User-centric |
| Digital Accessibility Evaluation * | Accessibility | Metric evaluating the accessibility of e-administrative services to ensure usability for individuals with disabilities | User-centric |
| Efficiency and Performance Metrics * | Performance Metrics | Metrics assessing the efficiency and performance of e-administrative services, including response time, throughput, server uptime, and resource utilization | User-centric |
| Citizen-Centric Evaluation * | User Satisfaction, Expectations | Metric evaluating the extent to which e-administrative services are citizen-centric and meet user needs and expectations | User-centric |
| Digital Inclusion Assessment * | Inclusiveness | Metric evaluating the inclusiveness of e-administrative services, ensuring accessibility to diverse user groups based on factors such as language diversity and outreach efforts | User-centric |
| Reference | Theoretical Foundation | Evaluation Metrics (Number) | Statistically Significant Factors (Number) | R2 |
|---|---|---|---|---|
| (Davis 1989) | MLR | Usefulness, Ease of Use (2) | Usefulness (1) | 0.31–0.74 |
| (Venkatesh et al. 2003) | PLS-SEM | Effort Expectancy, Performance Expectancy, Social Influence, Facilitating Conditions (4) | Effort Expectancy, Performance Expectancy (2) | 0.36–0.77 |
| (Papadomichelaki and Mentzas 2012) | e-GovQual | Ease of Use, Trust, Functionality of the Interaction Environment, Reliability, Content and Appearance of Information, Citizen Support (6) | Efficiency, Reliability, Citizen Support, Trust (4) | 0.547 |
| (Xie et al. 2017) | TAM, TPB, UTAUT, Trust, Risk | Perceived Usefulness, Perceived Ease of Use, Trust, Risk (4) | Perceived Usefulness, Perceived Ease of Use, Trust, Risk (4) | 0.740 |
| (Kurfali et al. 2017) | UTAUT, Trust | Perceived Usefulness, Perceived Ease of Use, Social Influence, Facilitating Conditions, Trust (5) | Perceived Usefulness, Social Influence, Facilitating Conditions, Trust (4) | 0.584 |
| (Lallmahomed et al. 2017) | UTAUT2, GAM | Perceived Usefulness, Perceived Ease of Use, Social Influence, Facilitating Conditions, Perceived Price Value, Computer Self Efficacy, Trustworthiness (7) | Perceived Usefulness, Facilitating Conditions, Perceived Price Value, Computer Self Efficacy, Trustworthiness (5) | 0.380 |
| (Mensah et al. 2020) | UMEGA | Perceived Usefulness, Perceived Ease of Use, Social Influence, Perceived Risk (4) | Perceived Risk (1) | 0.626 |
| (Camilleri 2020) | TAM | Perceived Usefulness, Perceived Ease of Use, Social Influence, Facilitating Conditions (4) | Perceived Usefulness, Perceived Ease of Use, Social Influence, Facilitating Conditions (4) | 0.380 |
| (ElKheshin and Saleeb 2020) | TAM | Perceived Usefulness, Perceived Ease of Use (2) | Perceived Usefulness, Perceived Ease of Use (2) | 0.604 |
| (AlHadid et al. 2022) | TAM, TPB, UTAUT, Trust, Risk, ML | Perceived Usefulness, Perceived Ease of Use, Social Influence, Facilitating Conditions, Trust, Risk, Service Quality, Reliability (8) | Perceived Usefulness, Perceived Ease of Use, Social Influence, Facilitating Conditions, Trust, Service Quality, Reliability (7) | 0.485 |
| (Nugroho et al. 2022) | UMEGA | Perceived Usefulness, Perceived Ease of Use, Social Influence, Perceived Risk (4) | Perceived Ease of Use, Perceived Risk (2) | 0.389 |
| (Garcia-Rio et al. 2023) | UMEGA | Perceived Usefulness, Perceived Ease of Use, Social Influence, Perceived Trust (4) | Perceived Usefulness, Social Influence (2) | 0.694 |
| Variables of the Sample | No. of Respondents | Percentage (%) | |
|---|---|---|---|
| 1. Gender | Male | 66 | 25.6 |
| Female | 192 | 74.4 | |
| 2. Age | Under 20 | 77 | 29.8 |
| Between 21 and 30 | 87 | 33.7 | |
| Between 31 and 40 | 35 | 13.6 | |
| Between 41 and 50 | 43 | 16.7 | |
| Over 50 | 16 | 6.2 | |
| 3. Place of residence | City | 161 | 62.4 |
| Town | 86 | 33.3 | |
| Village | 11 | 4.3 | |
| 4. Municipality/Province | - | - | - |
| 5. Monthly income per household member | Less than BGN 1320 | 140 | 54.3 |
| More than BGN 1320 | 118 | 45.7 | |
| 6. Education | High school | 153 | 59.3 |
| Bachelor | 59 | 22.9 | |
| Master | 42 | 16.3 | |
| PhD | 4 | 1.6 | |
| 7. Do you use electronic administrative services? | No | 64 | 24.8 |
| Yes | 194 | 75.2 | |
| Q10.1 | Q10.2 | Q10.3 | Q11.1 | Q11.2 | Q11.3 | Q11.4 | Q12.1 | Q12.2 | |
| Cluster #1 | 2.968 | 2.903 | 2.371 | 2.661 | 2.629 | 2.823 | 3.097 | 2.274 | 2.145 |
| Cluster #2 | 4.144 | 4.114 | 3.568 | 3.424 | 3.614 | 3.985 | 4.136 | 3.402 | 3.364 |
| Difference | −1.176 | −1.211 | −1.197 | −0.763 | −0.985 | −1.162 | −1.039 | −1.128 | −1.219 |
| Q12.3 | Q13.1 | Q13.2 | Q13.3 | Q14.1 | Q14.2 | Q14.3 | Q14.4 | Q14.5 | |
| Cluster #1 | 2.355 | 3.387 | 3.387 | 3.129 | 2.903 | 2.919 | 2.968 | 2.935 | 2.274 |
| Cluster #2 | 3.333 | 4.576 | 4.417 | 4.220 | 3.947 | 4.205 | 4.129 | 4.212 | 3.530 |
| Difference | −0.978 | −1.189 | −1.030 | −1.091 | −1.044 | −1.286 | −1.161 | −1.277 | −1.256 |
| Q15.1 | Q15.2 | Q15.3 | Q16.1 | Q16.2 | Q16.3 | Q17.1 | Q17.2 | Q17.3 | |
| Cluster #1 | 3.081 | 2.613 | 2.710 | 2.500 | 2.500 | 2.177 | 2.371 | 2.500 | 2.371 |
| Cluster #2 | 3.947 | 3.848 | 3.955 | 4.076 | 4.091 | 3.432 | 3.788 | 3.879 | 3.735 |
| Difference | −0.866 | −1.235 | −1.245 | −1.576 | −1.591 | −1.255 | −1.417 | −1.379 | −1.364 |
| Q18.1 | Q18.2 | Q19.1 | Q19.2 | Q19.3 | Q20.1 | Q20.2 | |||
| Cluster #1 | 3.097 | 2.839 | 2.823 | 2.565 | 2.419 | 2.629 | 2.452 | ||
| Cluster #2 | 3.114 | 3.068 | 3.977 | 3.856 | 3.742 | 3.697 | 3.765 | ||
| Difference | −0.017 | −0.229 | −1.154 | −1.291 | −1.323 | −1.068 | −1.313 |
| Indicator Variable | Factor Loading | Indicator Variable | Factor Loading | Indicator Variable | Factor Loading | Indicator Variable | Factor Loading |
|---|---|---|---|---|---|---|---|
| ATT1 | 0.834 | FC1 | 0.926 | PT1 | 0.946 | SQT1 | 0.852 |
| ATT2 | 0.861 | FC2 | 0.965 | PT2 | 0.956 | SQT2 | 0.827 |
| ATT3 | 0.831 | FC3 | 0.893 | PT3 | 0.96 | SQT3 | 0.814 |
| ATT4 | 0.914 | PR1 | 0.959 | SQR1 | 0.854 | ||
| ATT5 | 0.740 | PR2 | 0.962 | SQR2 | 0.879 |
| Factor | DG rho | CR | AVE | VIF |
|---|---|---|---|---|
| Perceived Risk | 0.917 | 0.960 | 0.922 | 1.079 |
| Perceived Trust | 0.951 | 0.968 | 0.910 | 2.391 |
| Facilitating Conditions | 0.924 | 0.949 | 0.862 | 1.341 |
| Service Quality | 0.914 | 0.926 | 0.715 | 2.217 |
| Attitude | 0.898 | 0.921 | 0.702 |
| Factor | ATT | FC | PR | PT | SQ |
|---|---|---|---|---|---|
| Attitude | |||||
| Facilitating Conditions | 0.669 | ||||
| Perceived Risk | 0.193 | 0.033 | |||
| Perceived Trust | 0.623 | 0.520 | 0.145 | ||
| Service Quality | 0.67 | 0.473 | 0.082 | 0.774 |
| Hypothesis | Sample Mean | Mean | SD | t Statistics | p Values | R2 | f2 | Q2 | |
|---|---|---|---|---|---|---|---|---|---|
| H4 Facilitating Conditions → Attitude | 0.389 | 0.389 | 0.387 | 0.078 | 4.972 | 0.000 | 0.559 | 0.256 | 0.385 |
| H5 Perceived Risk → Attitude | 0.185 | 0.185 | 0.182 | 0.051 | 3.628 | 0.000 | 0.072 | ||
| H6 Perceived Trust → Attitude | 0.210 | 0.21 | 0.204 | 0.085 | 2.461 | 0.014 | 0.042 | ||
| H7 Service Quality → Attitude | 0.276 | 0.276 | 0.284 | 0.094 | 2.921 | 0.004 | 0.078 |
| ML Method | MSE | MAE | R2 |
|---|---|---|---|
| Decision Tree | 0.110 | 0.175 | 0.868 |
| SVM | 0.096 | 0.170 | 0.665 |
| Random Forest | 0.056 | 0.130 | 0.933 |
| AdaBoost | 0.049 | 0.111 | 0.941 |
Disclaimer/Publisher’s Note: The statements, opinions and data contained in all publications are solely those of the individual author(s) and contributor(s) and not of MDPI and/or the editor(s). MDPI and/or the editor(s) disclaim responsibility for any injury to people or property resulting from any ideas, methods, instructions or products referred to in the content. |
© 2024 by the authors. Licensee MDPI, Basel, Switzerland. This article is an open access article distributed under the terms and conditions of the Creative Commons Attribution (CC BY) license (https://creativecommons.org/licenses/by/4.0/).
Share and Cite
Ilieva, G.; Yankova, T.; Ruseva, M.; Dzhabarova, Y.; Zhekova, V.; Klisarova-Belcheva, S.; Mollova, T.; Dimitrov, A. Factors Influencing User Perception and Adoption of E-Government Services. Adm. Sci. 2024, 14, 54. https://doi.org/10.3390/admsci14030054
Ilieva G, Yankova T, Ruseva M, Dzhabarova Y, Zhekova V, Klisarova-Belcheva S, Mollova T, Dimitrov A. Factors Influencing User Perception and Adoption of E-Government Services. Administrative Sciences. 2024; 14(3):54. https://doi.org/10.3390/admsci14030054
Chicago/Turabian StyleIlieva, Galina, Tania Yankova, Margarita Ruseva, Yulia Dzhabarova, Veselina Zhekova, Stanislava Klisarova-Belcheva, Tanya Mollova, and Angel Dimitrov. 2024. "Factors Influencing User Perception and Adoption of E-Government Services" Administrative Sciences 14, no. 3: 54. https://doi.org/10.3390/admsci14030054