THz Reflective Imaging System Utilizing Broadband Homodyne Amplification for Artifact-Free See-Through Imaging


Terahertz Research Section, Future & Basic Technology Research Division, ICT Creative Research Laboratory, Electronics and Telecommunications Research Institute, 218 Gajeongno, Yuseong-gu, Daejeon 34129, Korea
*
Author to whom correspondence should be addressed.
Appl. Sci. 2020, 10(20), 7228; https://doi.org/10.3390/app10207228
Submission received: 17 September 2020
/
Revised: 14 October 2020
/
Accepted: 14 October 2020
/
Published: 16 October 2020
(This article belongs to the Special Issue Nondestructive Testing (NDT): Volume II)
Abstract
:Featured Application
Non-destructive inspection of plastic and ceramic products.
Abstract
Terahertz (THz) technology offers unique see-through imaging capability for various non-destructive inspection applications. In this work, we implemented a broadband continuous-wave THz imaging system to study technical issues related to the see-through imaging, including frequency-dependent resolution, material loss, and interference-induced artifacts. The interference-induced false contrast and artifacts were observed, which were suppressed by broadband imaging techniques adopting the homodyne signal amplification by interferometric setup to overcome the material loss.
Keywords:
terahertz; imaging; non-destructive; continuous-wave; telecentric; raster scanning; broadband; interference1. Introduction
Terahertz (THz) wave permits unique “see-through” imaging of optically opaque objects that are made of non-metallic materials such as plastics and ceramics [1]. This unique aspect of THz imaging is promising for non-destructive testing (NDT) [2] and security applications [3]. Compared to X-ray imaging systems, the THz imaging systems are free from bio-safety issues. Practical issues with THz imaging systems include see-through depth, resolution, imaging speed, and suppression of interference effect. Of those issues, see-through depth and interference effects would be much more important than other issues, especially when considering NDT applications.
While various real-time THz imaging systems have been realized by using high-power, single-frequency THz emitters, significant interference fringes can appear. The interference fringes, or more generally the interference-induced artifacts, significantly hamper the recognition of the inside objects and faults, especially in reflective imaging systems [4]. Another issue is the selection of the imaging frequency, which is related to the material absorption and the resolution. In general, images obtained at high-frequency offer better resolution. However, the material loss increases at high frequencies even with plastics in contrast to the general perception that they are transparent to the THz waves. Therefore, the tuning of the frequency over a wide range is very important in a THz see-through imaging system.
Currently, photonics technology provides frequency-tunable continuous-wave sources [5,6] or broadband THz pulse sources [7,8]. With those emitters, various raster-scan-based single-detector imaging systems have been demonstrated [9,10,11], demonstrating lateral and depth resolution of 4.1 mm and 0.45 mm, respectively, with a continuous-wave imaging system [9]. They achieved 100 s of imaging time for 100 × 100 pixels. By replacing the THz emitter with a fast-scanning THz–time-domain spectroscopy (TDS) system, similar resolutions have been achieved with the same optical arrangement, achieved 10 s of imaging time for 100 × 100 pixels [10]. Recently, a high-speed reflective imaging system was demonstrated, achieving ~2 s and 1.26 mm of imaging time and lateral resolution, with a fast-scanning polygon mirror [12]. Compared to the array detector system, much better spatial resolution can be obtained by the raster-scan system, because in the raster-scan system, the spatial resolution is determined by the spot size on the sample surface rather than the spot size on the detector surface.
For high-speed two-dimensional raster scanning, a telecentric f-θ lens has been combined with mechanical beam deflectors such as polygon mirrors [12] and Galvano scanners [10,11]. In such a mechanical scanning system, image distortion due to the scanning geometry should be corrected [13,14,15]. In a typical two-dimensional Galvano scanner system, two moving mirrors for the horizontal (azimuth) beam sweep and vertical (elevation) beam sweep are separated, which complicates the optics design. A similar problem also exists in the polygon mirror beam scanners. For high spatial resolution, it is preferable to increase the diameter of the collimated beam to be focused on the sample to minimize the spot size on the sample surface. Thus, the beam expanding and the design of the scanning mirrors are important as well. In broadband emitters such as uni-traveling-carrier photodiodes (UTC-PD)s, the beam divergence strongly depends on the frequency. This complicates the design of a broadband imaging system.
In this work, we discuss critical issues in the THz see-through imaging system, including broadband resolution, see-through capability, and interference-induced artifacts. For the study, we constructed a frequency-tunable two-dimensional THz imaging system using a UTC-PD as the THz emitter. For the raster-scanning of the THz beam, a two-axis rotating monogon reflector and a telecentric f-θ lens was used. With spatial filtering of the focused THz beam, diffraction-limited resolutions were obtained over a broadband spectral range. To overcome the material loss and the problems related to the interference artifacts, we propose a homodyne amplification technique combined with broadband imaging.
2. Experimental Setup
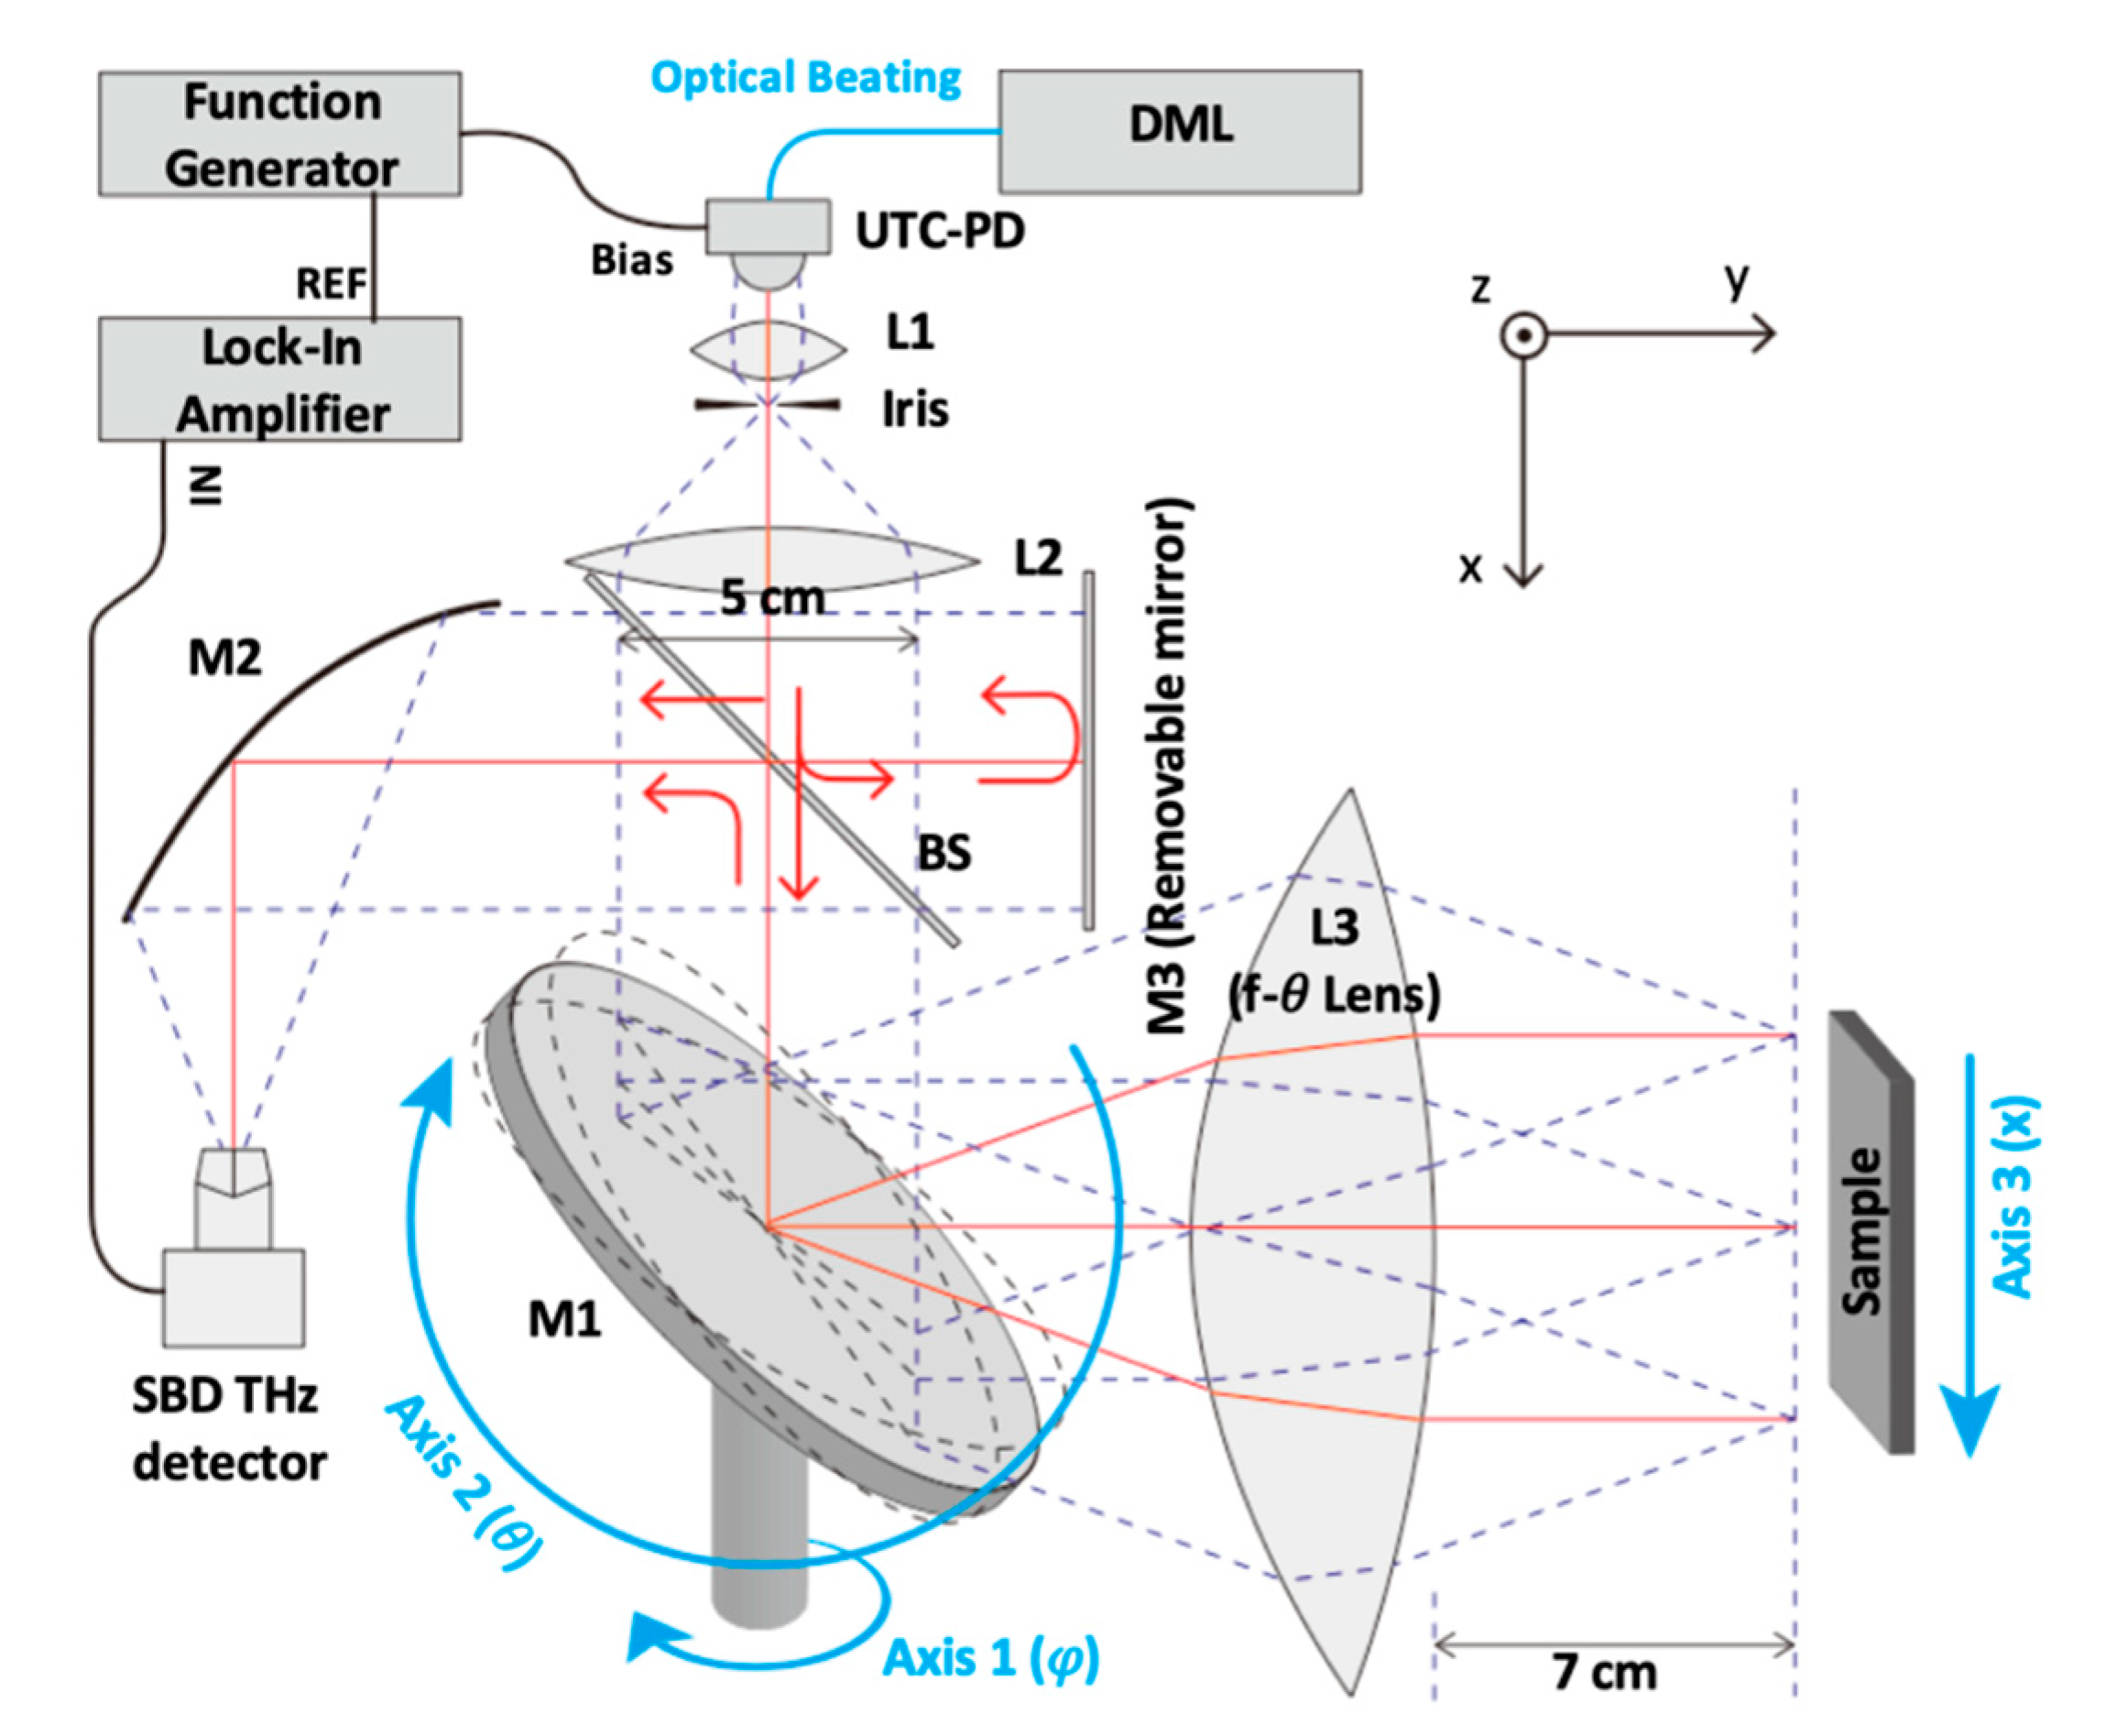
The schematic of the THz imaging system is shown in Figure 1. A dual-mode laser (DML) generates a frequency-tunable optical beating signal, which was converted to the THz radiation by a UTC-PD. The output power of the THz radiation was about 50 microwatt at 300 GHz. Details of the DML and the UTC-PD were described in our previous works [6,10,11]. We used two custom-designed, high-density polyethylene lenses (L1 and L2) and a variable iris for the spatial filtering and the collimation of the THz beam. A membrane-type 50:50 THz beam splitter (BS) [16] was inserted. The transmitted THz beam was mechanically scanned by a 7 cm diameter circular monogon mirror. The mirror surface was tilted by 45° from its primary rotating axis (axis 1). For two-dimensional beam steering, another rotating axis (axis 2) was inserted, and the center of the mirror surface was located at the crossing of the two axes so that the reflection point on the mirror surface was invariant during the mirror rotation. The reflected THz beam was deflected and focused on the sample surface by a custom-designed telecentric f-θ lens (L3). The working distance of L3 was set to be 7 cm, and the distortion-free field of view (FOV) diameter was estimated to be ~6 cm with a scanning angle of 40° (−20° ~ 20°) for both axes. The THz beam reflected from the sample surface was directed and focused on a commercial Schottky barrier diode (SBD) through the BS and an off-axis parabolic mirror (M2) of 5 cm effective focal length. A lock-in amplifier was used, with modulation frequency and time constant of 100 kHz and 300 μs, respectively.
Another motor-actuated translator (axis 3) moved the sample mount for larger samples. Images can either be obtained by axis 1 and 3 (mode 1), or by axis 1 and 2 (mode 2). Axis 1 scanned the beam direction repeatedly in the forward and backward directions. Although the maximum speed of the motor is 300 rpm, the scan speed of axis 1 was set to be 1.4 s/line including acceleration and deceleration time for mechanical stability. Total imaging time depends on the number of lines. It requires 14 min to obtain an image of 600 lines (1240 × 600 pixels). A removable mirror M3 was inserted for homodyne signal amplification, which will be described later. For single-frequency imaging, M3 should be removed to prevent the interference effect.
3. Results
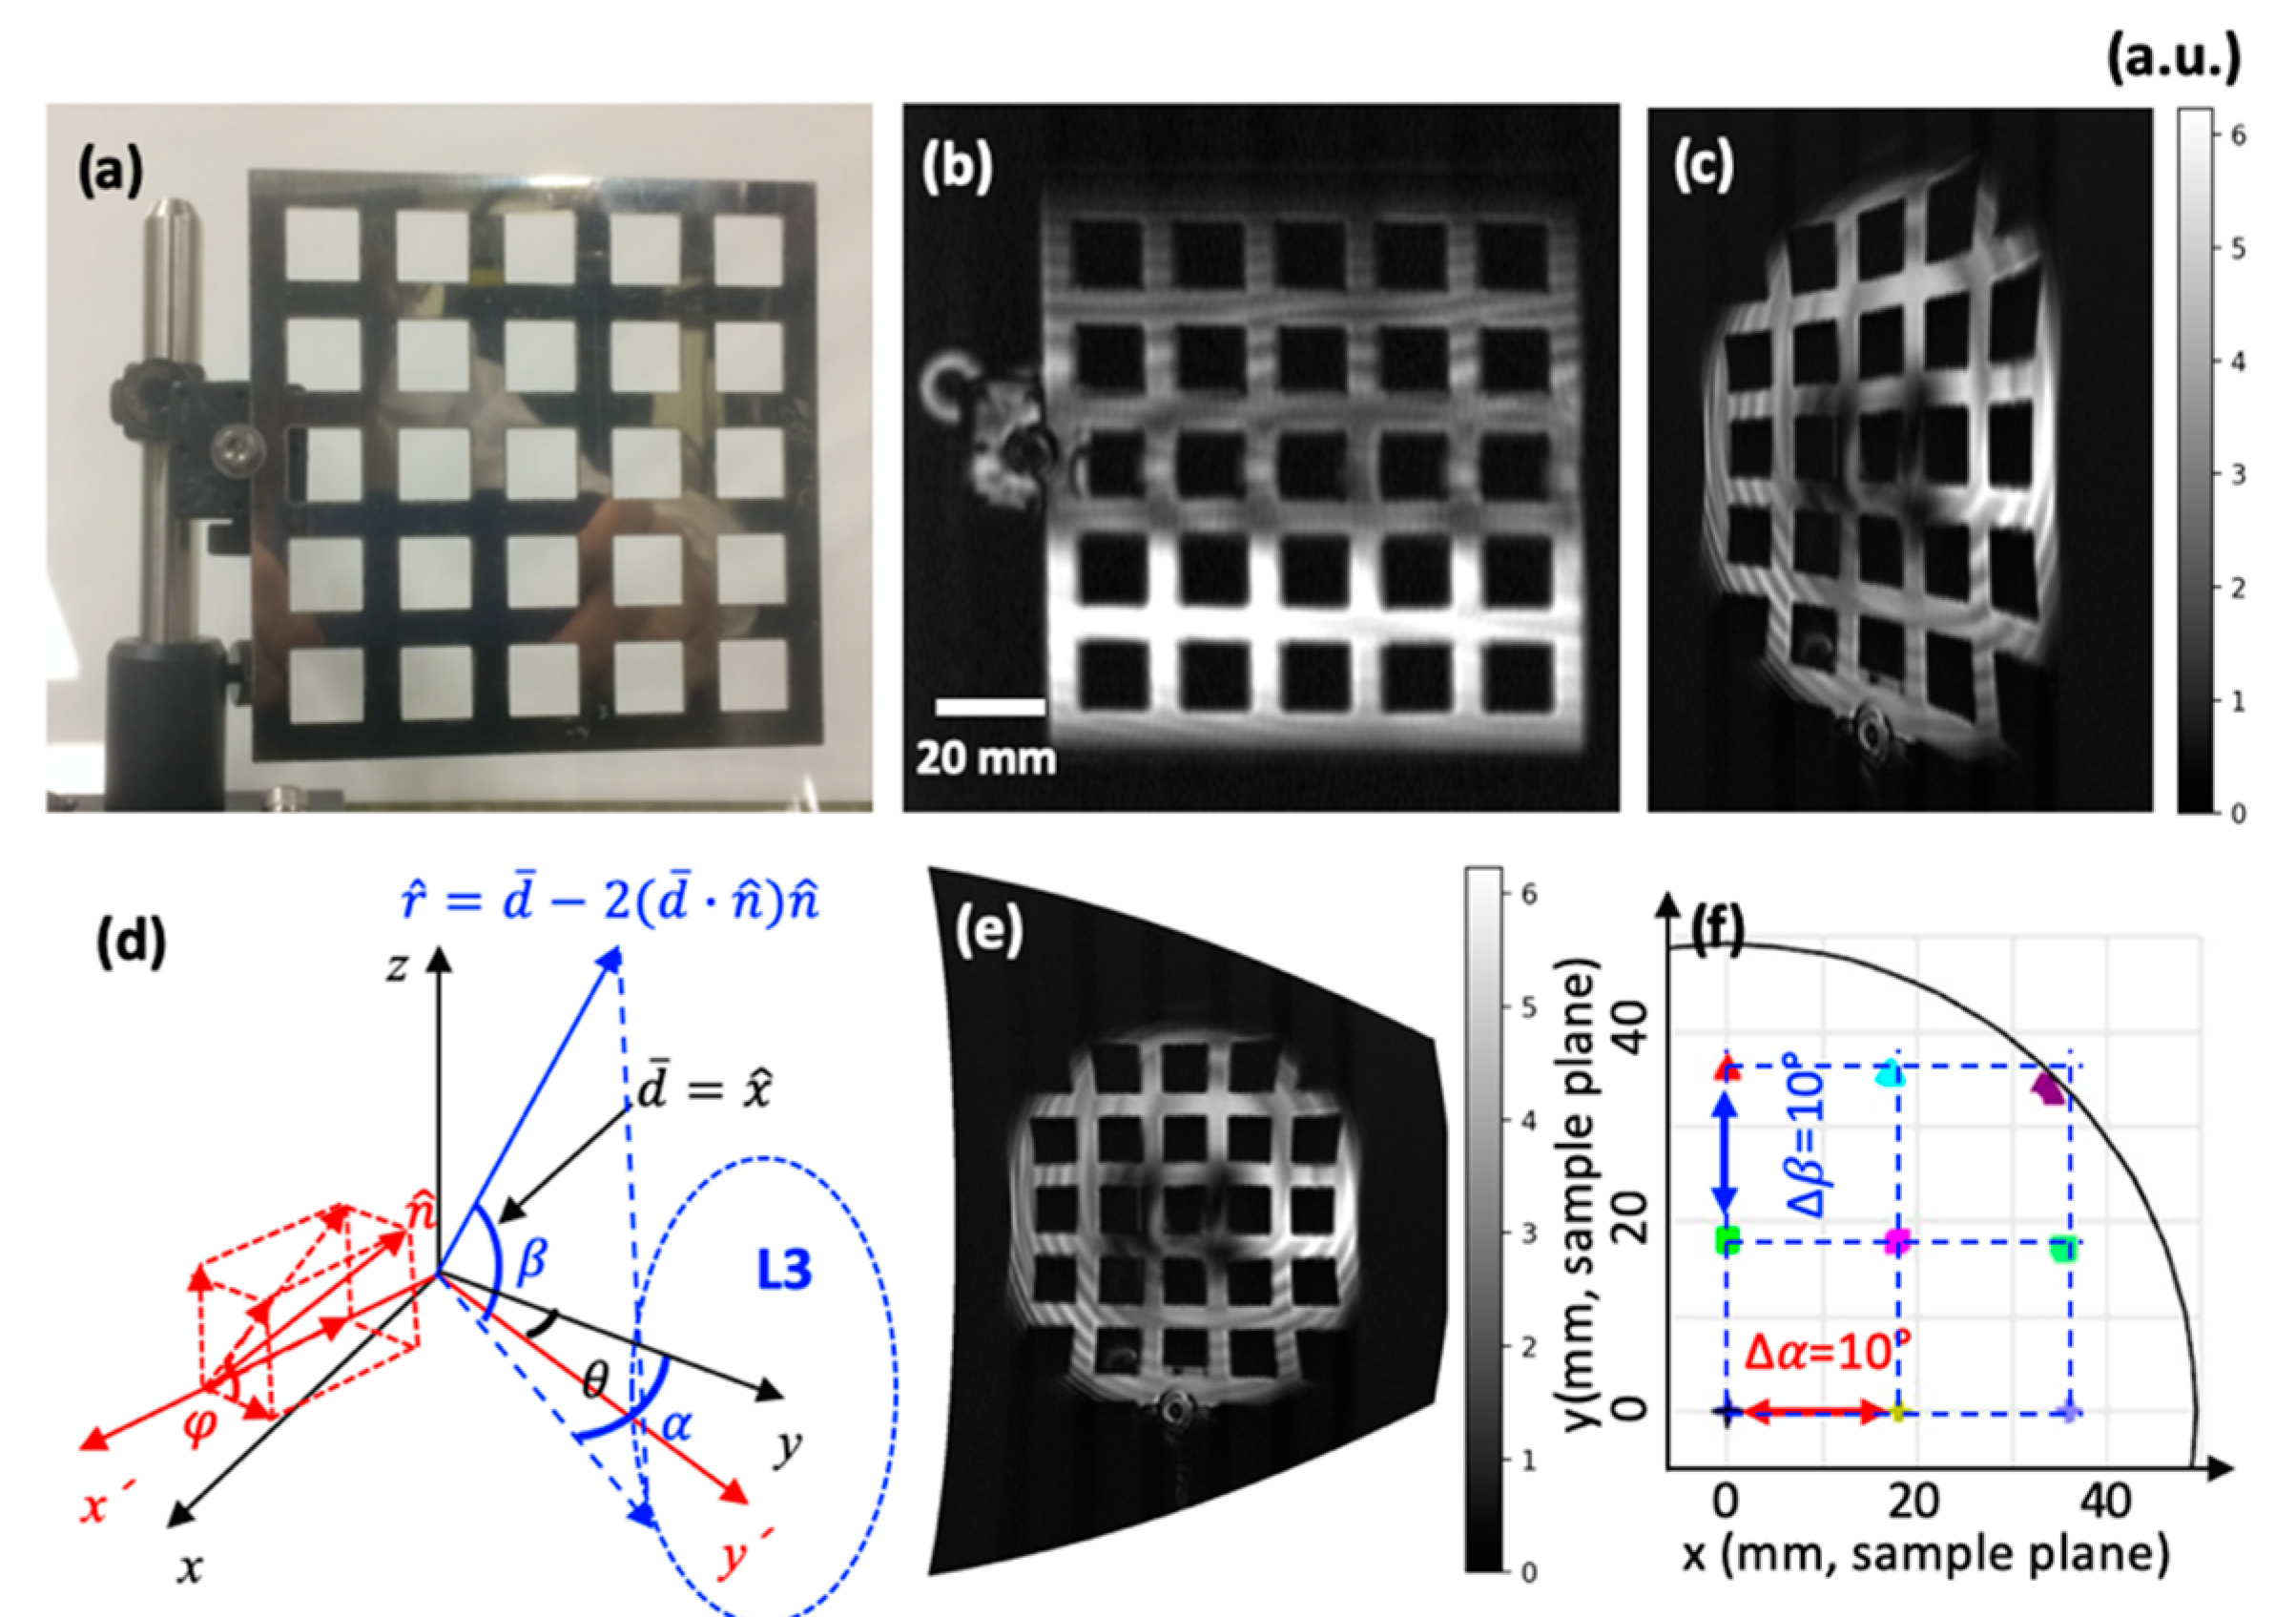
First, the FOV of the imaging system was estimated. We imaged a metallic square grid sample (grid period 2 cm, Figure 2a) with the scan angle of 80°, twice times of the designed scan angle, as shown in Figure 2a. The images were acquired at 0.67 THz in mode 1 (Figure 2b) and mode 2 (Figure 2c). The FOV of the system was estimated to be ~10 cm in diameter. In mode 2, however, a significant image distortion was observed when the image was presented in the coordinate system of the reflector (M1) angle. To correct this, the image should be presented in the coordinate system of the deflected angle.
The relationship between the reflector angle (φ and θ represent axis 1 and axis 3 angle, respectively) and the deflection angle of the beam (α and β represent the azimuth and elevation angle, respectively) can be calculated as follows. In Figure 2d, unit vectors along the incident beam direction, the surface normal direction of the mirror, and the deflected beam direction are designated by , , and , respectively. The axis of the mirror rotation (axis 1) is the x-axis of the primed coordinate system. Here, is expressed by:
The primed and unprimed coordinates are related by:
Thus, in the unprimed coordinate, can be expressed by:
The unit vector for the deflected beam, , is calculated by:
As a result, α and β are calculated by the following equations.
By applying the (5) and (6), the mode 2 image (Figure 2c) was corrected, as shown in Figure 2e. Outside of the designed field of view (6 cm in diameter), small distortions were still observed even after the correction. This is due to the lens (L3) design. To show this, we presented the projection of a ray grid on the object surface, shown in Figure 2f. The input ray grid was rectangular in the α–β coordinates of which period was 10° in both directions. Outside of the designed FOV area, the projected footprint deviates from an ideal rectangular grid. This explains the residual distortion.
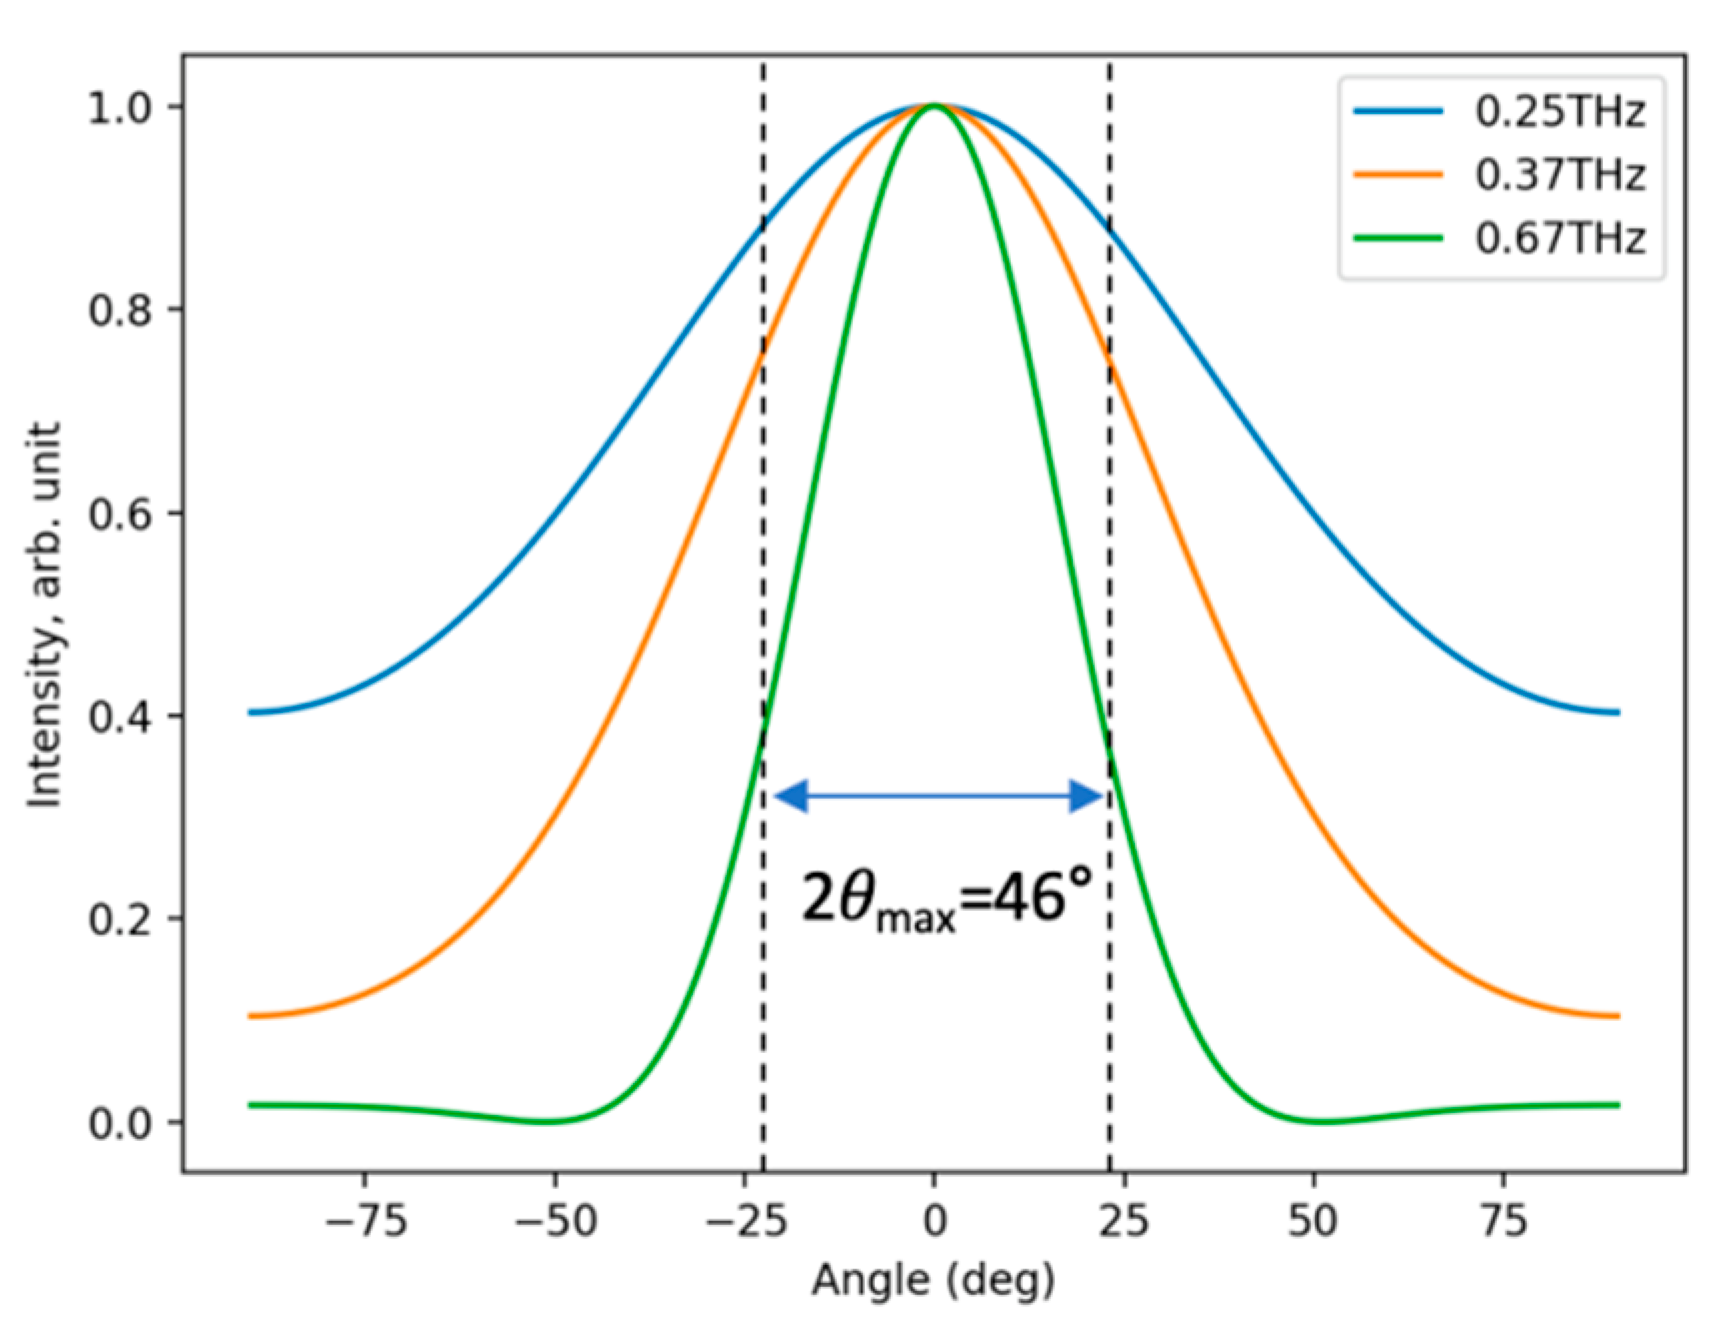
For the best resolutions over the broad frequency region, the collimated beam diameter should be as large as possible, which is practically limited by the size of the optics. In the case of the current imaging setup, the beam diameter is limited by the size of L2 and the reflector, to be 5 cm. To ensure the maximum beam diameter after the collimation lens, L2, a variable iris is inserted at the focus of L1. The iris opening diameter was optimized at 0.67 THz for the best resolution and image quality, using a QR code pattern engraved on the metal surface of a painted steel plate. As shown in Figure 3b–d, the resolution was improved when the iris opening diameter was decreased. The enhanced resolution is due to the diffraction by the iris aperture which increases the beam divergence angle to be larger than the acceptance angle of L2 (see Figure A1 of Appendix A). Thus, the size of the beam after passing L2 becomes 5 cm due to the clipping of the beam. The collimated beam shape would be similar to the Gaussian shape at high frequencies while becoming more similar to the flat-top hat shape at lower frequencies. Thus, the focused beam profile on the sample surface is expected to deviate from an ideal Gaussian shape and would be close to the Airy disk shape at low frequencies. For simplicity, however, we assumed a Gaussian beam profile for the resolution estimation.
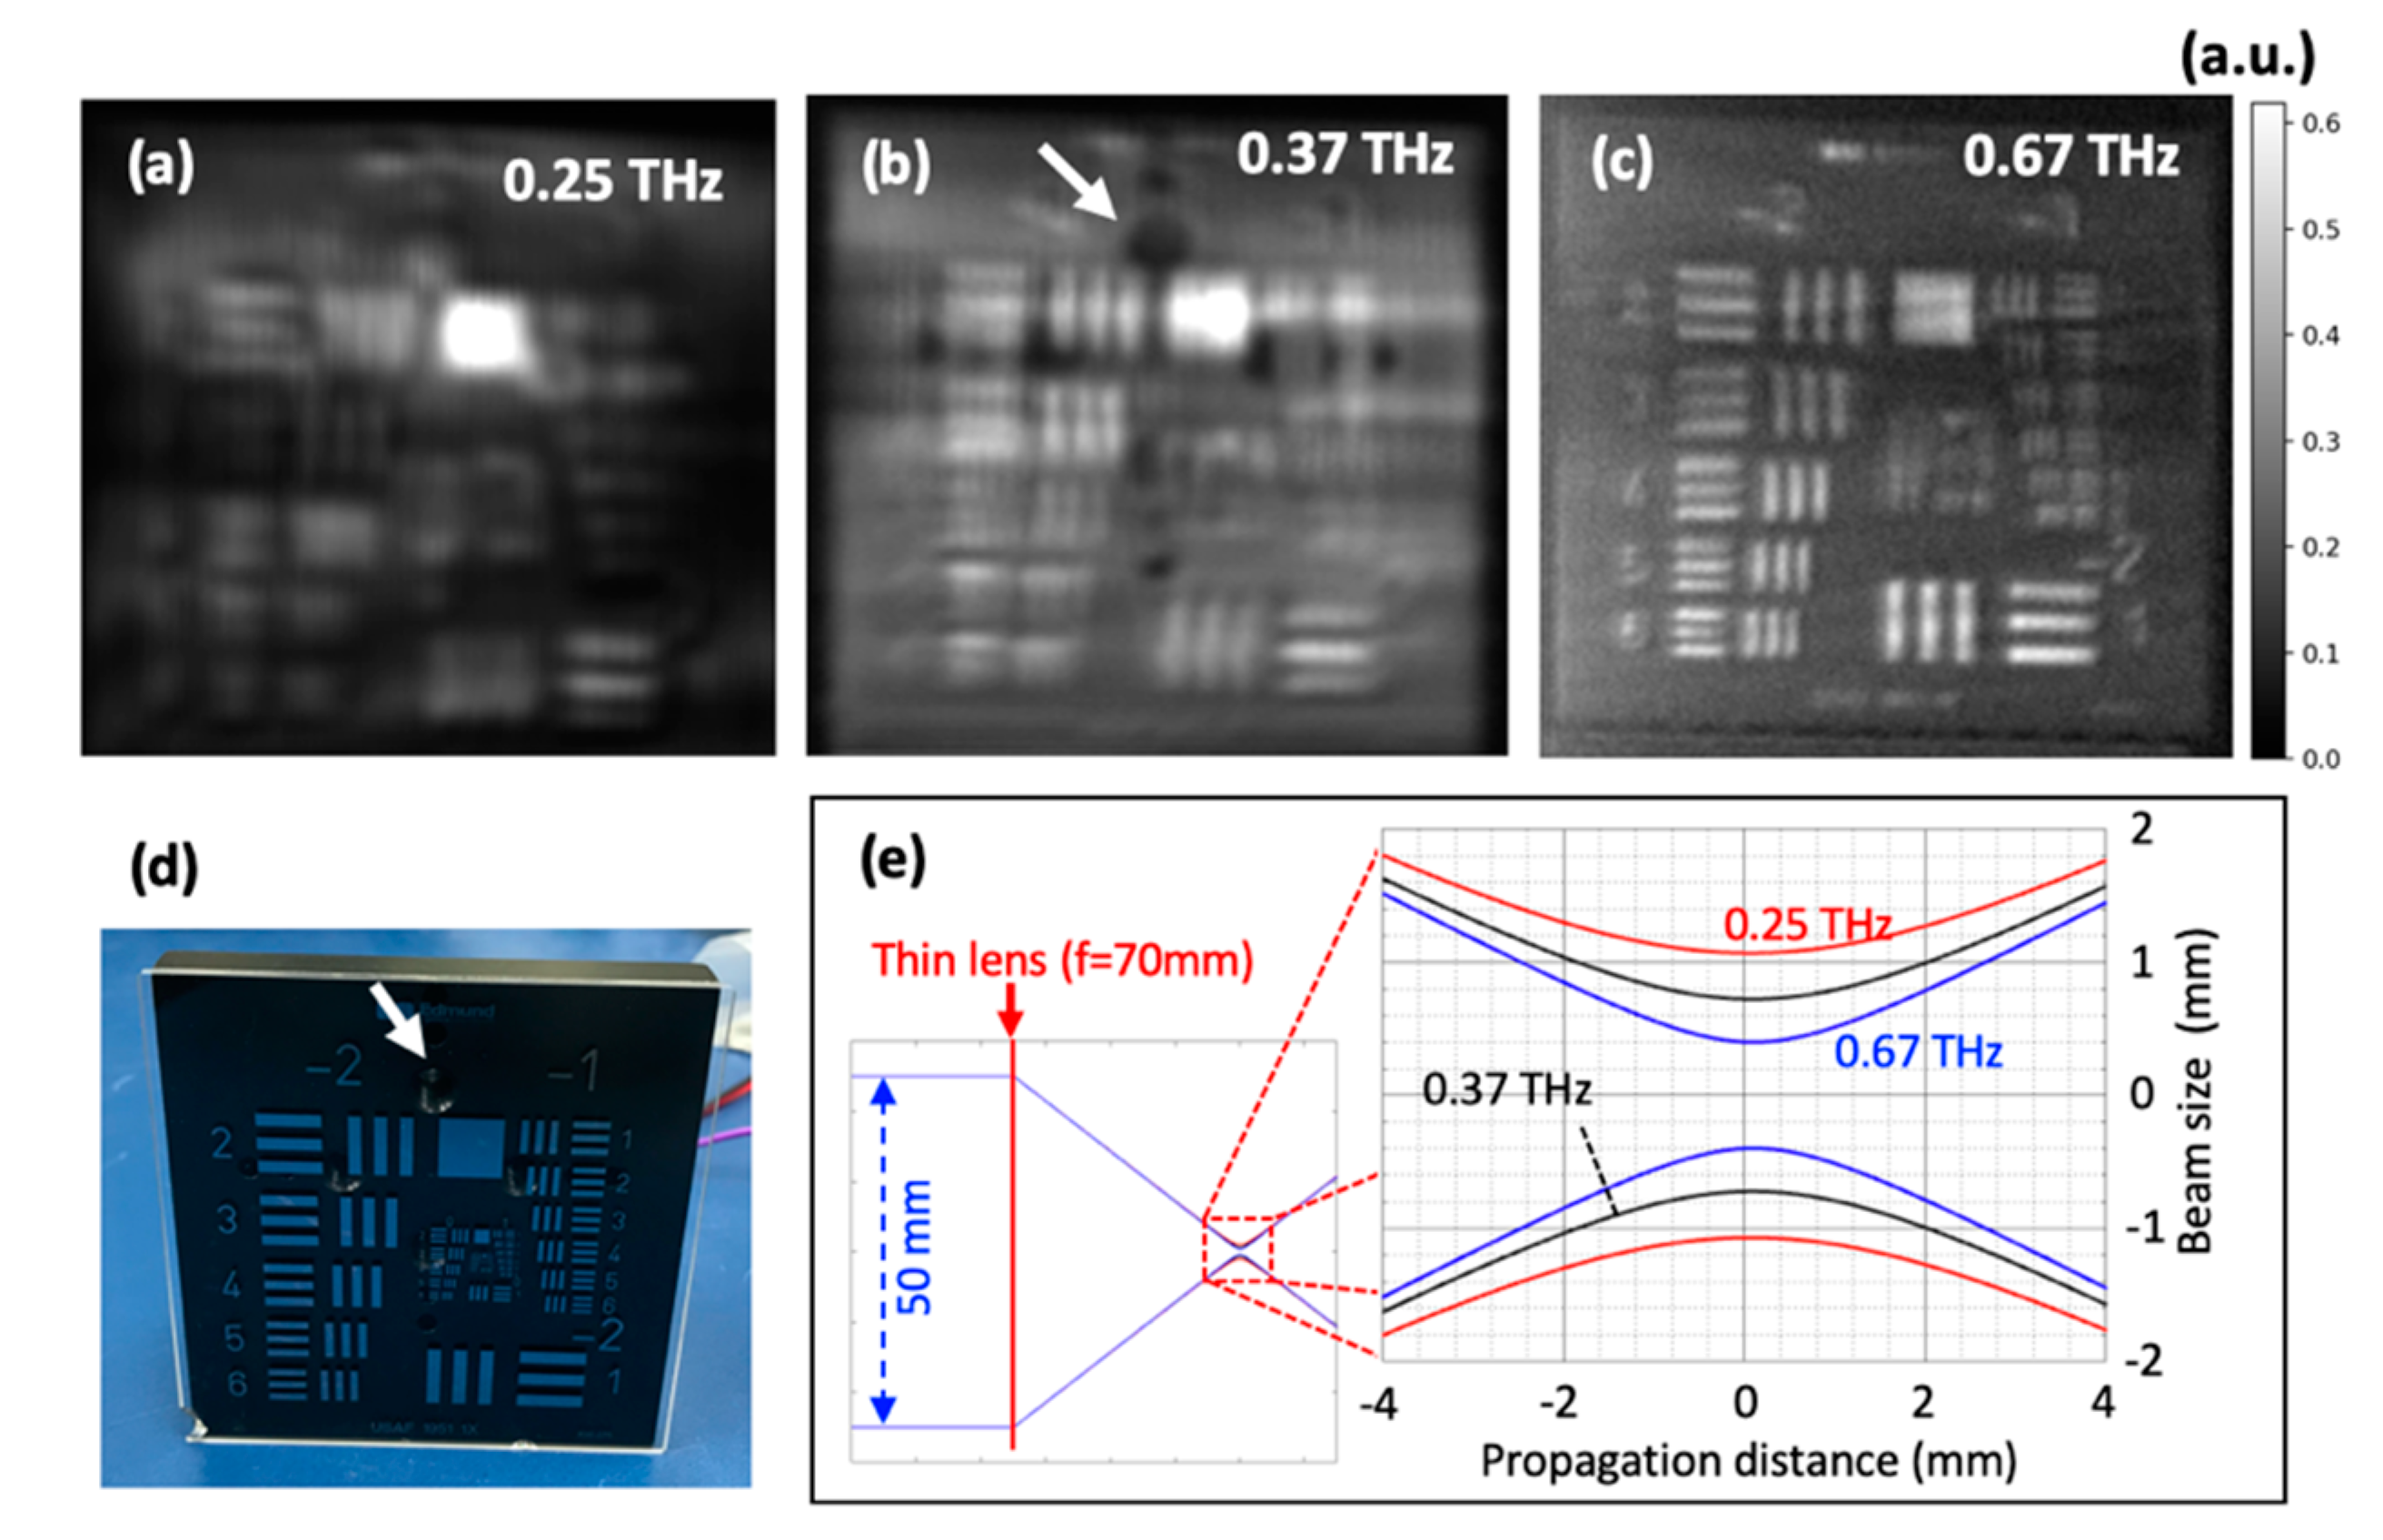
The resolution of the system was estimated by a positive-pattern USAF 1951 glass slide resolution reticle (Edmund Optics Inc.) at three different frequencies of 0.25 THz, 0.37 THz, and 0.67 THz, as shown in Figure 4a–c, respectively. The reticle is shown in Figure 4d. At 0.25 THz and 0.37 THz, up to the pattern 2 and 4 in the group -2 were resolved, respectively. These correspond to 0.280 and 0.353 line pairs/mm. In this pattern, the distances between the lines are 1.786 mm and 1.416 mm. At 0.67 THz, up to the pattern 4 of the group -1 was resolved, which corresponds to 0.707 line pairs/mm (0.707 mm line spacing). From those values, we estimate the system resolutions to be 1.786 mm, 1.416 mm, and 0.707 mm for 0.25 THz, 0.37 THz, and 0.67 THz, respectively. The experimental resolutions were compared to the theoretical spot sizes calculated by the Gaussian approximations as shown in Figure 4e. In the calculation, L3 was replaced by an ideal thin lens of 7 cm focal length. The focal diameters were calculated to be 2.13 mm, 1.44 mm, and 0.798 mm, for 0.25 THz, 0.37 THz, and 0.67 THz, respectively, as shown in Figure 4e. The experimental results and the theoretical calculations agreed well, which correspond to 1.48, 1.75, and 1.58 times of the wavelength for 0.25, 0.37, and 0.67 THz, respectively.
Another interesting observation to be noted from Figure 4 is that the visibility of the metal mount, behind the glass reticle, strongly depends on the imaging frequency. The mount has several tapped holes, one of them is indicated by the white arrow in Figure 4b,d. The holes are clearly identified at 0.37 THz, but not at other frequencies due to poor resolution (0.25 THz) and strong absorption due to the glass substrate (0.67 THz) [17,18]. These results show the importance of frequency selection in the THz see-through imaging and the need for THz imaging systems to support wideband frequencies.
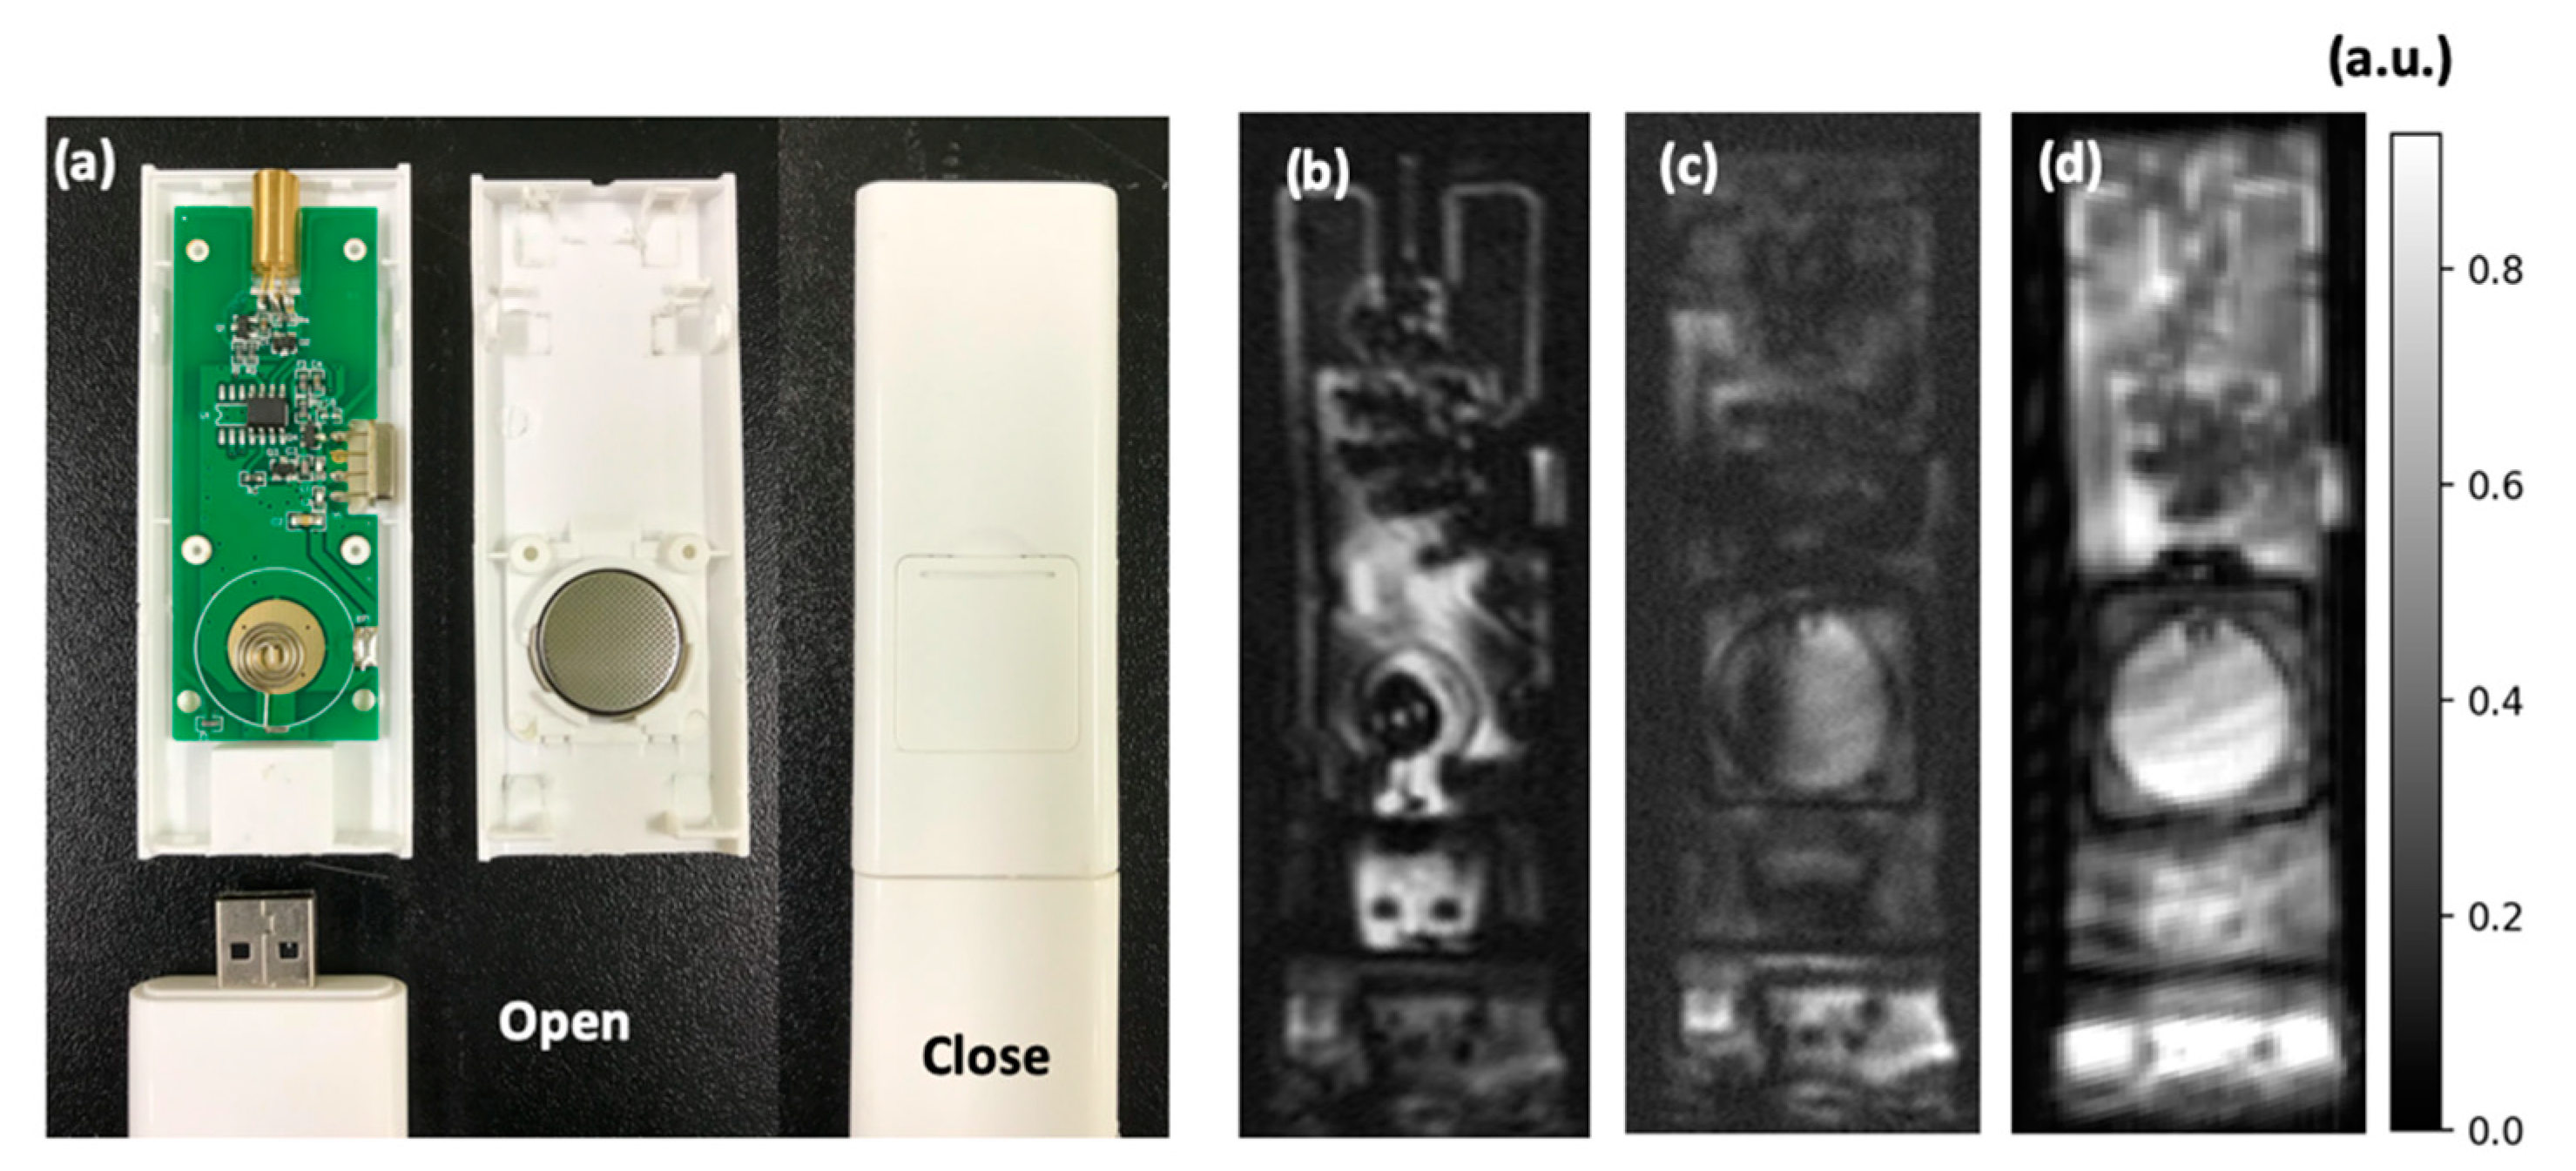
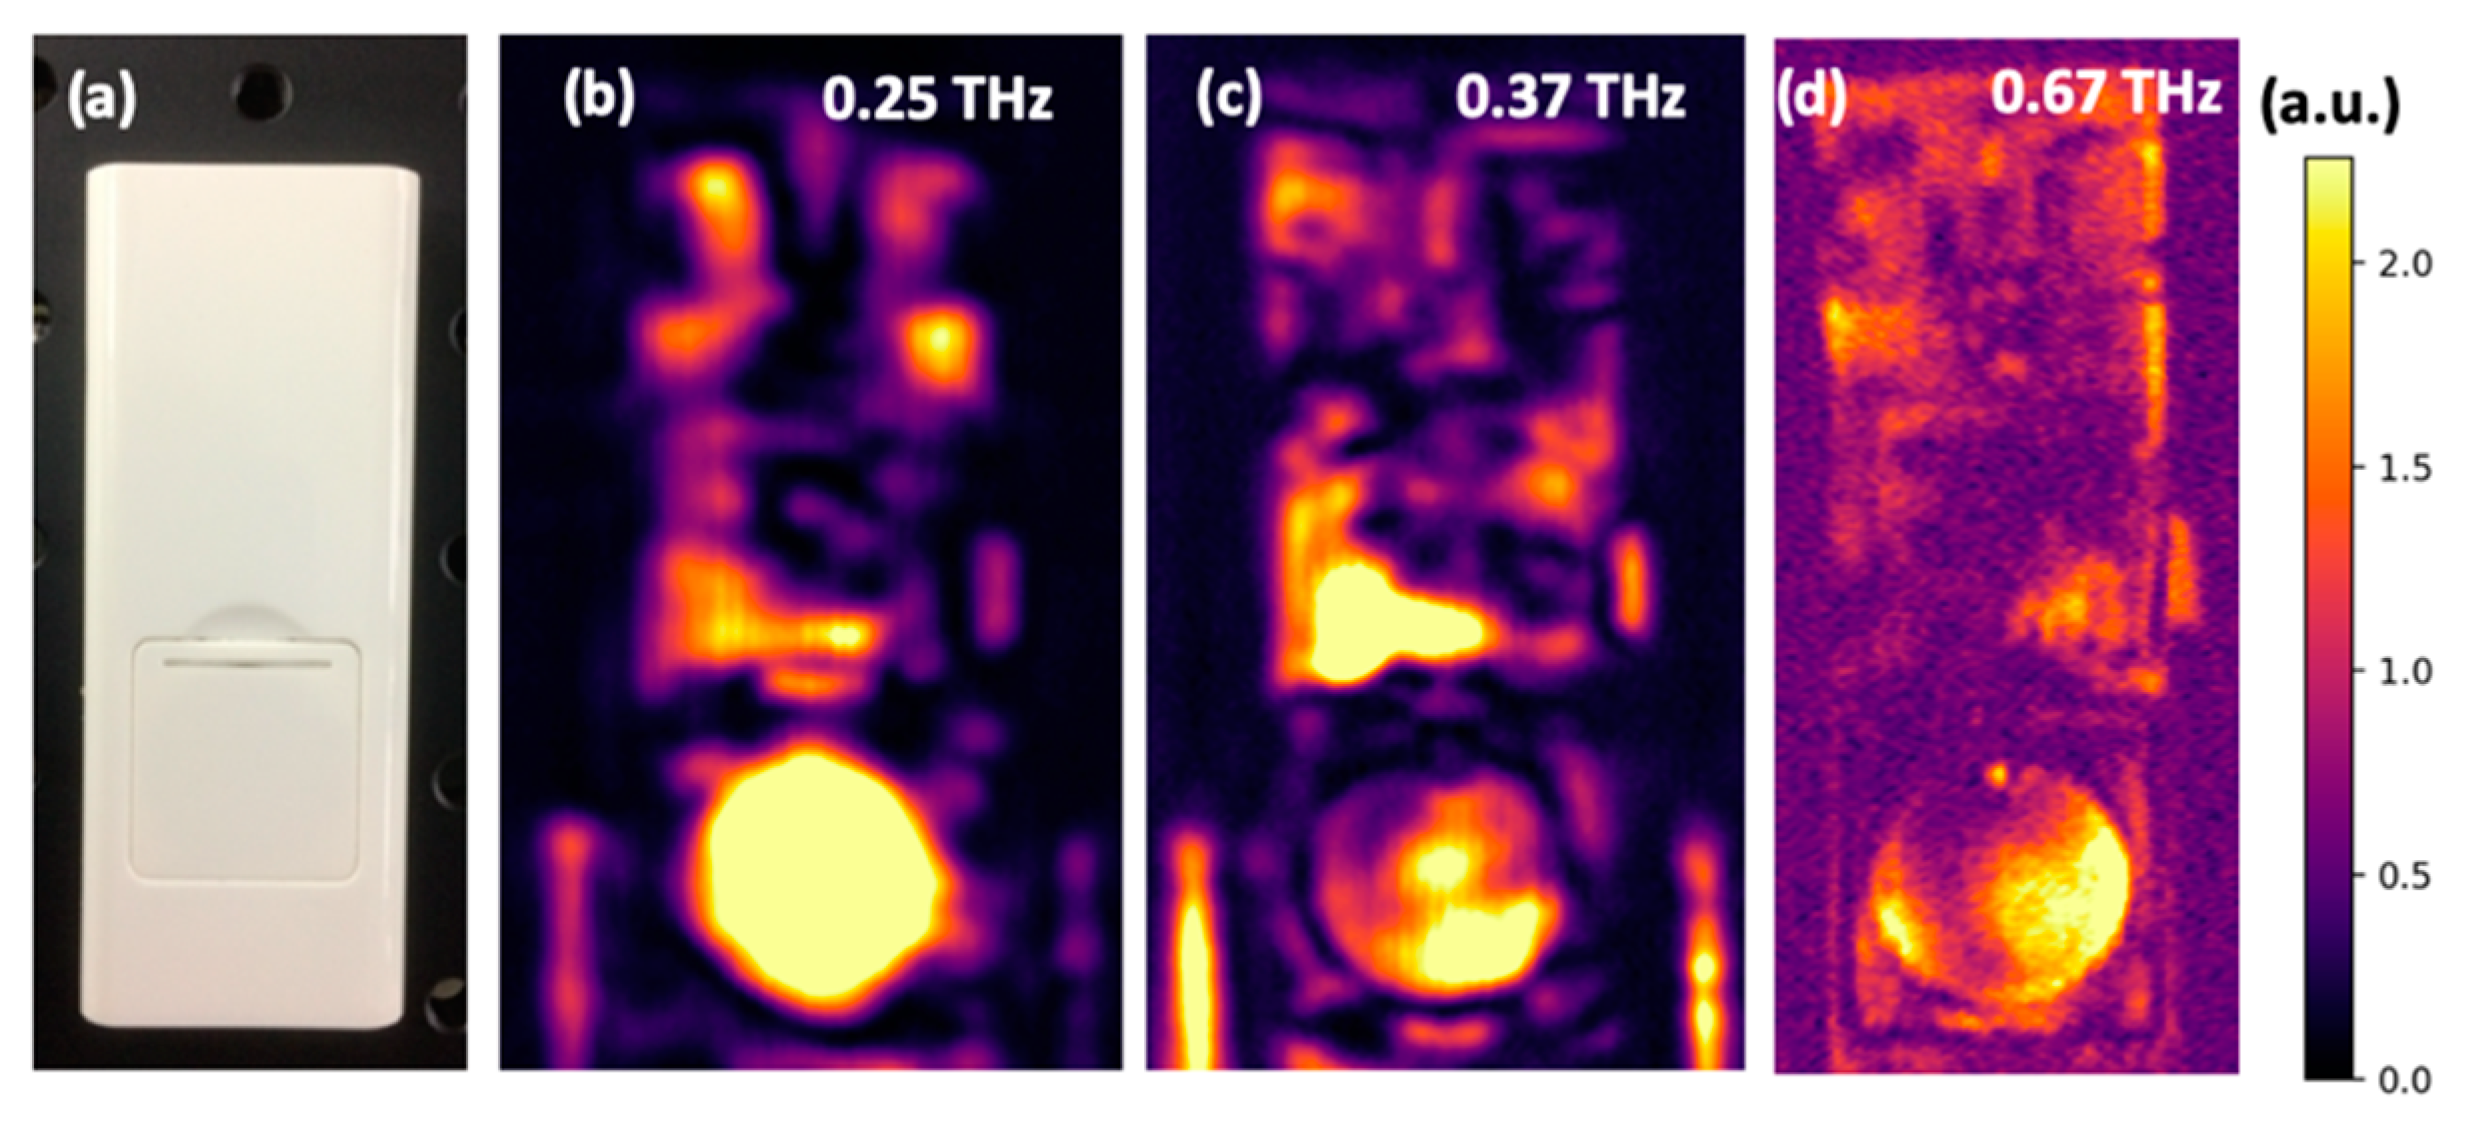
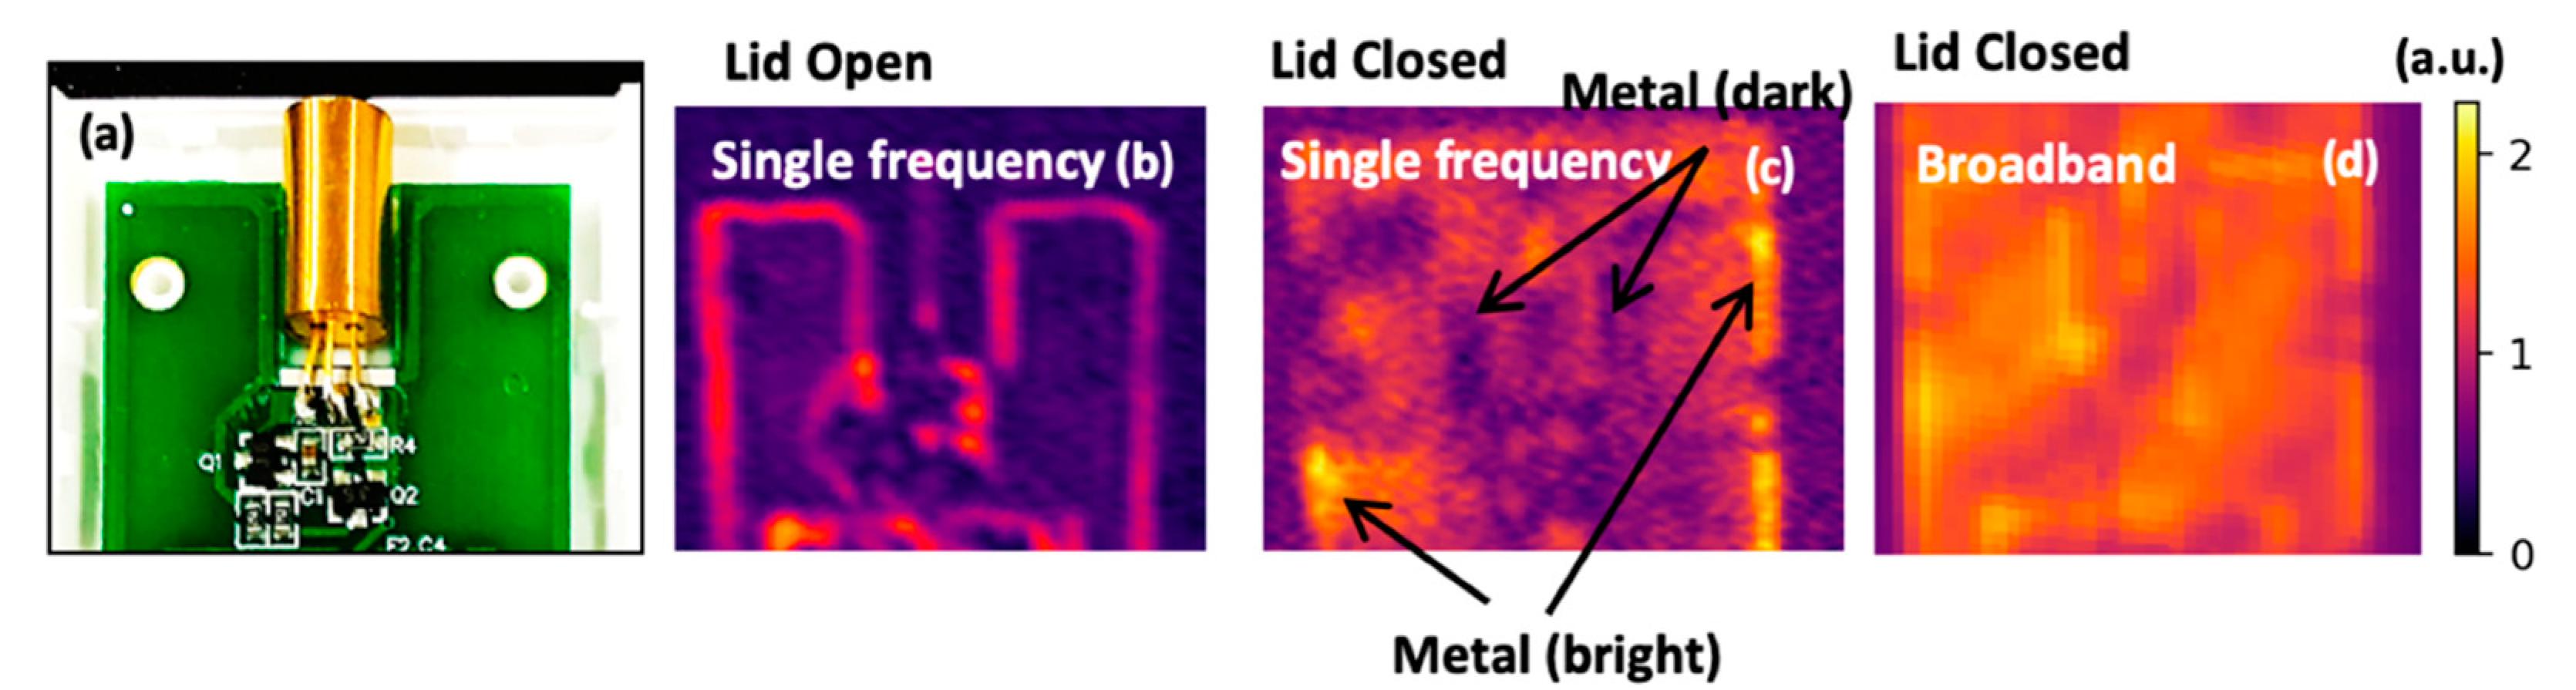
As a more practical example of see-through imaging, a commercial laser pointer was imaged at 0.67 THz, as shown in Figure 5. Images were also obtained at 0.25 THz and 0.37 THz for comparison (see Figure A2 of Appendix A). The pointer is composed of two parts that can be mechanically combined, and a printed circuit board (PCB) is inside of the upper part and a USB connector and some electronics are inside of the lower part, as shown in Figure 5a. First, we opened the plastic lid of the upper part and joined the upper and the lower parts together to obtain a THz image as shown in Figure 5b. In the image, various metallic parts were clearly imaged including metal wiring patterns on the board and small electronic components. In addition, we could clearly see a USB connector and internal structures in the lower part of the pointer. Then, we imaged the pointer after closing the lid to demonstrate the see-through capability of the THz imaging system (Figure 5c). In the image, the battery was clearly shown, but details such as thin metal patterns, small electronic components on the board inside the pointer, and the USB connector were hardly recognized. Moreover, the contrast of the metal wiring patterns on the PCB board was reversed in some parts of the imaged area (see Figure A3 of Appendix A).
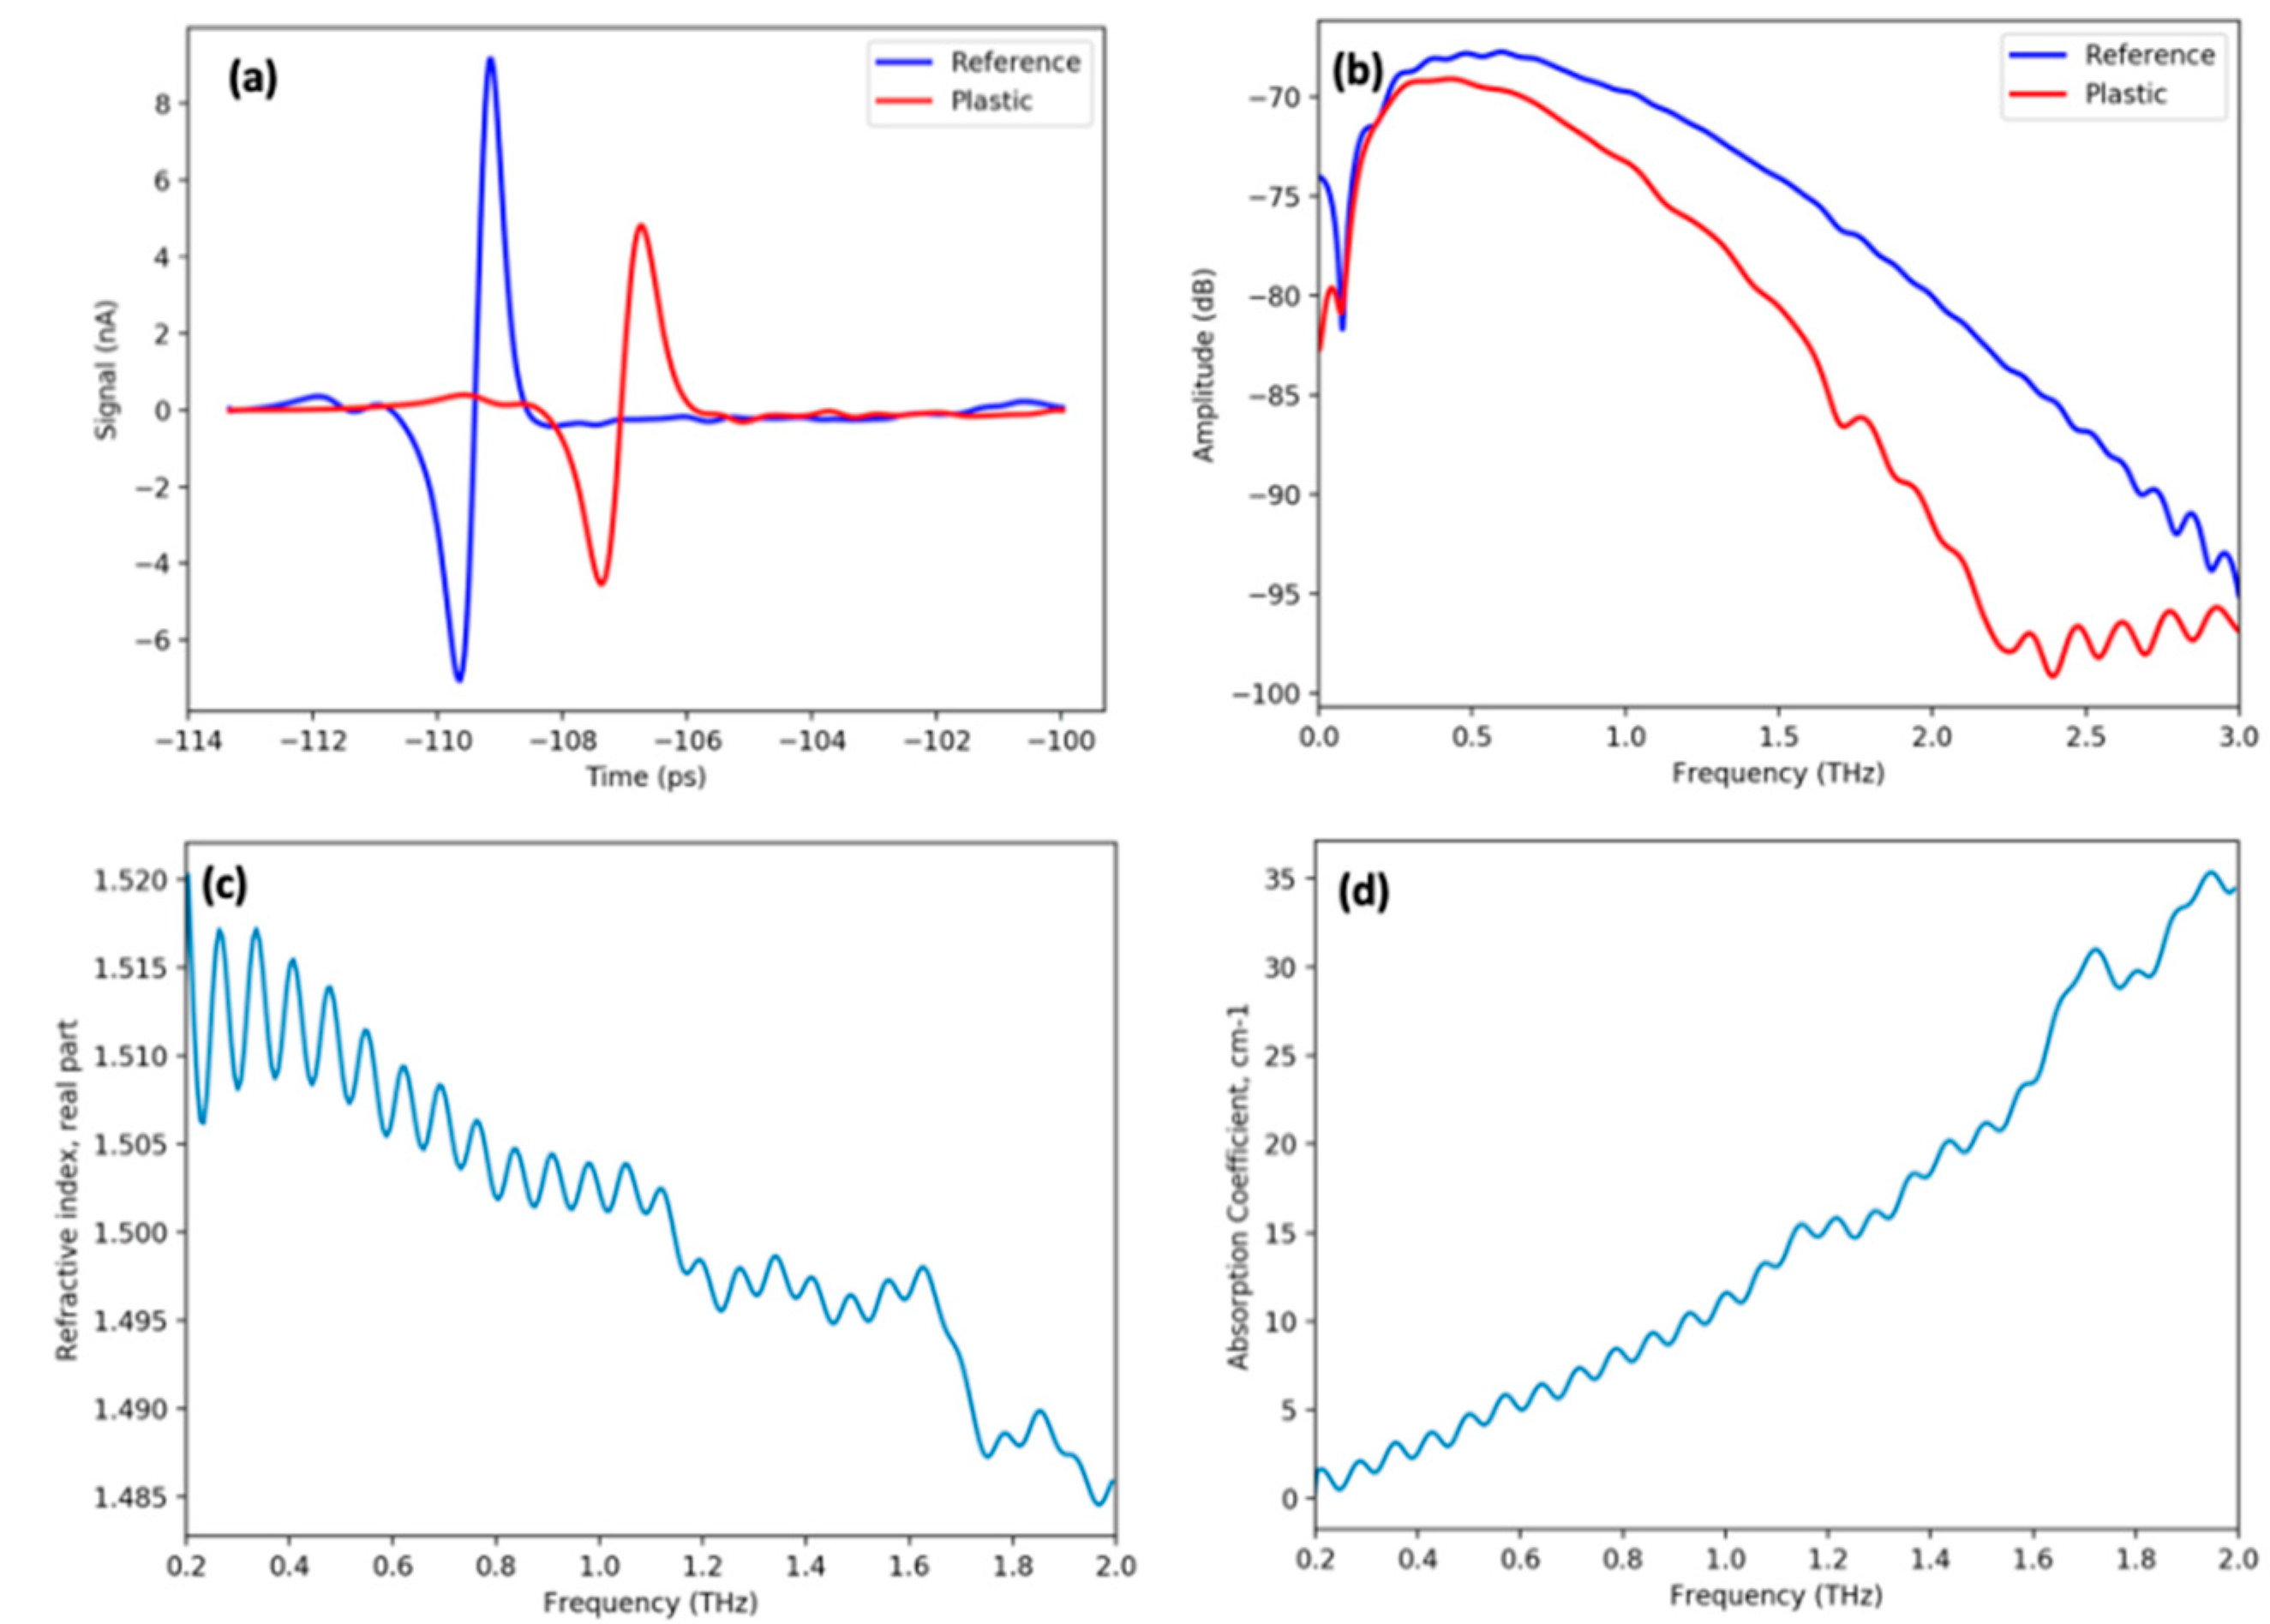
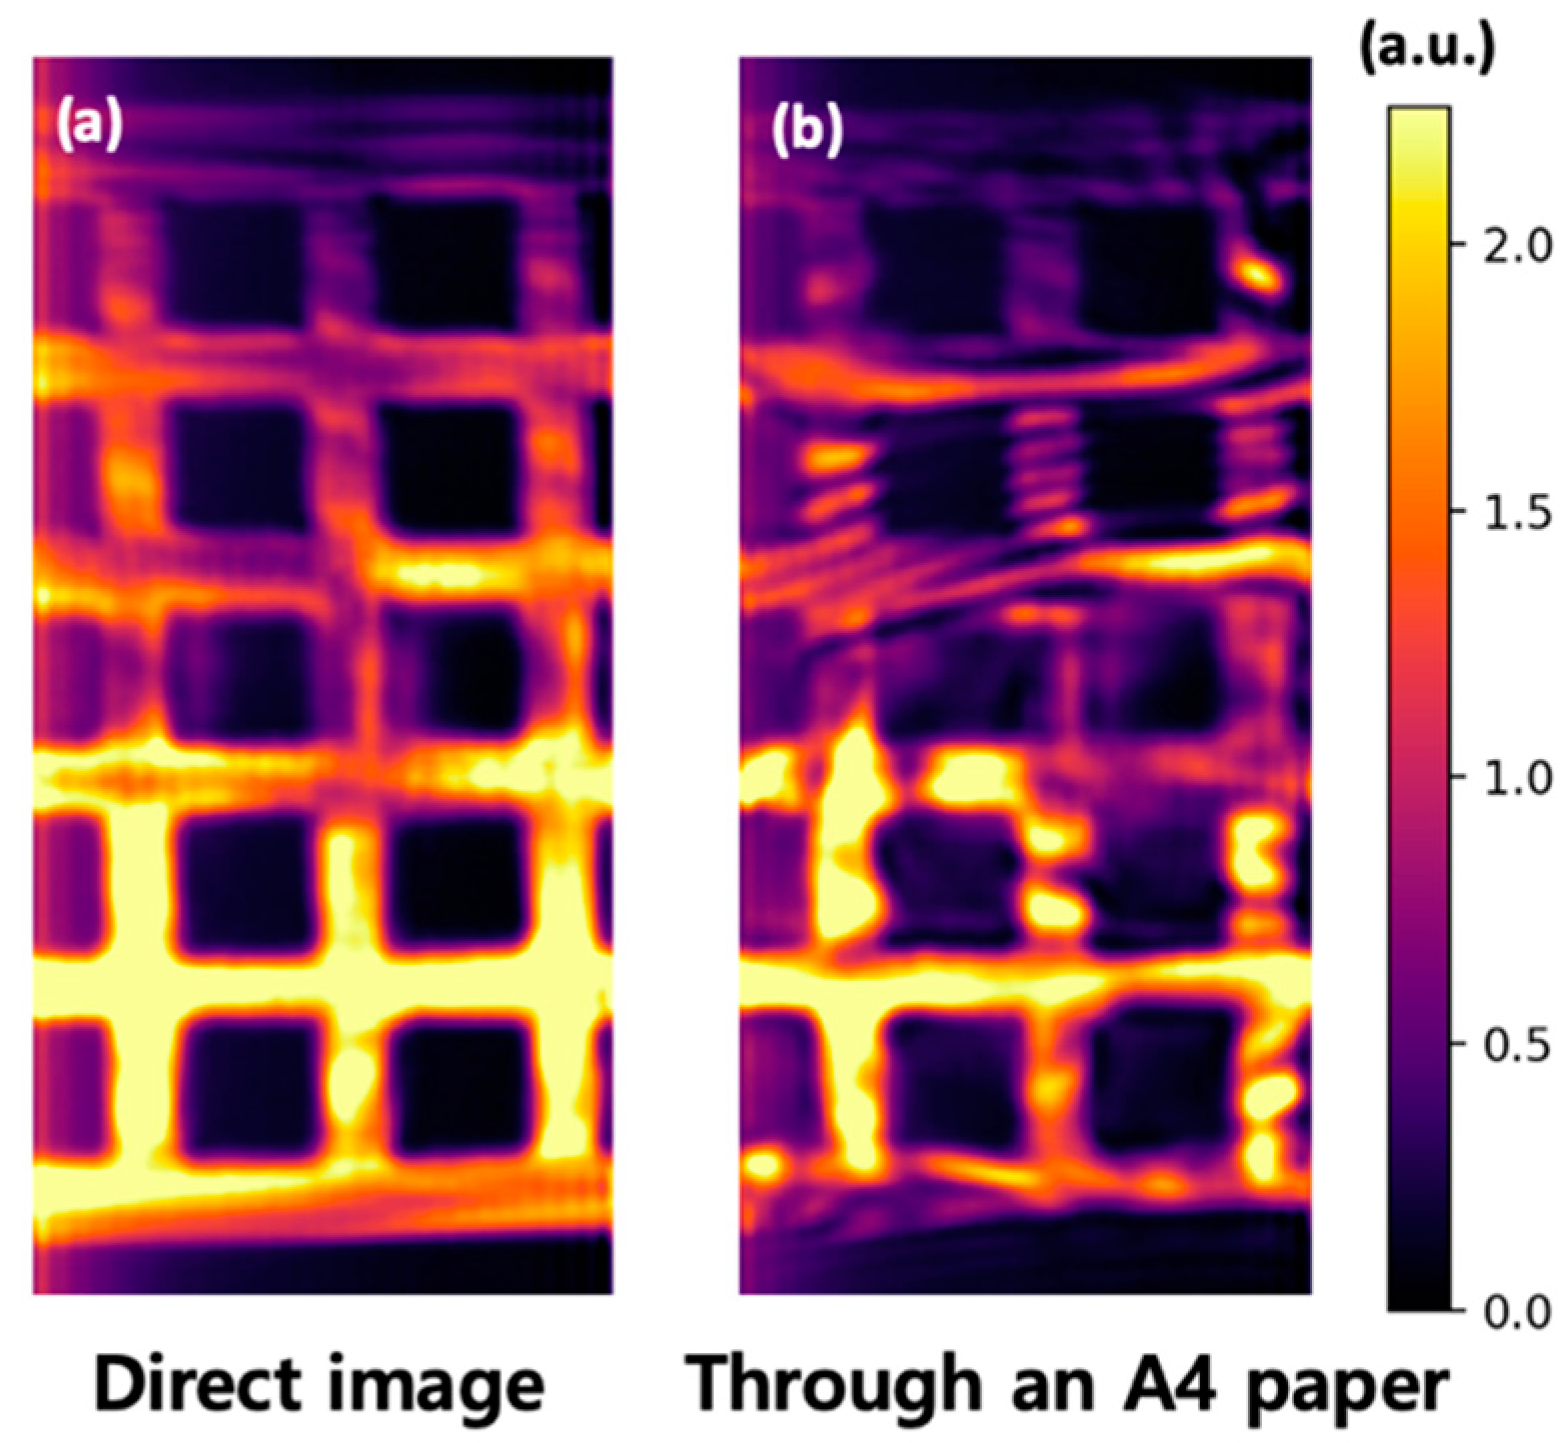
We identified two major problems. The first problem is the absorption by the plastic lid. We measured the plastic lid by the THz time-domain spectroscopy (THz–TDS) and found that the absorption coefficient increases as the frequency increases and becomes larger than 5 cm−1 at 0.5 THz (see Figure A4 of Appendix A). Unlike Teflon or high-density polyethylene, many commercial plastics absorb THz wave at high frequencies [18]. As a result, although high-frequency images provide high resolution, the frequency is practically limited by the signal-to-noise ratio of the system and the absorption loss of the material. The second problem is false contrast by the interference. As an example, at 0.67 THz, even a sheet of paper generates significant interference fringes in the image (see Figure A5 of Appendix A). The fault contrast of the metal patterns could be attributed to the interference effect and becomes a serious problem for higher frequencies.
If the false contrast is due to interference, it can be removed by averaging the image over a range of frequencies. Thus, we scanned the imaging frequency at each pixel to obtain a broadband image. Besides, to further improve the detected signal intensity, we inserted the reference mirror M3 to utilize the homodyne amplification mechanism as explained in the following.
The current-voltage (I-V) characteristics of SBDs can be approximated by Taylor expansion as follows.
Here, Vt is the turn-on voltage of the SBD, and VTHz is the voltage generated by the input THz wave that can be expressed by,
where VObj is generated by the THz beam from the sample, and VRef is by the THz beam from M3. LObj and LRef refer to the length of the THz beam path toward the sample and toward the M3, respectively. A and B corresponds to the electric field intensities from the sample object and the reference mirror, respectively. Ignoring higher-order terms, the rectification of the SBD detector is expressed by the square term of (7). By simple calculation, the rectified signal intensity can be expressed by:
Note that terms are ignored in the derivation of (9) because the high-frequency terms are not measured by the SBD due to the limited bandwidth. In (9), the second term is added by the interferometry, which can be interpreted as the amplification of the signal intensity A by , which can be considered as a gain with phase term. Although the cosine factor, which includes the phase difference, generates strong interference fringes during the frequency scan, they can be averaged out by post-processing. We experimentally estimated the homodyne gain. After replacing the sample with a switchable metallic mirror (MS), the signal intensity due to the metallic mirror was measured, with and without the reference mirror M3. Without M3, the contribution of the MS to the signal intensity was 0.17 mV (0.17 mV and 0 mV with and without the MS, respectively). With M3, signal intensity due to the mirror (MS) was 1.4 mV (4.5 mV and 3.1 mV with and without the MS, respectively). Thus, the homodyne gain was estimated to be ~8 times. For the estimation, the path difference (LObj-LRef) was set to be zero for each measurement. Note that the homodyne gain depends on the alignment accuracy, sample reflectivity, and path loss. After inserting M3 and scanning the THz frequency over a range from 0.5 THz to 0.7 THz at each pixel, the false contrast was corrected and the detailed shape of the PCB board under the plastic lid was clearly revealed, as shown in Figure 5d.
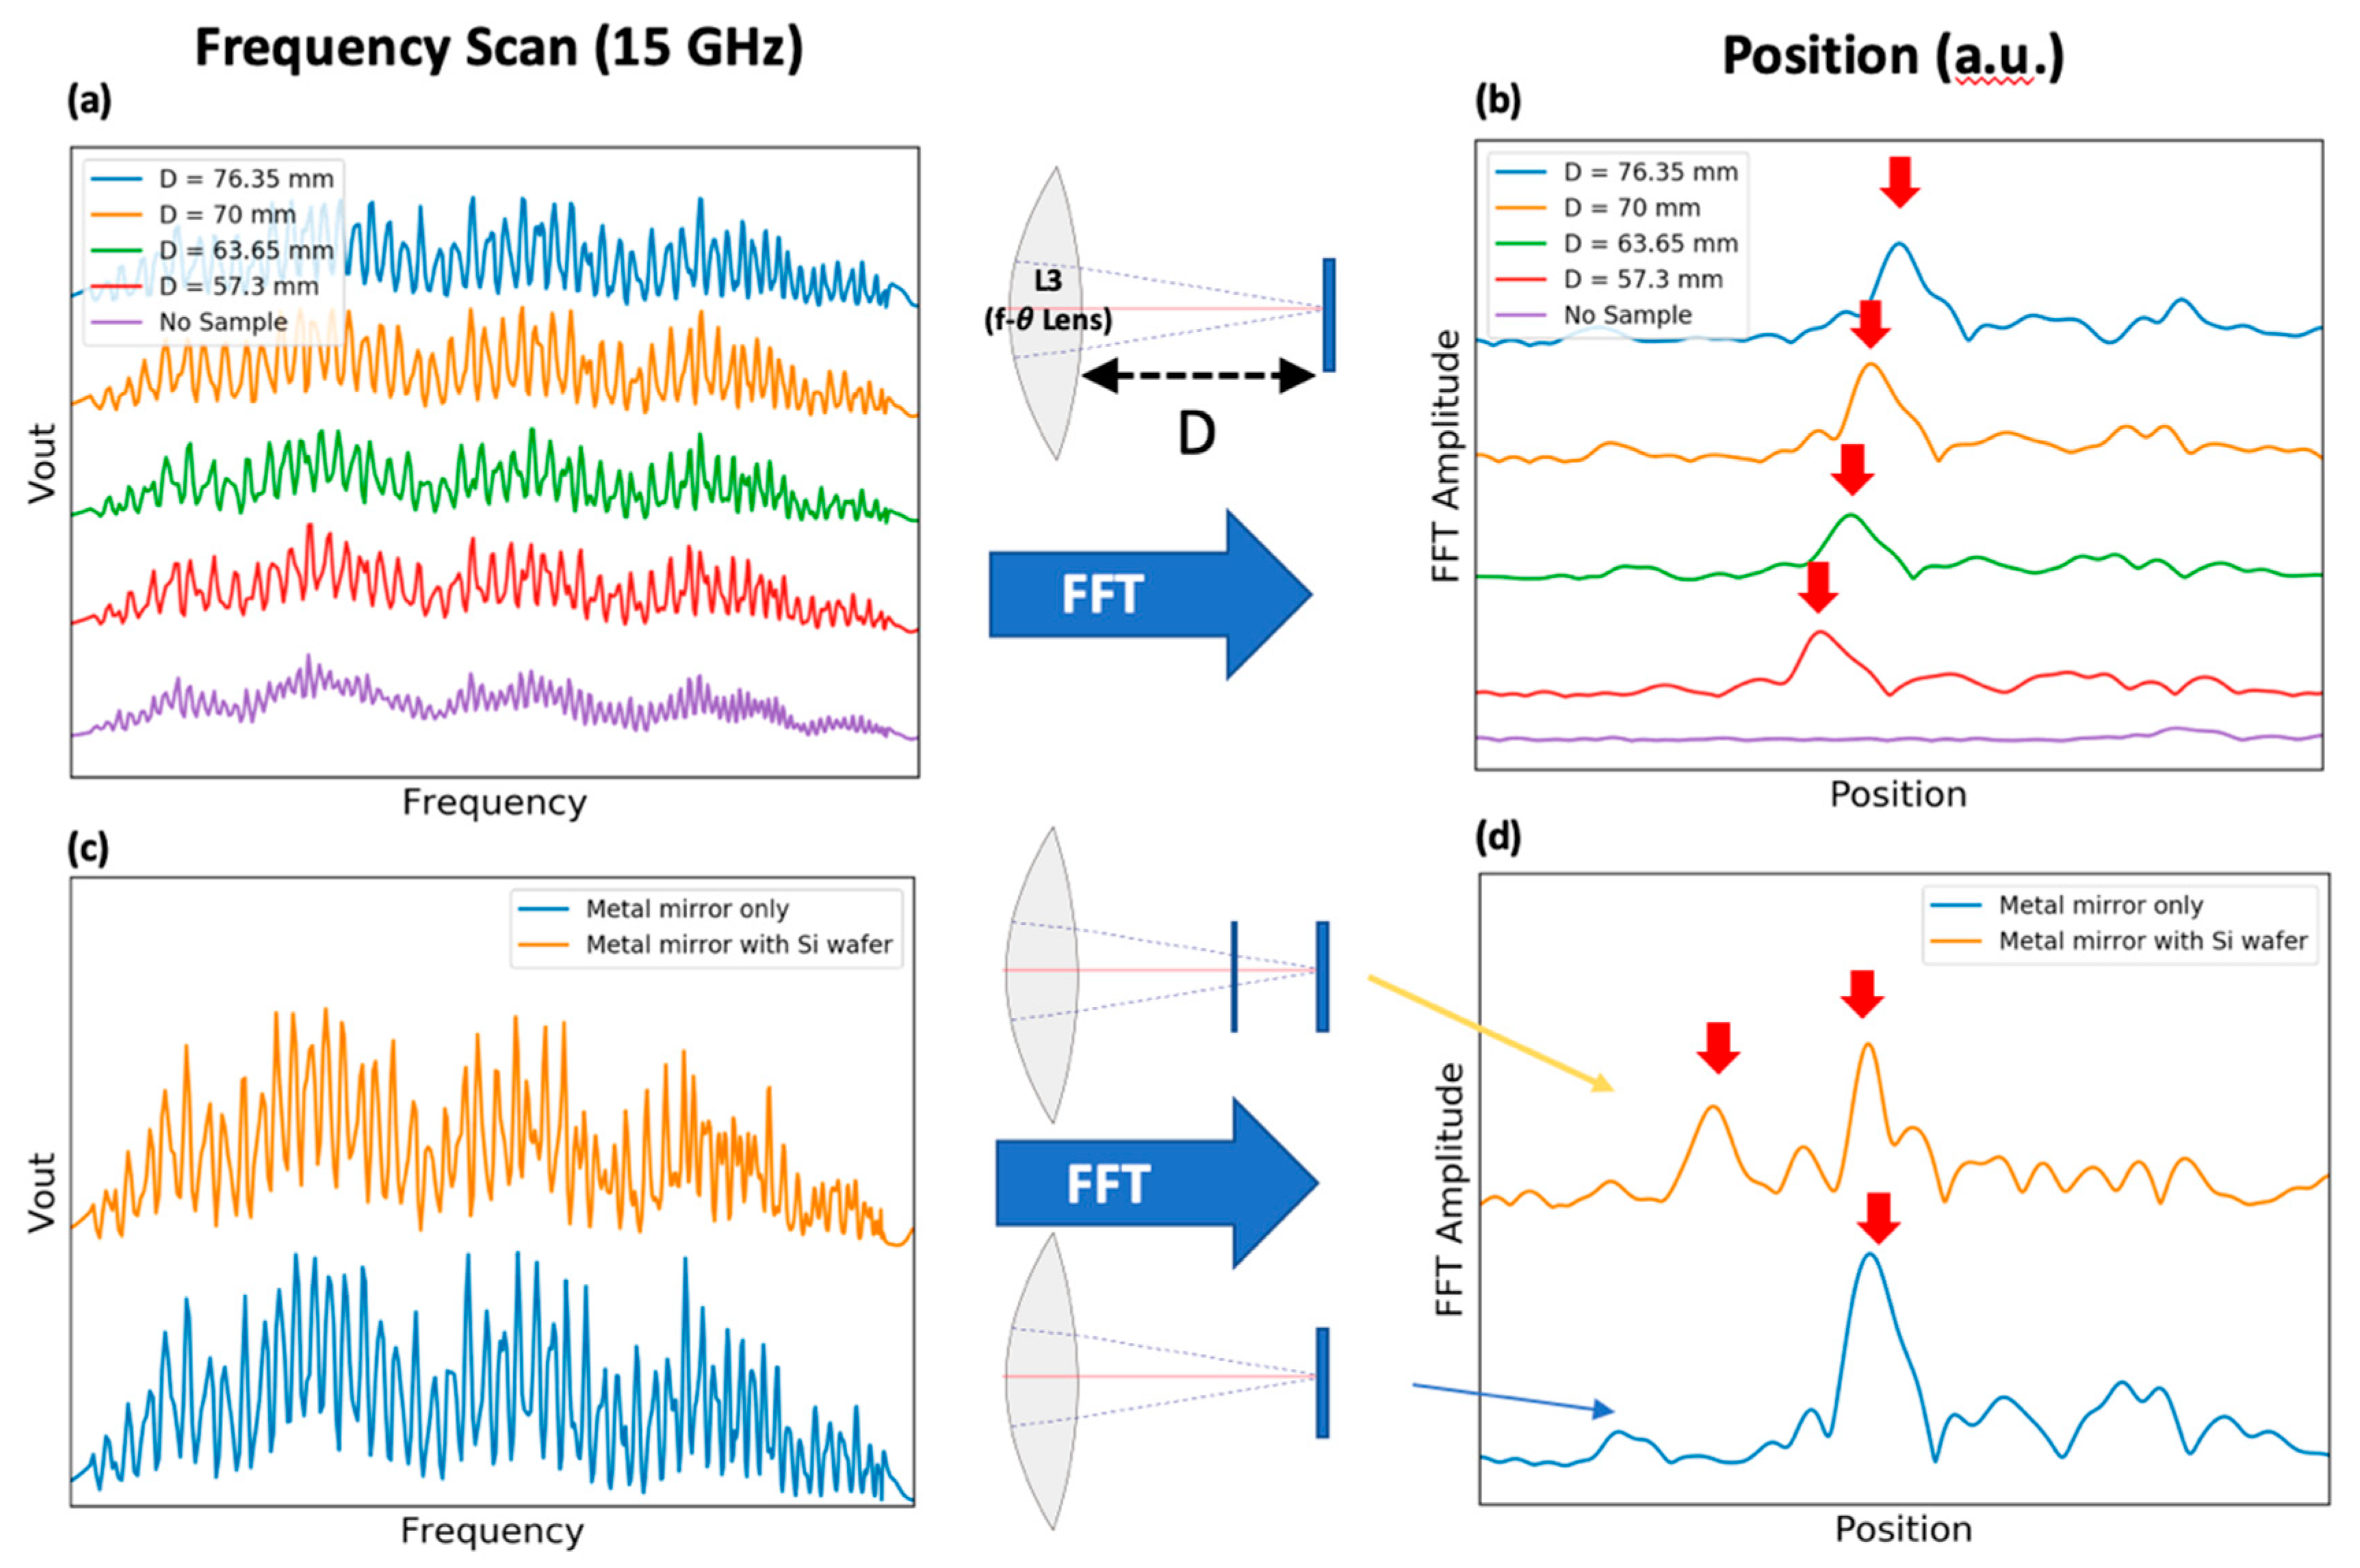
The frequency tuning speed of the DML can be up to 1 THz/30us [19], which was not fully utilized in this study due to the limited speed of the control electronics. Currently, it requires more than 5 h for a broadband image. By using a broadband optical beating source [20], the imaging speed can be significantly improved, and even in this case, the homodyne gain mechanism can still be effectively utilized. In this interferometric setup, a tomographic image can also be possible in principle by the Fourier transform of the frequency scan results at each pixel. At present, we achieved the depth resolution of 6 mm by scanning over 15 GHz at the center frequency of 0.67 THz (see Figure A6 of Appendix A). In principle, the depth resolution can be improved by increasing the bandwidth, and sub-mm resolution would be possible [9]. In our current setup, increasing the bandwidth did not improve the depth resolution. For further improvements, an accurate phase extraction technique should be adopted.
4. Conclusions
In summary, we studied THz see-through imaging for NDT applications. For the study, we constructed a reflection-type, raster-scan-based frequency-tunable THz imaging system using a telecentric f-θ lens. The effect of spatial filtering, frequency, and broadband interferometric imaging technique has been comprehensively studied. With a set of coordinate transformation equations, geometric image distortion was corrected and the sub-millimeter resolution was demonstrated at 0.67 THz. False contrast and image artifacts due to the interference were observed, which was removed by the broadband imaging. To overcome the material loss, we adopted a homodyne amplification effect that amplifies the signal intensity by more than eight times.
Author Contributions
Conceptualization, K.M. and K.H.P; methodology, K.M.; software, K.M. and I.-M.L.; validation, K.M., I.-M.L., E.S.L., and K.H.P.; formal analysis, K.M.; investigation, K.M. and E.S.L.; resources, K.H.P.; data curation, K.M.; writing—original draft preparation, K.M.; writing—review and editing, K.M.; visualization, K.M.; supervision, K.M. and K.H.P.; project administration, K.H.P.; funding acquisition, K.H.P. All authors have read and agreed to the published version of the manuscript.
Funding
This research was supported by the ICT R&D program of MSIP/IITP (2017-0-00619, Development of system for terahertz nondestructive evaluation system), Ministry of Trade, Industry, and Energy (MOTIE) and Ministry of SMEs and Startups (MSS) of the Korean Government (S2524372) and Electronics and Telecommunications Research Institute (ETRI) (20ZB1130, 20ZH1121).
Conflicts of Interest
The authors declare no conflict of interest.
Appendix A
Figure A1.
Far-field patterns at three different frequencies, calculated by the Fraunhofer diffraction equation. The beam intensities were assumed to be uniform over the aperture opening (flat-top profile). The acceptance angle of L2 is indicated by θmax.
Figure A1.
Far-field patterns at three different frequencies, calculated by the Fraunhofer diffraction equation. The beam intensities were assumed to be uniform over the aperture opening (flat-top profile). The acceptance angle of L2 is indicated by θmax.

Figure A2.
Image of a commercial laser pointer. (a) Photograph of the pointer. (b–d) THz see-through images of the pointer at (b) 0.25 THz, (c) 0.37 THz, and (d) 0.67 THz, respectively (lid closed).
Figure A2.
Image of a commercial laser pointer. (a) Photograph of the pointer. (b–d) THz see-through images of the pointer at (b) 0.25 THz, (c) 0.37 THz, and (d) 0.67 THz, respectively (lid closed).

Figure A3.
(a) Magnified view of the printed circuit board (PCB) in the commercial laser pointer. (b) THz image of the PCB board area in (a), obtained after removing the plastic lid. The metallic patterns of the PCB board are viewed as bright lines. (c) THz image of the same area after closing the lid. As noted by the arrows, some parts of the metallic patterns are shown as dark lines, indicating that the image contrast is reversed. (d) Broadband THz imaging of the same area after closing the lid. The contrast of the metallic patterns is restored. The number of pixels is reduced in the broadband image.

Figure A4.
THz–time-domain spectroscopy (TDS) measurement of the plastic lid. (a) THz pulse transmitted through the plastic lid (red) and the reference pulse (blue) obtained without any sample. (b) Fast Fourier transform (FFT) spectra of the TDS results. (c) The refractive index of the plastic lid (real part). (d) The absorption coefficient of the plastic lid.

Figure A5.
(a) THz image of a metallic grid (0.67 THz). (b) THz image of a metallic grid through a sheet of A4 paper. Even a single sheet of A4 paper generated significant interference artifacts in the image.
Figure A5.
(a) THz image of a metallic grid (0.67 THz). (b) THz image of a metallic grid through a sheet of A4 paper. Even a single sheet of A4 paper generated significant interference artifacts in the image.

Figure A6.
Results for the distance measurement. (a) Frequency scan results for metal mirrors at different distances from the center of L3. (b) FFT of the frequency scan data in (a). (c) Frequency scan results for a metal mirror and a semi-insulating silicon wafer in front of the metal mirror. (d) FFT of the frequency scan data in (c). The scan range was 15 GHz, centered at 0.67 THz.

References
- Chan, W.L.; Deibel, J.; Mittleman, M. Imaging with Terahertz radiation. Rep. Prog. Phys. 2007, 70, 1325–1379. [Google Scholar] [CrossRef]
- Tao, Y.H.; Fitzgerald, A.J.; Wallace, V.P. Non-Contact, Non-Destructive Testing in Various Industrial Sectors with Terahertz Technology. Sensors 2020, 20, 712. [Google Scholar] [CrossRef] [PubMed] [Green Version]
- Federici, J.F.; Schulkin, B.; Huang, F.; Gary, D.; Barat, R.; Oliveira, F.; Zimdars, D. THz imaging and sensing for security applications-explosives, weapons and drugs. Semicond. Sci. Technol. 2005, 20, S266–S280. [Google Scholar] [CrossRef]
- Wang, Y.; Chen, L.; Chen, T.; Xu, D.; Shi, J.; Ren, Y.; Li, C.; Zhang, C.; Liu, H.; Wu, L.; et al. Interference elimination in terahertz imaging based on inverse image processing. J. Phys. D: Appl. Phys. 2018, 51, 325101. [Google Scholar] [CrossRef]
- Preu, S.; Döhler, G.H.; Malzer, S.; Wang, L.J.; Gossard, A.C. Tunable, continuous-wave Terahertz photomixer sourses and applications. J. Appl. Phys. 2011, 109, 061301. [Google Scholar] [CrossRef]
- Kim, N.; Ryu, H.-C.; Lee, D.; Han, S.-P.; Ko, H.; Moon, K.; Park, J.-W.; Jeon, M.Y.; Park, K.H. Monolithically integrated optical beat sources toward a single-chip broadband terahertz emitter. Laser Phys. Lett. 2013, 10, 085805. [Google Scholar] [CrossRef]
- Burford, N.M.; El-Shenawee, M.O. Review of terahertz photoconductive antenna technology. Optical Eng. 2017, 56, 010901. [Google Scholar] [CrossRef]
- Moon, K.; Lee, I.-M.; Shin, J.-H.; Lee, E.S.; Kim, N.; Lee, W.-H.; Ko, H.; Han, S.-P.; Park, K.H. Bias field tailored plasmonic nano-electrode for high-power terahertz photonic devices. Sci. Rep. 2015, 5, 13817. [Google Scholar] [CrossRef] [PubMed] [Green Version]
- Yang, J.S.; Park, C.-S.; Lee, H.D.; Kim, C.-S.; Yee, D.-S. High-speed frequency-domain terahertz coherence tomography. Opt. Express 2016, 24, 1053–1061. [Google Scholar] [CrossRef] [PubMed]
- Lee, D.-S.; Jin, K.H.; Yang, J.S.; Yang, H.-S.; Kim, C.Y.; Ye, J.C. High-speed terahertz reflection three-dimensional imaging using beam steering. Opt. Express 2015, 23, 5027–5034. [Google Scholar]
- Lee, E.S.; Moon, K.; Lee, I.-M.; Kim, H.-S.; Park, D.W.; Park, J.-W.; Lee, D.H.; Han, S.-P.; Kim, N.; Park, K.H. Semiconductor-Based Terahertz Photonics for Industrial Applications. J. Ligntw. Technol. 2018, 36, 274–283. [Google Scholar] [CrossRef]
- Lee, E.S.; Kim, M.; Moon, K.; Lee, I.-M.; Park, D.W.; Shin, J.-H.; Kim, H.-S.; Choi, D.-H.; Choi, K.S.; Lee, D.H.; et al. High-Speed and Cost-Effective Reflective Terahertz Imaging System Using a Novel 2D Beam Scanner. J. Lightw. Technol. 2020, 38, 4237–4243. [Google Scholar] [CrossRef]
- Godineau, K.; Lavernhe, S.; Tournier, C. Calibration of galvanometric scan heads for additive manufacturing with machine assembly defects consideration. Addit. Manuf. 2019, 26, 250–257. [Google Scholar] [CrossRef]
- Wang, W.; Wu, Z.; Zeng, H. Image distortion and its correction in linear galvanometric mirrors-based laser-scanning microscopy. J. Biomed. Opt. 2015, 20, 56001. [Google Scholar] [CrossRef] [PubMed] [Green Version]
- Hafez, M.; Sidler, T.; Salathé, R.P. Study of the beam path distortion profiles generated by a two-axis tilt single-mirror laser scanner. Opt. Eng. 2003, 42, 1048–1057. [Google Scholar]
- Ung, B.S.-Y.; Fumeaux, C.; Lin, H.; Fischer, B.M.; Ng, B.W.-H.; Abbott, D. Low-cost ultra-thin broadband terahertz beam-splitter. Opt. Express 2012, 20, 4968–4978. [Google Scholar] [CrossRef] [PubMed]
- Moon, K.; Kim, N.; Shin, J.-W.; Yoon, Y.-J.; Han, S.-P.; Park, K.H. Continuous-wave terahertz system based on a dual-mode laser for real-time non-contact measurements of thickness and conductivity. Opt. Express 2014, 22, 2259–2266. [Google Scholar] [CrossRef] [PubMed]
- Piesiewicz, R.; Jansen, C.; Wietzke, S.; Mittleman, D.; Koch, M.; Kürner, T. Properties of Building and Plastic Materials in the THz Range. Int. J. Infrared Milli. Waves 2007, 28, 363–371. [Google Scholar] [CrossRef]
- Ryu, H.-C.; Kim, N.; Han, S.-P.; Ko, H.; Park, J.-W.; Moon, K.; Park, K.-H. Simple and cost-effective thickness measurement terahertz system based on a compact 1.55 μm λ;/4 phase-shifted dual-mode laser. Opt. Express 2012, 20, 25990–25999. [Google Scholar] [CrossRef] [PubMed]
- Nagatsuma, T.; Kumashiro, T.; Fujimoto, Y.; Taniguchi, K.; Ajito, K.; Kukutsu, N.; Furuta, T.; Wakatsuki, A.; Kado, Y. Millimeter-wave imaging using photonics-based noise source. In Proceedings of the 34th International Conference of Infrared, Millimeter, and Terahertz Waves, Busan, Korea, 21–25 September 2009; pp. 1–2. [Google Scholar]
Figure 1.
Schematic of the terahertz (THz) imaging system used in this study.

Figure 2.
Estimation of the imaging area and distortion. (a) Metal grid sample. The grid period is 20 mm. (b) Mode 1 imaging result. (c) Mode 2 imaging result, showing significant distortion. (d) Coordinate and normal vector definitions to derive image correction equations. (e) Corrected grid image. (f) The rectangular grid on the α–β plane (grid period: 10°), projected on the object plane of L3.

Figure 3.
Effect of iris opening diameter on the image (at 0.67 THz). (a) QR code engraved on a painted metal plate. (b) THz image with fully opened iris. (c) THz image with 1.5 mm iris opening diameter. (d) THz image with 0.7 mm iris opening diameter.
Figure 3.
Effect of iris opening diameter on the image (at 0.67 THz). (a) QR code engraved on a painted metal plate. (b) THz image with fully opened iris. (c) THz image with 1.5 mm iris opening diameter. (d) THz image with 0.7 mm iris opening diameter.

Figure 4.
Images of a USAF 1951 resolution target at (a) 0.25 THz, (b) 0.37 THz, and (c) 0.67 THz. (d) USAF 1951 target pattern mounted on a metal plated with several tapped holes. (e) Calculation results for the focusing of 5 cm beam diameter, collimated beam at three measured frequencies. In this simulation, L3 is replaced by an ideal thin lens of a 7 cm focal length. The images were obtained in mode 1.

Figure 5.
THz see-through images of a laser pointer. (a) The photograph of the pointer (inside and outside). (b) The THz image at 0.67 THz after opening the lid of the upper part. (c) The THz image was obtained after closing the lid. (d) Broadband interferometric image. The images were obtained in mode 2.

Publisher’s Note: MDPI stays neutral with regard to jurisdictional claims in published maps and institutional affiliations. |
© 2020 by the authors. Licensee MDPI, Basel, Switzerland. This article is an open access article distributed under the terms and conditions of the Creative Commons Attribution (CC BY) license (http://creativecommons.org/licenses/by/4.0/).
Share and Cite
MDPI and ACS Style
Moon, K.; Lee, I.-M.; Lee, E.S.; Park, K.H. THz Reflective Imaging System Utilizing Broadband Homodyne Amplification for Artifact-Free See-Through Imaging. Appl. Sci. 2020, 10, 7228. https://doi.org/10.3390/app10207228
AMA Style
Moon K, Lee I-M, Lee ES, Park KH. THz Reflective Imaging System Utilizing Broadband Homodyne Amplification for Artifact-Free See-Through Imaging. Applied Sciences. 2020; 10(20):7228. https://doi.org/10.3390/app10207228
Chicago/Turabian StyleMoon, Kiwon, Il-Min Lee, Eui Su Lee, and Kyung Hyun Park. 2020. "THz Reflective Imaging System Utilizing Broadband Homodyne Amplification for Artifact-Free See-Through Imaging" Applied Sciences 10, no. 20: 7228. https://doi.org/10.3390/app10207228
Note that from the first issue of 2016, this journal uses article numbers instead of page numbers. See further details here.