Article

Assessment of Hybrid Wind-Wave Energy Resource for the NW Coast of Iberian Peninsula in a Climate Change Context

1
CESAM, Physics Department, University of Aveiro, 3810-193 Aveiro, Portugal
2
CRETUS Institute, Group of Nonlinear Physics, Faculty of Physics, University of Santiago de Compostela, 15782 Santiago de Compostela, Spain
3
Environmental Physics Laboratory (EphysLab), CIM-UVIGO, University of Vigo, Campus da Auga building, 32004 Ourense, Spain
*
Author to whom correspondence should be addressed.
Appl. Sci. 2020, 10(21), 7395; https://doi.org/10.3390/app10217395
Submission received: 29 September 2020 / Revised: 17 October 2020 / Accepted: 19 October 2020 / Published: 22 October 2020
(This article belongs to the Collection Wind Energy: Current Challenges and Future Perspectives)

Abstract

:
Offshore renewable energy has a high potential for ensuring the successful implementation of the European decarbonization agenda planned for the near future. Hybrid wind-wave farms can reduce installation and maintenance costs, and increase the renewable energy availability of a location by compensating for the wind’s intermittent nature with good wave conditions. In addition, wave farms can provide protection to wind farms, and the combined wind/wave farm can provide coastal protection. This work aims to assess the future hybrid wind-wave energy resource for the northwest coast of Iberian Peninsula for the near future (2026–2045), under the RCP 8.5 greenhouse gas emission scenario. This assessment was accomplished by applying a Delphi classification method to define four categories, aiming to evaluate the richness (wind and wave energy availability, downtime), the variability (temporal variation), the environmental risk (extreme events), and cost parameters (water depth and distance to coast) of the wind and wave resources. The combined index (CI), which classifies the hybrid wind-wave resource, shows that most of the NW Iberian Peninsula presents good conditions (CI > 0.6) for exploiting energy from wind and wave resources simultaneously. Additionally, there are some particularly optimal areas (CI > 0.7), such as the region near Cape Roca, and the Galician coast.

1. Introduction

The development of marine energies has become essential for the green energy sector, in order to mitigate the human influence on climate change, and move towards 100% clean energy, as stated in the 2030 Agenda for Sustainable Development released by the UN in 2015 [1]. Pursuing this goal, both the European Parliament and the European Council have endorsed 60% emission reductions by 2030 [2], and long-term climate neutrality for the EU by 2050.
Europe’s decarbonization plan to achieve the net-zero greenhouse gas emission target relies heavily on an offshore renewable energy strategy [3]. The strategic roadmap is to deliver up to 100 GW of capacity by 2050, which represents approximately 10% of Europe’s electricity consumption [3,4]. The European Commission, through its member states, has made great efforts to achieve this goal by promoting projects that address ocean energy efficiency [3,4,5,6,7], and the competitiveness of offshore wind [8,9,10] and ocean energies [11,12]. In fact, the European Union is currently the world leader in offshore wind [13] and intends to advance in the implementation of the actions of its Strategic Energy Technology (SET) plan [14].
The current development of wind technologies has reduced the cost, maintenance, and equipment of wind turbines, and, at the same time, has increased wind turbine efficiency and availability [8,10,15]. This makes wind power cheaper than photovoltaic power, while costing about half of atomic power [16]. Therefore, an explosion in the offshore wind industry is expected, which may positively influence the development of other technologies with high synergy [15,17], such as wave energy conversion. In fact, one of the strategies of the EU SET plan is to increase competitiveness by exploiting wave energy at the same time as wind power.
Hybrid wind-wave farms can reduce installation and maintenance costs [17,18] and increase the availability of a location by compensating for the winds intermittent nature with good wave conditions. Furthermore, the wave farm can provide protection to the wind farm, and the combined wind-wave farm can provide coastal protection [19,20,21]. Several authors have assessed the combined exploitation of wind and wave resources [22] in Europe [17,23,24,25], and worldwide [26,27]. These studies determined the most suitable locations for wind exploitation, and the specific wave energy conversion (WEC) devices for those locations. Current wind and wave energy technology is intended to have a useful life of at least 20 years [28,29], therefore, when using this combined energy resource, it is important to take into account not only current climatic conditions but also the effect of climate change on wind and wave energy resources in the near future [30].
Climate change is expected to affect future wind and wave yields [31,32,33]. The global climate models (GCMs) from Phase 5 of the Coupled Model Intercomparison Project (CMIP5) have been tested and verified as reliable sources for future wind and wave variables [34,35]. The EURO-CORDEX initiative, the European branch of the Coordinated Regional Climate Downscaling Experiment (CORDEX) project [36], used a wide range of regional climate models (RCMs) driven by several CMIP5 GCMs, under different greenhouse gas emission scenarios, to project wind and the significant height and period of waves, with a high spatial and temporal resolution. However, to assess the feasibility of operating a hybrid wind-wave farm in a specific location, it is necessary to take into account not only wave and wind resources for the near future but also environmental conditions and cost factors [37,38].
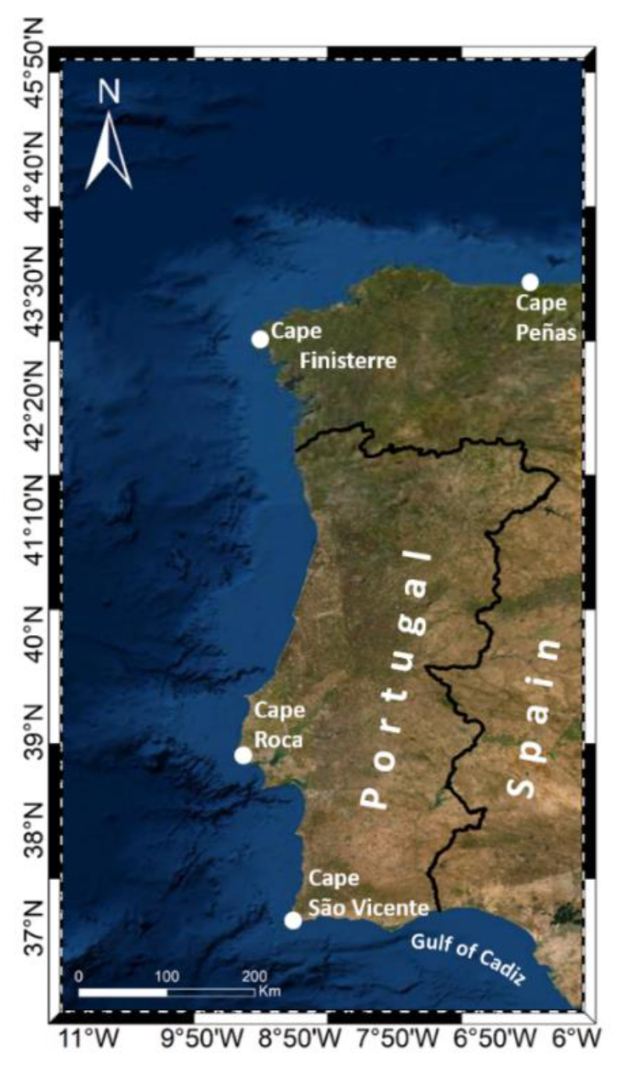
The NW Atlantic coast of the Iberian Peninsula, from 36.5° to 45.5° N and from 6° to 11° W (Figure 1), covers the coast of Portugal and Galicia (Spain). The wind-wave climate is characterized by a high seasonal, and energetic, behavior [39,40], the North Atlantic Oscillation (NAO) being the greatest source of inter-annual variability in the wave climate in this region [41]. However, the wave field is still dominated by the swell component (over 78%) during most of the year [42], because of being located in a mid-latitude of a western region [43]. These features makes this region one of the maximum oceanic energy resources in Europe [44], and one of the highest marine energy potentials in the world [45]. In particular, the west coast of the Iberian Peninsula is one of the most energetic coasts, in which different projects for the exploitation of wind and wave resources have been built or approved [46,47]. In fact, the first project to install a commercial-scale wave energy extraction in the world was in the Pilot Zone off the coast of Portugal [47].
The aim of this study was to assess the present and near future wind and wave energy resources along the Atlantic coast of the Iberian Peninsula. A Delphi classification method [48] that takes into account wind and wave resources, stability, risk, and installation and maintenance costs was applied for the analysis. The originality of the present study relies not only on the evaluation of the combined resources using a Delphi, as done in previous studies, but also in the consideration of other factors besides the wind/wave power resources, to assess the feasibility of a hybrid wind-wave energy farm at a particular location for future exploitation conditions. This methodology contributes to the knowledge and applicability for global-to-local scale studies, and predicts future wind-wave energy resource for researchers and ocean energy entrepreneurs.
The paper is organized as follows: in Section 2, the data is presented, followed by the methodology applied to assess energy resources. Results and discussion can be found in Section 3. Finally, conclusions are presented in the Section 4.

2. Data and Methods

2.1. Wind Data

Daily wind speed at 10 m height was retrieved from regional climate simulations within the CORDEX project [36] (Table 1) under the RCP8.5 greenhouse emission scenario. RCMs at a spatial resolution of 0.11° were considered from 2026 to 2045.
A multi-model ensemble approach was applied by using a consensus criterion [49,50] in order to reduce biases of each of the models that make up the multi-model. This consensus criterion determines the concordance of the multi-model ensemble wind speed difference (future minus past) with the different models, by imposing two conditions to evaluate the statistical significance of the pixels. The first condition states that at least 75% of all models present the same sign of the multi-model mean in every pixel. The second condition imposes that at least 80% of the models that met the first condition pass the Mann–Whitney–Wilcoxon test [51] (a 5% significant level was considered at each pixel). For further information on the consensus criterion, the reader is referred to [49,50]. The accuracy of this ensemble of RCMs was previously analyzed in the area under scope [52,53].

2.2. Wave Data

Wave data parameters (Hs and Tp) for the future period, 2026–2045, were obtained through the simulating waves nearshore (SWAN) model [54]. The model was previously implemented and validated for the northwest Iberian Peninsula coast [30]. The simulations consider the recommendations of the International Electrotechnical Commission (IEC) for a reconnaissance-stage model [55], which are required for an energy resource assessment.
The SWAN simulations are the dynamical downscaling (0.11° × 0.11°) of the MIROC5 GCM. The Commonwealth Scientific and Industrial Research Organisation (CSIRO) database for wave hindcast [56] and wind-wave climate projections [57] offers eight different GCMs simulations. These simulations were statistically analyzed through the overlap percentage between the probability distribution functions (PDFs) [58] of the waves hindcast and the GCMs projections. The MIROC5 was found to be the most accurate model [30]. The time required to perform each of the SWAN simulations limits the use of only one GCM out of the eight possible. Winds provided by MIROC5 CCLM4-8-17 RCM [36] were also used in the SWAN simulations.

2.3. Methods

The synergy between the wind and the waves can optimize the harvest of marine resources in the same area using hybrid farms. Thus, when assessing the energy resource, focusing on the harvest through hybrid systems, various factors must be taken into consideration, both specific to each resource and common to both. The assessment applied in this study is based on different indices representing the resource richness, variability, risk, and cost of wind energy resource, previously used by Costoya et al. [49,50], and applied in a similar way for the wave energy resource.

2.3.1. Wind Power Resource

The wind power density (WPD in watts m−2) was determined by:
WPD = 1 2 ρ a W H 3 ,
where ρ a is the air density (1.225 kgm−3 at 15 °C and 1000 hPa) and W H is the wind speed at the selected hub height (120 m). WPD is the power available to be converted by a wind turbine at a specific location. An important detail, when investigating wind energy changes due to global warming, is related to changes in the air density due to temperature increases. However, these are found not be relevant since a 5 k temperature increase represents only a 1% decrease of the WPD (for the same wind speed). Since WPD is independent of the turbine power curve, it is a suitable wind energy metric for this study.

2.3.2. Wave Power Resource

Wave energy resource was evaluated by means of the wave power (WP in kWm−1) following the expression:
WP = p g 2 64 π H s 2 T e ,
where Hs is the significant wave height, ρ is seawater density (1025 kgm−3), g is the gravitational acceleration, and Te is the energy period estimated on the peak period (Tp) [30,59]. Harvesting energy from waves is not straightforward, as each wave energy converter has a characteristic power matrix that varies with its design. In this sense, wave power can be applied to any wave energy converter since it is independent of the power matrix.

2.3.3. Assessment of Future Wind Energy Resource

Eight indices were considered to assess the future wind energy resource in the northwest Iberian Peninsula coast, following the methodology applied by [38,49,50] to assess the richness of the wind resource, the variability, the environmental risk, and cost parameters. These indices are: Annual average wind speed (Wann), rich level occurrence (RLO), downtime (DWNT), coefficient of variation index (Cv), monthly variability index (Mv), risk of extreme wind speeds (Risk), water depth (WD), and distance to coast (DC).
The richness of the wind resource parameter accounts for the potential wind energy resource available, which is independent of the converter device. The Wann index is divided into seven partitions following the NREL classification scheme [60]. The rich level occurrence measured by means of the RLO index is defined as the frequency of WPD higher than 200 Wm−2.
The effectiveness in the exploitation of the wind energy resource is also a key factor because wind turbines only operate in a particular range that allows the production of energy. The upper (cut-off speed) and lower (cut-in speed) thresholds of this range are usually around 4 and 25 ms−1, respectively [49,50]. In this sense, the DWNT index provides a measure of the total time with useful wind speed occurrence (EWSO) in which a wind turbine is producing electricity.
The temporal variability of the wind energy resource is another important factor, since a stable energy supply throughout the year would optimize the energy harvest efficiency. In this context, the coefficient of variation ( C v ) index is defined as:
C v = S x ¯   ,
where S and x ¯ are the standard deviation and the WPD mean, respectively. Additionally, the monthly variability (Mv) index was also considered. This index is defined as:
M v = P M 1 P M 12 P y e a r ,
where P y e a r is the annual mean of the WPD, and P M 1 and P M 12 represent the WPD for the most and least energetic months, respectively.
The risk index was also considered, to take into account extreme wind speeds (EWS) that can highly affect the safety of ocean engineering. This index was calculated by means of the EWS over a 50-year period calculated based on the Gumbel curve method.
Finally, water depth and distance to coast indices were also considered for every grid pixel. These indices represent the cost factors related to grid connection and marine engineering. For this purpose, the ETOPO bathymetry and the Global Self-consistent, Hierarchical, High-resolution Geography (GSHHG) coastline databases were used to calculate WD and DC indices, respectively.
The assessment of the future wind resource based on the indices described above was carried out following a Delphi classification method similar to the one described in [37,49,61]. First, each index was normalized to encompass all of them in a single parameter (the Cwind index) since, as mentioned above, each index has its magnitude and units. The normalization process followed is similar to the one applied by [49,50], in such a way that both positive and negative indices were turned into positive factors with the optimal value equal to 1 and the worst equal to 0. The partitions of the [0, 1] interval were calculated considering a 1/(n − 1) step, where n is the number of categories (10 or 5, depending on the index). Most of the indices were normalized using 10 partitions (Table 2) ,with the exception of the Wann index normalized using 7 (as mentioned before), and WD and DC which were normalized using 5 partitions (Table 3).
The weight coefficients for wind energy indices based on the Delphi classification method are described in Table 4.
Thus, the wind energy classification index (Cwind) was calculated for each grid point as:
C w i n d = i = 1 8 W i × I i ,
where Ii and Wi are the indices and weights described in Table 4.

2.3.4. Assessment of Future Wave Energy Resource

The assessment of the future wave energy resource was similar to the one used for the future wind resource, since both wind and wave resources share the same characteristics and constraints. Previous studies assessed the wave energy resource [38,62,63], taking into account several parameters which evaluated the energy production (linked to a specific WEC), extreme events, availability of the optimal wave height, accessibility, and monthly variability of the resource. Future wave energy resource was classified following a method similar to previous studies [38,49], based on a Delphi technique. In particular, experts were selected from the steering committee of, and participants in, the COST Action WECANet: A pan-European Network for Marine Renewable Energy (https://www.wecanet.eu/). As a first step, experts were questioned about the factors that they considered to be influential for wave energy converters. Experts were consulted only about general factors that did not depend on the particular features of a particular type of device. These factors, which include drivers that depend on the resource (mainly the amount of wave energy and its variability), on the environmental risk, and on cost constraints, were proposed and agreed by the experts. In a second step, a normalization method was adopted to compare different factors. Finally, as the last step, experts were consulted again to determine the weight of each factor following the protocol described latter.
Similarly as previously done for wind, the Cwave index was calculated considering seven indices that evaluated the wave resource richness, variability, environmental risk, and cost parameters: wave energy resource (WP), downtime (DWNT), coefficient of variation index (Cv), monthly variability index (Mv), risk of extreme wave heights (Risk), water depth (WD), and distance to coast (DC).
The richness of the wave resource parameter (WP) includes the potential wave energy resource available in the area under study, and is independent of the wave energy converter. Like for wind energy converters, wave converters also operate on a particular range of Tp and Hs. In this context, and following [64], the DWNT index was defined with upper and lower thresholds set to Hs = 8 m and Hs = 1 m, which represent the level of “power outages” due to extreme wave conditions, and the time of calms, respectively.
The temporal variability of the wave energy was also considered for the wave energy exploitation by means of the Cv and Mv indices that were calculated as for the wind resource, but changing the WPD for WP.
Similar to EWS, a risk factor that takes into account extreme wave heights (EWH) was also considered. This index was calculated by means of the maximum Hs over a 50-year period, calculated based on the Gumbel curve method.
The calculation of the cost factors (WD and DC) was performed for every grid pixel, using the same method applied for the wind resource, and the same normalization process described in Table 3.
The other indices were also subjected to the same normalization process applied in the wind energy classification. The normalization criterion is described in Table 5.
The weight coefficients for wave energy indices based on the Delphi classification method are described in Table 6. In particular, experts were selected from the steering committee and participants in the COST Action WECANet: A pan-European Network for Marine Renewable Energy (https://www.cost.eu/actions/CA17105/). As a first step, experts were questioned about the factors that they considered to be influential for wave energy converters. Experts were consulted only about general factors that did not depend on the particular features of a particular type of device. These factors, which include drivers that depend on the resource (mainly the amount of wave energy and its variability), on the environmental risk, and on cost constraints, were proposed and agreed by the experts. In a second step, a normalization method was adopted to compare different factors. Finally, in the last step, experts were consulted again to determine the weight of each factor following the protocol previously described.
In this case, the indices that account for the wave resource richness are only two, compared to the three for the wind resource. This is because the wave energy harvest is usually done in terms of the average WP [65,66], in contrast to the wind resource that is usually done in terms of the Wann and EWSO.
Similar to the wind energy classification index, the wave energy classification index (Cwave) was calculated for each grid point as:
C w a v e = i = 1 7 W i × I i
where Ii and Wi are the indices and weights described in Table 6.
Finally, the classification of the hybrid wind-wave energy resource was determined by a combined index (CI) of wind and wave energy resources defined as:
CI = C w i n d + C w a v e 2

2.3.5. Sensitivity Test of the Energy Resource Parameters

The classification indices used in Equations (5) and (6) were calculated for each grid pixel (k) by means of an expression that can be generalized as:
C k = i = 1 N W i k × I i k
where N is the number of indices, I i k is the normalized value of each index (i) calculated for every pixel (k), and W i k is the mean weight of each index obtained from Table 2, Table 3, Table 4, Table 5 and Table 6. Note that each weight in Table 4 and Table 6 is described as a mean and a standard deviation. Although the mean weight value of the weight coefficients ( W i k ) will be considered throughout most of the study (Equations (5) and (6)), a sensitivity test was carried out following a Monte Carlo approach to analyze the dependence of the classification indices ( C k ) on the variability of the weight coefficients. The procedure applied to each pixel can be summarized as follows:
  • Random variation. Each weight was allowed to vary randomly
    W i k = W i k + R k   σ W i k
    where Rk is a random number with equal probability between ±1, and σ is the standard deviation provided by Table 4 and Table 6 for wind and waves, respectively. A different random number was used for each pixel (k).
  • Renormalization. Before the random variation, weights were normalized in such a way that
    i = 1 N W i k = 1
However, that normalization cannot be guaranteed after random variation. Consequently, weights must be renormalized by
W n i k = W i k i = 1 N W i k
  • The classification indices were recalculated using the new weights
    C j k = i = 1 N W n i k × I i k
    where the subscript (j) refers to the different realizations of the Monte Carlo approach. In particular, j = 100,000 realizations will be considered in the present analysis.
  • The RMSEk associated to each pixel was calculated between the reference index ( C k ) and the different realizations, C j k .
    RMSE k = j = 1 J C k C j k 2 J
  • In a similar way, the RMSEj associated to each realization was calculated as
    RMSE j = k = 1 N p C k C j k 2 N p
    where Np is the number of pixels.
  • The mean value of the classification index was calculated as the average of all realizations by using the following expression
    C j k = 1 J j = 1 J C j k

3. Results and Discussion

The assessment of the potential energy resource for a hybrid wind-wave farm was carried out along the northwest coast of the Iberian Peninsula for the near future (2026–2045). First, spatial maps of all the wind and wave indices that make up the categories of resource richness, variability, risk, and cost were calculated.
The method used in this study is similar to the one developed by [62], where the authors proposed a multi-criteria approach for wave energy converters. They used similar coefficients (resource, variability, downtime, risk, and cost) although their study was more focused on particular devices for three specific locations. In the case of this research, which is based on previous studies carried out for wind energy converters [37,49,50,61], the analysis is focused on a large area covering the Atlantic part of the Iberian Peninsula under near future conditions. Previous works also focused on particular locations [25,65], although as far as we know, none on them considered future wind and wave conditions.
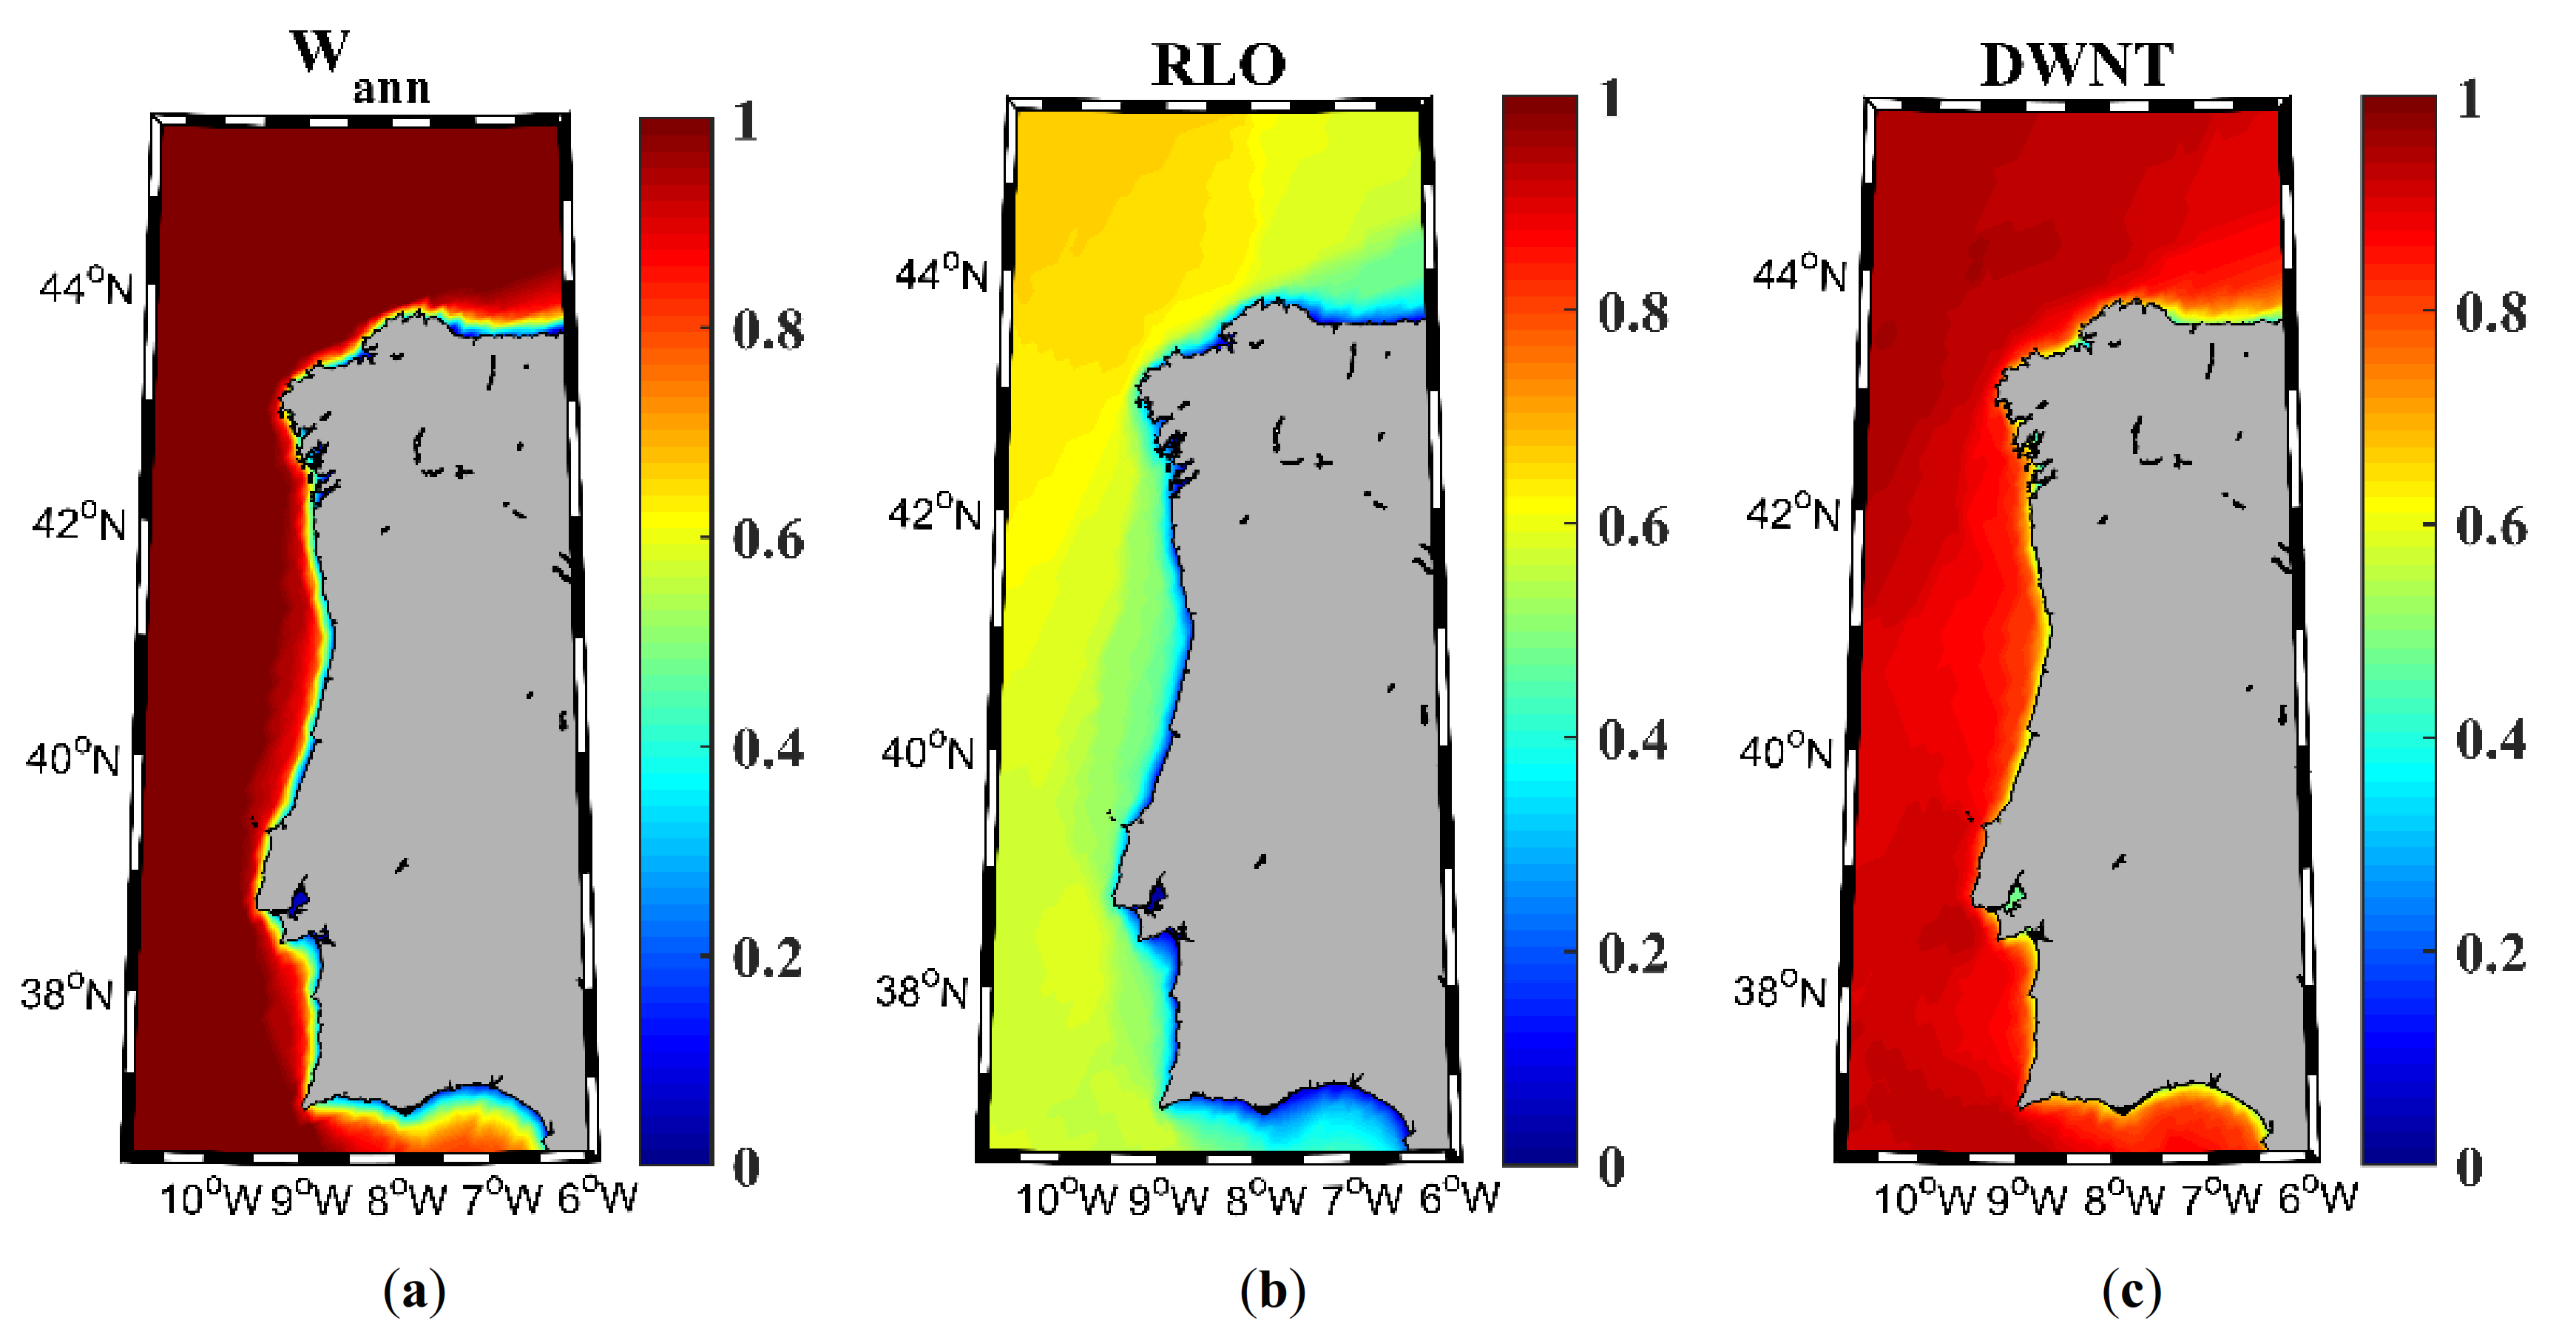
The richness category accounts for the available resource in terms of Wann, RLO, and DWNT for the wind resource (
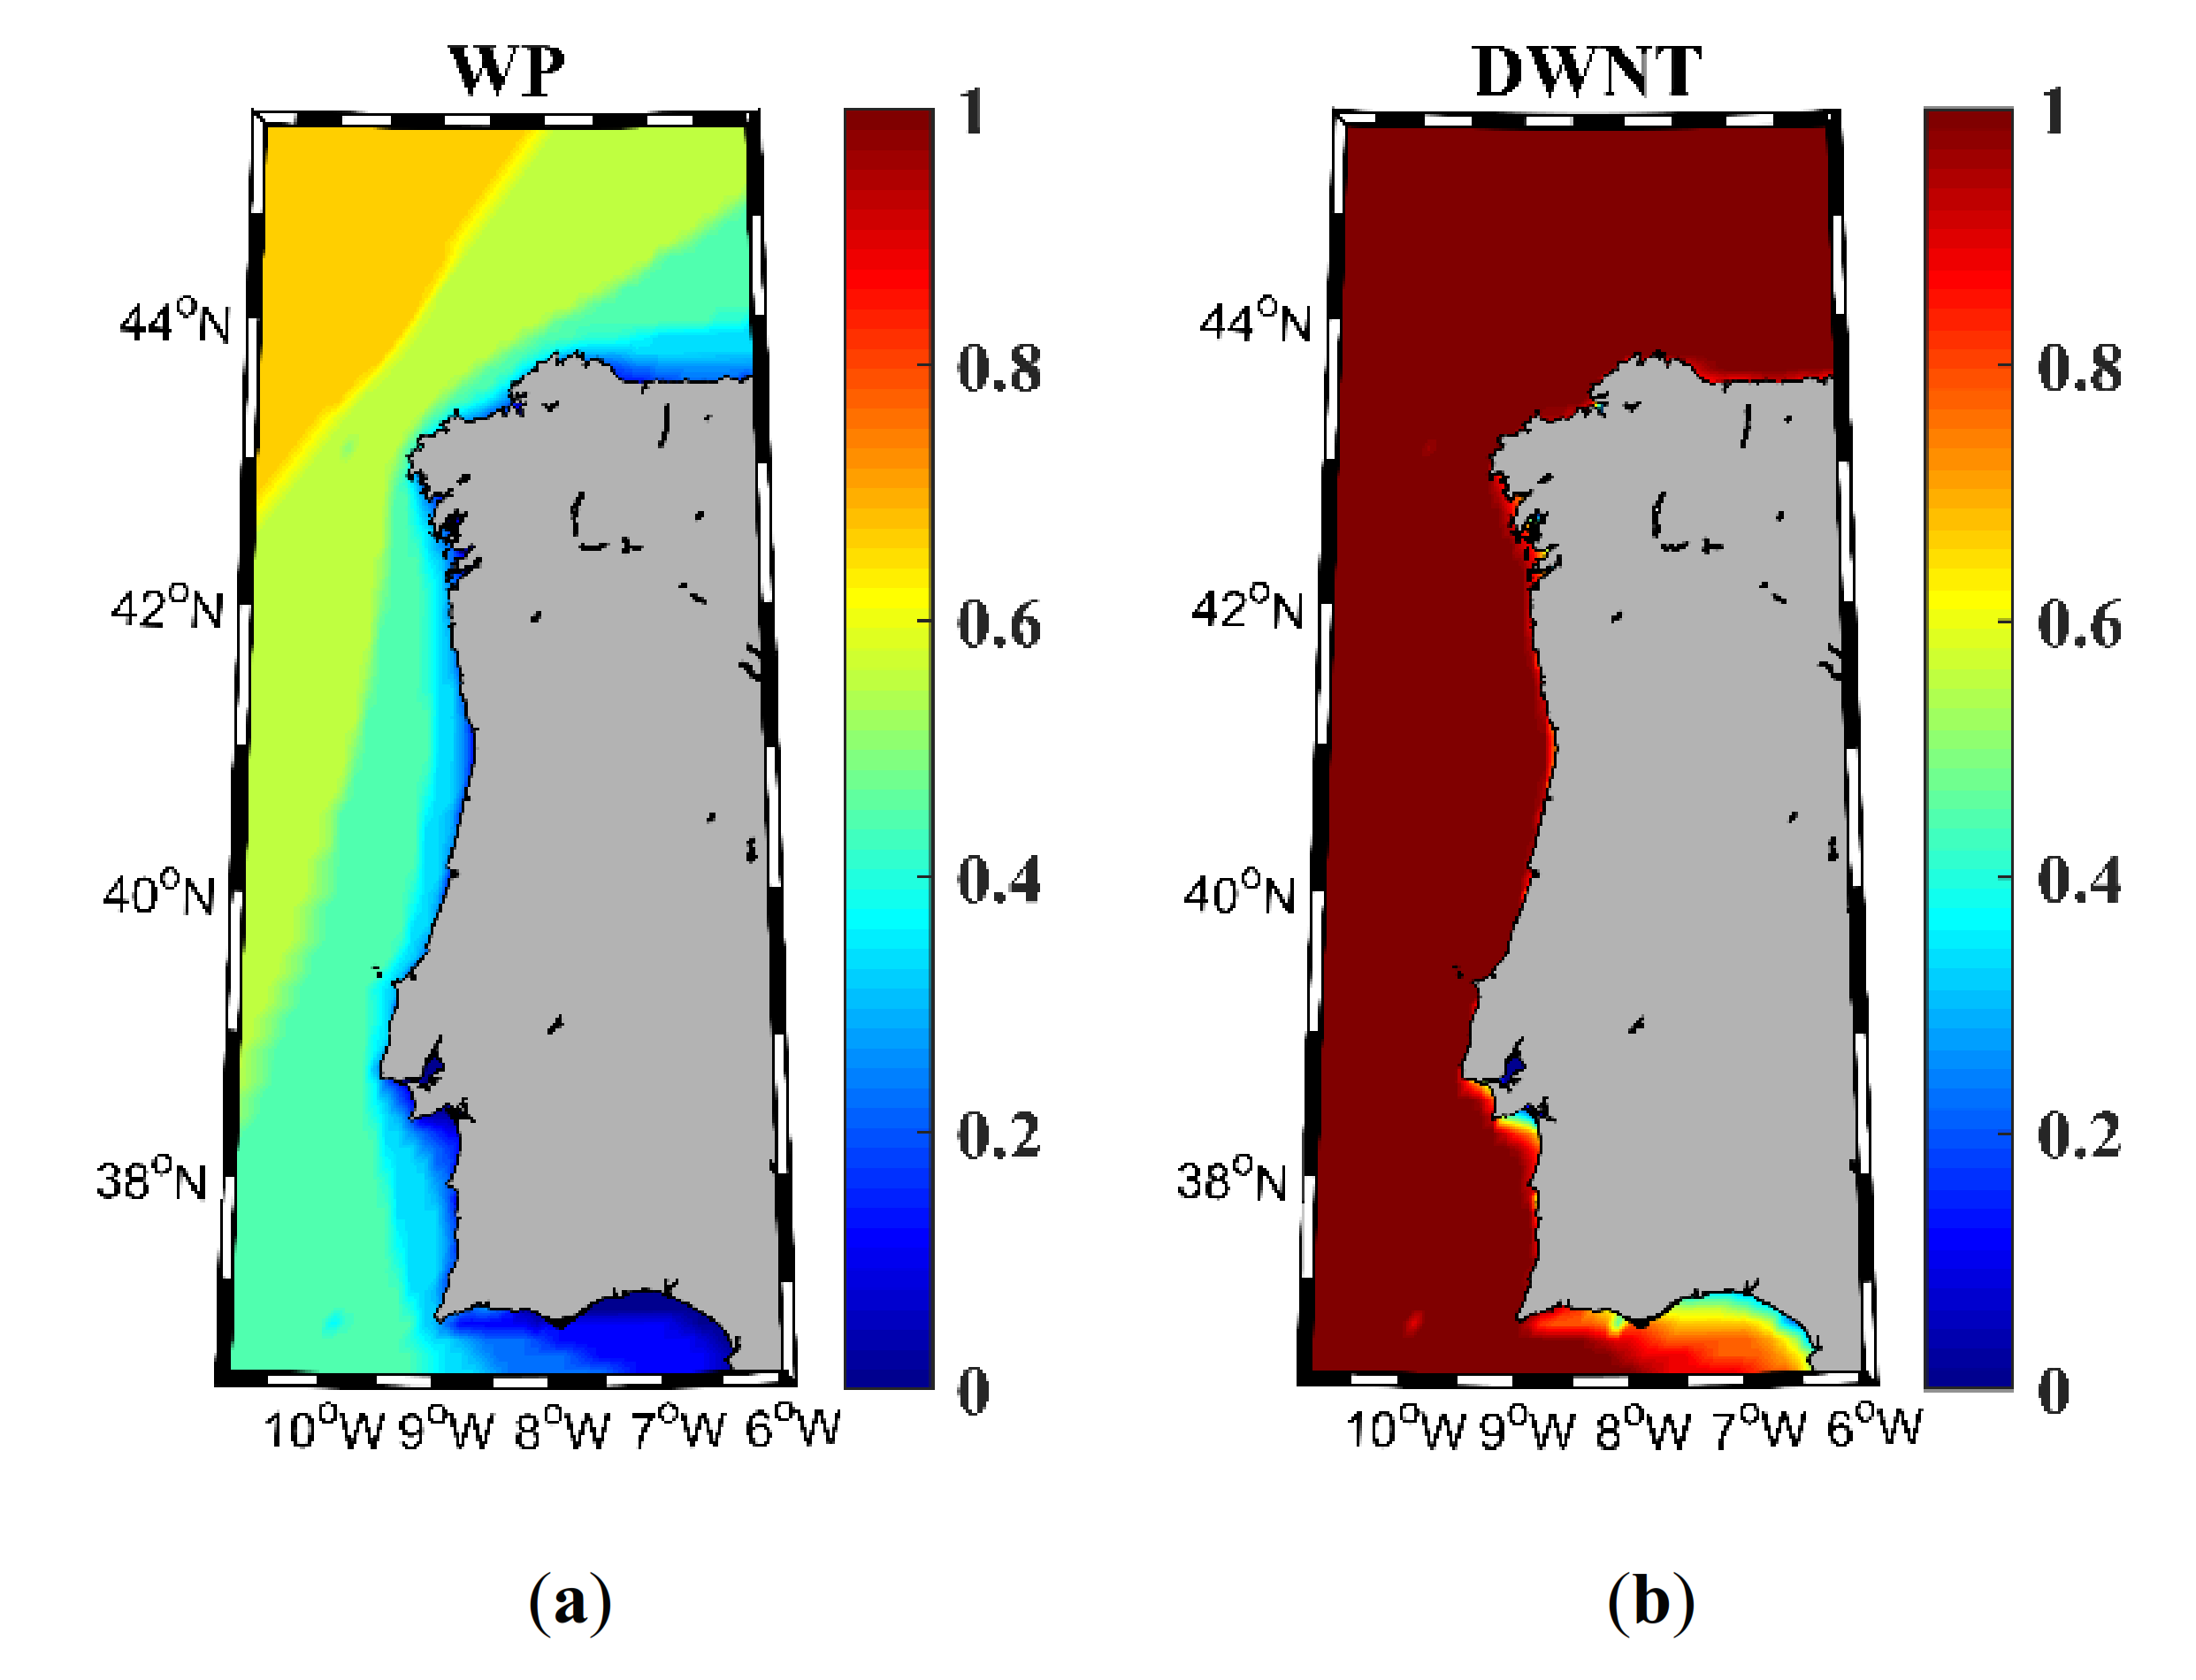
Figure 2), and WP and DWNT for the wave resource (Figure 3). Wann index (Figure 2a) shows the maximum value of 1 in the ocean, and decreases to less than half near land. This is consistent with the WPD values shown for this region in [67]. The RLO index pattern is similar to the one of Wann, with the lowest values (around 0.1) being detected along the coast, and the maximum values, of around 0.7, in the northwest region. The DWNT index shows a smaller difference (0.2) between the ocean and the coastal regions.
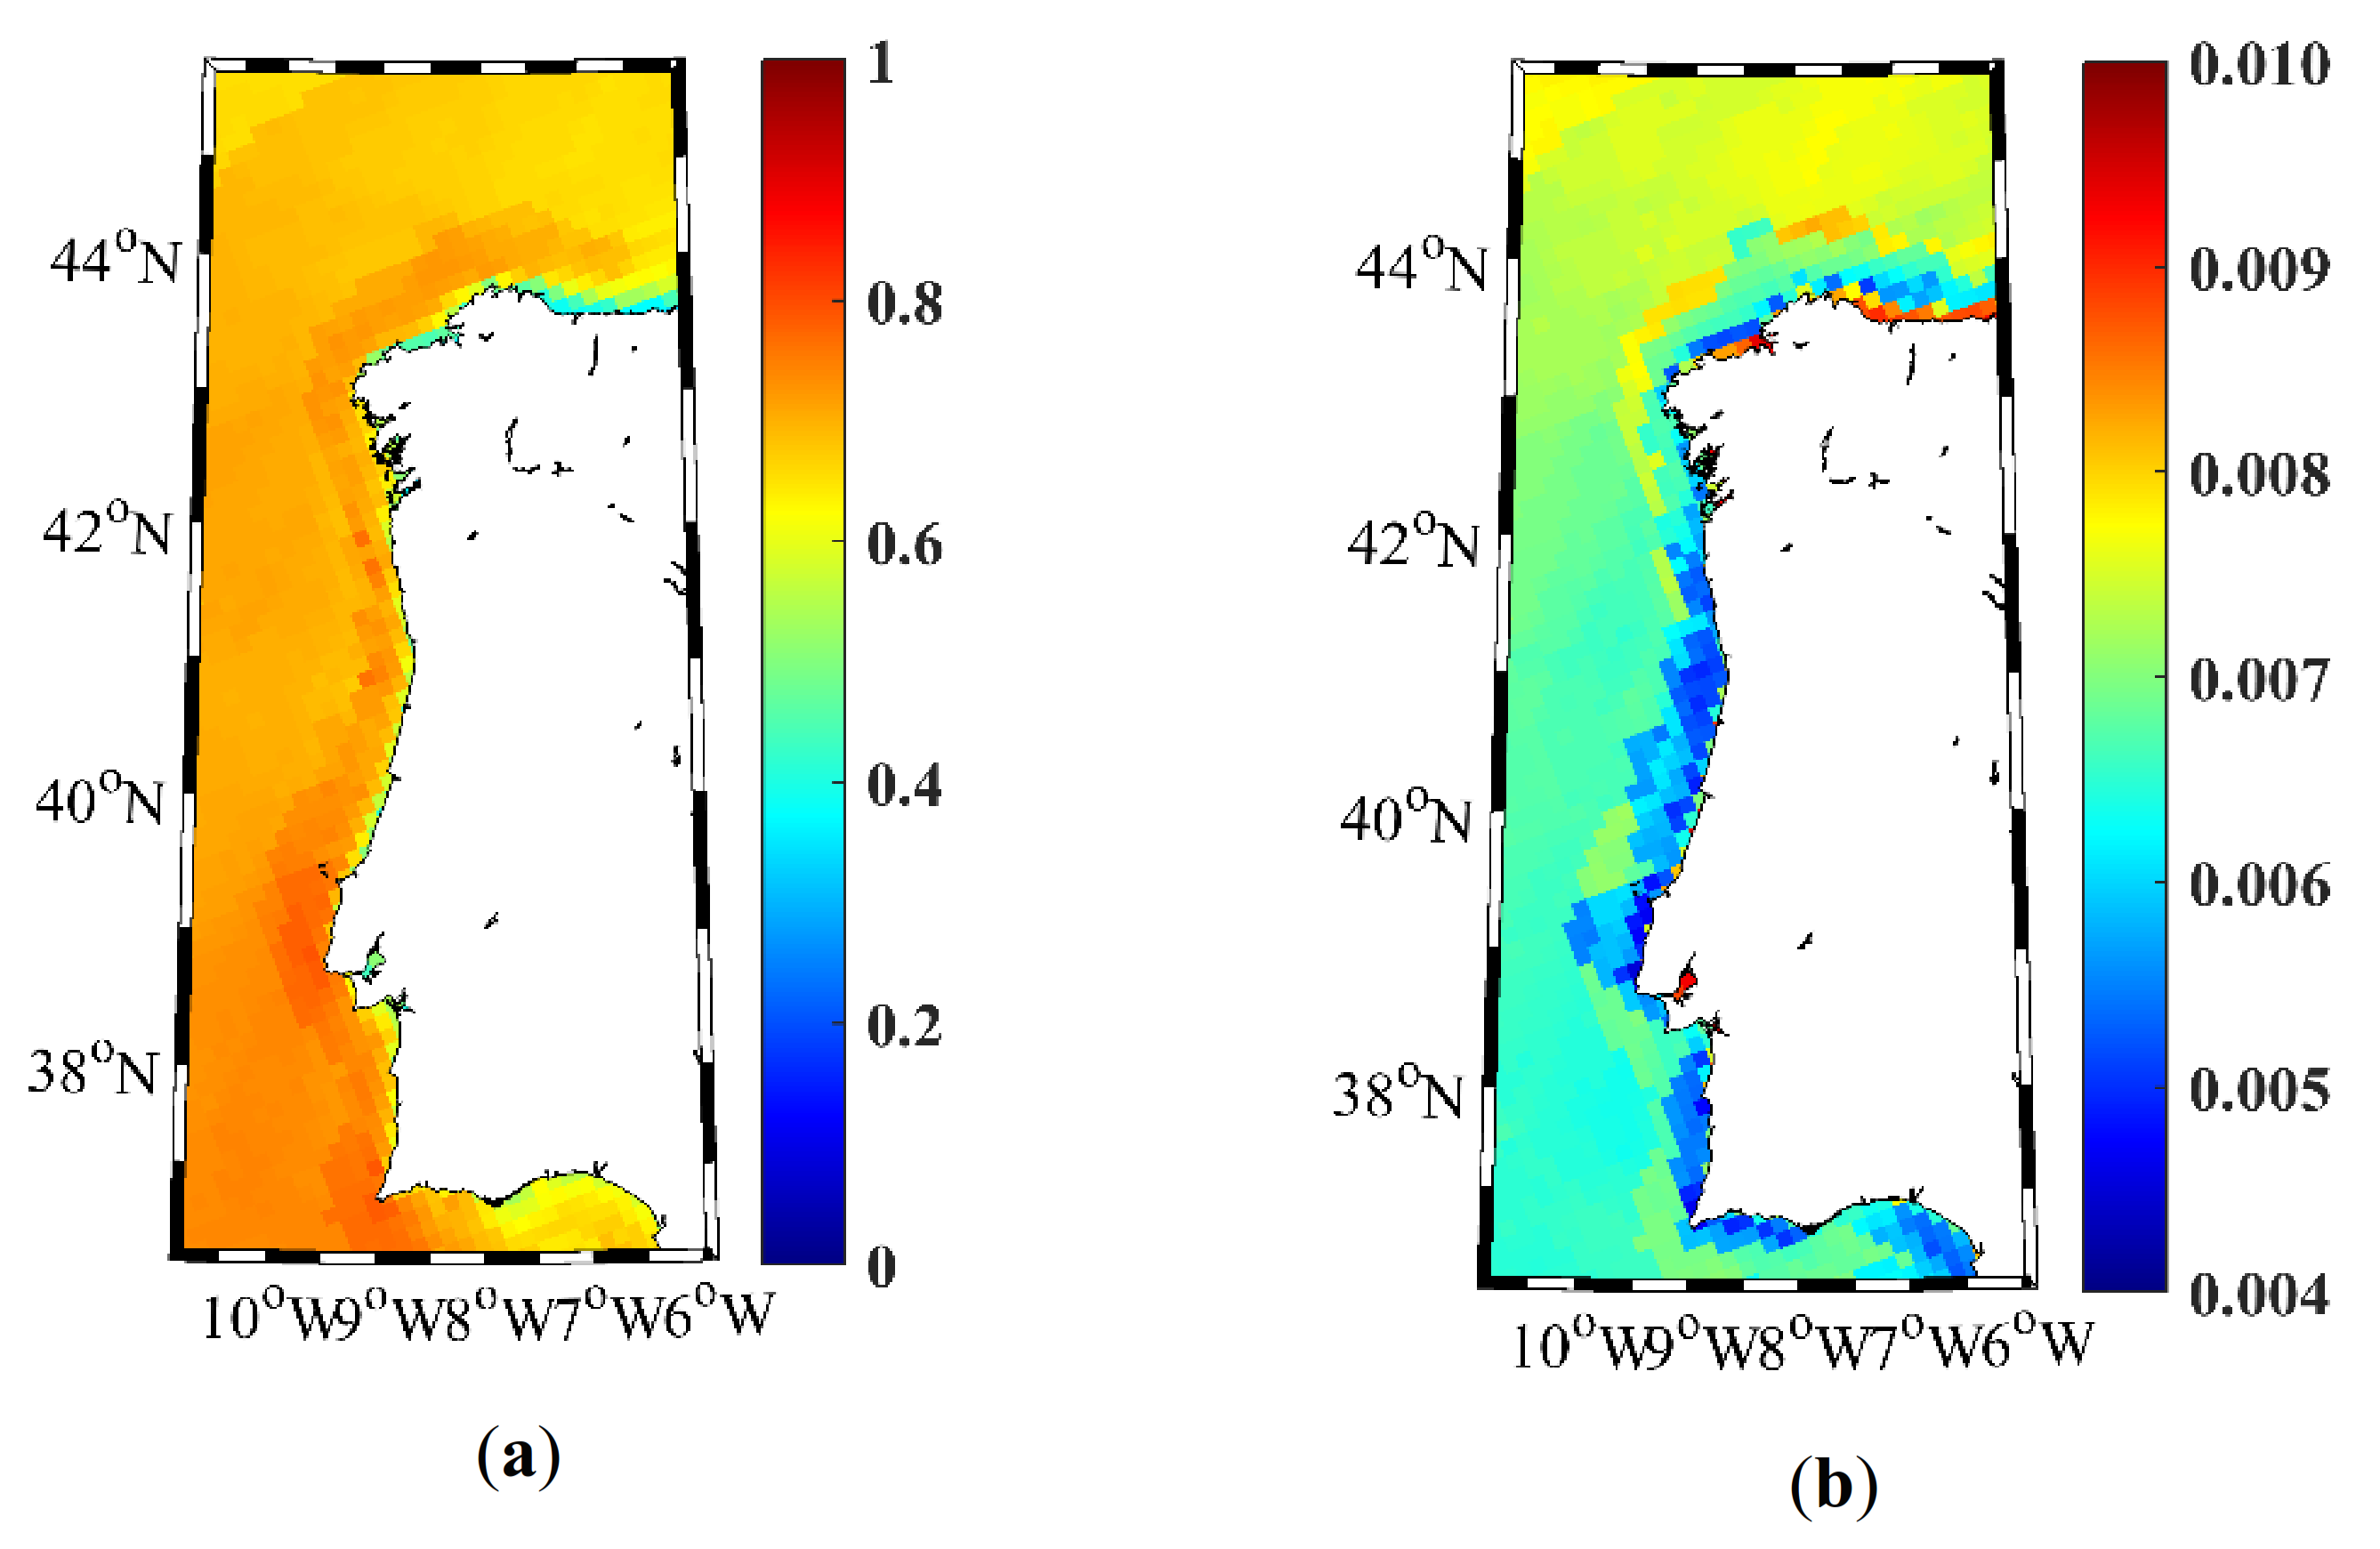
Wave richness resource shows some similarities to that of the wind, mostly due to the waves being generated as a result of the wind forcing on the water surface. WP index (Figure 3a) shows its maximum (0.7) on the northwest region, as the RLO index. The lowest WP values are found near the coast, in particular in the Gulf of Cadiz (<0.2). Regarding wave DWNT index (Figure 3b), it should be noted that it reaches the maximum value of 1 in most of the study area, except in the Gulf of Cadiz.
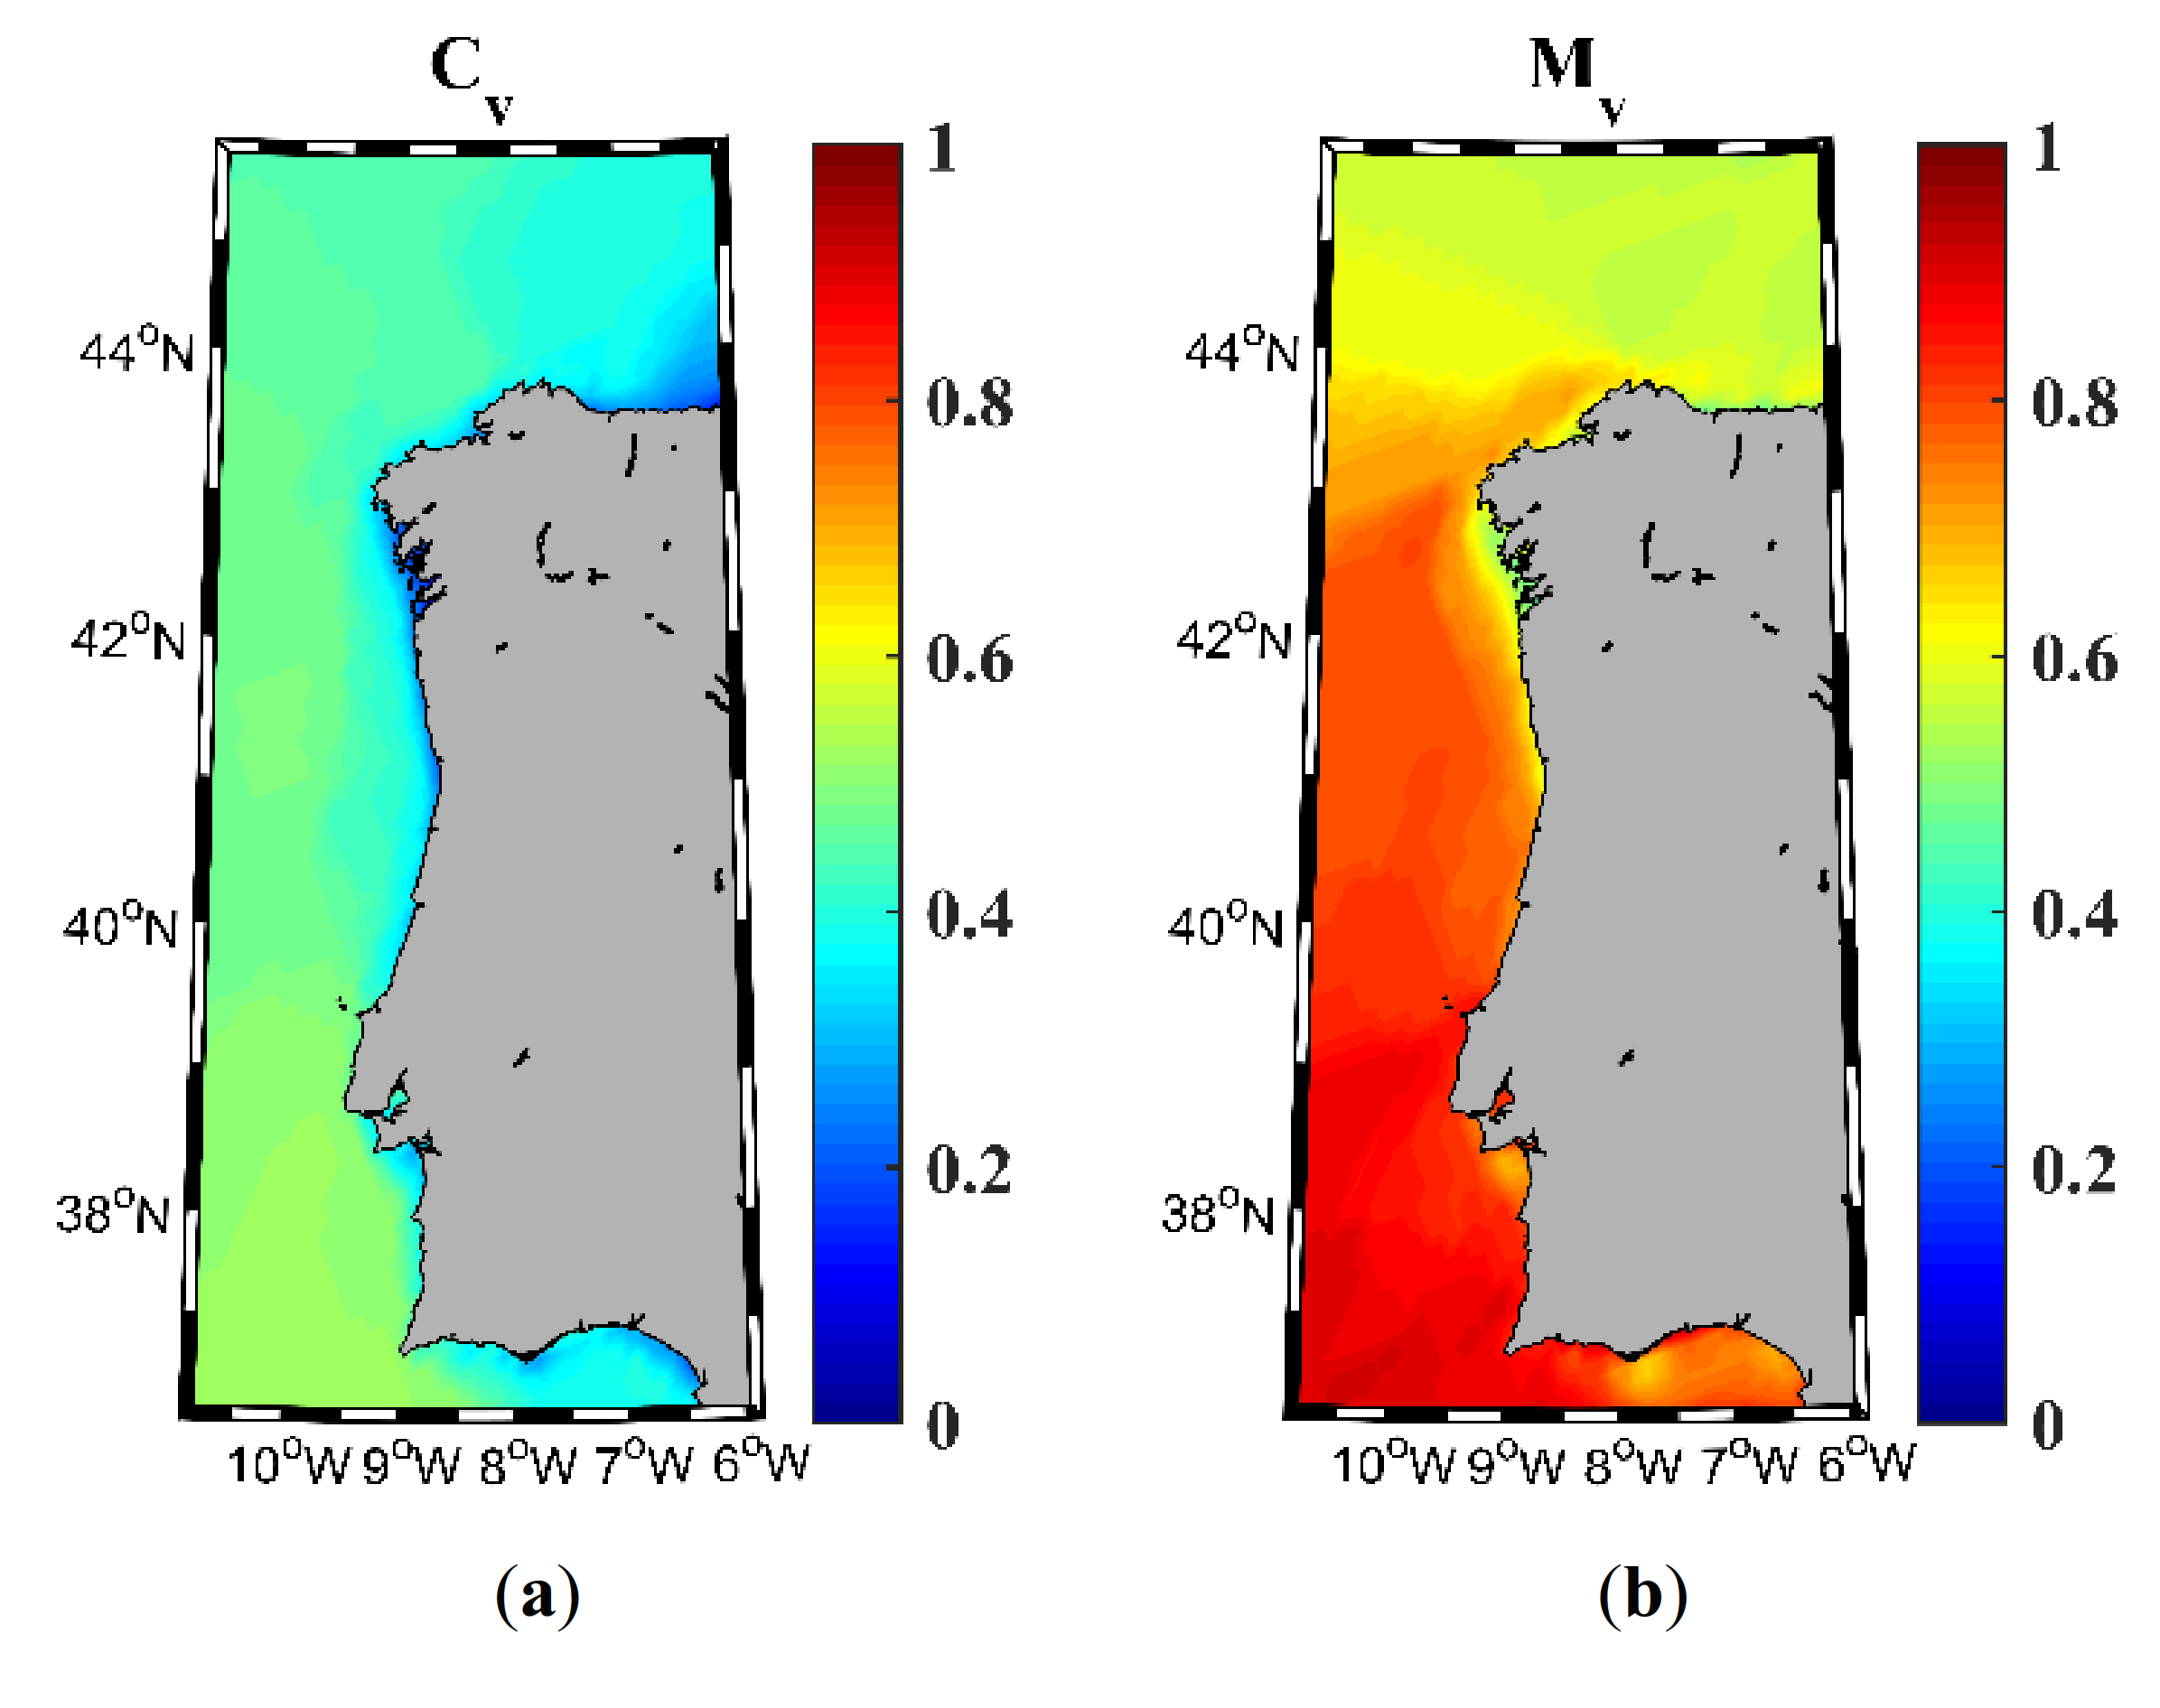
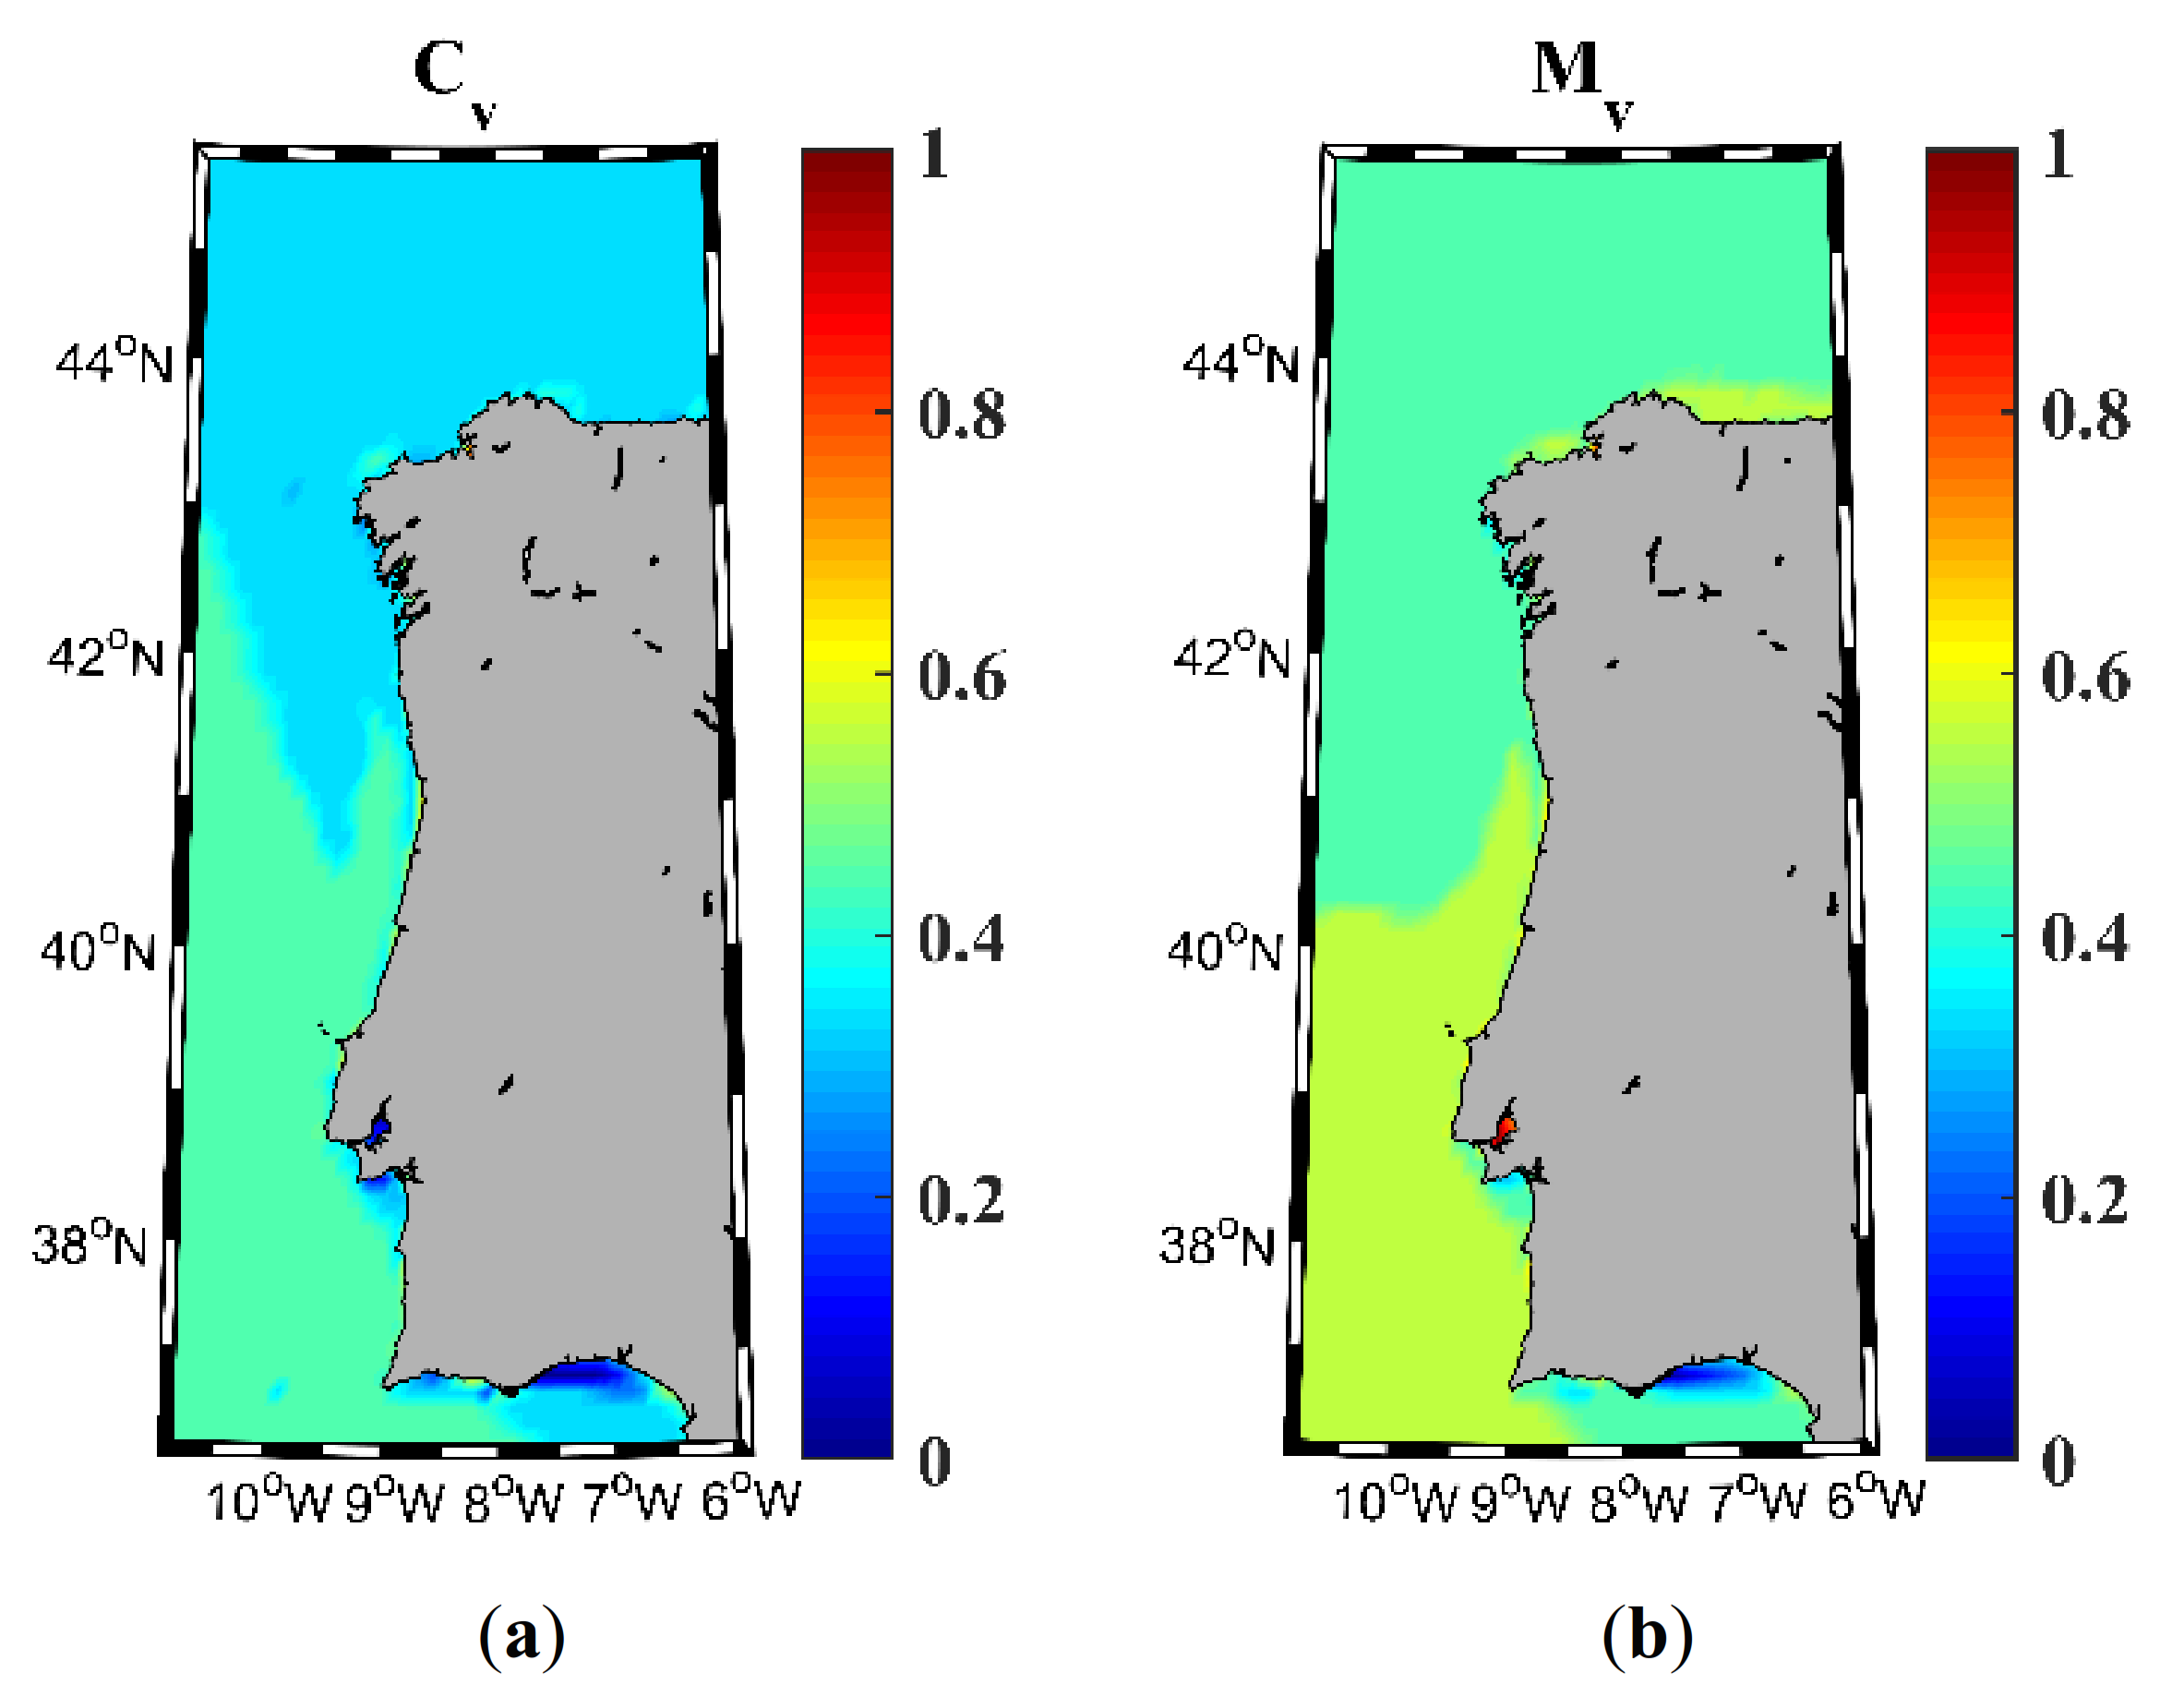
The indices that account for the wind power resource variability, Cv and Mv, are represented in Figure 4a,b, respectively. In general, the highest Cv values of 0.5 are in the ocean region south of Cape Finisterre, which is not optimal for energy production. However, the Mv index is very good (>0.8) for the same region. These Mv and Cv indices suggest the presence of short events linked to seasonal fronts.
The behavior of the wave power resource variability shows a high resemblance with the one shown for the wind. A Cv index (Figure 5a) of around 0.4 is obtained for the northern part of the area, with higher values (~0.5) in the southern part. Mv (Figure 5b) shows values higher than 0.6 in the southwest region of the study area and in a small fringe along the north coast of Spain. For the rest of the area under study, Mv shows values of 0.5. Once again, the lowest values of Cv and Mv indices are located in the Gulf of Cadiz.
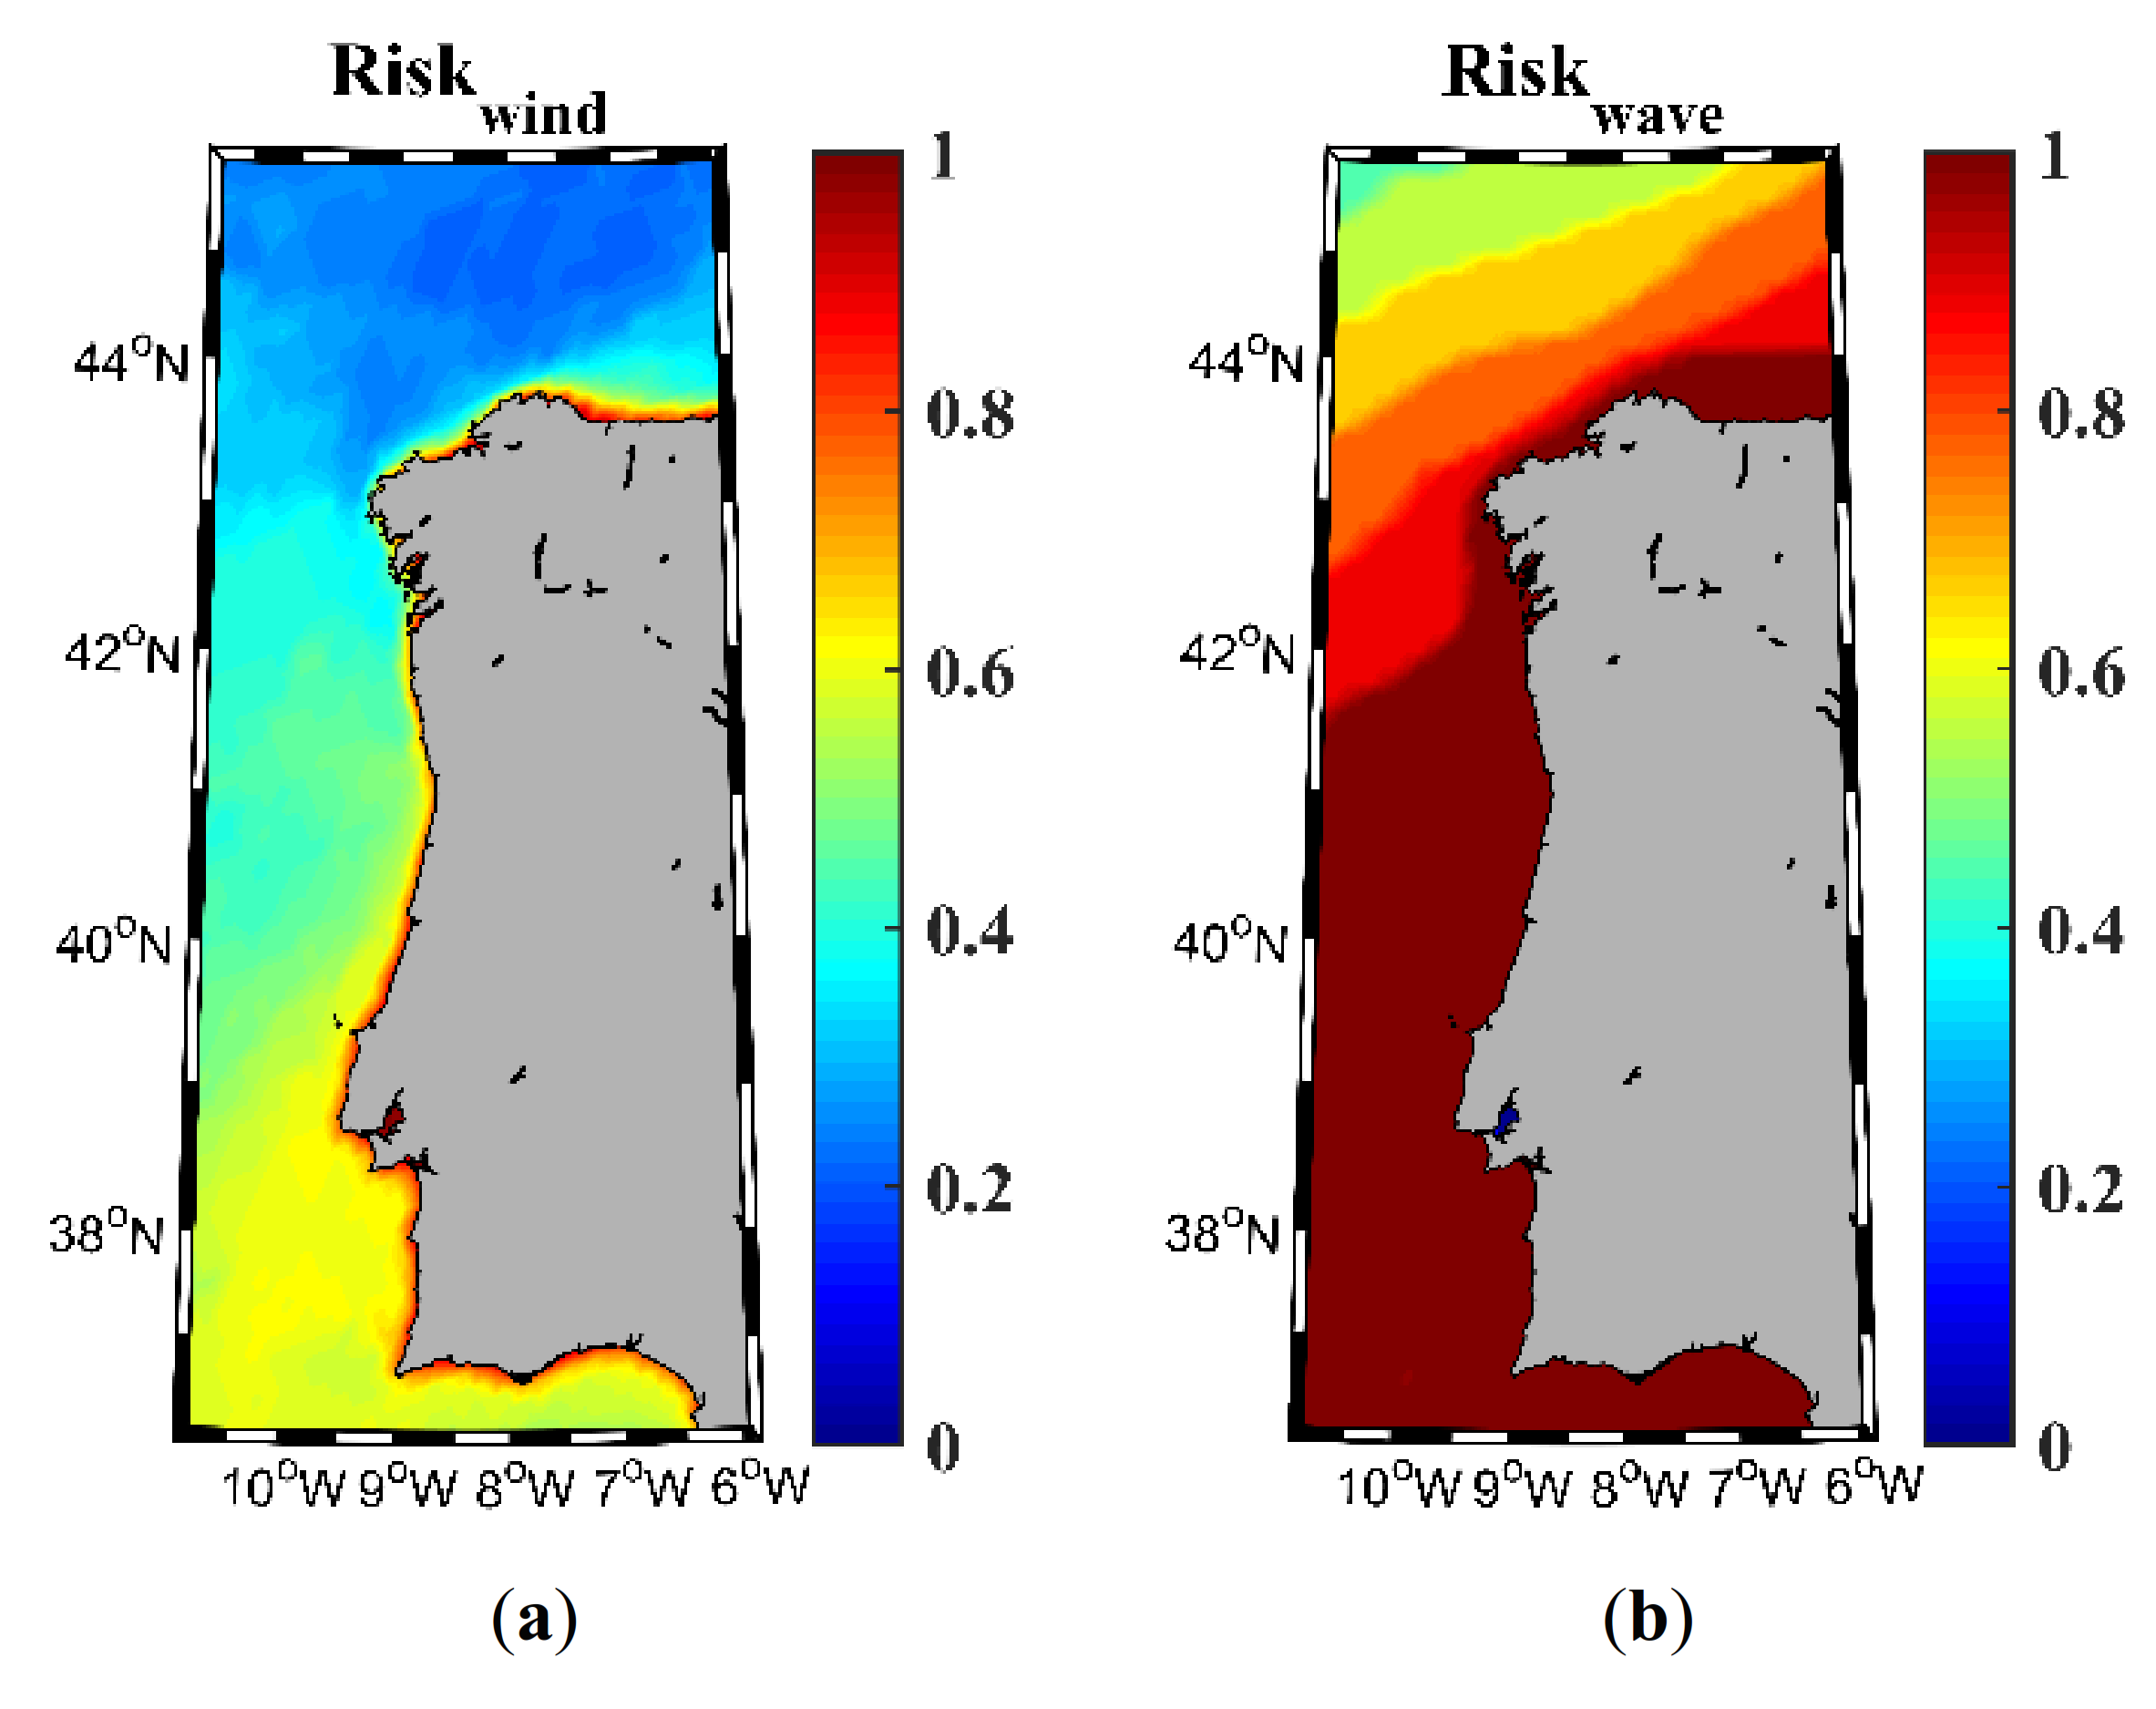
Figure 6 represents the risk category that considers the EWS and EWH indices, which affect the safety related to the maneuverability of energy devices. The wind risk index (Figure 6a) shows high values (>0.8) along a narrow fringe in the coastal region, moderate values in the southwest region (0.6), and low values (<0.3) in the northwest region. The wave risk index (Figure 6b) shows close to 1 in most of the area, apart from the northwest region, where values of 0.5 are shown. It is noticeable that the lowest risk values (the worst risk conditions) in both wind and wave energy resources occur in the same region, the northwest section of the study area. This is precisely the region with the highest values of Wann, RLO, and WP indices.
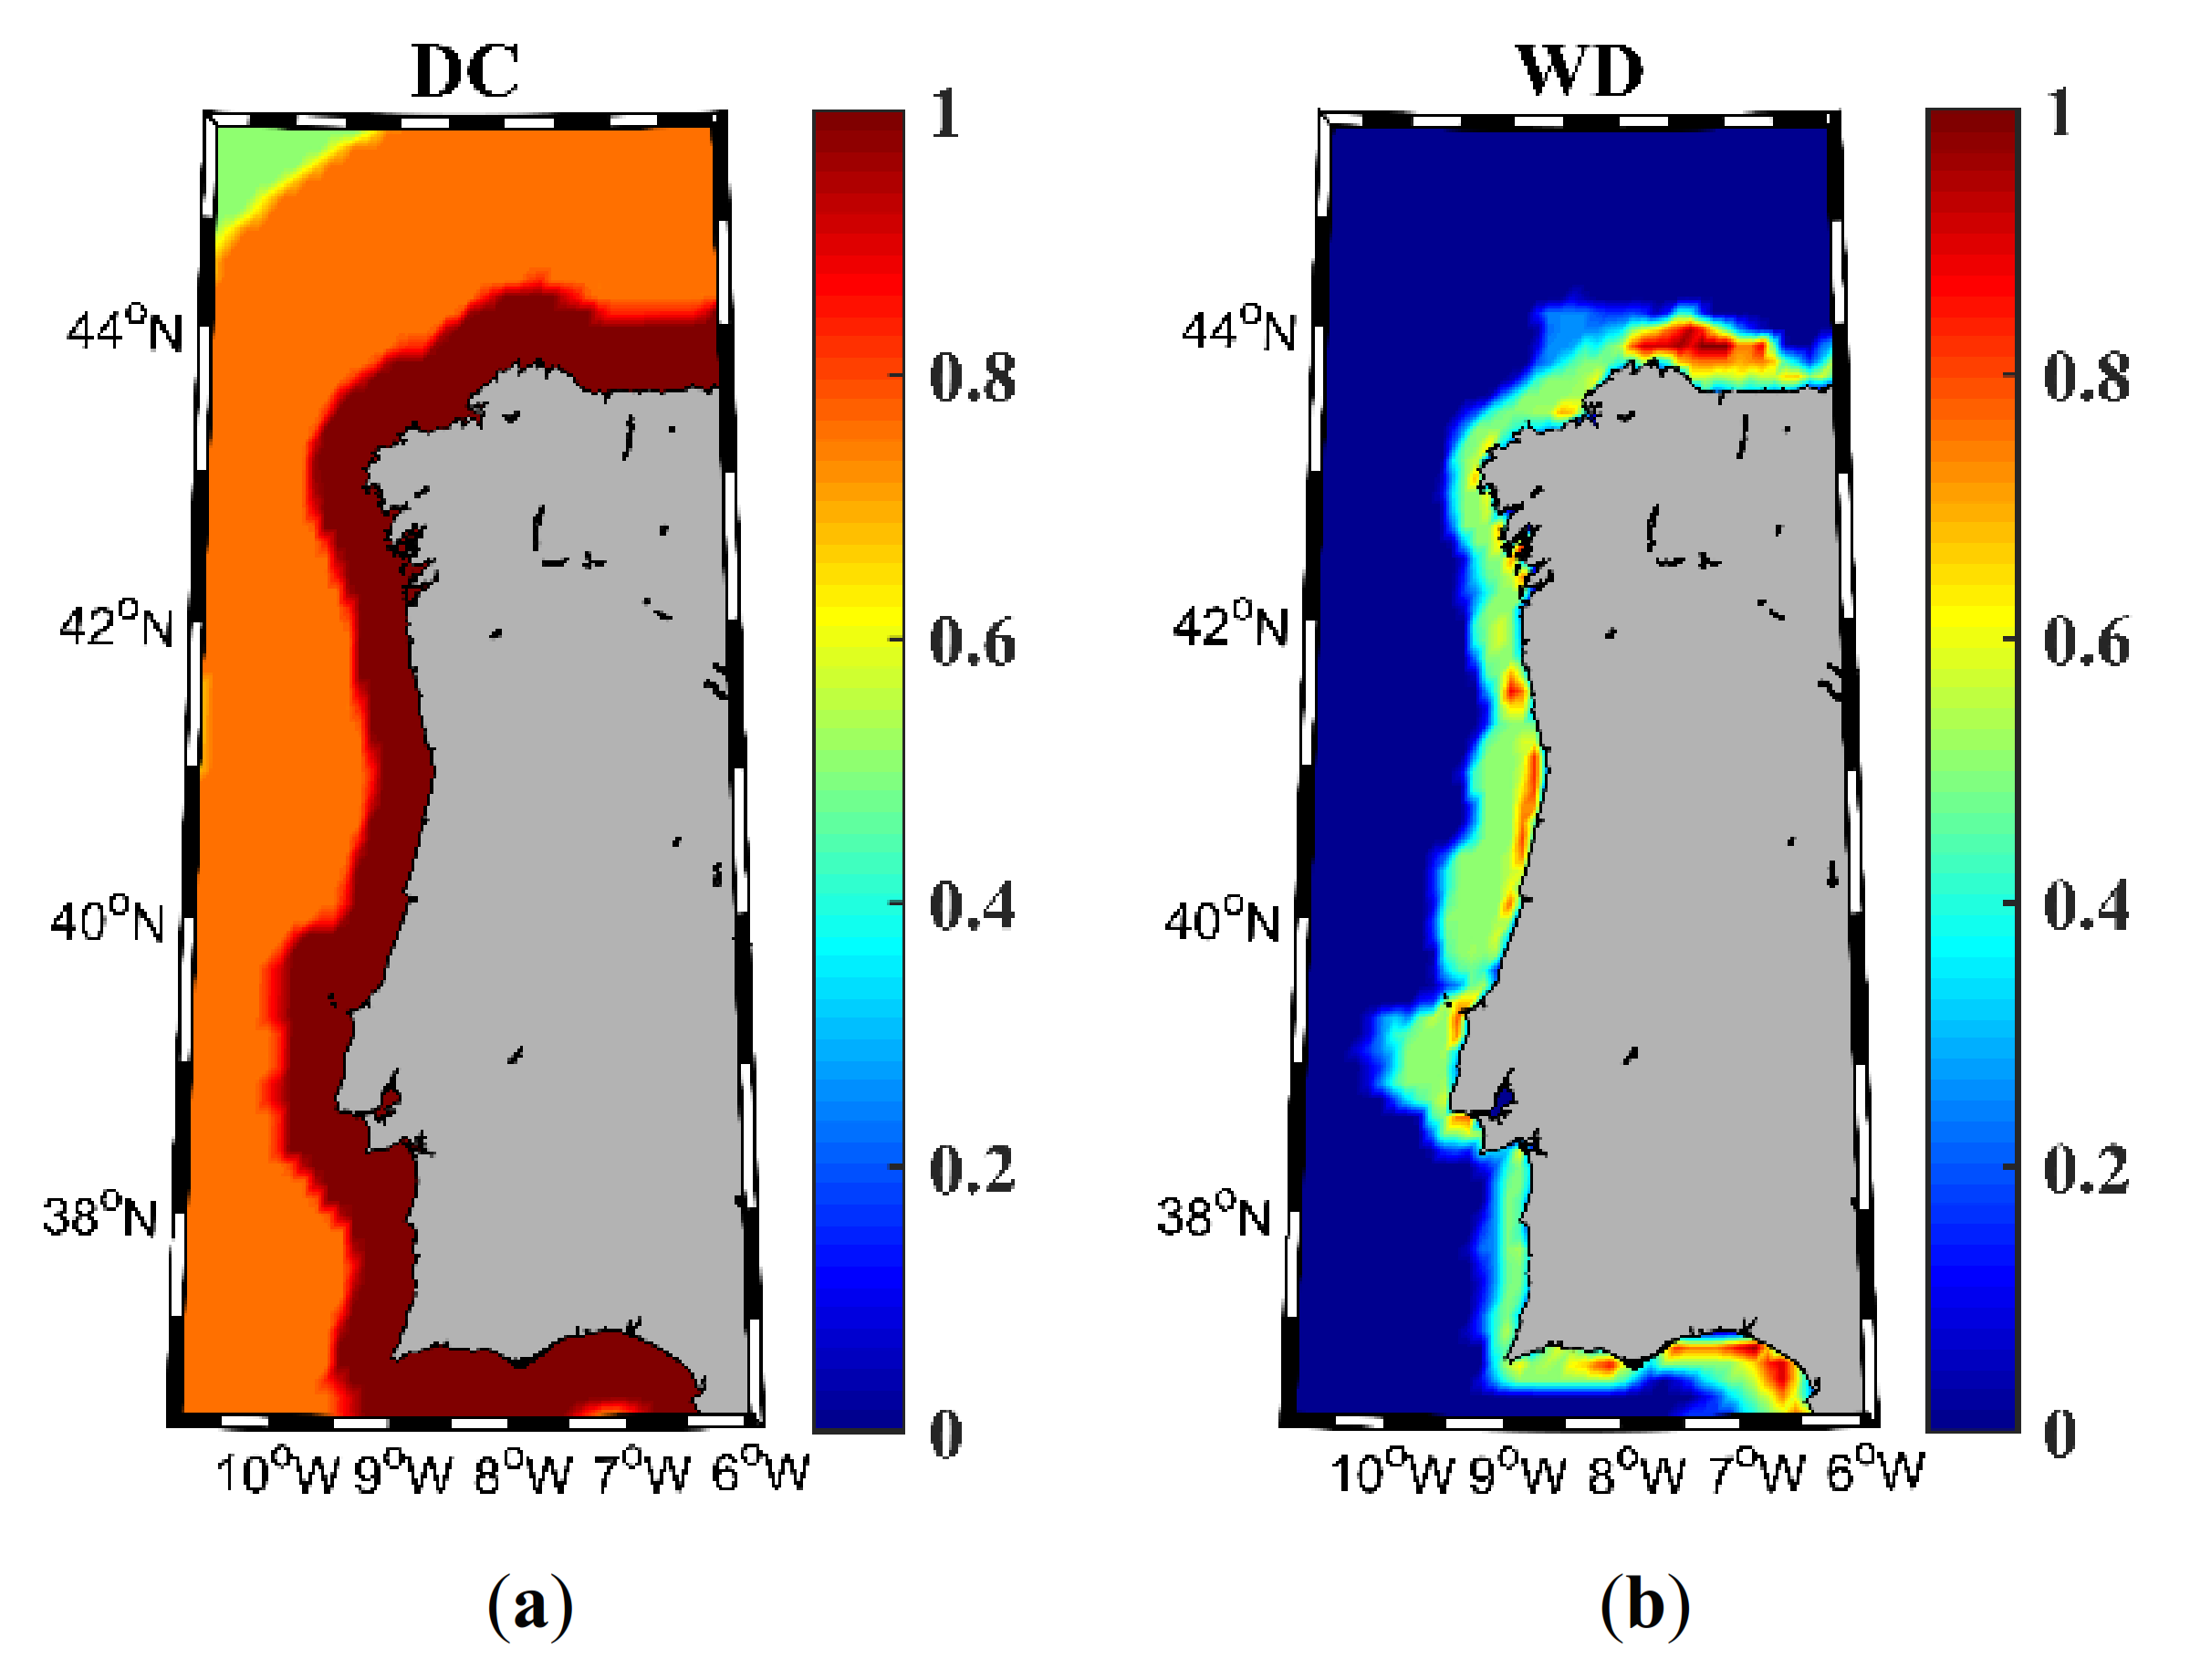
The cost category, represented by DC (Figure 7a) and WD (Figure 7b) is the same for both wind and wave resources, since they only depend on topographic constraints.
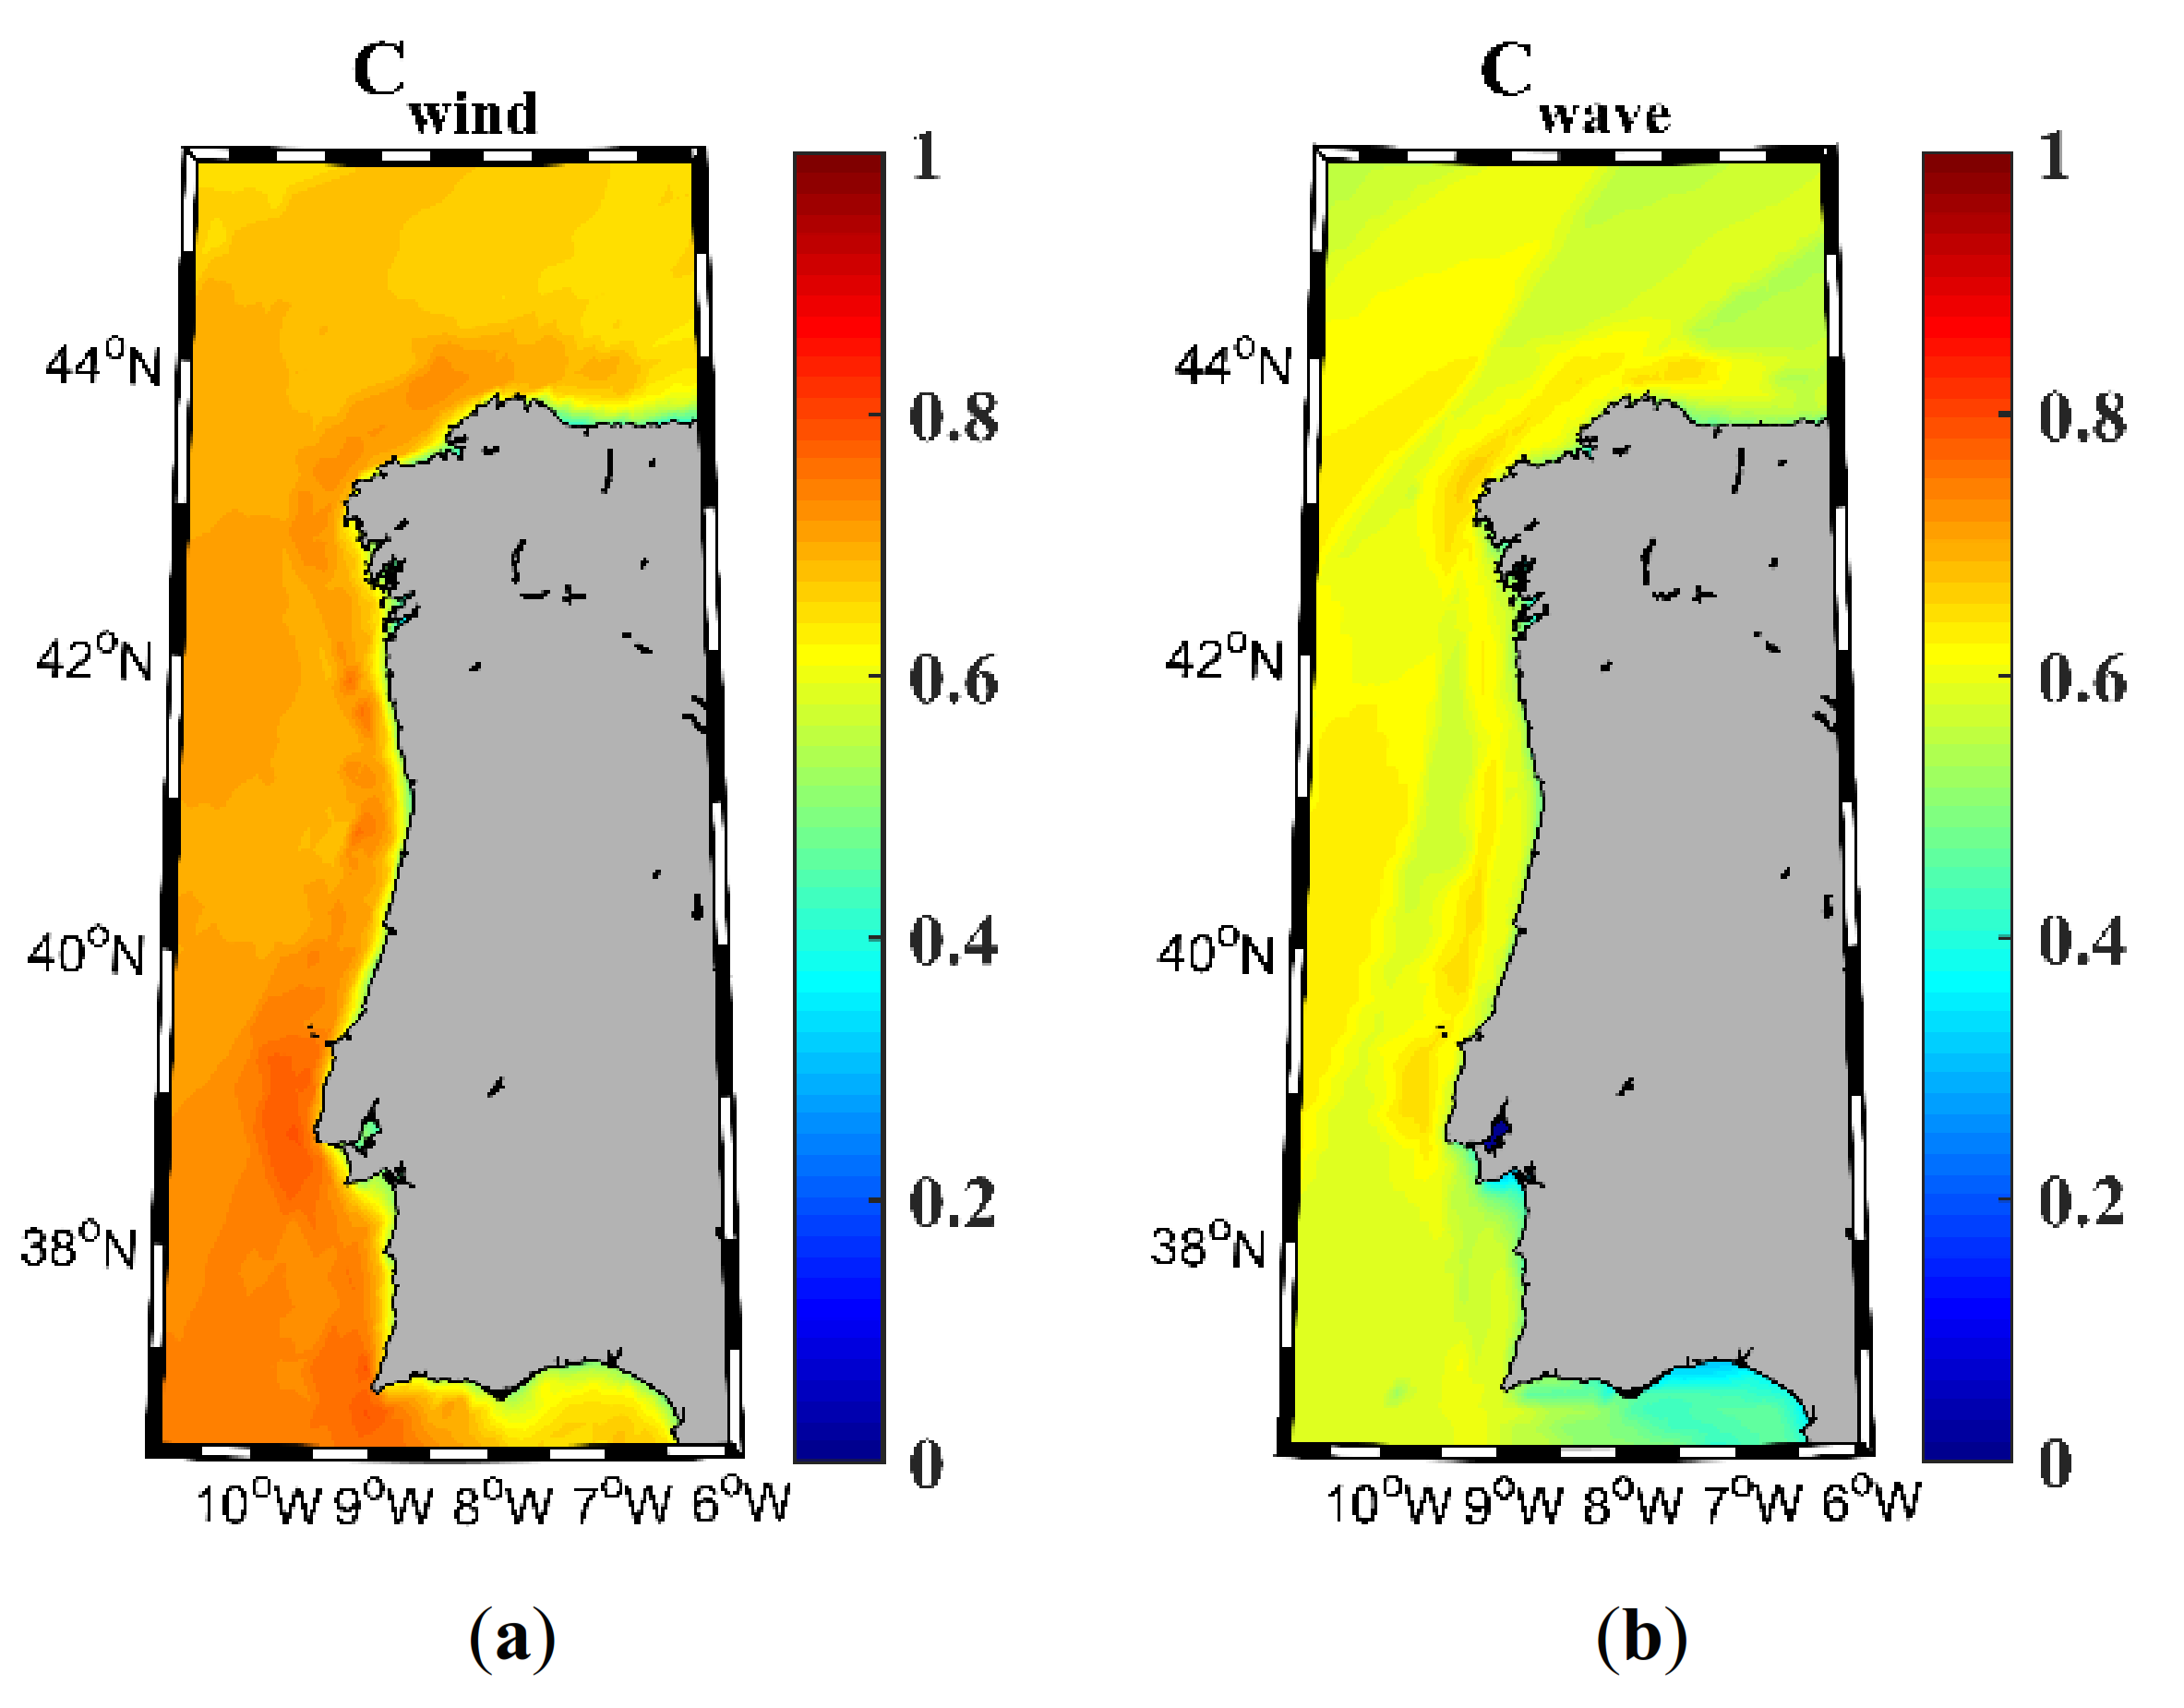
The classification indices calculated following Equation (5) for wind and Equation (6) for waves are shown in Figure 8. The Wind index (Cwind, panel a) shows elevated values (>0.6 in most of the area). Only a very narrow fringe along the cost shows values lower than 0.5. High values can be observed in a wider fringe (~50 km wide) along the coast, the highest ones being (around 0.7) observed from Cape São Vicente to Cape Roca. The wave classification index (Cwave, panel b) shows the same pattern as the one observed for the wind index but with lower values (between 0.4 and 0.7) in the whole region. In this case, the coastal fringe with the highest values covers from Cape Roca to approximately Cape Peña.
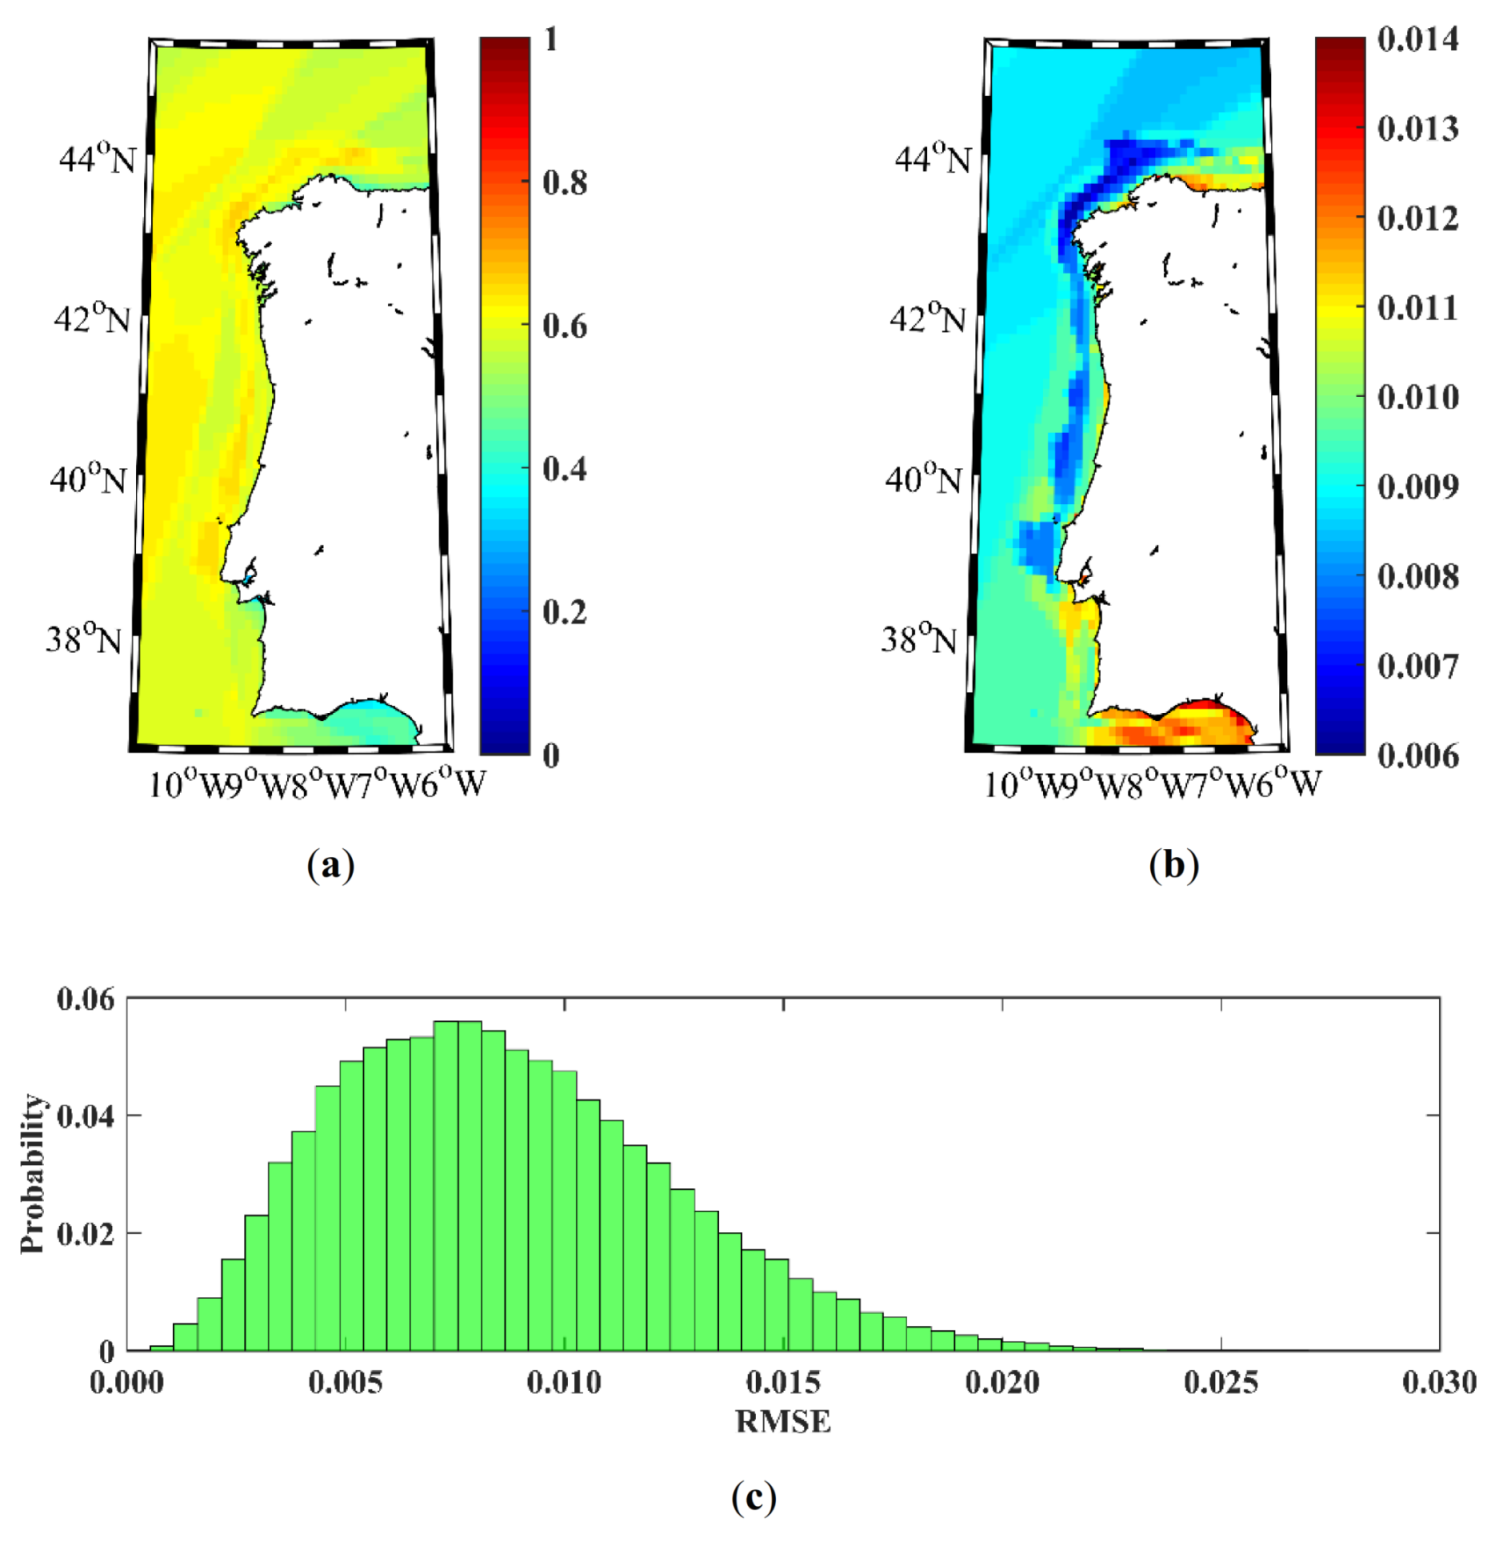
The patterns observed in Figure 8 are similar to the ones depicted in Figure 9 and Figure 10 obtained through the sensitivity analysis described in Section 2.3.5. In particular, Figure 9a and Figure 10a calculated with Equation (15) are similar to Figure 8a,b, respectively. The RMSE values (Figure 9b and Figure 10b) obtained from Equation (13) are at least one order of magnitude smaller than the average classification indices. This fact is corroborated by the distribution of the RMSEj calculated from Equation (14) (Figure 9c and Figure 10c).
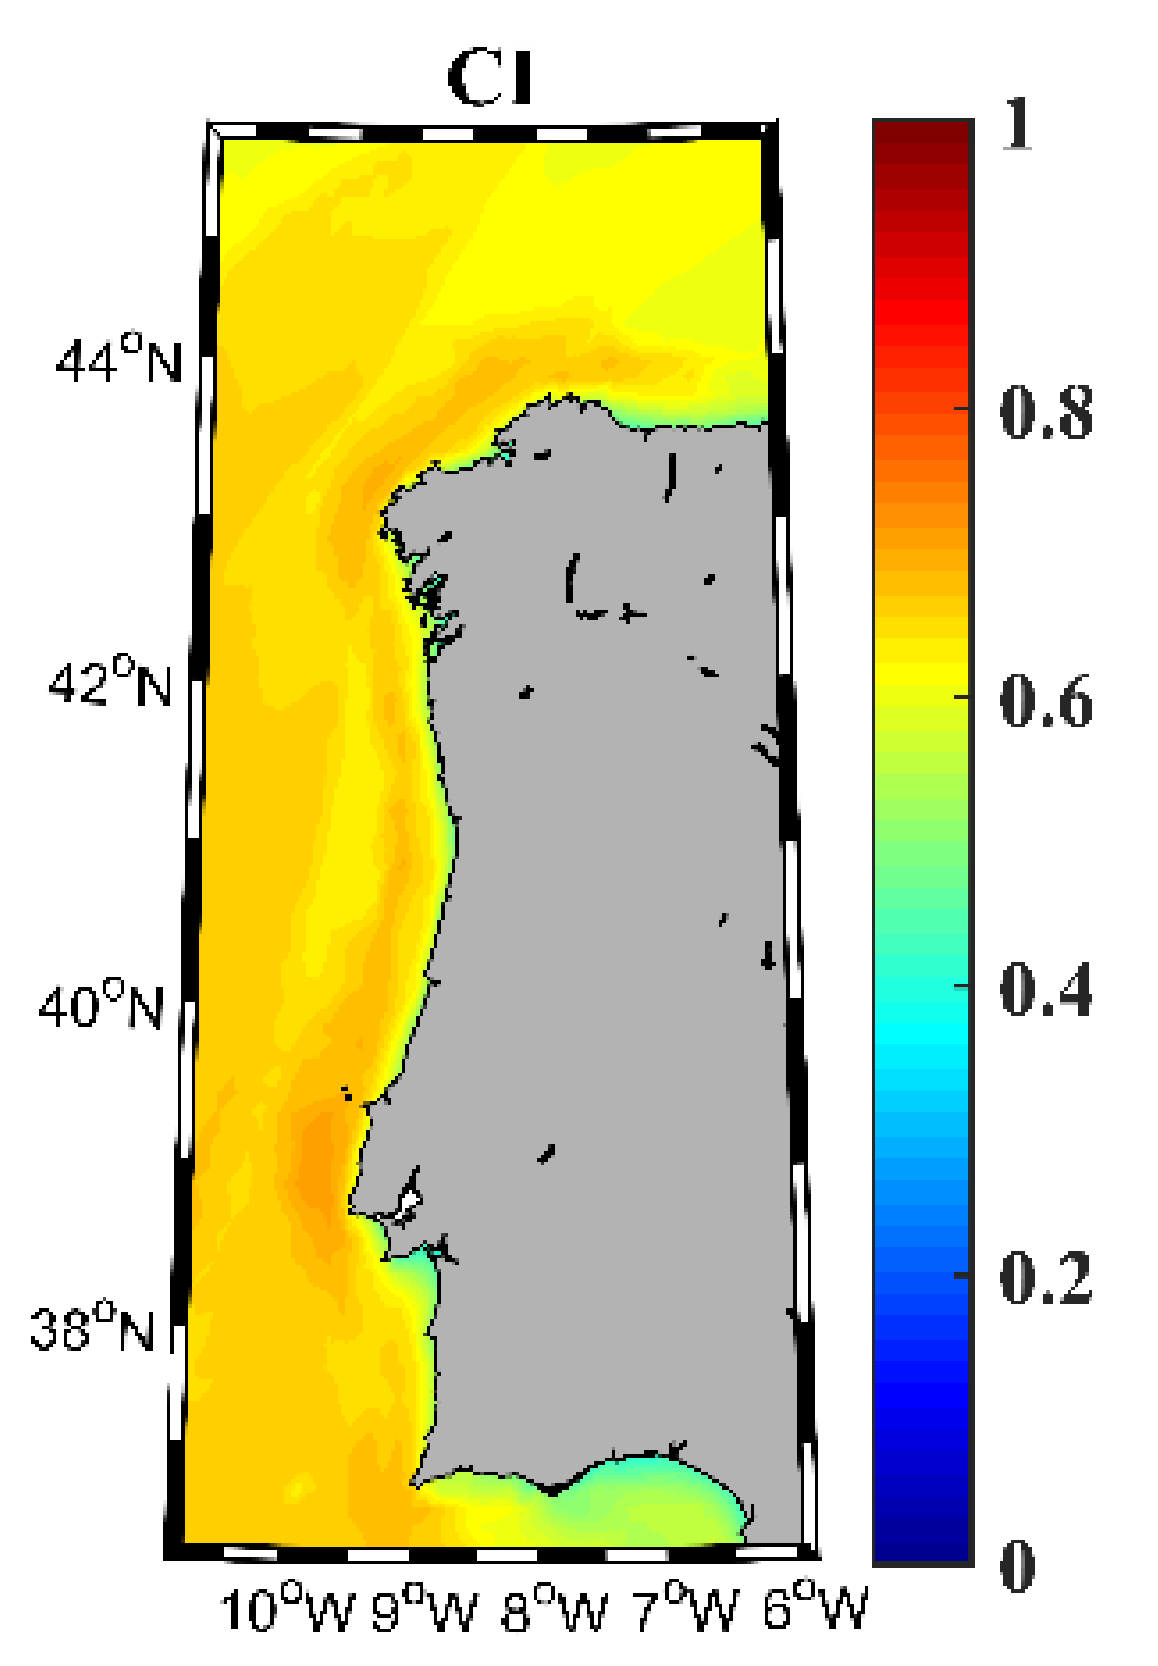
The combined index (CI) to classify the hybrid wind-wave energy resource (Figure 11) shows strong similarities to the patterns observed in Figure 8. In general, the CI is lower than Cwind (Figure 8a) and higher than Cwave (Figure 8b). The narrow coastal fringe with low values, and the wider coastal fringe with high values (from Cape Peñas to Cape São Vicente) can also be observed in this case. Once again, the lowest values, around 0.5, are observed in the Gulf of Cadiz.

4. Conclusions

The viability of exploiting the energy to be produced in hybrid wind-wave farms in the NW Iberian Peninsula for the near future (2026–2045) was investigated using a Delphi method to classify wind and wave energy resources. This classification was based on different indices that represent the resource richness, variability, risk, and cost of the energy resources.
The richness category shows the same patterns for both energy resources, with the highest values in the NW corner of the study area. The variability of the resource also shows a similar pattern for both wind and waves, with the highest values located south of Cape Finisterre. Both resource and variability factors are higher (better) for wind than for wave resource, the downtime factor being better for waves.
The best risk conditions occur along the coastal region, both for wind and waves. In the oceanic part, the conditions improve from north to south. In general, the risk index is worst for wind than for waves.
Finally, a macroscopic evaluation of the hybrid wind-wave resource shows that most of the NW Iberian Peninsula presents good conditions (CI > 0.6) for harvesting energy from wind and wave resources simultaneously. In particular, there are some optimal areas (CI > 0.7), such as the region near Cape Roca and the Galician coast, which had already been highlighted in previous studies on wind [46] and wave [30] resources.
The assessment carried out in this study must be considered as a decision support toolkit in the identification of the best locations for hybrid wind-wave farms, or in the management, adaptation, and resilience of projected and ongoing plans. This assessment only considers the resource from a physical point of view and can be complemented with the technical features of different devices, legal, and environmental constraints, the costs linked to the support of the electric grid connection, and other indices that consider the relation between the maximum production values of both wind and wave resources and the grid energy demand.

Author Contributions

Conceptualization, A.R. (Americo Ribeiro), X.C., M.d.C. and M.G-G.; methodology, X.C. and M.G-G.; formal analysis, A.R. (Americo Ribeiro), X.C., M.d.C., D.C., A.R. (Alfredo Rocha) and M.G.-G.; writing—original draft preparation, A.R. (Americo Ribeiro); writing—review and editing, A.R. (Americo Ribeiro), X.C., M.d.C., D.C., J.M.D., A.R. (Alfredo Rocha) and M.G.-G.; visualization, X.C., M.d.C., D.C., J.M.D., A.R. (Alfredo Rocha) and M.G.-G.; All authors have read and agreed to the published version of the manuscript.

Funding

The first author of this work has been supported by the Portuguese Science Foundation (FCT) through a doctoral grant (SFRH/BD/114919/2016). Thanks are also due to FCT/MCTES for the financial support to CESAM (UIDB/50017/2020+UIDP/50017/2020), through national funds. This work was partially supported by Xunta de Galicia under project ED431C 2017/64-GRC (Grupos de Referencia Competitiva) and by Ministry of Economy and Competitiveness of the Government of Spain under the project “WELCOME ENE2016-75074-C2-1-R” funded by European Regional Development Fund (ERDF). This study is also part of the project “WECAnet: A pan-European network for Marine Renewable Energy” (CA17105), which received funding from the HORIZON2020 Framework Programme by COST (European Cooperation in Science and Technology), a funding agency for research and innovation networks.

Conflicts of Interest

The authors declare no conflict of interest. The funders had no role in the design of the study; in the collection, analysis, or interpretation of data; in the writing of the manuscript; or in the decision to publish the results.

References

  1. United Nations—Climate Action. Available online: https://www.un.org/en/climatechange/ (accessed on 11 September 2020).
  2. European Comission. Regulation Of The European Parliament And Of The Council Establishing The Framework For Achieving Climate Neutrality And Amending Regulation (EU) 2018/1999 (European Climate Law); European Comission: Brussels, Belgium, 2020. [Google Scholar]
  3. ETIPOCEAN. Strategic Research and Innovation Agenda for Ocean Energy; Ocean Energy Europe: Brussels, Belgium, 2020. [Google Scholar]
  4. SET-Plan. Temporary Working Group Ocean Energy; European Comission: Brussels, Belgium, 2018. [Google Scholar]
  5. Ocean Energy Forum. Ocean Energy Strategic Roadmap: Building Ocean Energy for Europe; European Comission: Brussels, Belgium, 2016. [Google Scholar]
  6. Ocean Energy Systems. Annual Report: An overview of Ocean Energy Activities in 2019; Ocean Energy Systems: Lisbon, Portugal, 2020. [Google Scholar]
  7. Maisondieu, C.; Healy, M. The impact of the MARINET initiative on the development of Marine Renewable Energy. Int. J. Mar. Energy 2015, 12, 77–86. [Google Scholar] [CrossRef] [Green Version]
  8. SET-Plan. Offshore Wind Implementation Plan. Available online: https://setis.ec.europa.eu/offshore-wind-implementation (accessed on 11 September 2020).
  9. Watson, S.; Moro, A.; Reis, V.; Baniotopoulos, C.; Barth, S.; Bartoli, G.; Bauer, F.; Boelman, E.; Bosse, D.; Cherubini, A.; et al. Future emerging technologies in the wind power sector: A European perspective. Renew. Sustain. Energy Rev. 2019, 113, 109270. [Google Scholar] [CrossRef]
  10. The European Offshore Wind Industry. Key Trends and Statistics. 2019. Available online: https://windeurope.org/about-wind/statistics/offshore/european-offshore-wind-industry-key-trends-statistics-2019/ (accessed on 11 September 2020).
  11. ETIPOCEAN. EU-Funded Ocean Energy Projects. Framework Programme 7 & Horizon2020; European Comission: Brussels, Belgium, 2018. [Google Scholar]
  12. SET-Plan. Ocean Energy-Implementation Plan. Available online: https://setis.ec.europa.eu/system/files/set_plan_ocean_implementation_plan.pdf (accessed on 11 September 2020).
  13. SET-Plan. Towards an Integrated Strategic Energy Technology (SET) Plan: Accelerating the European Energy System Transformation; European Comission: Brussels, Belgium, 2015. [Google Scholar]
  14. SET-Plan. Secretariat Initiative for Global Leadership in Offshore Wind; European Comission: Brussels, Belgium, 2015. [Google Scholar]
  15. Magagna, D.; Uihlein, A. 2014 JCR Ocean Energy Status Report; European Comission: Brussels, Belgium, 2014. [Google Scholar]
  16. International Renewable Energy Agency. Renewable Power Generation Costs in 2019; International Renewable Energy Agency: Abu Dhabi, UAE, 2020. [Google Scholar]
  17. Pérez-Collazo, C.; Greaves, D.; Iglesias, G. A review of combined wave and offshore wind energy. Renew. Sustain. Energy Rev. 2015, 42, 141–153. [Google Scholar] [CrossRef] [Green Version]
  18. Astariz, S.; Vazquez, A.; Iglesias, G. Evaluation and comparison of the levelized cost of tidal, wave, and offshore wind energy. J. Renew. Sustain. Energy 2015, 7, 053112. [Google Scholar] [CrossRef]
  19. Zanopol, A.T.; Onea, F.; Rusu, E. Evaluation of the coastal influence of a generic wave farm operating in the romanian nearshore. J. Environ. Prot. Ecol. 2014, 15, 597–605. [Google Scholar]
  20. Rusu, E.; Guedes Soares, C. Coastal impact induced by a Pelamis wave farm operating in the Portuguese nearshore. Renew. Energy 2013, 58, 34–49. [Google Scholar] [CrossRef]
  21. Silva, D.; Rusu, E.; Guedes Soares, C. The Effect of a Wave Energy Farm Protecting an Aquaculture Installation. Energies 2018, 11, 2109. [Google Scholar] [CrossRef] [Green Version]
  22. Nassar, W.M.; Anaya-Lara, O.; Ahmed, K.H.; Campos-Gaona, D.; Elgenedy, M. Assessment of Multi-Use Offshore Platforms: Structure Classification and Design Challenges. Sustainability 2020, 12, 1860. [Google Scholar] [CrossRef] [Green Version]
  23. Serri, L.; Sempreviva, A.-D.; Pontes, T.; Murphy, J.; Lynch, K.; Airoldi, D. Resource Data and GIS Tool for Offshore Renewable Energy Projects in Europe; Hydraulics & Maritime Research Centre: Cork, Ireland, 2012. [Google Scholar]
  24. Loukogeorgaki, E.; Vagiona, D.; Vasileiou, M. Site Selection of Hybrid Offshore Wind and Wave Energy Systems in Greece Incorporating Environmental Impact Assessment. Energies 2018, 11, 2095. [Google Scholar] [CrossRef]
  25. Veigas, M.; Iglesias, G. A Hybrid Wave-Wind Offshore Farm for an Island. Int. J. Green Energy 2015, 12, 570–576. [Google Scholar] [CrossRef]
  26. Rusu, E.; Onea, F. A parallel evaluation of the wind and wave energy resources along the Latin American and European coastal environments. Renew. Energy 2019, 143, 1594–1607. [Google Scholar] [CrossRef]
  27. Stoutenburg, E.D.; Jenkins, N.; Jacobson, M.Z. Power output variations of co-located offshore wind turbines and wave energy converters in California. Renew. Energy 2010, 35, 2781–2791. [Google Scholar] [CrossRef]
  28. Bosserelle, C.; Reddy, S.; Krüger, J. Waves and Coasts in the Pacific—Cost Analysis of Wave Energy in the Pacific; Pacific Community: Nouméa, New Caledonia, 2015; ISBN 978-982-00-0944-8. [Google Scholar]
  29. Chan, D.; Mo, J. Life Cycle Reliability and Maintenance Analyses of Wind Turbines. Energy Procedia 2017, 110, 328–333. [Google Scholar] [CrossRef]
  30. Ribeiro, A.S.; DeCastro, M.; Rusu, L.; Bernardino, M.; Dias, J.M.; Gomez-Gesteira, M. Evaluating the Future Efficiency of Wave Energy Converters along the NW Coast of the Iberian Peninsula. Energies 2020, 13, 3563. [Google Scholar] [CrossRef]
  31. Harrison, G.P.; Wallace, A.R. Sensitivity of wave energy to climate change. IEEE Trans. Energy Convers. 2005, 20, 870–877. [Google Scholar] [CrossRef] [Green Version]
  32. López-Ruiz, A.; Bergillos, R.J.; Ortega-Sánchez, M. The importance of wave climate forecasting on the decision-making process for nearshore wave energy exploitation. Appl. Energy 2016, 182, 191–203. [Google Scholar] [CrossRef]
  33. deCastro, M.; Costoya, X.; Salvador, S.; Carvalho, D.; Gómez-Gesteira, M.; Sanz-Larruga, F.J.; Gimeno, L. An overview of offshore wind energy resources in Europe under present and future climate. Ann. N. Y. Acad. Sci. USA 2019, 1436, 70–97. [Google Scholar] [CrossRef]
  34. Moemken, J.; Reyers, M.; Feldmann, H.; Pinto, J.G. Future Changes of Wind Speed and Wind Energy Potentials in EURO-CORDEX Ensemble Simulations. J. Geophys. Res. Atmos. 2018, 123, 6373–6389. [Google Scholar] [CrossRef]
  35. Staffell, I.; Pfenninger, S. Using bias-corrected reanalysis to simulate current and future wind power output. Energy 2016, 114, 1224–1239. [Google Scholar] [CrossRef] [Green Version]
  36. EURO-CORDEX—Coordinated Downscaling Experiment—European Domain. Available online: https://www.euro-cordex.net/ (accessed on 23 June 2020).
  37. Zheng, C.W.; Xiao, Z.N.; Peng, Y.H.; Li, C.Y.; Du, Z.B. bo Rezoning global offshore wind energy resources. Renew. Energy 2018, 129, 1–11. [Google Scholar] [CrossRef]
  38. Astariz, S.; Iglesias, G. The collocation feasibility index—A method for selecting sites for co-located wave and wind farms. Renew. Energy 2017, 103, 811–824. [Google Scholar] [CrossRef] [Green Version]
  39. Martínez-Asensio, A.; Tsimplis, M.N.; Marcos, M.; Feng, X.; Gomis, D.; Jordà, G.; Josey, S.A. Response of the North Atlantic wave climate to atmospheric modes of variability. Int. J. Climatol. 2016, 36, 1210–1225. [Google Scholar] [CrossRef]
  40. Chen, G.; Chapron, B.; Ezraty, R.; Vandemark, D. A Global View of Swell and Wind Sea Climate in the Ocean by Satellite Altimeter and Scatterometer. J. Atmos. Ocean. Technol. 2002, 19, 1849–1859. [Google Scholar] [CrossRef]
  41. Woolf, D.K. Variability and predictability of the North Atlantic wave climate. J. Geophys. Res. 2002, 107, 3145. [Google Scholar] [CrossRef]
  42. Jiang, H.; Chen, G. A Global View on the Swell and Wind Sea Climate by the Jason-1 Mission: A Revisit. J. Atmos. Ocean. Technol. 2013, 30, 1833–1841. [Google Scholar] [CrossRef]
  43. Chen, G. A new look at the zonal pattern of the marine wind system from TOPEX measurements. Remote Sens. Environ. 2002, 79, 15–22. [Google Scholar] [CrossRef]
  44. Clément, A.; McCullen, P.; Falcão, A.; Fiorentino, A.; Gardner, F.; Hammarlund, K.; Lemonis, G.; Lewis, T.; Nielsen, K.; Petroncini, S.; et al. Wave energy in Europe: Current status and perspectives. Renew. Sustain. Energy Rev. 2002, 6, 405–431. [Google Scholar] [CrossRef]
  45. Rusu, L.; Onea, F. The performance of some state-of-the-art wave energy converters in locations with the worldwide highest wave power. Renew. Sustain. Energy Rev. 2017, 75, 1348–1362. [Google Scholar] [CrossRef]
  46. deCastro, M.; Salvador, S.; Gómez-Gesteira, M.; Costoya, X.; Carvalho, D.; Sanz-Larruga, F.J.; Gimeno, L. Europe, China and the United States: Three different approaches to the development of offshore wind energy. Renew. Sustain. Energy Rev. 2019, 109, 55–70. [Google Scholar] [CrossRef]
  47. Palha, A.; Mendes, L.; Fortes, C.J.; Brito-Melo, A.; Sarmento, A. The impact of wave energy farms in the shoreline wave climate: Portuguese pilot zone case study using Pelamis energy wave devices. Renew. Energy 2010, 35, 62–77. [Google Scholar] [CrossRef]
  48. Mahajan, V.; Linstone, H.A.; Turoff, M. The Delphi Method: Techniques and Applications. J. Mark. Res. 1976, 13. [Google Scholar] [CrossRef]
  49. Costoya, X.; DeCastro, M.; Santos, F.; Sousa, M.C.; Gómez-Gesteira, M. Projections of wind energy resources in the Caribbean for the 21st century. Energy 2019, 178, 356–367. [Google Scholar] [CrossRef]
  50. Costoya, X.; deCastro, M.; Carvalho, D.; Gómez-Gesteira, M. On the suitability of offshore wind energy resource in the United States of America for the 21st century. Appl. Energy 2020, 262, 114537. [Google Scholar] [CrossRef]
  51. Gibbons, J.D.; Chakraborti, S. Nonparametric Statistical Inference, 5th ed.; CRC Press: Boca Raton, FL, USA, 2011; ISBN 9781420077612. [Google Scholar]
  52. Costoya, X.; Rocha, A.; Carvalho, D. Using bias-correction to improve future projections of offshore wind energy resource: A case study on the Iberian Peninsula. Appl. Energy 2020, 262, 114562. [Google Scholar] [CrossRef]
  53. Santos, F.; Gómez-Gesteira, M.; DeCastro, M.; Añel, J.A.; Carvalho, D.; Costoya, X.; Dias, J.M. On the accuracy of CORDEX RCMs to project future winds over the Iberian Peninsula and surrounding ocean. Appl. Energy 2018, 228, 289–300. [Google Scholar] [CrossRef]
  54. SWAN. SWAN User Manual Version 41.31; Delft University of Technology, Environmental Fluid Mechanics Section: Delft, The Netherlands, 2019; p. 143. [Google Scholar]
  55. International Electrotechnical Commission. Marine Energy—Wave, Tidal and Other Water Current Converters—Part 201: Tidal Energy Resource Assessment And Characterization; International Electrotechnical Commission: Geneva, Switzerland, 2015. [Google Scholar]
  56. Durrant, T.; Hemer, M.; Trenham, C.; Greenslade, D. CAWCR Wave Hindcast 1979–2010. v8; Commonwealth Scientific and Industrial Research Organisation: Canberra, Australia, 2012. [Google Scholar]
  57. Hemer, M.; Trenham, C.; Durrant, T.; Greenslade, D. CAWCR Global Wind-Wave 21st Century Climate Projections. v2; Commonwealth Scientific and Industrial Research Organisation: Canberra, Australia, 2015. [Google Scholar]
  58. Perkins, S.E.; Pitman, A.J.; Holbrook, N.J.; McAneney, J. Evaluation of the AR4 climate models’ simulated daily maximum temperature, minimum temperature, and precipitation over Australia using probability density functions. J. Clim. 2007, 20, 4356–4376. [Google Scholar] [CrossRef]
  59. Pastor, J.; Liu, Y. Wave Energy Resource Analysis for Use in Wave Energy Conversion. J. Offshore Mech. Arct. Eng. 2015, 137, 011903. [Google Scholar] [CrossRef]
  60. Elliott, D.L.; Holladay, C.G.; Barchet, W.R.; Foote, H.P.; Sandusky, W.F. Wind Energy Resource Atlas of the United States. DOE/CH 10093-10094; Pacific Northwest National Laboratory: Richland, WA, USA, 1986.
  61. Zheng, C.; Pan, J. Assessment of the global ocean wind energy resource. Renew. Sustain. Energy Rev. 2014, 33, 382–391. [Google Scholar] [CrossRef]
  62. Kamranzad, B.; Hadadpour, S. A multi-criteria approach for selection of wave energy converter/location. Energy 2020, 204, 117924. [Google Scholar] [CrossRef]
  63. Kamranzad, B.; Etemad-Shahidi, A.; Chegini, V. Developing an optimum hotspot identifier for wave energy extracting in the northern Persian Gulf. Renew. Energy 2017, 114, 59–71. [Google Scholar] [CrossRef]
  64. Reeve, D.E.; Chen, Y.; Pan, S.; Magar, V.; Simmonds, D.J.; Zacharioudaki, A. An investigation of the impacts of climate change on wave energy generation: The Wave Hub, Cornwall, UK. Renew. Energy 2011, 36, 2404–2413. [Google Scholar] [CrossRef] [Green Version]
  65. Iglesias, G.; Carballo, R. Choosing the site for the first wave farm in a region: A case study in the Galician Southwest (Spain). Energy 2011, 36, 5525–5531. [Google Scholar] [CrossRef]
  66. Rusu, E.; Guedes Soares, C. Numerical modelling to estimate the spatial distribution of the wave energy in the Portuguese nearshore. Renew. Energy 2009, 34, 1501–1516. [Google Scholar] [CrossRef]
  67. Gaetani, M.; Vignati, E.; Monforti-Ferrario, F.; Huld, T.; Dosio, A.; Raes, F. Climate Modelling and Renewable Energy Resource Assessment; European Comission: Brussels, Belgium, 2015. [Google Scholar]
Figure 1. Study area with the main toponyms used in the study.
Applsci 10 07395 g001
Figure 2. Richness indices for wind energy resource. Annual average wind speed (a), rich level occurrence (b), and downtime (c) in the NW Iberian Peninsula for the near future (2026–2045).
Applsci 10 07395 g002
Figure 3. Richness indices for wave energy resource. Wave power (a) and downtime (b) in the NW Iberian Peninsula for the near future (2026–2045).
Applsci 10 07395 g003
Figure 4. Variability indices for wind energy resource. Variation coefficient (a) and monthly variability (b) in the NW Iberian Peninsula for the near future (2026–2045).
Applsci 10 07395 g004
Figure 5. Variability indices for wave energy resource. Variation coefficient (a) and monthly variability (b) in the NW Iberian Peninsula for the near future (2026–2045).
Applsci 10 07395 g005
Figure 6. Risk indices for wind (a) and wave (b) energy resource in the NW Iberian Peninsula for the near future (2026–2045).
Applsci 10 07395 g006
Figure 7. Cost indices: (a) distance to coast (DC), and (b) water depth (WD) for wind and wave energy resources in the NW Iberian Peninsula for the near future (2026–2045).
Applsci 10 07395 g007
Figure 8. Classification of the wind (a) and wave (b) energy resource in the NW Iberian Peninsula for the near future (2026–2045).
Applsci 10 07395 g008
Figure 9. Sensitivity analysis for wind energy. (a) Map of the mean classification index, C j k calculated from Equation (15); (b) Map of the RMSEk calculated from Equation (14); and (c) RMSEj histogram calculated from Equation (13).
Applsci 10 07395 g009aApplsci 10 07395 g009b
Figure 10. Sensitivity analysis for wave energy. (a) Map of the mean classification index, C j k calculated from Equation (15); (b) Map of the RMSEk calculated from Equation (14); and (c) RMSEj histogram calculated from Equation (13).
Applsci 10 07395 g010
Figure 11. Classification of the combined wind-wave energy resource in the NW Iberian Peninsula for the near future (2026–2045).
Applsci 10 07395 g011
Table 1. Regional climate models (RCMs) from the Coordinated Regional Climate Downscaling Experiment (CORDEX) project (http://www.cordex.org/) used in this study. GCM = global climate models.
GCMRCMINSTITUTE
CNRM-CM5CCLM4-8-17CLMcom
CNRM-CM5RCA4SMHI
EC-EARTHRACMO22EKNMI
IPSL-CM5A-MRRCA4SMHI
IPSL-CM5A-MRWRF331FINERIS
MPI-ESM-LRCCLM4-8-17CLMcom
MPI-ESM-LRREMO2009MPI-CSC
Table 2. Normalization criterion used for rich level occurrence (RLO), downtime (DWNT), coefficient of variation index (Cv), monthly variability index (Mv), and extreme wind speeds (EWS) indices related to richness factors, variability factors, and environmental risk factors.
Normalized.RLO (%)DWNT (%)CvMvEWS (ms−1)
0/9<10<10>1.9>2.5>27
1/910–2010–201.7–1.92.25–2.525.5–27.0
2/920–3020–301.5–1.72.0–2.2524.0–25.5
3/930–4030–401.3–1.51.75–2.022.5–24.0
4/940–5040–501.1–1.31.5–1.7521.0–22.5
5/950–6050–600.9–1.11.25–1.519.5–21.0
6/960–7060–700.7–0.91.0–1.2518.0–19.5
7/970–8070–800.5–0.70.75–1.016.5–18.0
8/980–9080–900.3–0.50.5–0.7515.0–16.5
9/9>90>90<0.3<0.5<15.0
Table 3. Normalization criterion used for water depth (WD) and distance to coast (DC) indices related to cost factors.
WD (m)DC (deg)
>500>4
100–5003–4
50–1002–3
25–500.5–2
0–25<0.5
Table 4. Weight coefficient in the wind energy classification. The standard deviation was calculated as σ = i = 1 N A i A ¯ 2 / N , where A is the weight coefficient, A ¯ is the mean value of A and N is the number of experts (10) consulted in [37].
RichnessVariabilityRiskCost
WannRLODWNTCvMvEWSWDDC
0.22 ± 0.020.10 ± 0.010.22 ± 0.020.10 ± 0.010.05 ± 0.010.14 ± 0.010.07 ± 0.010.10 ± 0.02
Table 5. Normalization criterion used for wave energy resource (WP), DWNT, Cv, Mv, and extreme wave heights (EWH) indices related to richness factors, variability factors, environmental risk factors, and cost factors.
NormalizedWP (kWm−1)DWNT (%)CvMvEWH (m)
0/9<10<10>1.9>2.5>21
1/910–2010–201.7–0.92.25–2.520–21
2/920–3020–301.5–1.72.0–2.2519–20
3/930–4030–401.3–1.51.75–2.018–19
4/940–5040–501.1–1.31.5–1.7517–18
5/950–6050–600.9–1.11.25–1.516–17
6/960–7060–700.7–0.91.0–1.2515–16
7/970–8070–800.5–0.70.75–1.014–15
8/980–9080–900.3–0.50.5–0.7513–14
9/9>90>90<0.3<0.5<13
Table 6. Weight coefficient in the wave energy classification. Factors averaged to the fifteen wave energy experts and engineers consulted. The standard deviation was calculated as σ = i = 1 N A i A ¯ 2 / N , where A is the weight coefficient, A ¯ is the mean value of A and N is the number of experts (15).
RichnessVariabilityRiskCost
WPDWNTCvMvEWHWDDC
0.44 ± 0.050.10 ± 0.020.10 ± 0.010.05 ± 0.010.14 ± 0.010.07 ± 0.020.10 ± 0.01
Publisher’s Note: MDPI stays neutral with regard to jurisdictional claims in published maps and institutional affiliations.

