1. Introduction
Oxygen is a key element in many industrial branches. The most common way of using oxygen is to use it to improve the combustion process in metallurgy, power generation, and welding technologies. Due to its properties, oxygen is also used in the chemical industry, for post-production wastewater treatment and disinfection. Also, oxygen, being a gas necessary for life, is widely used in all kinds of medical procedures. In recent years, the oxygen demand has been increasing in branches showing relatively moderate daily consumption of this gas, such as biotechnological processes, water treatment, the construction industry, and medicine [
1].
The primary source of oxygen in the industry is its separation from the atmospheric air. The most important technology used on an industrial scale is low-temperature air rectification [
2]. The capacity of cryogenic installations reaches several thousand tons of oxygen per day in a single process line [
3]. The alternatives to cryogenic methods include adsorption, membrane, and chemical looping [
4,
5]. With the oxygen demand lower than approximately 100 tons per day, cryogenic methods of oxygen separation are no longer viable. This effect has been analyzed both exergetically and economically [
6]. In the case of such low oxygen demands (up to the laboratory scale), technologies based on the adsorption process can be perceived as the only mature, economically justified technology for separating oxygen from the air [
4]. The use of adsorption technology is also justified in oxy-fuel power blocks with an electrical capacity of up to 25 MW [
7].
The literature review shows that there are no data on energy consumption and optimization methods for small adsorption-based oxygen generators, though such work is carried out on adsorption chillers [
8,
9]. Considerations regarding energy optimization seem to be crucial for low-capacity oxygen generators, in which auxiliary devices have a significant impact on the energy consumption of the entire oxygen separation process.
This paper presents a method of optimizing the process of oxygen separation from the air using the PSA method to obtain the lowest energy consumption while maintaining the nominal oxygen purity. As a result of the conducted experiments, the authors show the oxygen generator efficiency optimization by choosing an appropriate adsorption pressure and oxygen transfer time. Additionally, the authors indicate the influence of the pressure difference between the adsorption bed and the oxygen tank on the purity of separated oxygen.
The possibility of reducing the energy consumption of a standard small-scale oxygen generator by about 40% with an increase in maximum efficiency by over 80% was experimentally demonstrated by using the presented methods.
2. Adsorption Based Oxygen Separation Method
The method of separating oxygen from the air with the use of adsorption is based on the selection of such sorbents for which the maximum capacity of individual components of the air mixture is different. This way, it is possible to select the operating parameters in such a way that when forcing a portion of the air mixture through the adsorption bed, one of the components is wholly adsorbed. In this way, the remaining air components are concentrated in the stream of non-adsorbed gas [
10,
11,
12].
In the case of using a nitrogen-selective sorbent for air separation, the result is the stream of adsorbed gas with a composition of about 85–90% nitrogen and 10–15% oxygen, and the stream of non-adsorbed gas with a composition of about 95% oxygen and 5% argon [
5,
13]. The research also indicates the possibility of obtaining oxygen with a purity of 99% with the use of silver-based nitrogen-selective adsorbents [
14].
When an oxygen-selective sorbent is used for air separation, a stream of adsorbed gas is obtained with the composition of about 65–75% of oxygen and 25–35% nitrogen, and a stream of non-adsorbed gas with the composition of about 98% nitrogen and 2% argon [
15,
16].
Due to the obtained gas stream compositions, nitrogen-selective adsorption beds are usually used to separate oxygen from the air.
The adsorption process is a non-equilibrium process. It takes place until the bed is saturated with the adsorbed substance. After the adsorption stage, the adsorption bed needs to be regenerated to be able to be used for the next gas mixture separation cycle. To achieve the relative continuity of the process, paired adsorption tanks are used. The air separation process is carried out in such a way that the adsorption stage takes place in only one of the adsorption tanks at a given time. Simultaneously, the regeneration of the bed is carried out in the second tank. This method is called Swing Adsorption (SA) [
10,
11].
The adsorption method allows the use of various energy sources in the oxygen separation process [
1,
17,
18]. Most common oxygen generators use the PSA (Pressure Swing Adsorption) or VPSA (Vacuum-Pressure Swing Adsorption) process, which uses an electrically powered gas compressor. These methods are based on the use of the adsorbency difference of the adsorption bed at different pressures. The VPSA process is mostly used in high-yield oxygen generators. The PSA process is mainly used in portable generators with a lower yield.
The adsorption method of oxygen separation is characterized by low investment costs. The efficiency of the process and operating costs strongly depend on the compaction rate of the bed, its homogeneity [
19,
20], and the optimization quality of the applied oxygen separation procedure.
The most frequently used adsorbents for the separation of oxygen with a purity of up to 95% are 5A and 13X zeolites. Studies showed that both adsorbents behave stably over a wide pressure range and allow for predictable operation of the oxygen separator. The literature indicates that devices using zeolite 5A are characterized by the higher efficiency of oxygen separation compared to devices using zeolite 13X under the same process conditions [
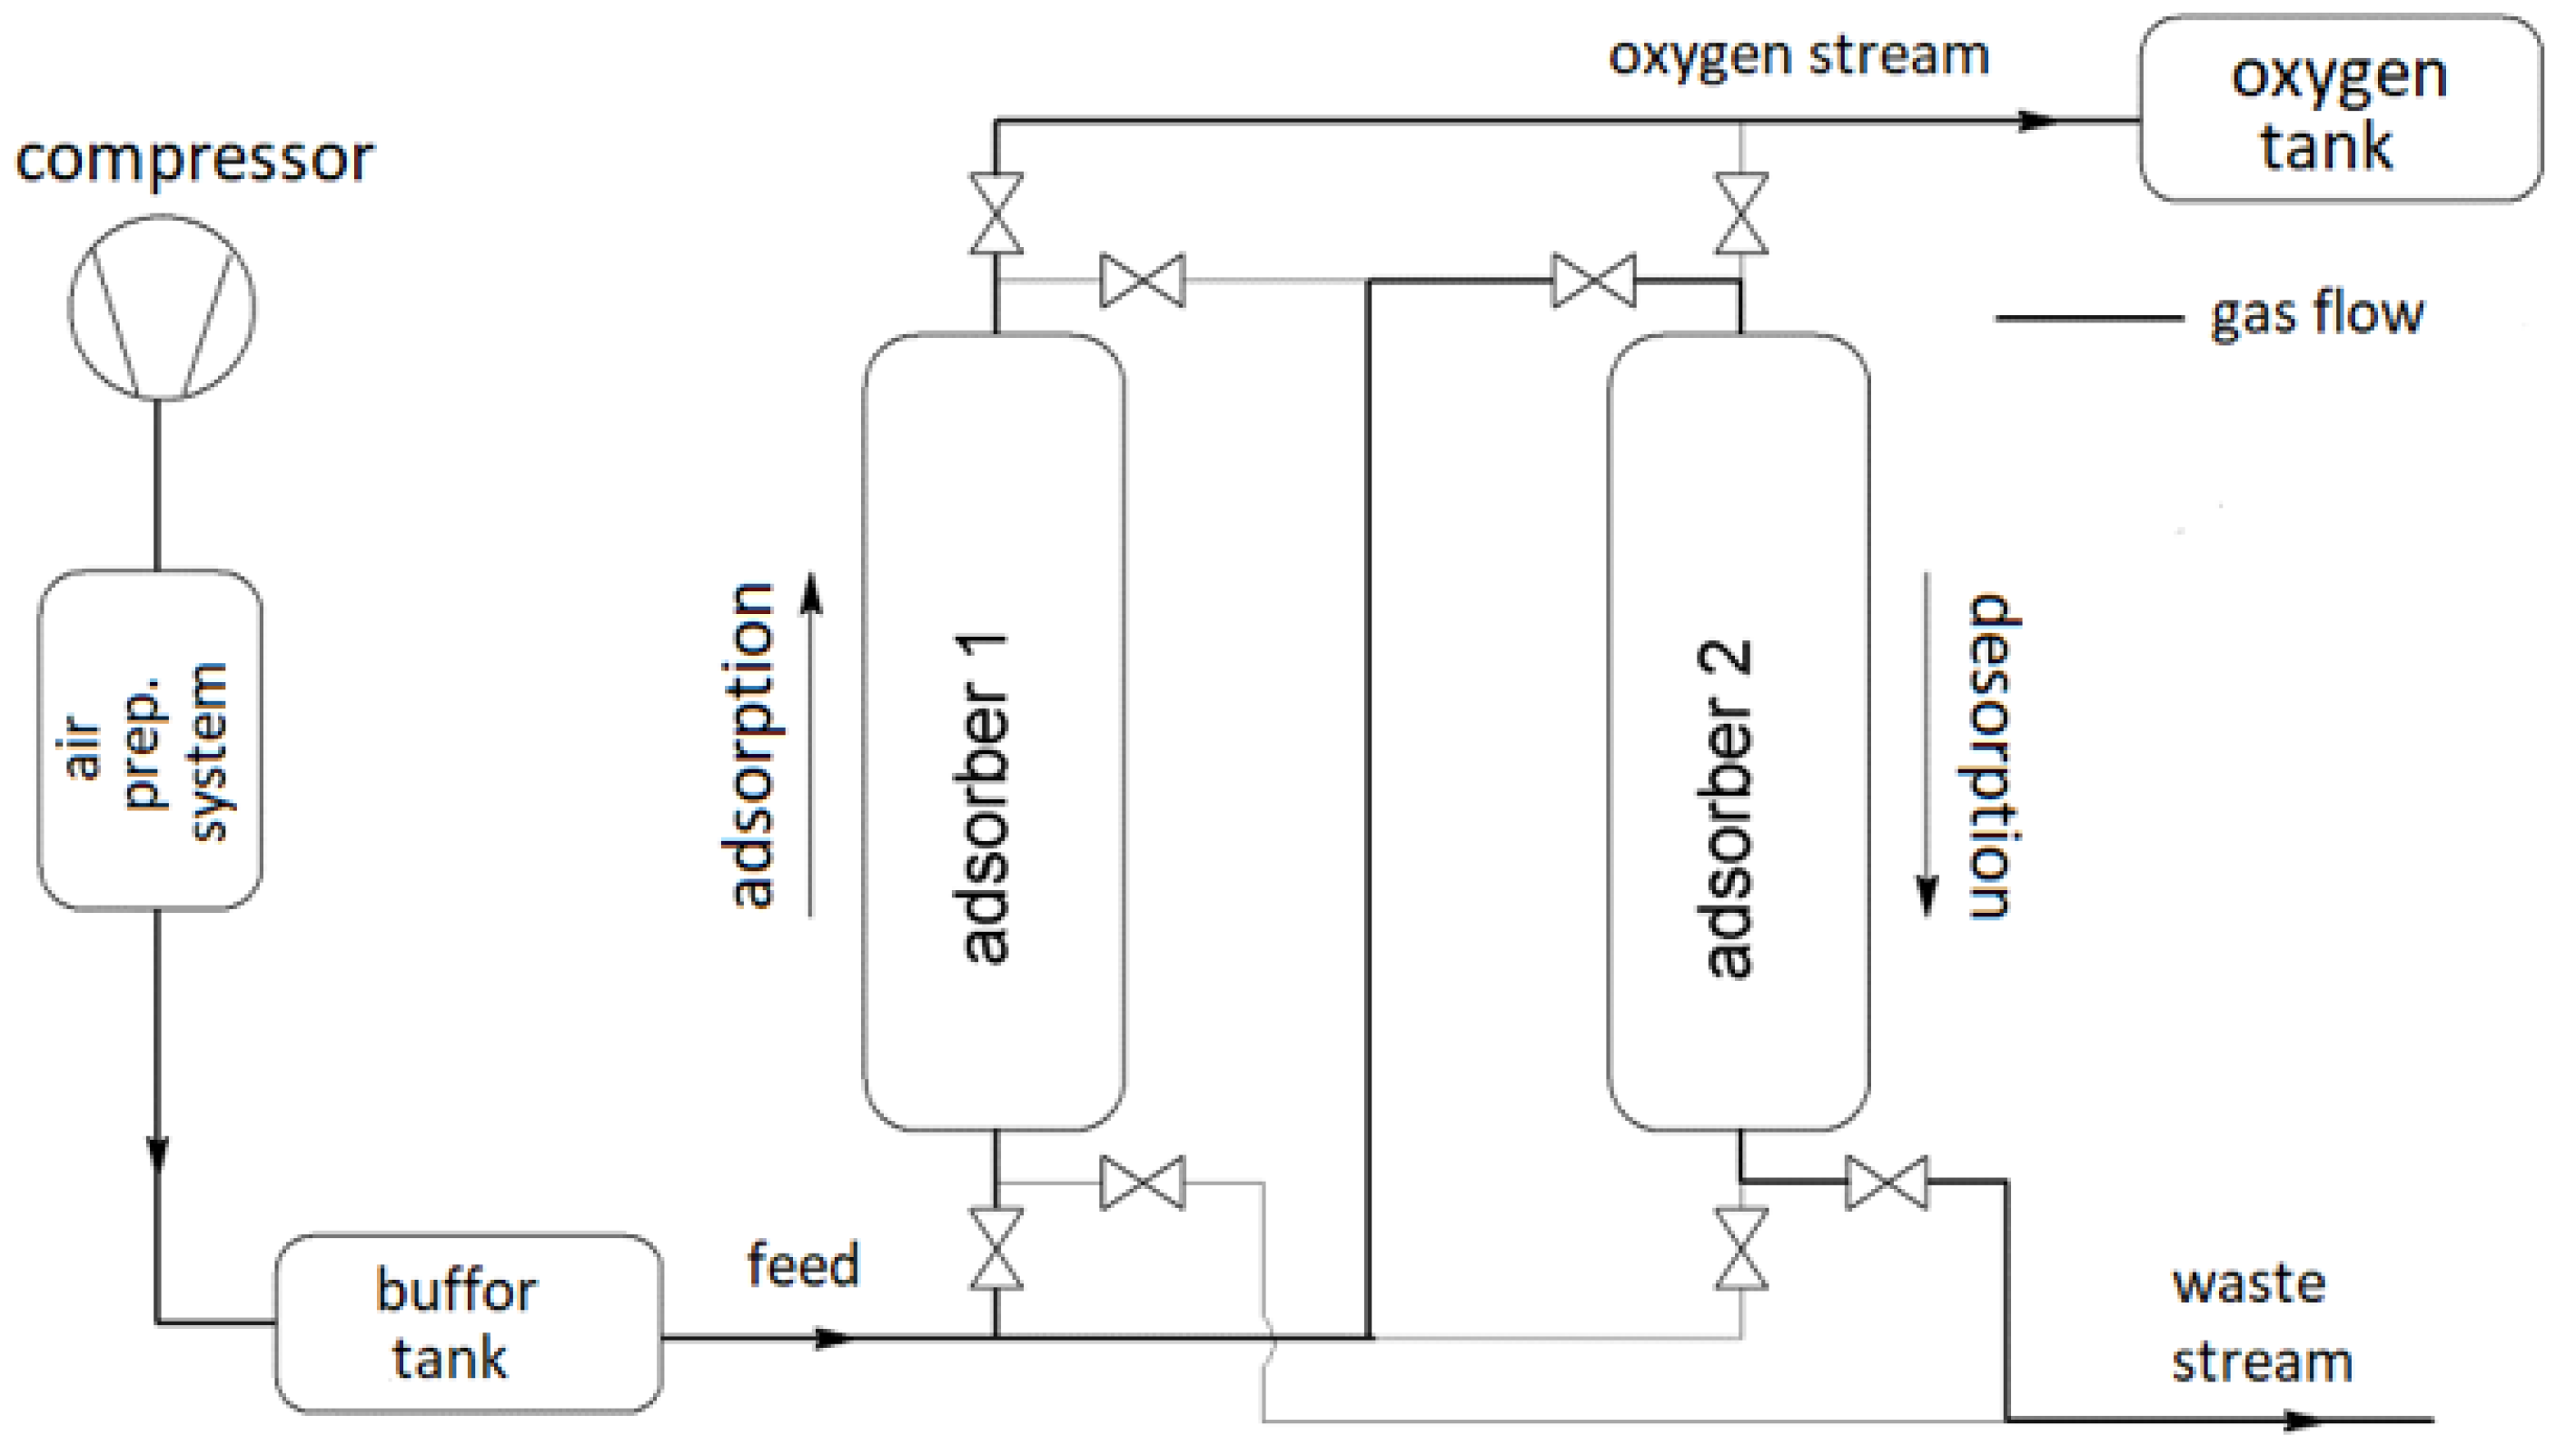
21]. This paper focuses on the most popular commercially available low-capacity oxygen generator PSA type using 5A zeolite. The schematic diagram of the generator is shown in
Figure 1.
The main part of the oxygen separation system is a pair of adsorbers. In each of them there occurs a phase-shifted pressure cycle. Changes in gas pressure cause changes in the capacity of the adsorption bed. At a given moment, the process of adsorption takes place only in one of the adsorbers. In the second adsorber takes place the regeneration of the bed (desorption).
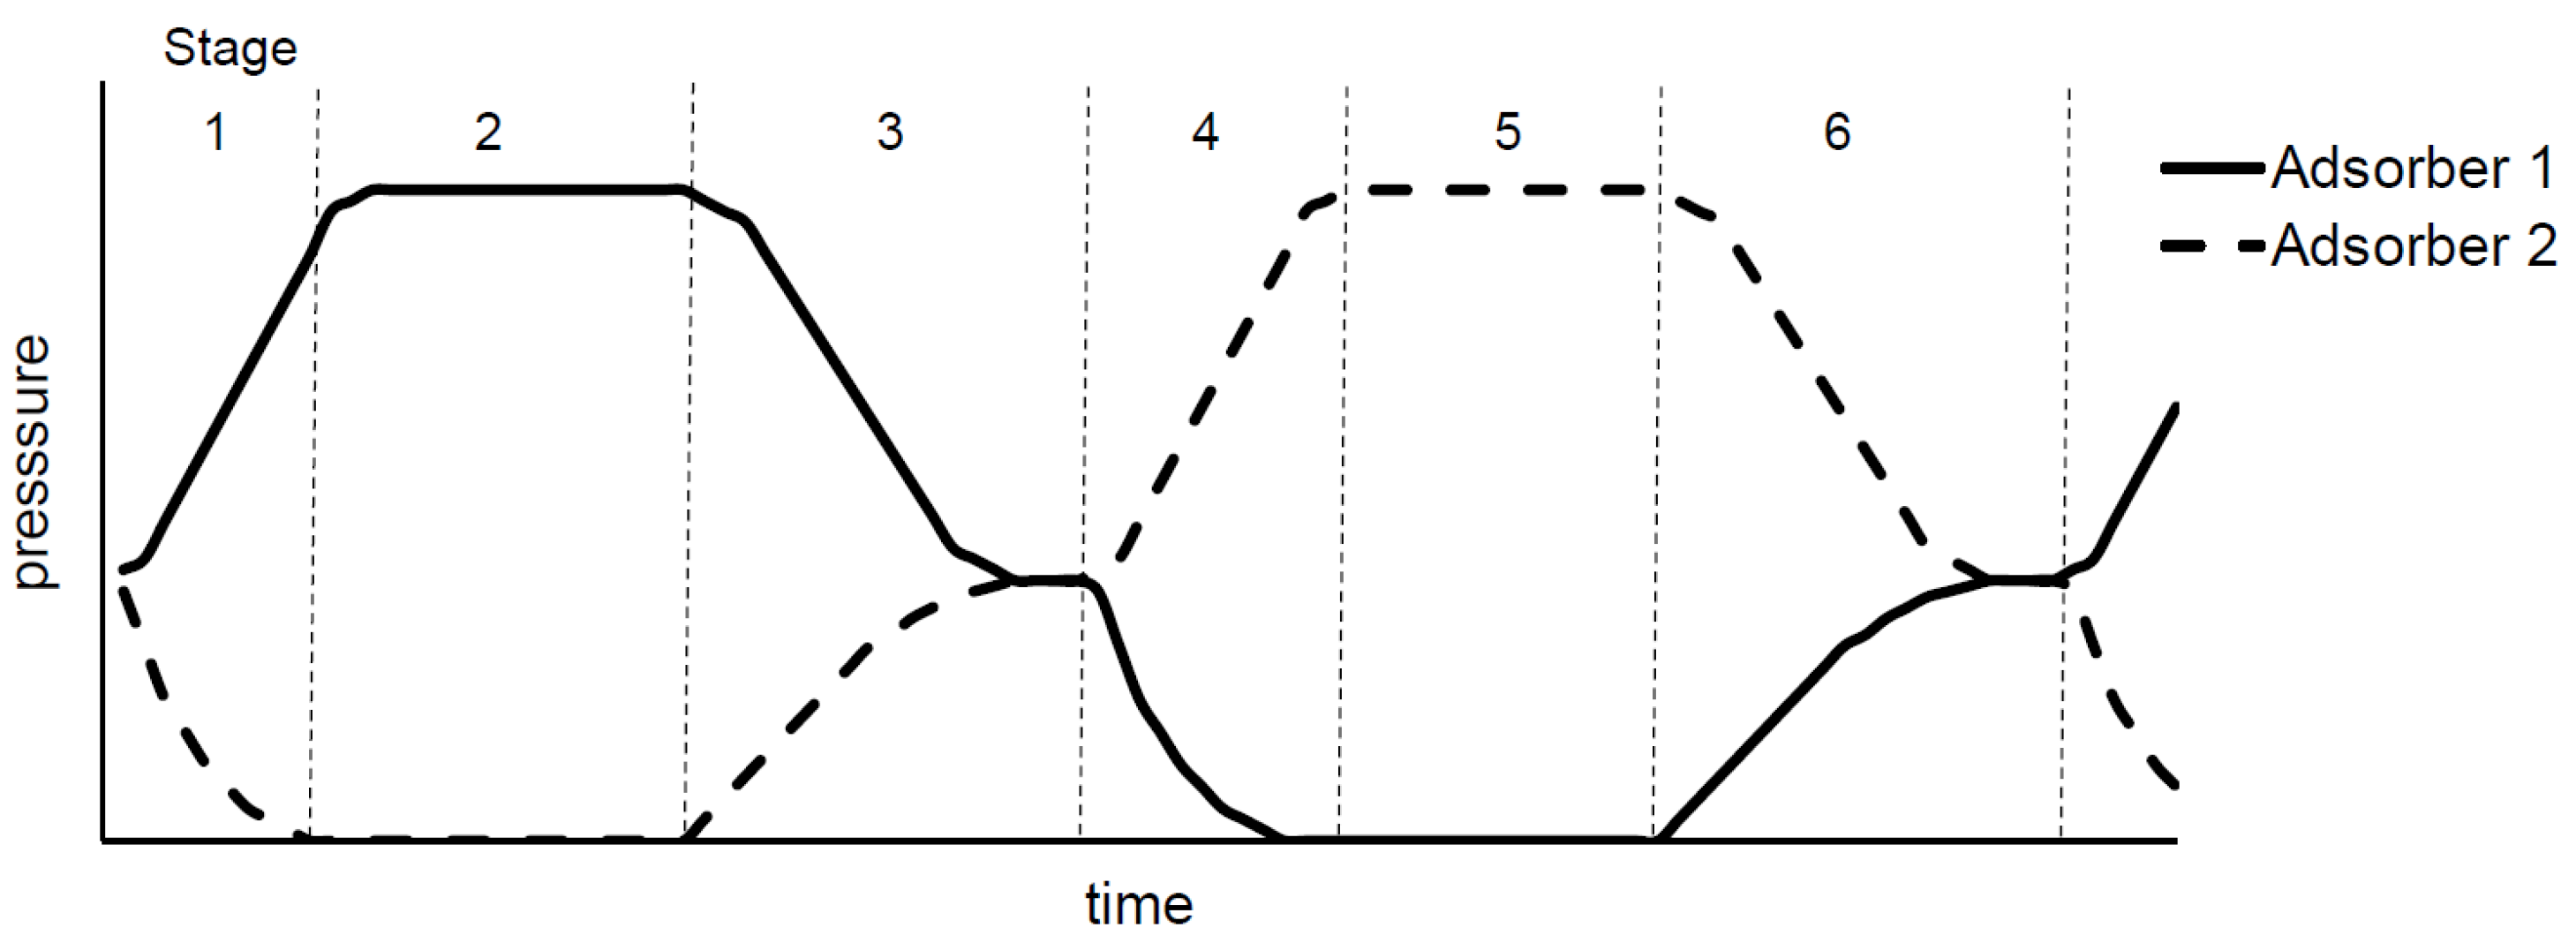
To optimize the operation of the oxygen generator, the adsorption cycle was mapped into individual stages of pressure changes inside the adsorption tanks. The cycle of pressure changes is shown in
Figure 2.
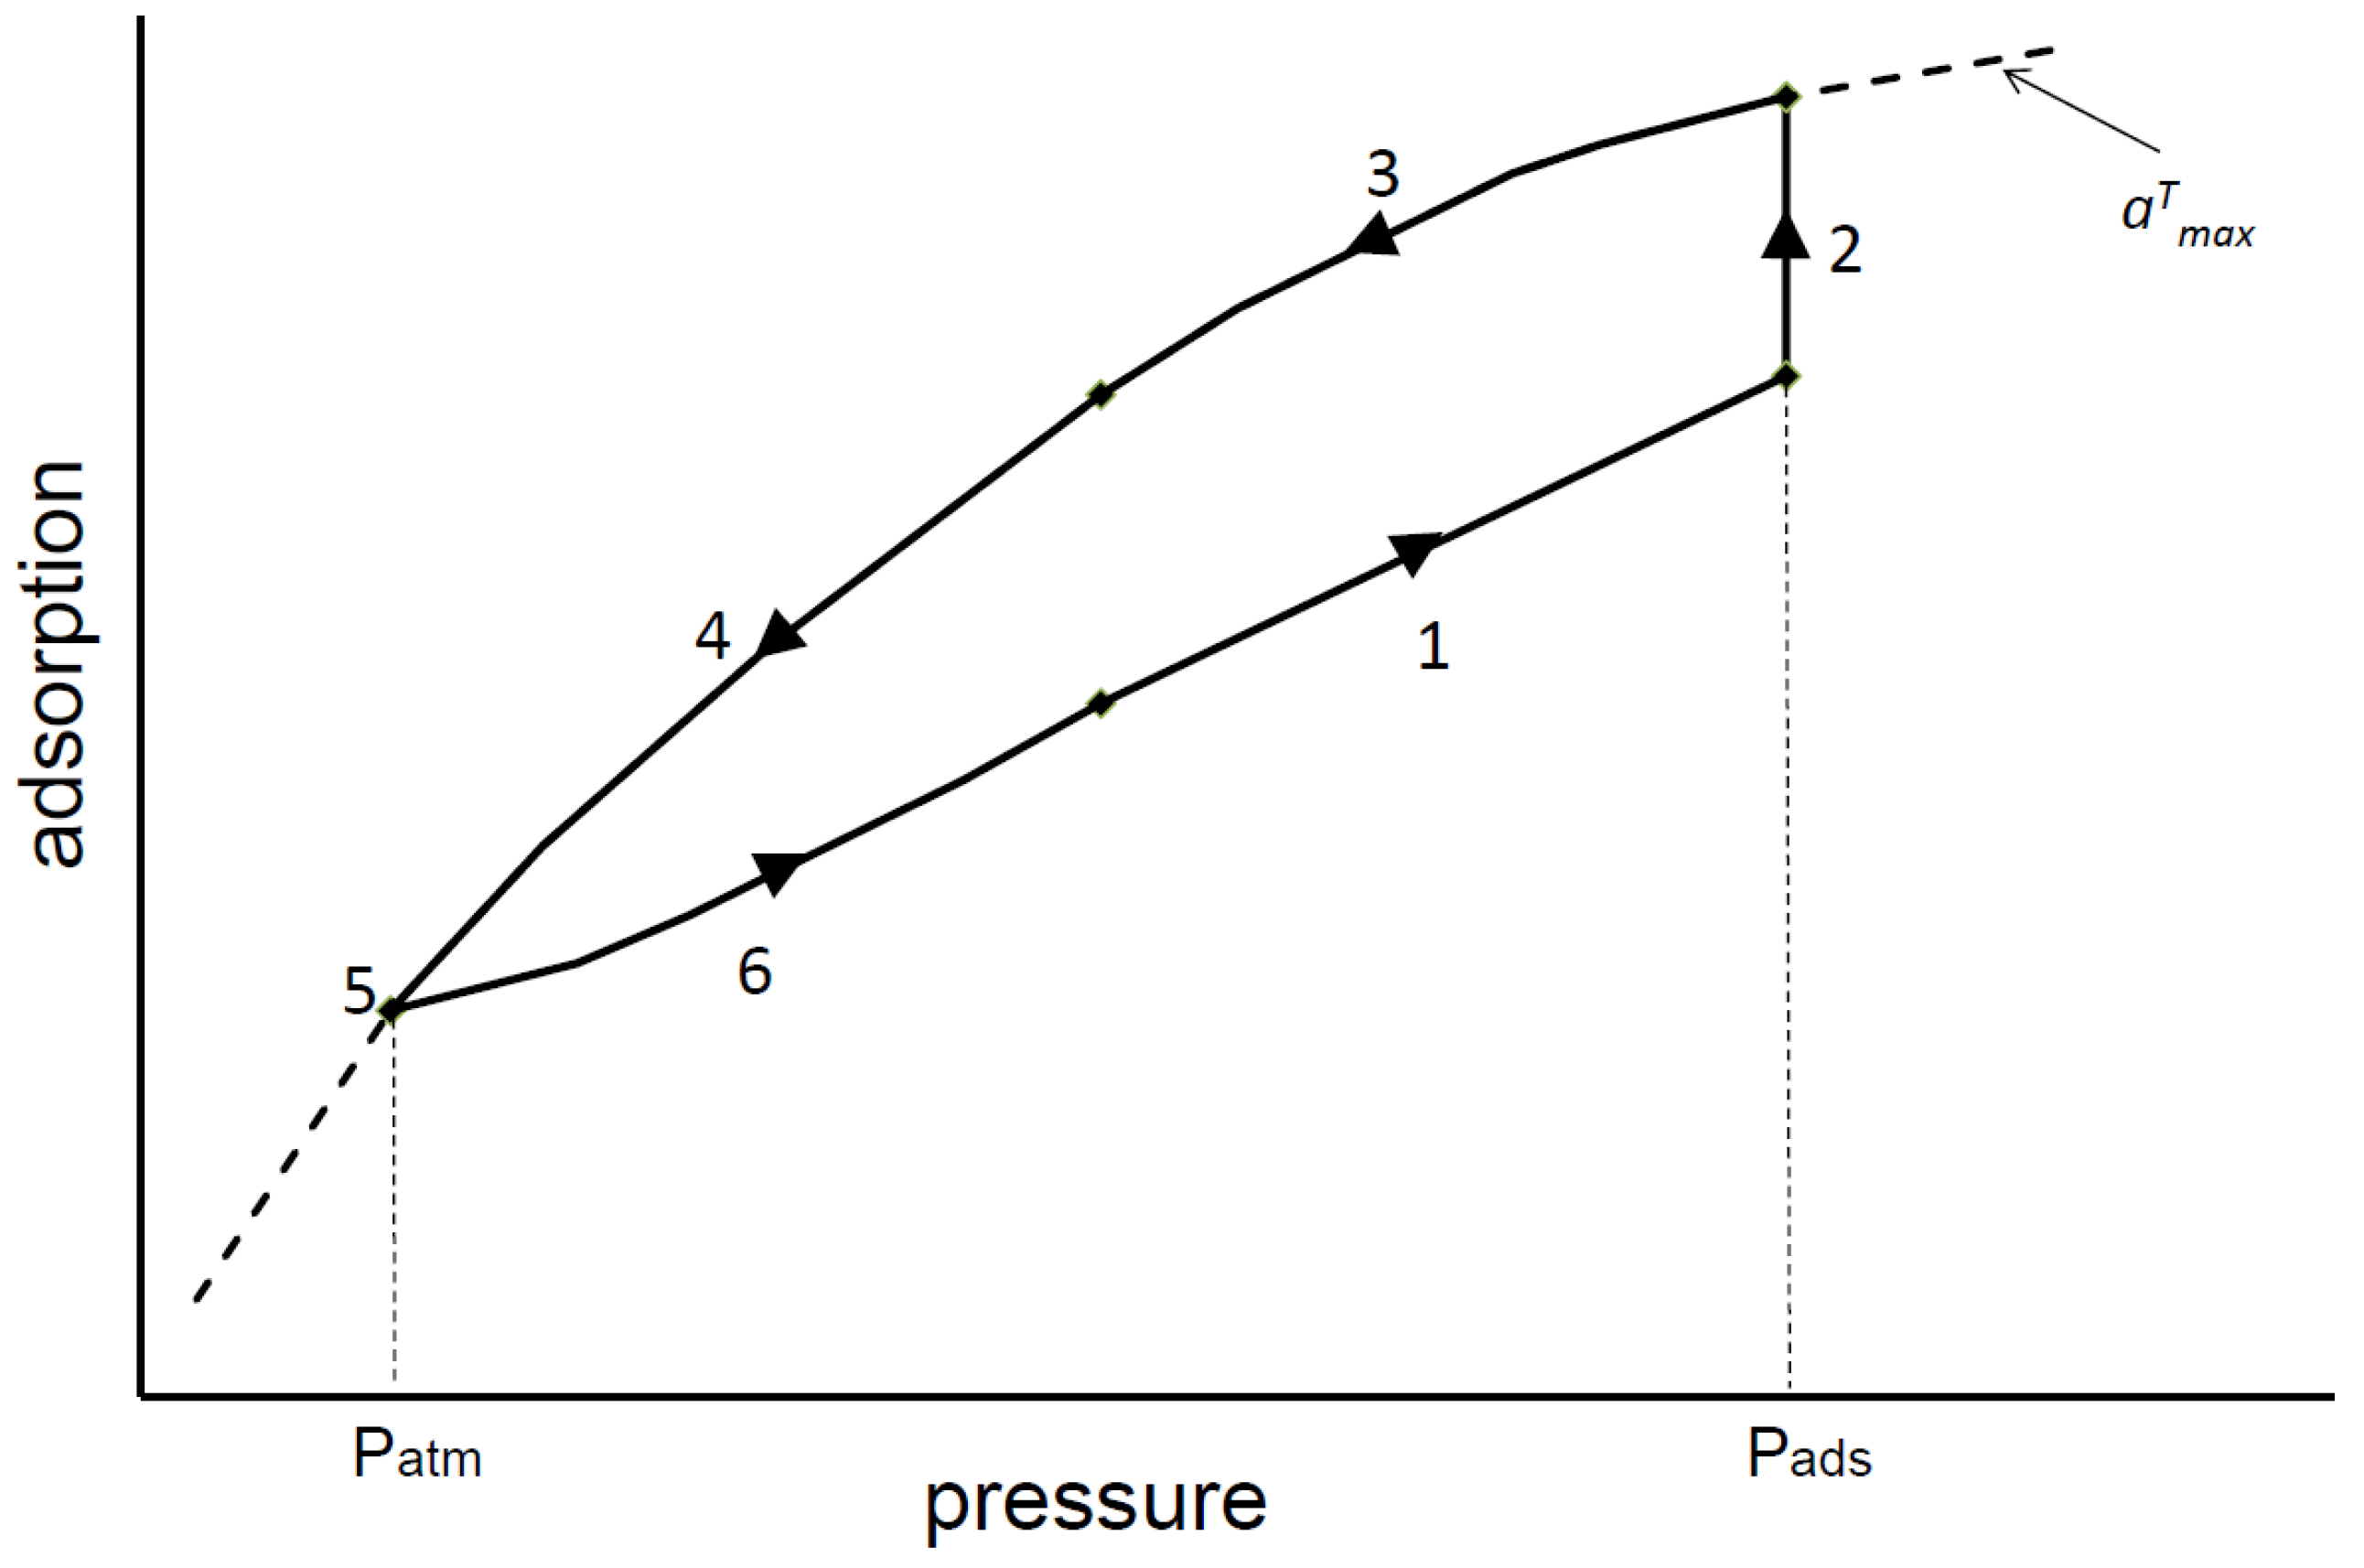
The cycle of pressure and adsorbency changes of the bed concerning a single adsorption vessel is shown in
Figure 3.
Figure 3 shows that an appropriate process recipe, taking into account the process conditions (pressure and temperature) and the time of individual stages, has a key impact on both the purity of the separated oxygen and the energy consumption. Step 2 (see
Figure 3) is the stage in which the oxygen is transferred from the adsorber to the oxygen tank. The time in which stage 2 is driven is called the transfer time. Too long transfer time causes too much nitrogen to be supplied with the air stream, which exceeds the maximum degree of adsorption (line
in
Figure 3). That causes the oxygen purity to drop. If the transfer time is too short, the adsorbent capacity is not used to the maximum. It lowers the stream of separated oxygen, and thus increases the energy consumption of the process per unit mass of oxygen. That makes the optimization of step 2 critical for minimizing energy consumption while maintaining a high purity of the separated oxygen. This is especially true as the optimal transfer time changes with the pressure according to the shape of the adsorption isotherm. For the low adsorption pressure, the slope of the adsorption isotherm is high. The result is the increase in the optimal transfer time with adsorption pressure. The bed capacity increase slows down for higher pressures, and the optimal transfer time remains constant [
22].
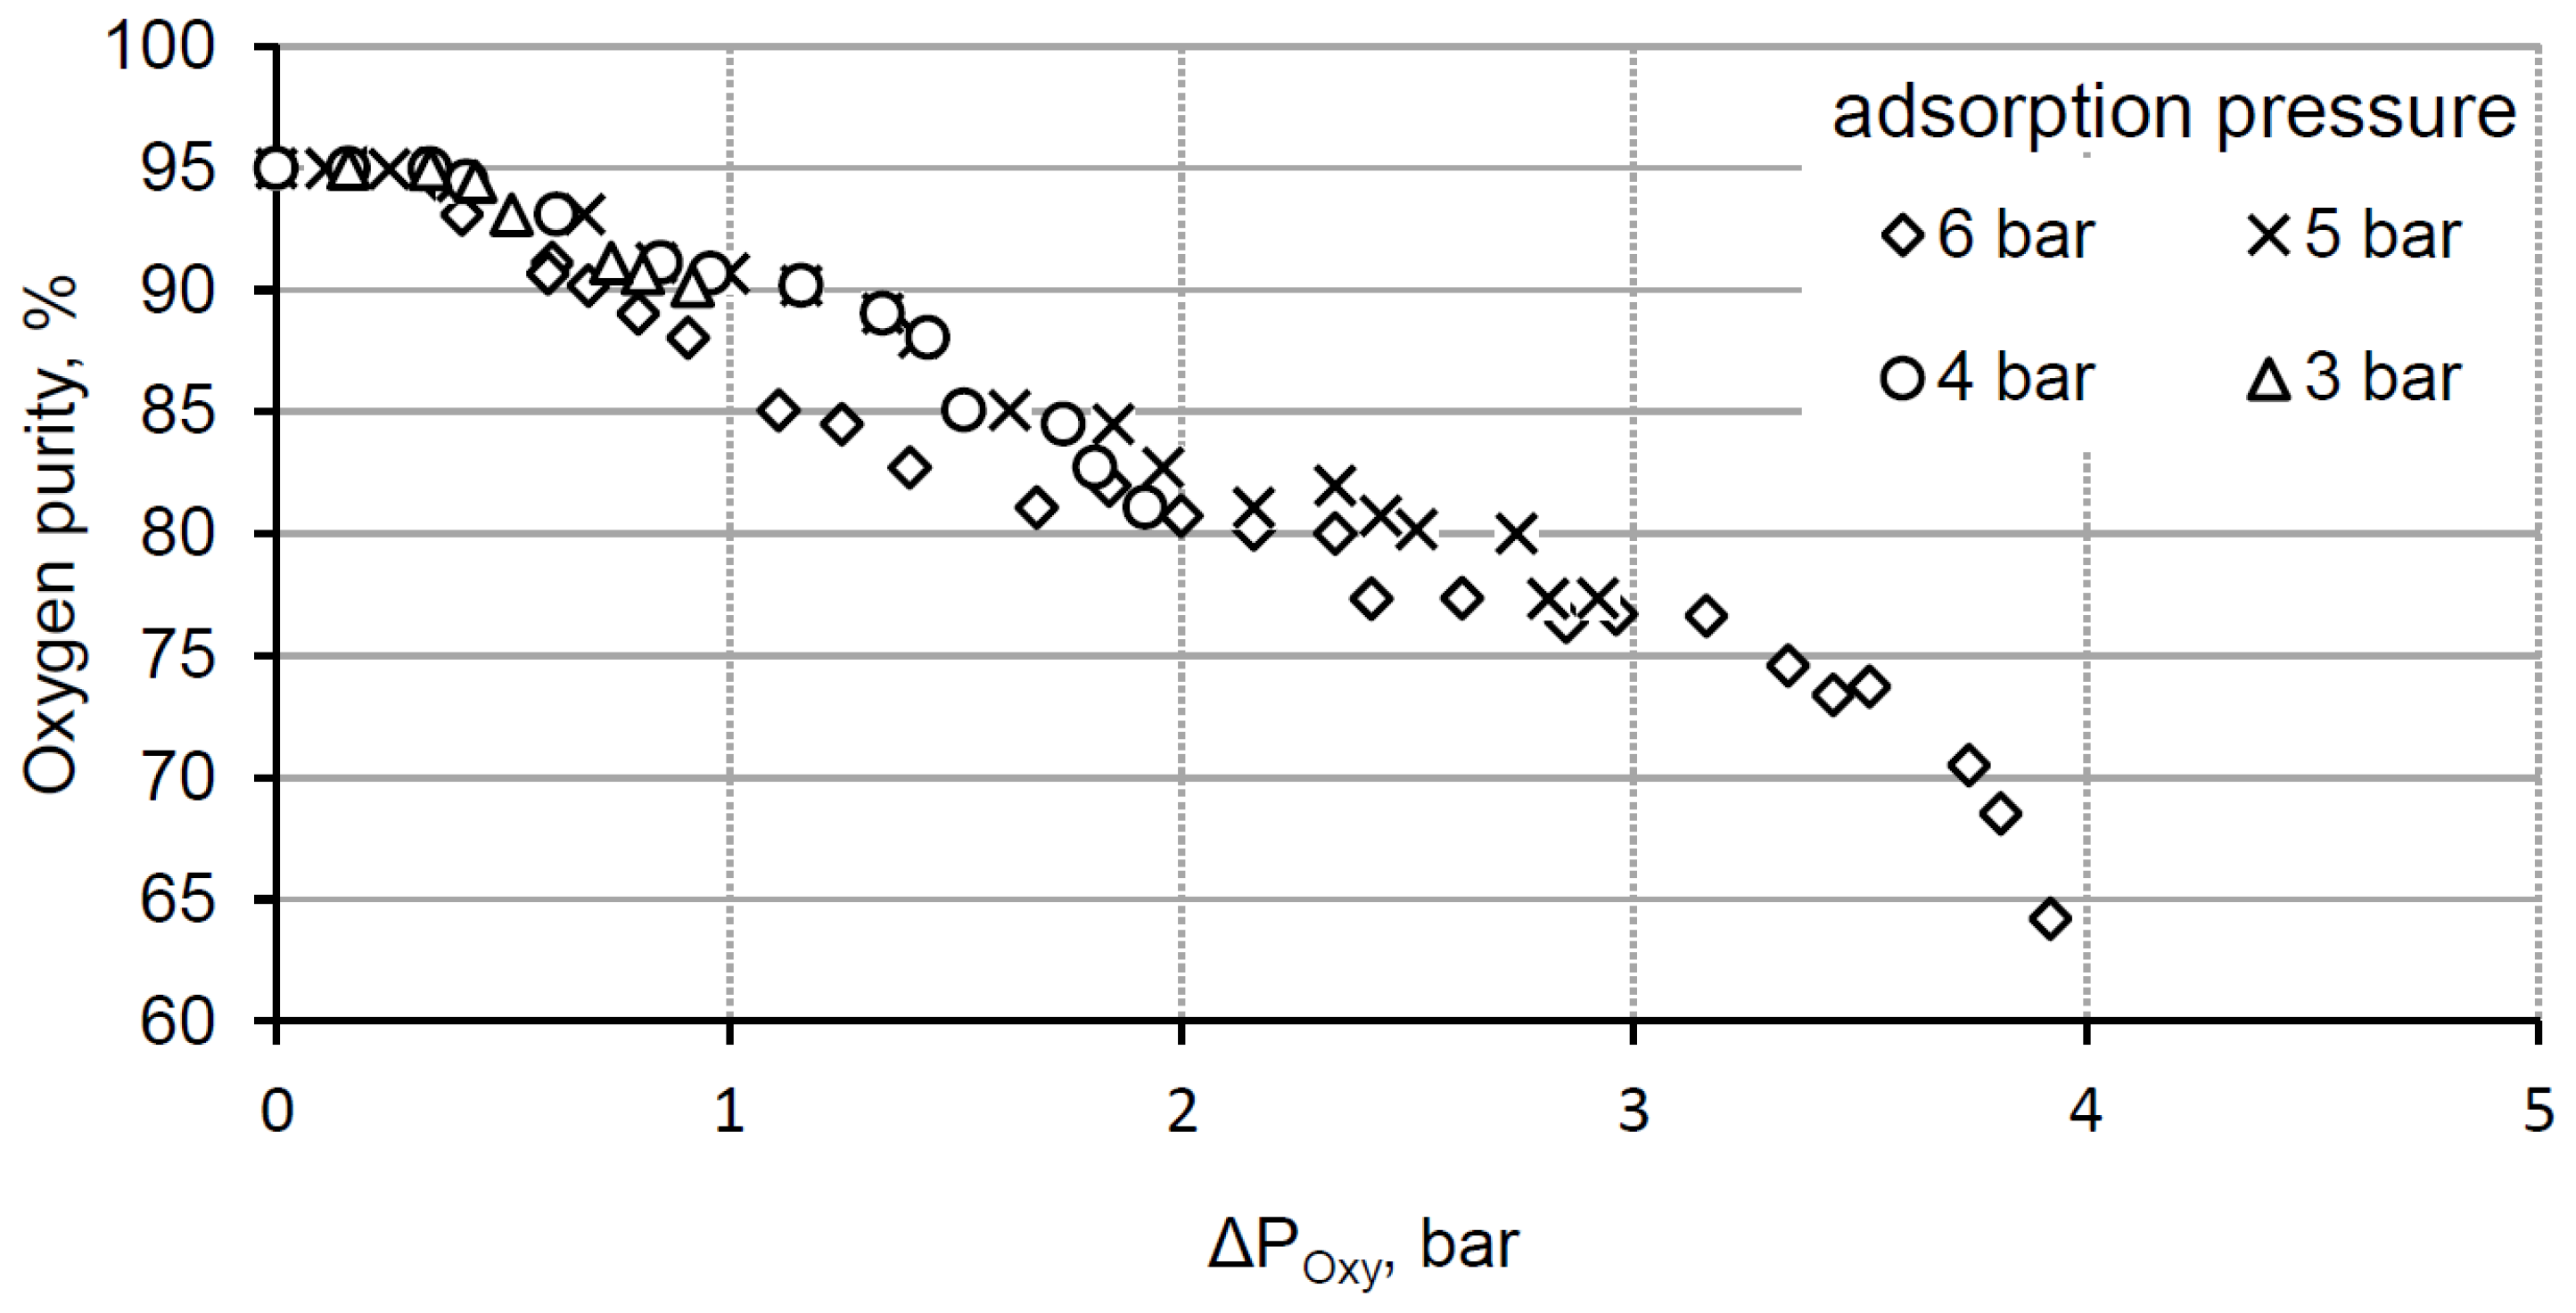
Additionally, while analyzing the generator diagram (
Figure 1), the authors noticed that the pressure difference between the pressure in the oxygen tank (
) and the adsorption pressure (
) may influence the purity of the separated oxygen. The difference of these pressures is denoted as
. In the particular case where
is high enough, the authors suspect that the air may flow too rapidly through the adsorber, resulting in short residence time in the adsorber. Additionally, by the law of volume stream continuity, the increased gas flow velocity through the porous bed may cause a local pressure reduction (injector effect), which may reduce the local adsorbent adsorption capacity.
3. Methods
3.1. The Experimental Set-Up
The test stand was built using a standard, commercially available low-capacity PSA oxygen generator. It consists of an air compressor, air dehumidifier and filters, air tank, oxygen generator, and oxygen tank. The schematic diagram of the stand is shown in
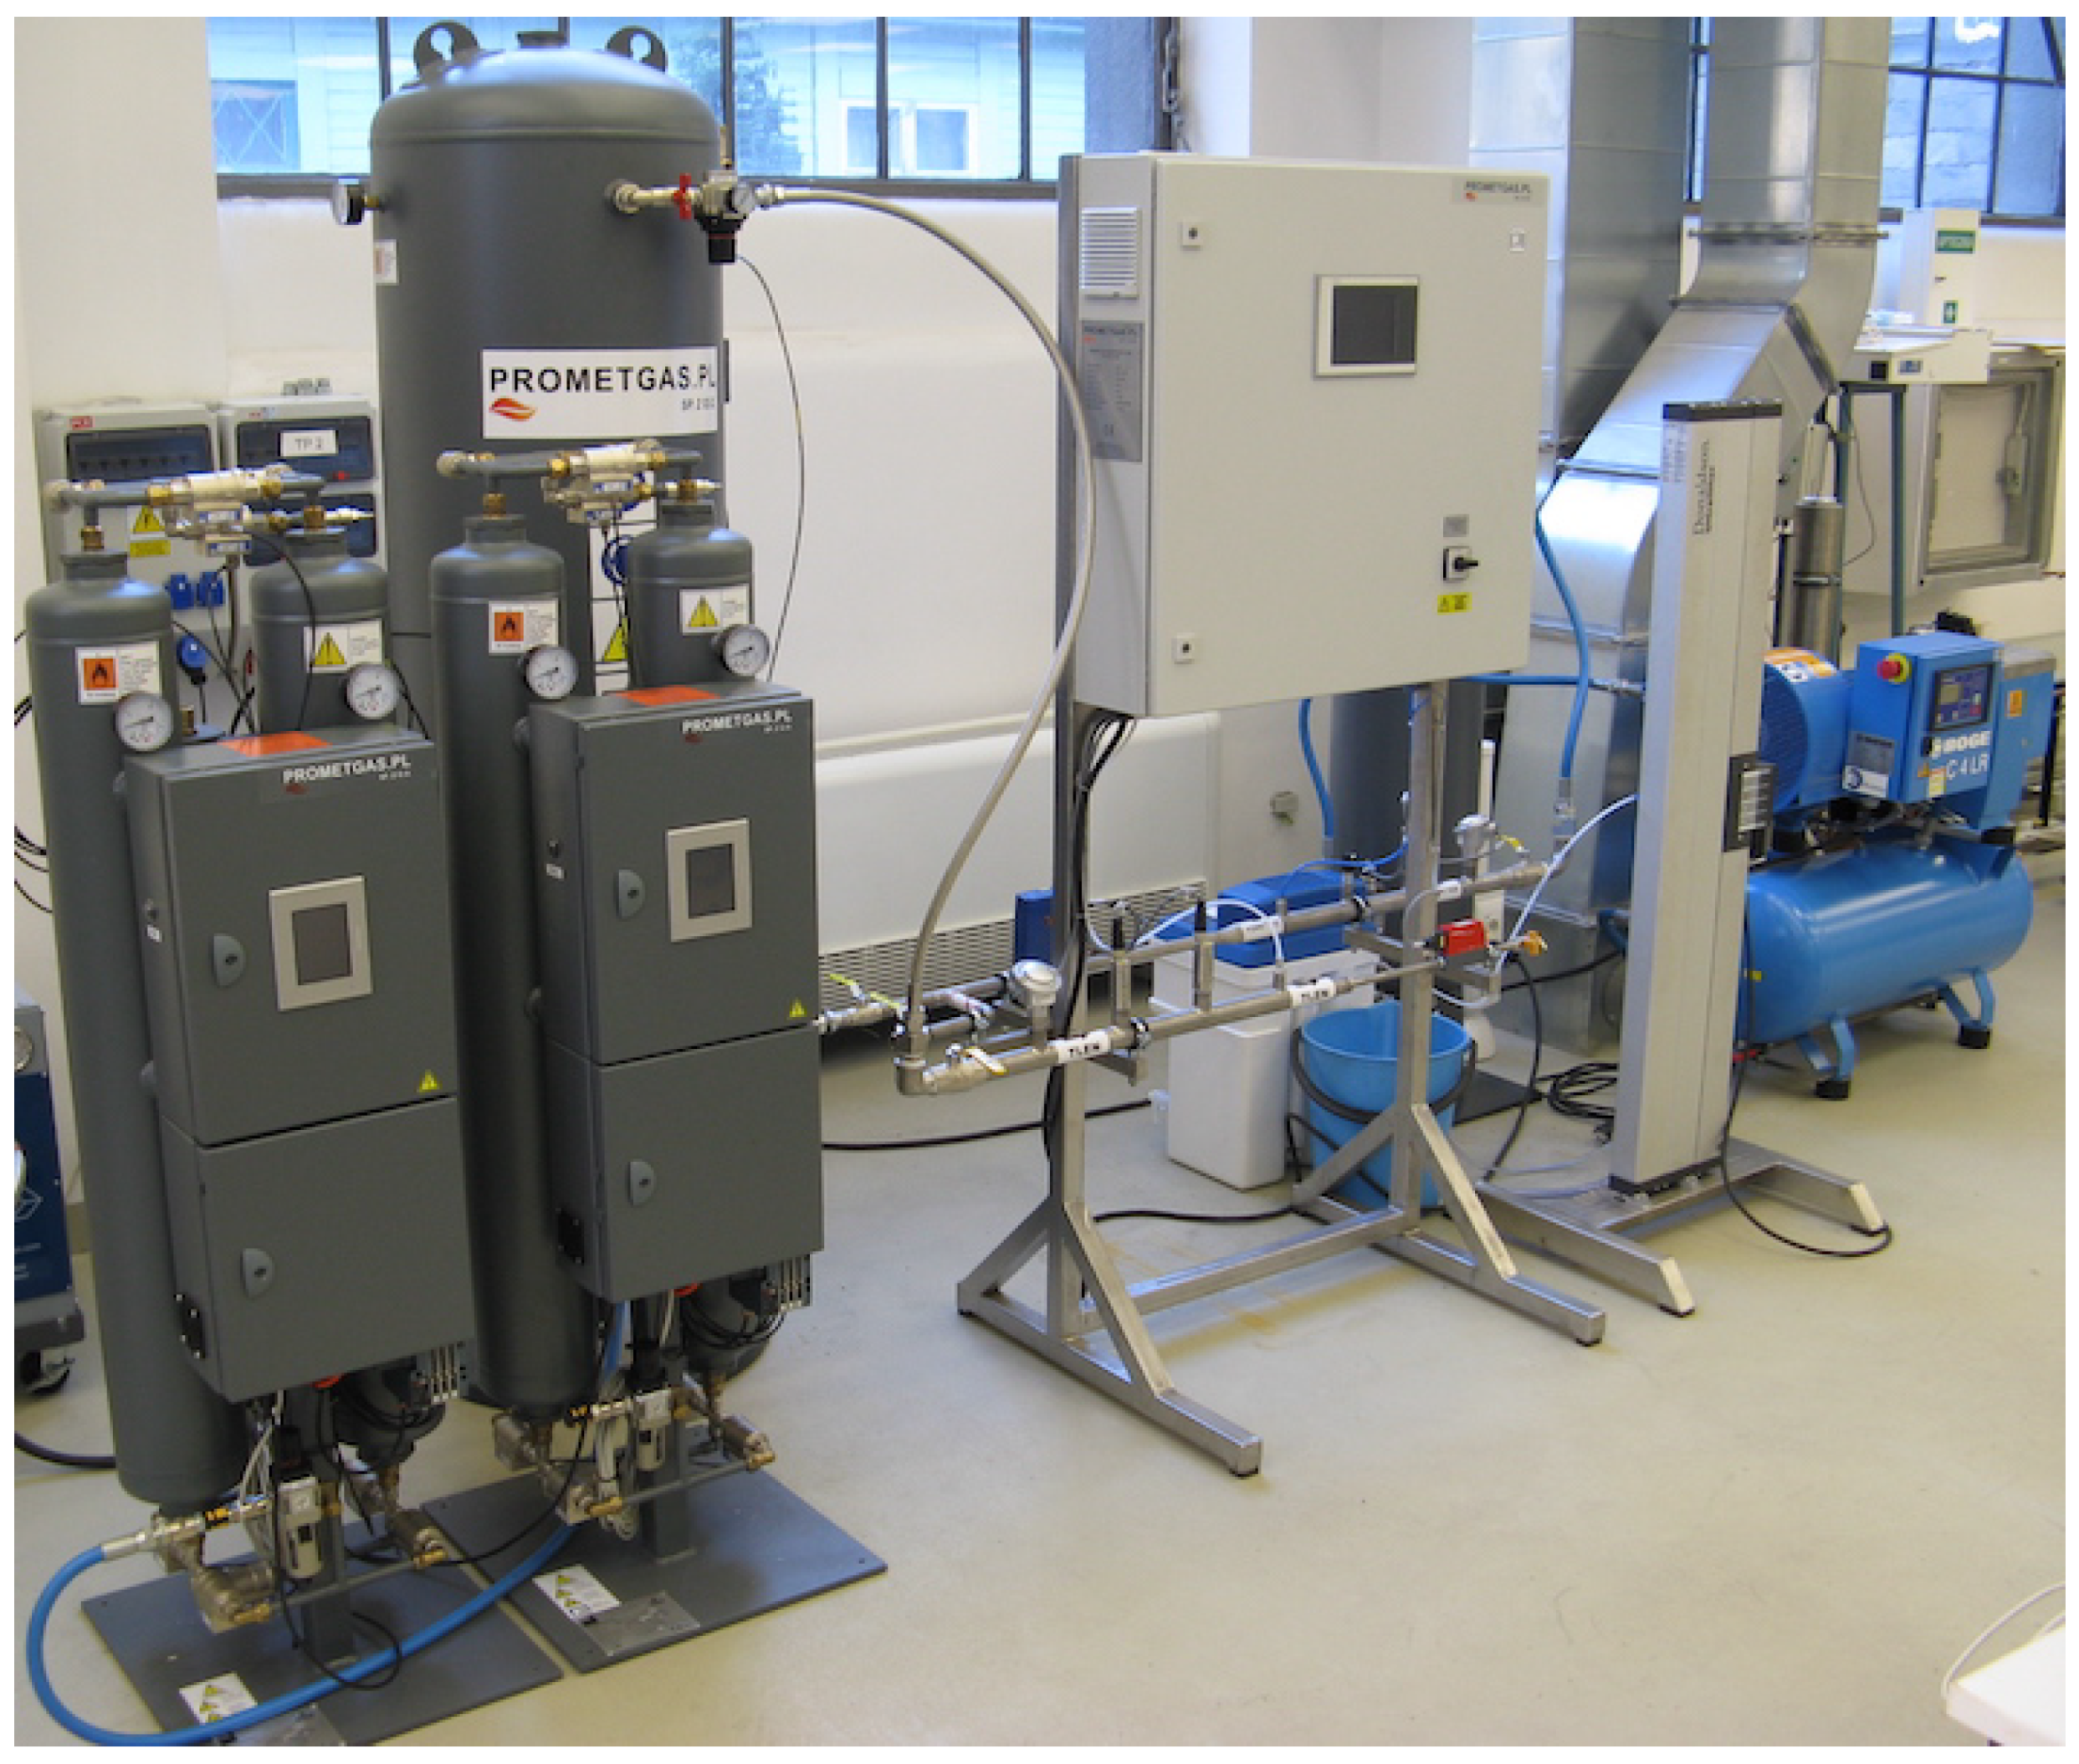
Figure 1. The view of the PSA oxygen generator is presented in
Figure 4.
The air is compressed using the compressor with a capacity of . After it has been filtered and dried, it is sent to the buffer tank, from where it goes to the oxygen generator. The oxygen generator consists of two adsorption tanks and the control system. The adsorption tanks are filled with 5A zeolite. The nominal oxygen separation capacity, specified by the manufacturer, is . After the separation process, oxygen is collected in the oxygen tank.
The generator is equipped with several sets of sensors monitoring the process. One set of sensors monitors the temperature and relative humidity of the air inflowing the generator. The second set tracks the pressure inside the generator. The third set of sensors reads the purity, the temperature, and the pressure of oxygen received from the generator. The test stand was supplemented with the measurement of the acquired oxygen stream capacity and the measurement of the supplied electricity. The oxygen flux was measured with a flowmeter with an accuracy class of . For the measured capacities, this corresponds to a maximum calibration uncertainty of . Electric energy consumption was measured with an energy meter with an accuracy class of 2%.
3.2. A Method of Optimizing Energy Consumption
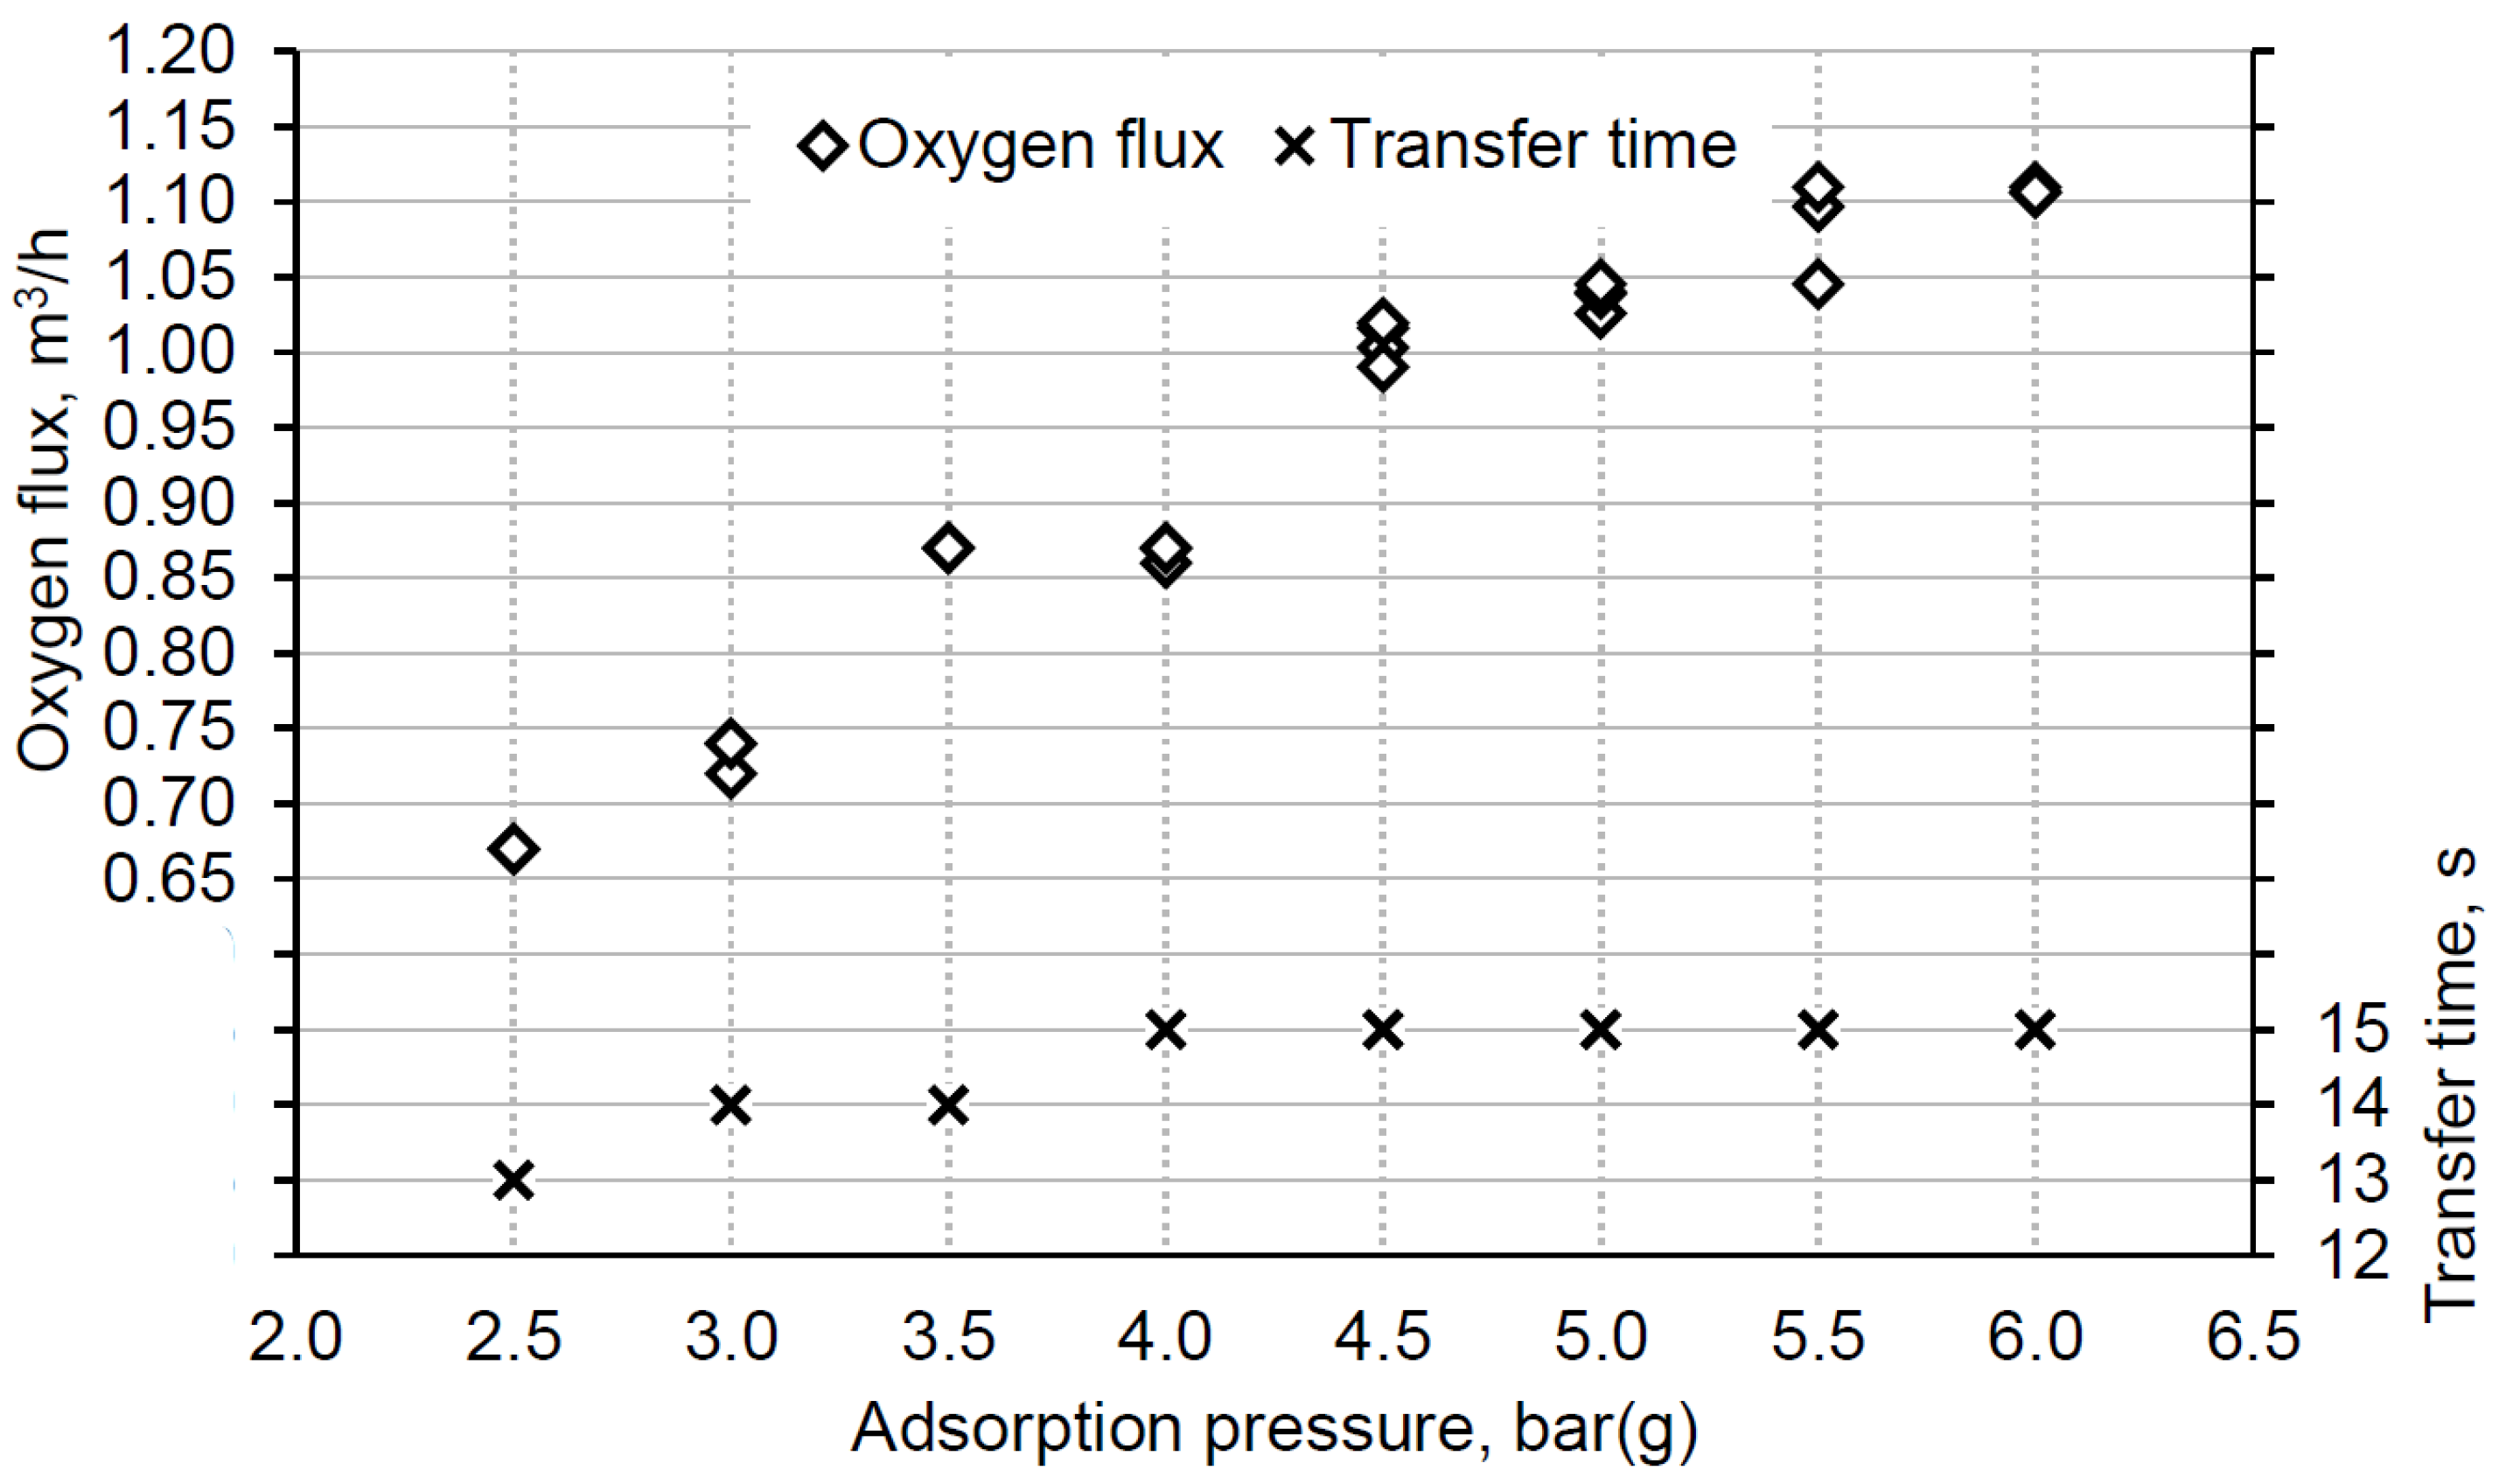
At a constant temperature, the nitrogen adsorption capacity depends on the adsorption pressure. The higher the pressure, the greater the adsorption capacity. The capacity affects the time for which a given bed can adsorb nitrogen from a given air stream—transfer time. This is crucial, because only during the nitrogen adsorption, the oxygen can be transferred into the oxygen tank. The total efficiency of oxygen separation depends on the ratio of this transfer time to the time of the entire generator operation cycle. Too short a transfer time reduces the stream of separated oxygen, but too long causes a decrease in oxygen purity. The transfer time should be carefully selected to take full advantage of the adsorption capacity at a given pressure. During the experiment, the optimal transfer time, depending on the process pressure, was determined experimentally.
The second factor influencing the energy consumption of oxygen separation in the installation is the minimization of energy losses related to the operation of auxiliary devices as well as measuring and control equipment. This is especially important in the case of low-capacity devices. To reduce these losses, the device should operate with maximum yield, which does not deteriorate the purity of the separated oxygen.
During the research, it was found that the purity of oxygen obtained during the adsorption process is very sensitive to the difference between the adsorption pressure and the pressure in the oxygen tank. The correlation between these two pressures has not been discussed in the literature, so it was decided to investigate it more closely. The authors found experimentally that too large a difference between the operating pressure of the adsorption bed and the product pressure in the oxygen tank causes the effect of excessive purging and a decrease in the purity of the separated oxygen (see
Section 4.2).
3.3. The Optimization Stages
In the first stage (
Section 4.1), reference measurements of the energy consumption of the oxygen separation process were performed. The measurements were made at the oxygen generator factory settings. The measurements aimed to determine the average energy consumption of oxygen separation in a standard low-capacity PSA generator. The determined energy consumption served as a reference point for optimizing the generator’s operation.
In the second stage (
Section 4.2), the dependence of the separated oxygen purity on the difference between the adsorption pressure and the pressure in the oxygen tank was tested. To obtain this relationship, the adsorption pressure was set constant. Next, the outflow from the oxygen tank was controlled to achieve the desired pressure difference between the adsorption pressure and the pressure in the oxygen tank. After establishing the conditions, the purity of the separated oxygen was read.
In the third stage (
Section 4.3), the transfer time and the optimal oxygen separation capacity for different adsorption pressures were determined. The transfer time should be selected to take full advantage of the adsorption capacity at a given pressure. The second factor is the need to adjust the volume flow of oxygen received from the generator. It should ensure continuous and uninterrupted operation of the installation, but without excessively reduced oxygen pressure in the tank downstream of the generator (determined in stage two). During the measurements, the required operating pressure was set, and the purity of the separated oxygen was observed for different transfer times. The goal was to find the maximum transfer time with an oxygen purity of 95%. The measurements were carried out for adsorption pressures ranging from 2.5 to 6.0 bar(g) in 0.5 bar increments. The optimal oxygen flux for a given adsorption pressure was determined such that the pressure difference between the product reservoir and the adsorption bed did not drop below the value specified in the second stage.
In the fourth stage (
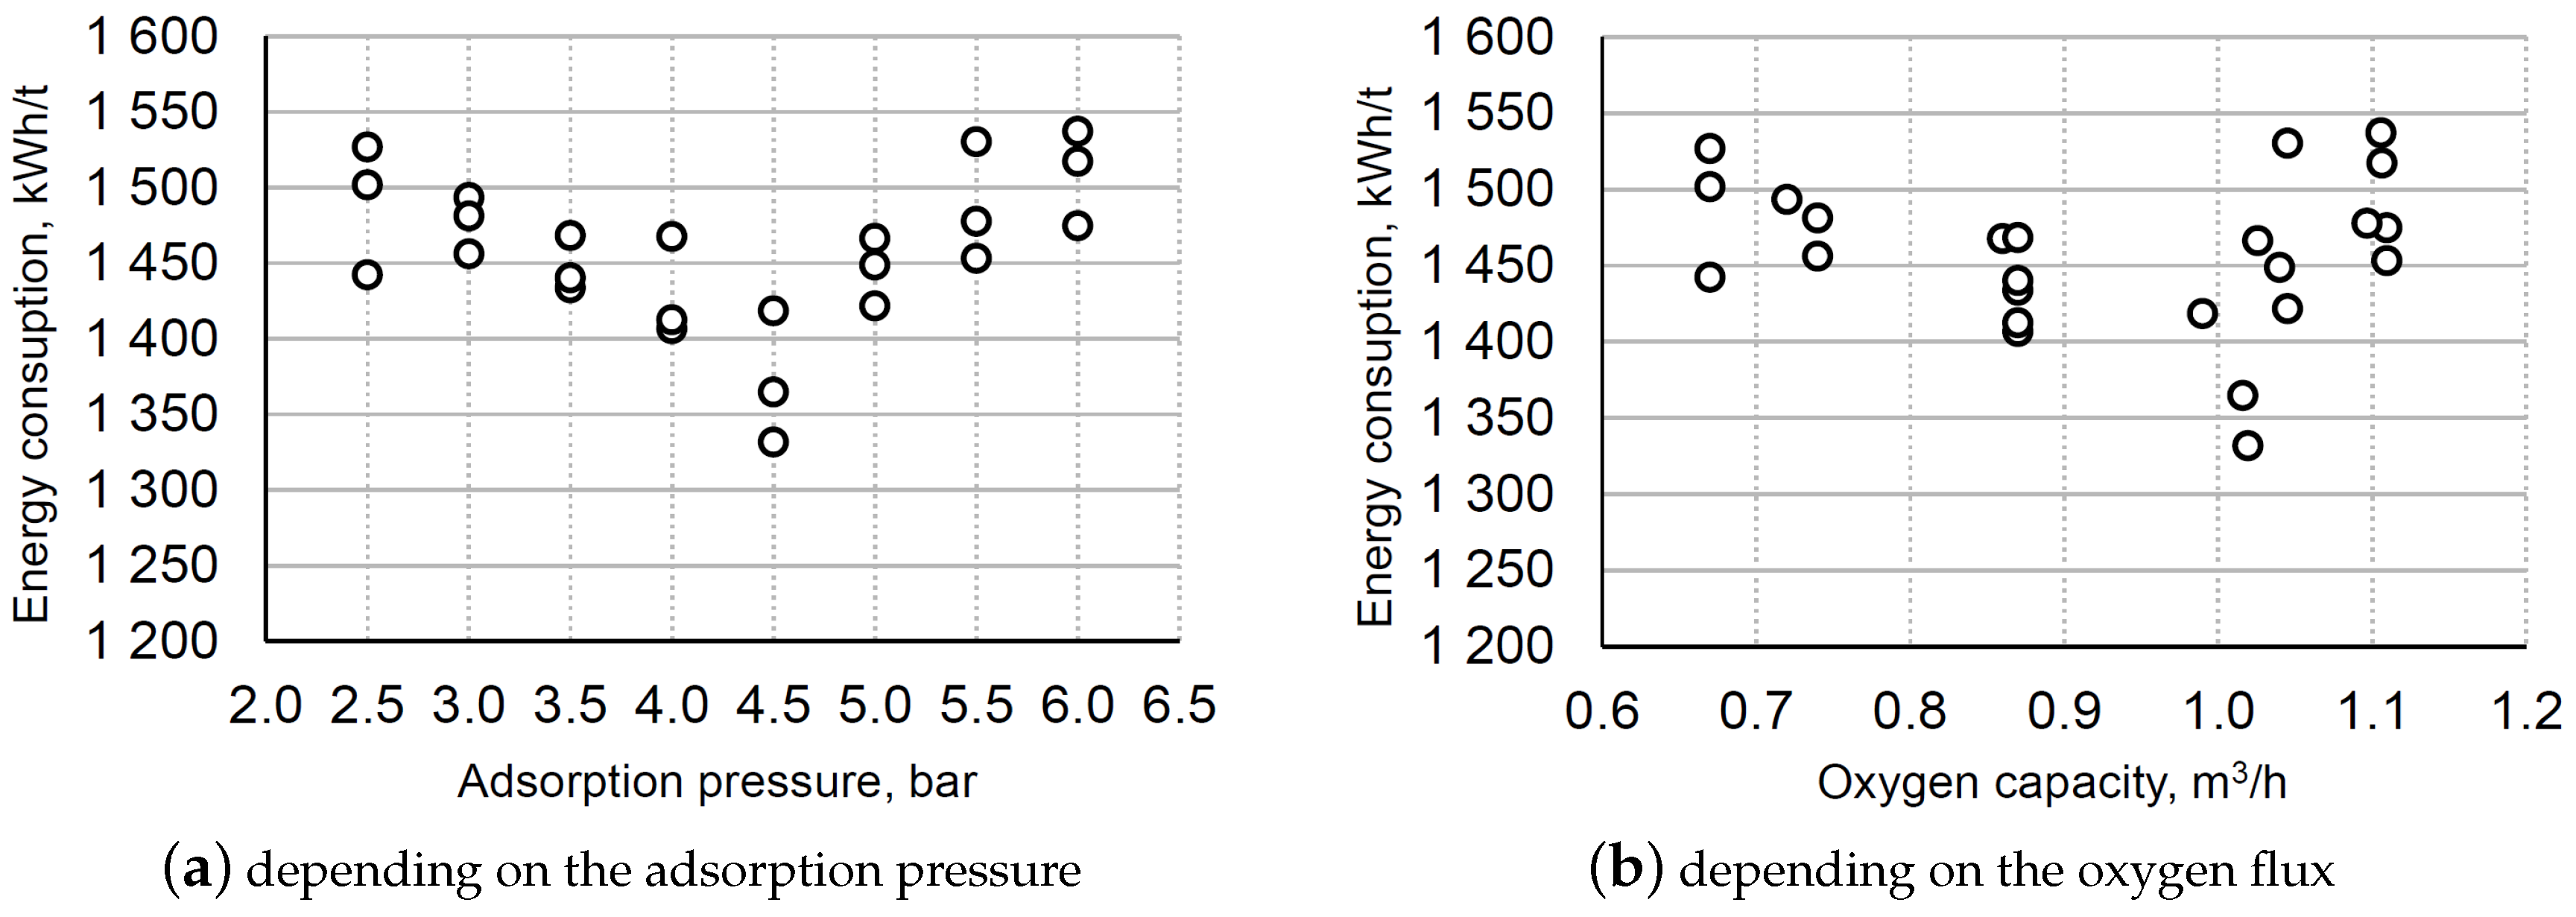
Section 4.4), the energy consumption of oxygen separation was measured at optimal generator settings. These settings were made as a result of the second and third steps. These measurements were performed in the adsorption pressure range from 2.5 to 6.0 bar(g), in 0.5 bar steps. After the oxygen generator was started, and the required pressure and oxygen purity in the tank were achieved, the appropriate oxygen stream from the tank was set, and the electricity meter readings were measured. After completing the measurement, the final reading of the electricity meter was made. The amount of separated oxygen was calculated based on the measured flow rate and the measurement time. These measurements were aimed at determining the energy consumption of the oxygen separation process with optimal generator settings.
5. Conclusions
The article presents a method of optimizing the performance of the oxygen generator using PSA technology. It was experimentally found that the low-capacity adsorption oxygen generators currently offered for sale are not optimized in terms of energy consumption or efficiency. The measured energy consumption of a small oxygen generator at factory settings was, on average, 2490 kWh/t with an oxygen separation capacity of 0.6 .
The proposed optimization consisted of changing the recipe for conducting the separation process. Two key conditions for the optimal separation process have been shown. Firstly, it is necessary to maintain an appropriate pressure difference between the adsorption pressure and the pressure inside the oxygen tank. For the maximum oxygen purity, this difference should not be larger than 0.5 bar. Secondly, to minimize the energy consumption of the oxygen separation process, the energy consumption of peripheral devices should be reduced in relation to the energy consumption associated with the separation itself. For this reason, adsorbers should always operate at maximum capacity for given pressure conditions. It means that an appropriate adsorption pressure should be selected for the required yield of the oxygen separation process.
Based on the presented analysis of the experimental results, it was found that it was possible to optimize the energy consumption of the low-capacity adsorptive oxygen generator. As a result of the applied optimization, energy consumption of an average value of 1460 kWh/t was obtained in a wide range of received oxygen stream from to . Compared to the reference measurements, the optimization effects the reduction in the energy consumption of oxygen separation is about 40% with a possible increase in the maximum oxygen capacity by about 80%. The limitation of this method is the changing pressure in the oxygen tank according to the changing generator capacity.


