Article

Time-Domain Nuclear Magnetic Resonance Determination of Wettability Alteration: Analysis for Low-Salinity Water

by
Bryan X. Medina-Rodriguez
1,
Teresa Reilly
1,
Heng Wang
2,*,
Erik Robert Smith
1,
Griselda Garcia-Olvera
3,†,
Vladimir Alvarado
1,* and
Saman Aryana
1
1
Chemical Engineering, University of Wyoming, Laramie, WY 82071, USA
2
Center for Economic Geology Research, University of Wyoming, Laramie, WY 82071, USA
3
Petroleum Engineering, University of Wyoming, Laramie, WY 82071, USA
*
Authors to whom correspondence should be addressed.
Now with PEMEX, Exploration and Production, Mexico City, Mexico.
Appl. Sci. 2020, 10(3), 1017; https://doi.org/10.3390/app10031017
Submission received: 30 November 2019 / Revised: 19 January 2020 / Accepted: 27 January 2020 / Published: 4 February 2020
(This article belongs to the Special Issue Applications of Low Field Magnetic Resonance)

Abstract

:

Featured Application

Analysis of T 2 -relaxation time distributions and diffusion coefficient over time provides a relatively easy method to infer wettability alteration in porous media.

Abstract

Wettability has been shown to influence oil recovery. This property has become central to low-salinity (LSW) and smart (SWF) water flooding recovery mechanisms research. The challenge lies in the fact that oil recovery results from the combined effects of solid-liquid and liquid-liquid interactions. This demands methods that allow an independent interpretation of wettability alteration contributions. The primary objective of this work is to assess changes in wettability through the application of Time-Domain Nuclear Magnetic Resonance (TD-NMR) T 2 distribution and diffusion coefficient, starting with a well-controlled porous system, that is, glass beads, and then a model rock (Berea), in the presence of one phase, either oil or brine exclusively. Subsequently, two-phase fluid saturation was tested. For the glass beads, dimethyldichlorosilane was used to induce a hydrophobic response, as confirmed by contact angle experiments on slides of the same material. Sodium sulfate was used for its known positive influence on oil recovery during LSW and SWF. In cases where alteration of surface properties was expected, a leftward shift of the average T 2 distribution curve modes, accompanied by a reduction on the diffusion coefficient during the aging process was observed. The results of this work confirm that fluid-solid interactions during LSW and SWF, namely a shift in wettability, take place after the injection of low-salinity water.

1. Introduction

Wettability is a rock-fluid interaction that has been shown to influence oil recovery. Craig [1] defined wettability as “the tendency of a fluid to spread on or adhere to a solid surface in the presence of other immiscible fluids.” This tendency results from the interaction between fluid molecules and solid surfaces. These interactions originate from van der Waals, structural or electrostatic forces [2,3,4]. Wettability can be altered by the interaction between the surface and the fluids occupying the pore space [5,6]. Alteration from oil-wet to slightly water-wet has been purported as the reason leading to an increase in the recovery factor (RF) [7,8,9,10]. Consistent characterization of rock wettability is valuable in enhanced oil recovery studies as this property has been found to correlate with the success of a waterflood [11], including those involving low-salinity water injection [6,12]. Requirements to adjust reservoir conditions vary depending on lithology. Wettability of sandstone reservoirs can be altered by oil [13,14], but in a waterflood, the salinity of the injection brine can be much lower than the connate one. Carbonate reservoirs are more influenced by which ions are present. Among them, M g + , C a 2 + , and S O 4 2 are considered potential determining ions [15,16]. However, sulfate has also shown a positive impact on several low-salinity waterflooding investigations for both sandstone and those focused on the fluids [17,18,19,20].
Wettability can affect multiphase flow properties such as relative permeability, capillary pressure, and residual oil saturation, and consequently its determination is critical [21,22,23,24]. Several methods, including the US Bureau Mines (USBM), imbibition and contact angle, have been the most commonly used ones. Amott cell imbibition and USBM experiments provide data about primary recovery of oil, but can also provide insights into the wettability conditions of the cores in use [25,26]. On the other hand, contact angle relies on the interaction forces among all fluid phases and solid surfaces of the system of interest (Equation (1)), and measurements help to determine the different conditions required to induce a change in the overall wettability of the reservoir [13,14]. In this case, the intrinsic or Young’s contact angle corresponds to:
c o s ( θ ) = σ b s σ o s σ b o ,
where σ b s is the stress between the brine and the surface; σ o s is the stress between the oil and the surface and σ b o is the interfacial tension between the fluids.
A surface with an oil contact angle 0–75° is considered oil-wet, for an angle 75–105° the surface is considered intermediate wet, and finally an angle 105–180° categorizes the surface as water-wet [27]. While the contact angle measurement has made its mark in petroleum research efforts, a technique with less experimental variability and an ability for in situ, non-destructive evaluation would enable this field to grow. Time-domain Nuclear Magnetic Resonance (TD-NMR) has been applied as an advanced technique to study solid-fluid interactions and could serve as a viable alternative [28,29,30,31,32,33,34].
Proton nuclear magnetic resonance ( 1 H-NMR) has been explored as a convenient technique to examine rock wettability for many years. The key to interpret the NMR response resides in the sensitivity of relaxation rates, particularly those associated to T 2 , which is sensitive to the presence of surfaces [14,28,34,35,36]. The value of T 2 varies according to the various relaxation mechanisms, including those associated with the surface-to-volume ratio and consequently the T 2 distribution depends on pore size. To obtain these distributions, a multi-exponential decay function is fitted to the overall relaxation response of the spin-echo train. Similarly, the diffusion coefficient can also be derived by analogous analysis. Given a proper relaxation model, this technique can serve as a powerful tool in the determination of the pore-size distribution and wettability tendency of the surface of interest [28,29,34,35,36,37]. Wang et al. [34] showed a relationship between the pore-size distribution and the surface relaxivity. In addition, the use of NMR analysis can allow us to analyze the influence of liquid films, previously addressed as a possible weakness of the traditional and standardized methods of wettability determination, as shown when complexation models are developed [12,35,38].
NMR enables inferences about pore size from relaxation rates by assuming that mobile fluids reside in large pores, bound fluids in small pores, and adhering fluids on grain surfaces. The intensity of the signal relates to the number of hydrogen nuclei found in each sample, while the rate of decay relates to the mobility of the molecules. Surface relaxation of the wetting phase will vary depending on the wettability environment within the pore space. A non-wetting fluid gives up a restricted pore space response, while the wetting phase will relax according to its degree of adhesion with the surface. The surface area (S) to pore volume (V) ratio is coupled to the surface relaxivity ( ρ 2 ); for fluids confined in pores, T 2 is equal to or shorter than that of the bulk fluid [39]. In the fast diffusion limit, the measured T 2 values are given by Equation (2) [40]. As such, when surface relaxivity increases for given porous media, a decrease in T 2 response is expected, resulting in shifts to shorter T 2 values in correspondence with an increase in wettability to the fluid in use [29]. For example, if an oil-wet system is exposed to water, a shift to the left will occur, namely to shorter T 2 values, as the rock becomes more water-wet over time. The same response is expected for a water-wet system becoming more oil-wet when exposed to oil. In mixed-wet systems such as the case of a mix of oil-wet and water-wet glass bead, a linear relationship is observed between the relaxation response and wettability [36,37]. Both Brown et al. and Hsu et al. saw the same 4:1 ratio for surface relaxivity of a water-wet surface to an oil-wet surface. Plotting the NMR response by either the Amott or USBM techniques also provides a linear relationship, described as a wettability index, which improves the use of the technique and further validates it [29,30,32,33].
1 T 2 s u r f a c e = ρ 2 ( S V ) p o r e .
The diffusion coefficient of fluid molecules restricted by pore surfaces depends not only on pore geometry [41], but also on pore surface characteristics [42]. In restricted geometries, the interaction with surfaces gives rise to a competition between the surface-liquid and liquid-liquid interactions. This competition determines the water spatial distribution, including water molecules on the bound water layer near the pore surface [42,43,44]. The pulsed field gradient NMR (PFG-NMR) can be used to analyze the diffusion coefficient of hydrogen-containing molecules restricted inside porous spaces, which is sensitive to surface-liquid interactions. T 2 trends similarly to T 1 [35], is less affected by bulk relaxation time [30] and turns out to be a relatively fast measurement. In principle, this relaxation should be a good indicator of wettability alteration, but a few challenges arise from changes in ionic profile, as the case of low-salinity or smart water injection. To elucidate this, we compare T 2 trends to the expected wettability alteration from contact angle measurements.

2. Materials and Methods

2.1. Materials

The oil used in this work had the following characteristics at 25 °C: density of 0.9092 g/cm 3 , a viscosity of 105 mPa·s, pentane asphaltene content of 10% wt and a refractive index of 1.527. The brines were prepared using analytical grade Na 2 SO 4 (Fisher Scientific, Pittsburgh, PA) salt diluted in de-ionized water, at concentrations of 1% and 100%, where 100% correspond to an ionic strength of 0.6724 M. The surfaces for this study corresponds to acid-washed glass beads (Sigma-Aldrich, St. Louis, MO) with a diameter between 425 and 600 μ m and Berea Sandstone cores with a diameter of 0.8 cm, length of 1 cm, average porosity of 22% and average permeability of 720 mD were used to analyze wettability through NMR measurements. In addition, a 5% dimethyldichlorosilane solution in toluene was used to alter the glass beads surfaces.

2.2. Methods

2.2.1. Sample Preparation

To alter glass beads wettability, they were placed in a 5% dimethyldichlorosilane solution in toluene, then rinsed three times with methanol and dried in an oven at 60 °C. The change in surface properties was confirmed through contact angle measurements collected on glass slides (Fischer Scientific) that underwent the same process to induce hydrophobicity.
All glass beads were dried out at 80 °C to significantly reduce moisture, prior to measurements. Glass beads were added to an NMR tube to an approximate height of 1 cm, which amounted to approximately to a a mass of 0.6 g. Next, 300 μ L of fluid was added to completely cover the glass beads, but avoiding excess free water, as the presence of bulk water would vastly overwhelm the measurement and invalidate the results. The tubes were sealed with a cotton applicator wrapped with Teflon tape to avoid excessive fluid evaporation during the aging time. Rock samples were vacuum-saturated for 6 h with the fluid of interest, then pressurized to 100 psi in the saturation cell. In the case of water, the aging process or equilibration time was carried out at 25 °C. We do not anticipate significant temperature dependence of wettability with only water. However, in the case of oil, the process is known to be sensitive to temperature, with the alteration being more significant at high temperature. Consequently, for the case of oil, samples were aged at 80 °C for three weeks, which is a standard wettability restoration procedure for rock, before exposure to any brine.

2.2.2. NMR T 2 Relaxation and Diffusion Coefficient Measurements

All NMR experiments were conducted on a Bruker mq20 miniSpec spectrometer with a frequency of 19.65 MHz. A chiller (F12-MA, JULABO USA Inc.) with a temperature accuracy better than ±0.02 °C was used to keep the sample at 25 °C by circulating constant-temperature liquid coolant. NMR T 2 relaxation time measurement was performed using a standard Carr-Purcell-Meiboom-Grill (CPMG) pulse sequence [45,46] with 200 echoes and an echo time of 14.21 μ s. Figure 1 depicts the pulse sequence. This pulse sequence offers the advantage of reducing the effects of imperfections in the flip angle of the two-pulse Hahn sequence [47,48,49]. The effect is also seen in the broadening of the Fourier transform of the decay of the echo signal, which is narrower in the CPMG pulse sequence, considered only homogeneously broadened. The values of echo spacing, τ , the number of points and the gain were determined for each sample in order to get the cleanest signal possible. A total of 32 scans for each repeat and 5 separate measurements for each condition were conducted. Figure 2 shows the averaged T 2 of the dominant peak location over 5 repeats as a function of the number of scans. As shown, after 16 scans, the average location of the main T 2 converges to a narrow position, showing a standard deviation of 0.1 ms. The diffusion coefficient was determined by the pulsed field gradient spin echo (PFGSE) method [50] setting the following values for the needed parameter: gradient pulse with 0.5 ms, gradient pulse separation 7.51444 ms, 90°–180° pulse separation 7.51085 ms and 90° first gradient pulse of 1 ms. T 2 measurements were executed for all the samples at days 1, 7, 14 and 21, and conversion of relaxation signal into T 2 distribution was processed using the CONTIN software provided by Bruker. The diffusion coefficient was collected concurrently on each measurement day.

2.2.3. Contact Angle and Interfacial Tension

The interfacial tension (IFT) and contact angle were measured with a Future Digital Scientific Corporation (FDSC)/Dataphysics instrument (OCA 25) pendant drop system. All experiments were conducted assuming symmetry with respect to the central vertical axis, ensuring also that the oil drop is elastic and the only forces shaping the drop under the influence of gravity and IFT. A J-shaped needle was used and submerged in a cuvette full of brine to form an oil-drop of 37 μ L. The IFT was measured for 10 h until the droplet reached equilibrium. Regarding contact angle, a cuvette was filled with water until the glass surface at the top was completely in contact, a 4 μ L oil drop was created with a J-shape needle, aged for 1/2 h and then measured. The camera contrast and the lens magnification were calibrated in order to obtain the best image quality and the most precise drop shape for both cases. Both measurements used the same software, which relies on the Young-Laplace equation and allows for direct measurement of the contact angle.

3. Results

Wettability can be altered at low temperature through different mechanisms and system composition [13,17,51,52]. In this study, regardless of aging temperature, TD-NMR data were collected at 25 °C in the spectrometer.

3.1. Interfacial Tension and Contact Angle

IFT was collected between oil and either of the two brines. Figure 3 shows that for 100% Na 2 SO 4 IFT value starts around 30 mN/m and plateaus at 15.8 mN/m. While for the 1% Na 2 SO 4 system, IFT starts at 28.5 mN/m and plateaus at 12.3 mN/m. This is shown to corroborate that IFT is not expected to play such a significant role in recovery differences in this case.
Each oil drop created in the pendant-drop system was given a stabilization time of 30 min, and the contact angle was tracked during this period, without finding any significant changes in the measured value. Dimethyldichlorosilane produces a hydrophobic behavior on treated surfaces, due to the absorption process on the solid surface [53,54]. Contact angle provided information to verify the surface changes to a hydrophobic response, confirming an oleophilic behavior and therefore the wettability alteration within the three components system.
Results in Table 1 confirm that untreated glass slides are water-wet, while treated ones turned out oil-wet. The contact angle behavior reflects the effect of salinity, which suggests that when surfaces are water-wet, the increment in salinity goes along with an increment in the angle (122.6 ± 2.8° for 1% Na 2 SO 4 and 139.6 ± 2.5° for 100% Na 2 SO 4 ). On the other hand, for treated glass beads, low-salinity brine leads to an increase in the contact angle (33.1 ± 2.1° for 1% Na 2 SO 4 and 21.4 ± 7.3° for 100% Na 2 SO 4 ). This shows the direct effect on the surface, as the liquid-liquid interaction are the same for both treated and untreated slides.

3.2. Glass Beads-Fluid Interaction

3.2.1. Oil-Surface Interaction

The oil T 2 distribution for the bulk oil is shown in Figure 4, as a reference for results in the glass beads pack. The crude oil contains several solubility classes. The most polar molecules are usually associated with the asphaltene fraction, which is defined as being insoluble in low-molecular weight alkanes, for example, pentane, but soluble in toluene. Resins are closely related to the asphaltene fraction and can exhibit polar behavior as well. The resins can impact the solubility or stability of the asphaltene class in solution. The asphaltene fraction tends to contain high-molecular weight species, though not always, but they contribute significantly to wettability alteration, due to their affinity for surfaces. Also, short relaxation time is anticipated for this solubility class. Crude oil is complex in molecular composition, so the relaxation structure of the bulk is expected to be more complex than water. As can be seen from the figure, three distinct peaks were found in the T 2 spectrum. To estimate the error in the dominant peak location, the experiment was run five times and the standard deviation of the peak location was used as error metric. However, only one run is shown in the figures.
The equivalent oil T 2 distributions contained in untreated and treated glass beads packs saturated with oil and aged for 21 days at 25 °C are shown in Figure 5. The untreated glass beads (GB) give rise to longer relaxation times (dominant mode location: 40 ± 0.1 ms @ Day 1) corresponding to a water-wet (hydrophilic) surface. Over time, the dominant mode (highest peak) of the T 2 distribution shifted to shorter values (dominant mode location: 35.7 ± 0.1 ms @ Day 21), indicative of the alteration suffered by the media and corresponding to a more oil-wet surface. Figure 5b shows the T 2 distribution behavior in the treated glass beads (TGB) with oil during the period of 21 days. The slight decrease of the dominant mode position from 35.1 ± 0.2 ms to 34.7 ± 0.1 ms indicates that the pore surfaces are mildly altered by the interaction with oil, suggesting that after the chemical alteration, aging will still produce further oleophilicity. However, these changes are not significant in comparison to the effect observed for untreated glass beads. It is worth noticing that the other two modes/peaks associated to oil are also affected in similar fashion, namely that the oil residing in the untreated bead pack has all three modes shifted similarly. However, when comparing with the bulk oil response, the relative shifts and broadening of the modes seem to indicate compositional-dependent effects.
Figure 6 shows the diffusion coefficient as a function of aging time. This value in TD-NMR is an average over all molecular groups, so compositional-dependencies are hard to pinpoint. Despite this average behavior, for untreated glass beads, the oil diffusion coefficient decreases significantly during the 21 days from 0.070 ± 0.001 to 0.057 ± 0.002 × 10 9 m 2 /s, in concert with the shifts in T 2 . By the same token, the result for treated glass beads shows a much smaller drop in the diffusion coefficient (0.056 ± 0.002 × 10 9 m 2 /s), which is also consistent with the small shifts in the T 2 distribution.
The analysis of the two aforementioned parameters, that is, T 2 and D, indicates the acquisition of an oleophilic behavior of the surfaces within the porous space, being these chemically treated or aged in oil. In both cases, the alteration is the result of the adsorption process or ionic interaction between oil and the ions present on the surface [12,38]. An oleophilic surface will create a stronger attraction to oil molecules creating a layer effect, affecting the general dynamics of hydrogen bonds, producing a molecular reorganization and therefore a decrease on diffusion coefficient, but that also affects the T 2 distribution [42,43,44].

3.2.2. Brine-Surface Interaction

The effects of salinity during secondary recovery or smart-water flooding relate to the interaction between the phases present in the reservoir. Water chemistry plays a critical role in the recovery improvement, which has been linked to wettability alteration [6,12,55]. Sulfate is present as one of the most common ions in natural reservoir waters, and has shown the ability to induce changes in rocks of different lithologies, including sandstone [15,17,20].
The T 2 distribution in the case of water is simpler than that of crude oil, typically exhibiting one dominant mode or peak. The appearance of other modes at lower T 2 values is likely associated to water molecules sitting in smaller pores or pore-throats, corners, cranies and other small surface features. Figure 7 shows the water T 2 distribution inside both glass beads packs saturated with 1% Na 2 SO 4 . Untreated glass beads are considered naturally water-wet (hydrophilic). For this sample the dominant mode initially located at 1664.5 ± 0.1 ms on Day 1 decreases to 1620.1 ± 0.1 ms after 21 days of aging, suggesting that the surface is still being altered, though the surfaces only experiences a minute alteration. On the other hand, treated glass beads show a more dramatic shift in the dominant mode location from 2233.1 ± 0.1 ms (Day 1) down to 1620.5 ± 0.1 ms (Day 21). The inset plots correspond to the non-normalized spectra. For a single fluid occupying the pore space, we do not anticipate a significant decrease in intensity. The two obvious peaks in the two figures are affected similarly in qualitative sense. However, molecules sitting in a smaller spaces are exposed to larger surface-to-volume ratios, which implies more relative surface effects.
Figure 8 shows the results of the T 2 distribution for the interaction between treated (Figure 8a) and untreated (Figure 8b) glass beads with 100% Na 2 SO 4 . For the untreated glass beads, the dominant mode remains at the same location, around 1602.5 ± 0.1 ms. Treated glass beads exhibit a decrease from 2120.1 ± 0.1 ms to 1756.1 ± 0.1 ms. In contrast to the effects of low-salinity, the degree of alteration is milder. However, a similar effect is observable on Day 1, confirming the equilibrium process of the sample. However, the dominant mode for low salinity on Day 7 locates at 1808.4 ± 0.1 ms, while for high salinity it is located at 1803.1 ± 0.1 ms, suggesting that after the equilibrium process both samples approach similar dominant mode locations. The smaller mode is also affected in a qualitative fashion, similarly to the largest mode.
Figure 9 shows the diffusion coefficient response as a function of time at two salinities for both treated and untreated glass beads packs. Analogous to previously observed results, when the beads are hydrophilic, the diffusion coefficient decreases (in concert with the T 2 distribution peak value). These results show that regardless of the media, 1% Na 2 SO 4 brine initially leads to a higher diffusion coefficient (2.272 ± 0.002 × 10 9 m 2 /s for TGB and 2.234 ± 0.002 × 10 9 m 2 /s for GB, respectively) in comparison to that of 100% Na 2 SO 4 (2.124 ± 0.002 × 10 9 m 2 /s for TGB and 2.084 ± 0.003 × 10 9 m 2 /s for GB, respectively). Dependency on ionic strength has been observed before [41]. On the other hand, the observable differences between TGB and GB are due to the surfaces characteristics being either hydrophobic or hydrophilic, respectively. Electrostatic forces play an important role in this alteration, since they can affect the mobility the hydrogen-containing molecules through a surface-bound layer [2,42,43,44].
From the results for systems containing either oil or brines, a connection between TD-NMR results and those of contact angle experiments can be established. The untreated glass beads T 2 distribution is altered by the oil over time (Figure 5a). However, brine induces minimal differences in T 2 regardless of salinity (Figure 7 and Figure 8a). Results shown in Table 1 suggest that high- and low-salinity brines give rise to different wettability conditions, which is not reflected in the two-component T 2 results. This implies the importance of fluid-mediated influence on wettability. Concerning the treated-glass beads, the oil does not alter an already oil-wet surface significantly. However, the low-salinity brine has a faster and greater effect on the pore surface over time (Figure 7b), while the high salinity brine elicits wettability changes to a lesser degree (Figure 8b). T 2 , along with those of contact angle results, show the improvement offered by low-salinity water on wettability alteration.

3.3. Rock-Fluid Interaction

Sandstone, alongside other common reservoir rocks, has been a dominant research focus through the evolution of TD-NMR wettability applications [13,14,28,35,37]. The wettability evolution of Berea Sandstone (initially water-wet) was examined here. Figure 10 shows a decrease in the T 2 dominant mode from 31.8 ± 0.1 ms on Day 7 to 25.5 ± 0.1 ms at day 21. The difference in the main mode/peak location for both day 7 and 21 with respect to untreated glass beds, correlates with the differences in pore sizes and mineral composition. Therefore, the shift in the dominant mode of the T 2 is indicative of the surface becoming increasingly oil wet, as expected for these conditions. Work on silica surfaces shows that polar fractions of the crude oil, for example, polar asphaltenes, adsorb on the surface [56]. This leads to wettability alteration and consequently to changes in relaxation mechanisms in fluid-rock interactions processes.
Compared to the glass beads (Figure 7a and Figure 8a), T 2 distributions of the brine-saturated rock in Figure 11 show a different behavior. Both untreated glass beads and sandstone are considered initially water-wet. However, brine still induces a decrease in the dominant mode location of the T 2 distribution. The increase of the ion exchange between rock surface and the brine, produces this effect. Nevertheless, the decrease is more appreciable for low salinity (from 152.6 ± 0.1 ms @ day 7 to 143.1 ± 0.1 ms @ day 21) than for high salinity (from 143.1 ± 0.1 ms @ day 7 to 139.1 ± 0.1 ms @ day 21). This reflects the different effect on wettablity alteration offered by low-salinity brine compared to high-salinity. The lower ionic strength of the low-salinity brine allows for expansion of the electric double layer on the surface and consequently the modification of the surface zeta potential. This change in the charge distribution is in part responsible for the change in the interaction and therefore of the surface-induced relaxation.
Figure 12a depicts the significant decreases in the diffusion coefficient, from 1.654 ± 0.002 × 10 9 m 2 /s to 1.460 ± 0.002 × 10 9 m 2 /s for low-salinity brine and from 1.347 ± 0.002 × 10 9 m 2 /s to 1.279 ± 0.002 × 10 9 m 2 /s for high-salinity brine is a verification of the ion exchange on the rock surface. However, this effect has been shown to be beneficial for wettability [6,55]. On the other hand, Figure 12b shows the diffusion coefficient for the oil-rock interaction, clearly indicates the adsorption process occurring as it decreases over time, assuming that no major chemical reaction occurs between the rock and oil molecules. The T 2 and diffusion coefficient results of the rock-oil or rock-brine systems analyzed together indicate wettability alteration of the surface. However, a new complication arises due to the heterogeneity offered by Berea Sandstone, steering the analysis to focus on trends instead of the specific T 2 peak location and diffusion coefficient values. Effects such as hydration layers around ions can affect the diffusion coefficient dependence on salinity, but could not explain the decrease over time observed in these results.

Partial Saturation

To analyze the effect of salinity on oil-wet samples, rocks initially aged in oil at 80 °C were later placed in the 1% Na 2 SO 4 and 100% Na 2 SO 4 brines. The T 2 distribution collected after the oil aging process is considered the initial state of the rock sample (Figure 13a). The rock wettability alteration after the aging process into the two different salinitiy brines is shown in Figure 13b.
Figure 13a corresponds to the wetting state after oil aging, showing the dominant mode location at 28.6 ± 0.1 ms, which is comparable to the results in Figure 10, where the dominant mode is located at 25.5 ± 0.1 ms. The T 2 response was expected, regardless of the observed difference that is a confirmation of the heterogeneity of the rock although both samples corresponds to Berea Sandstone. This differences could complicate the analysis of the partially saturated samples, since for common methodologies wettability alteration is directly related to saturation [11,28].
Figure 13b shows the T 2 distribution of the rock sample after being aged in the two different brines. The appearance of a new peak between 100 and 200 ms corresponds to the brine intrusion into the rock. Since the effect of the the brine is the primary analysis target, a comparison between the trend offered by both brines can be developed. The dominant mode for 1% Na 2 SO 4 partially-saturated rock is located at 103.5 ± 0.1 ms, while for the 100% Na 2 SO 4 partially-saturated rock the dominant mode is located at 137.5 ± 0.1 ms, indicating the favorable effect of low-salinity on the pore surface and therefore the wettability alteration. This results cannot be directly related with the results in Figure 11a,b corresponding to rock fully saturated in 1% Na 2 SO 4 and 100% Na 2 SO 4 respectively, due to sample-to-sample variability. However, all systems show similar beneficial trend for low-salinity. A potential detachment of oil layers (or components) from the rock surface in the presence of low-salinity brine can produce a redistribution of phases in partially saturated systems, as the minimum of energy would require re-accommodation of fluid interfaces. This would be driven by changes in capillary pressure. The latter in conjunction with changes in relaxation mechanisms upon more exposure of the surface to water can contribute to the shifts in T 2 distribution modes, as shown in this section. This might help to provide an interpretation of T 2 distributions in partially saturated porous systems.
Figure 14 shows more clearly the differences between the initial state of the rocks and after the aging process with the respective brine. These two plots indicate that for higher salinity (Figure 14a) there is not a significant change on the oil component T 2 dominant mode location, going from 28.9 ± 0.1 to 25.9 ± 0.1 ms. Meanwhile, the differences for the low salinity (Figure 14b) are more significant going from 28.8 ± 0.1 to 21.38 ± 0.1 ms. This indicates that low-salinity brine improves the oil production. However, the different position of the brine component dominant mode between both salinities, indicates that changes on wettability induced by the low salinity are more beneficial.
The diffusion coefficient, shown in Figure 15, increases for both systems, from 0.053 ± 0.002 × 10 9 m 2 /s to 0.407 ± 0.002 × 10 9 m 2 /s for 100% Na 2 SO 4 and from 0.050 ± 0.002 × 10 9 m 2 /s to 0.321 ± 0.002 × 10 9 m 2 /s for 1% Na 2 SO 4 , respectively. The lower value shown for 1% Na 2 SO 4 supports the existence of a wettability alteration. However, due to heterogeneity of the sample the use of the variable could not provide enough information for a three-component system since the final result is an average calculated from all the hydrogen containing molecules.
Partially saturated systems have been analyzed for a considerable length of time using and a number of proposed analysis alternatives [28,29,34,36]. However, the increased level of complexity in these systems could lead to longer analysis times or even inadequate conclusions.

4. Discussion

The main contributors to the alteration of the surface properties involved on the surface-liquid interaction include adsorption, ion exchange as well as electrostatic forces. This can be seen in the process of transforming a surface from hydrophilic to oleophilic, naturally or artificially induced [13,53]. Examples of these are the response of the surface when in contact with oil for long enough or when the surface are chemically treated. In both cases an hydrophobic behavior is promoted.
The use of TD-NMR on two-component systems provides useful information to understand these phenomena. The T 2 distribution, which directly relates with the porous media through the surface relaxivity term in Equation (2), reflects the effect on the pore surfaces. On the other hand, the diffusion coefficient provides complementary information on the effects of the fluid. These two variables can jointly aid to interpret wettability changes. More complex heterogeneity and variability can significantly impact data interpretation. However, similar trends can still be observed in the different data types.
Wettability effects in complex systems have been widely explored [28,30,35,36]. The use of simpler two-component systems helps to assess wettability changes to a specific factor. Example of this is the wettability alteration induced by low-salinty sulfate brine, analyzed in this study. Although this work does not attempt to resolve the dichotomy related to fluid-fluid and fluid-rock interactions as it pertains to low-salinity waterflooding, namely which one is more dominant, it provides a simpler method to analyze the wettability alteration and the effects that the different fluids can have on it.

5. Conclusions

The following conclusions can be drawn from our results:
  • Time domain NMR analysis of simple systems can be used to determine the effect of a specific fluid on a surface, and therefore its contribution to wettability.
  • Time domain NMR can be used to estimate pore-size distribution quantitatively in small plugs or large-diameter rock samples for any lithology using a simple and quick experiment. This can be useful to correlate results from other experimental techniques.
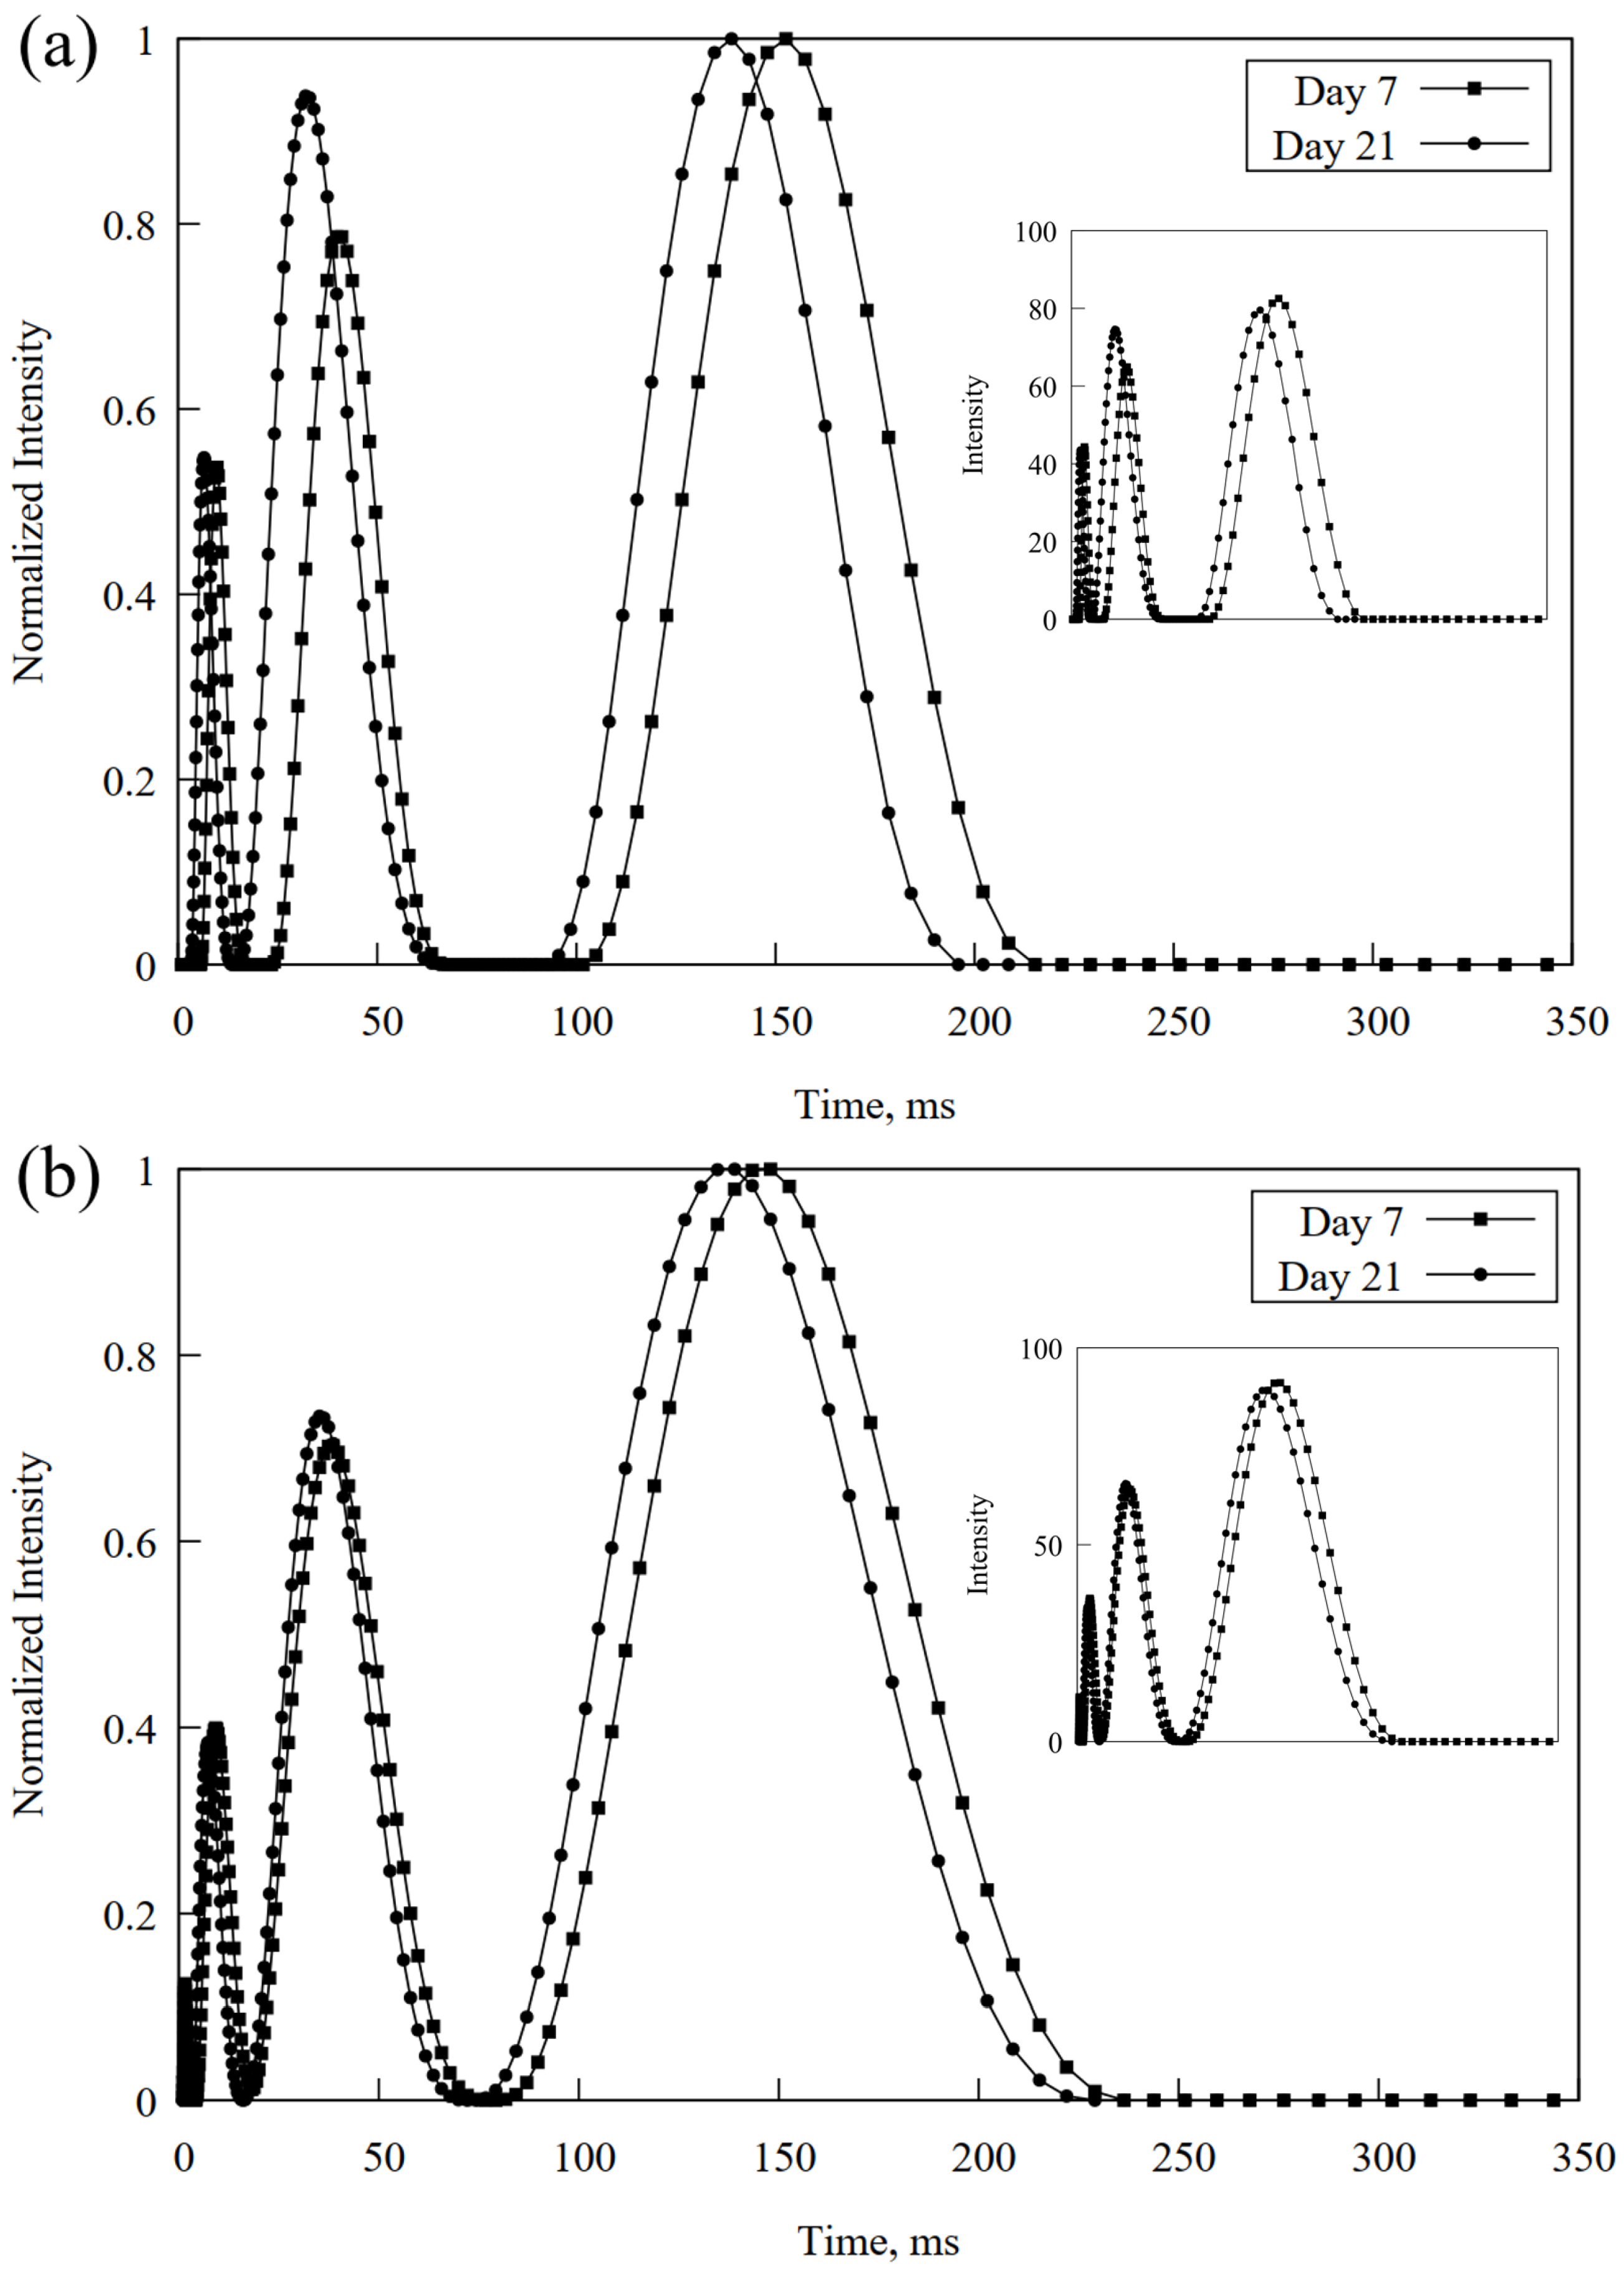
  • The NMR T 2 is an effective tool to detect wettability alteration. It can be useful to map the conditions where changes in wettability occur, for example, temperature, time, brines or chemical products designed for this purpose. At this point of the research, qualitative conclusions can be drawn.
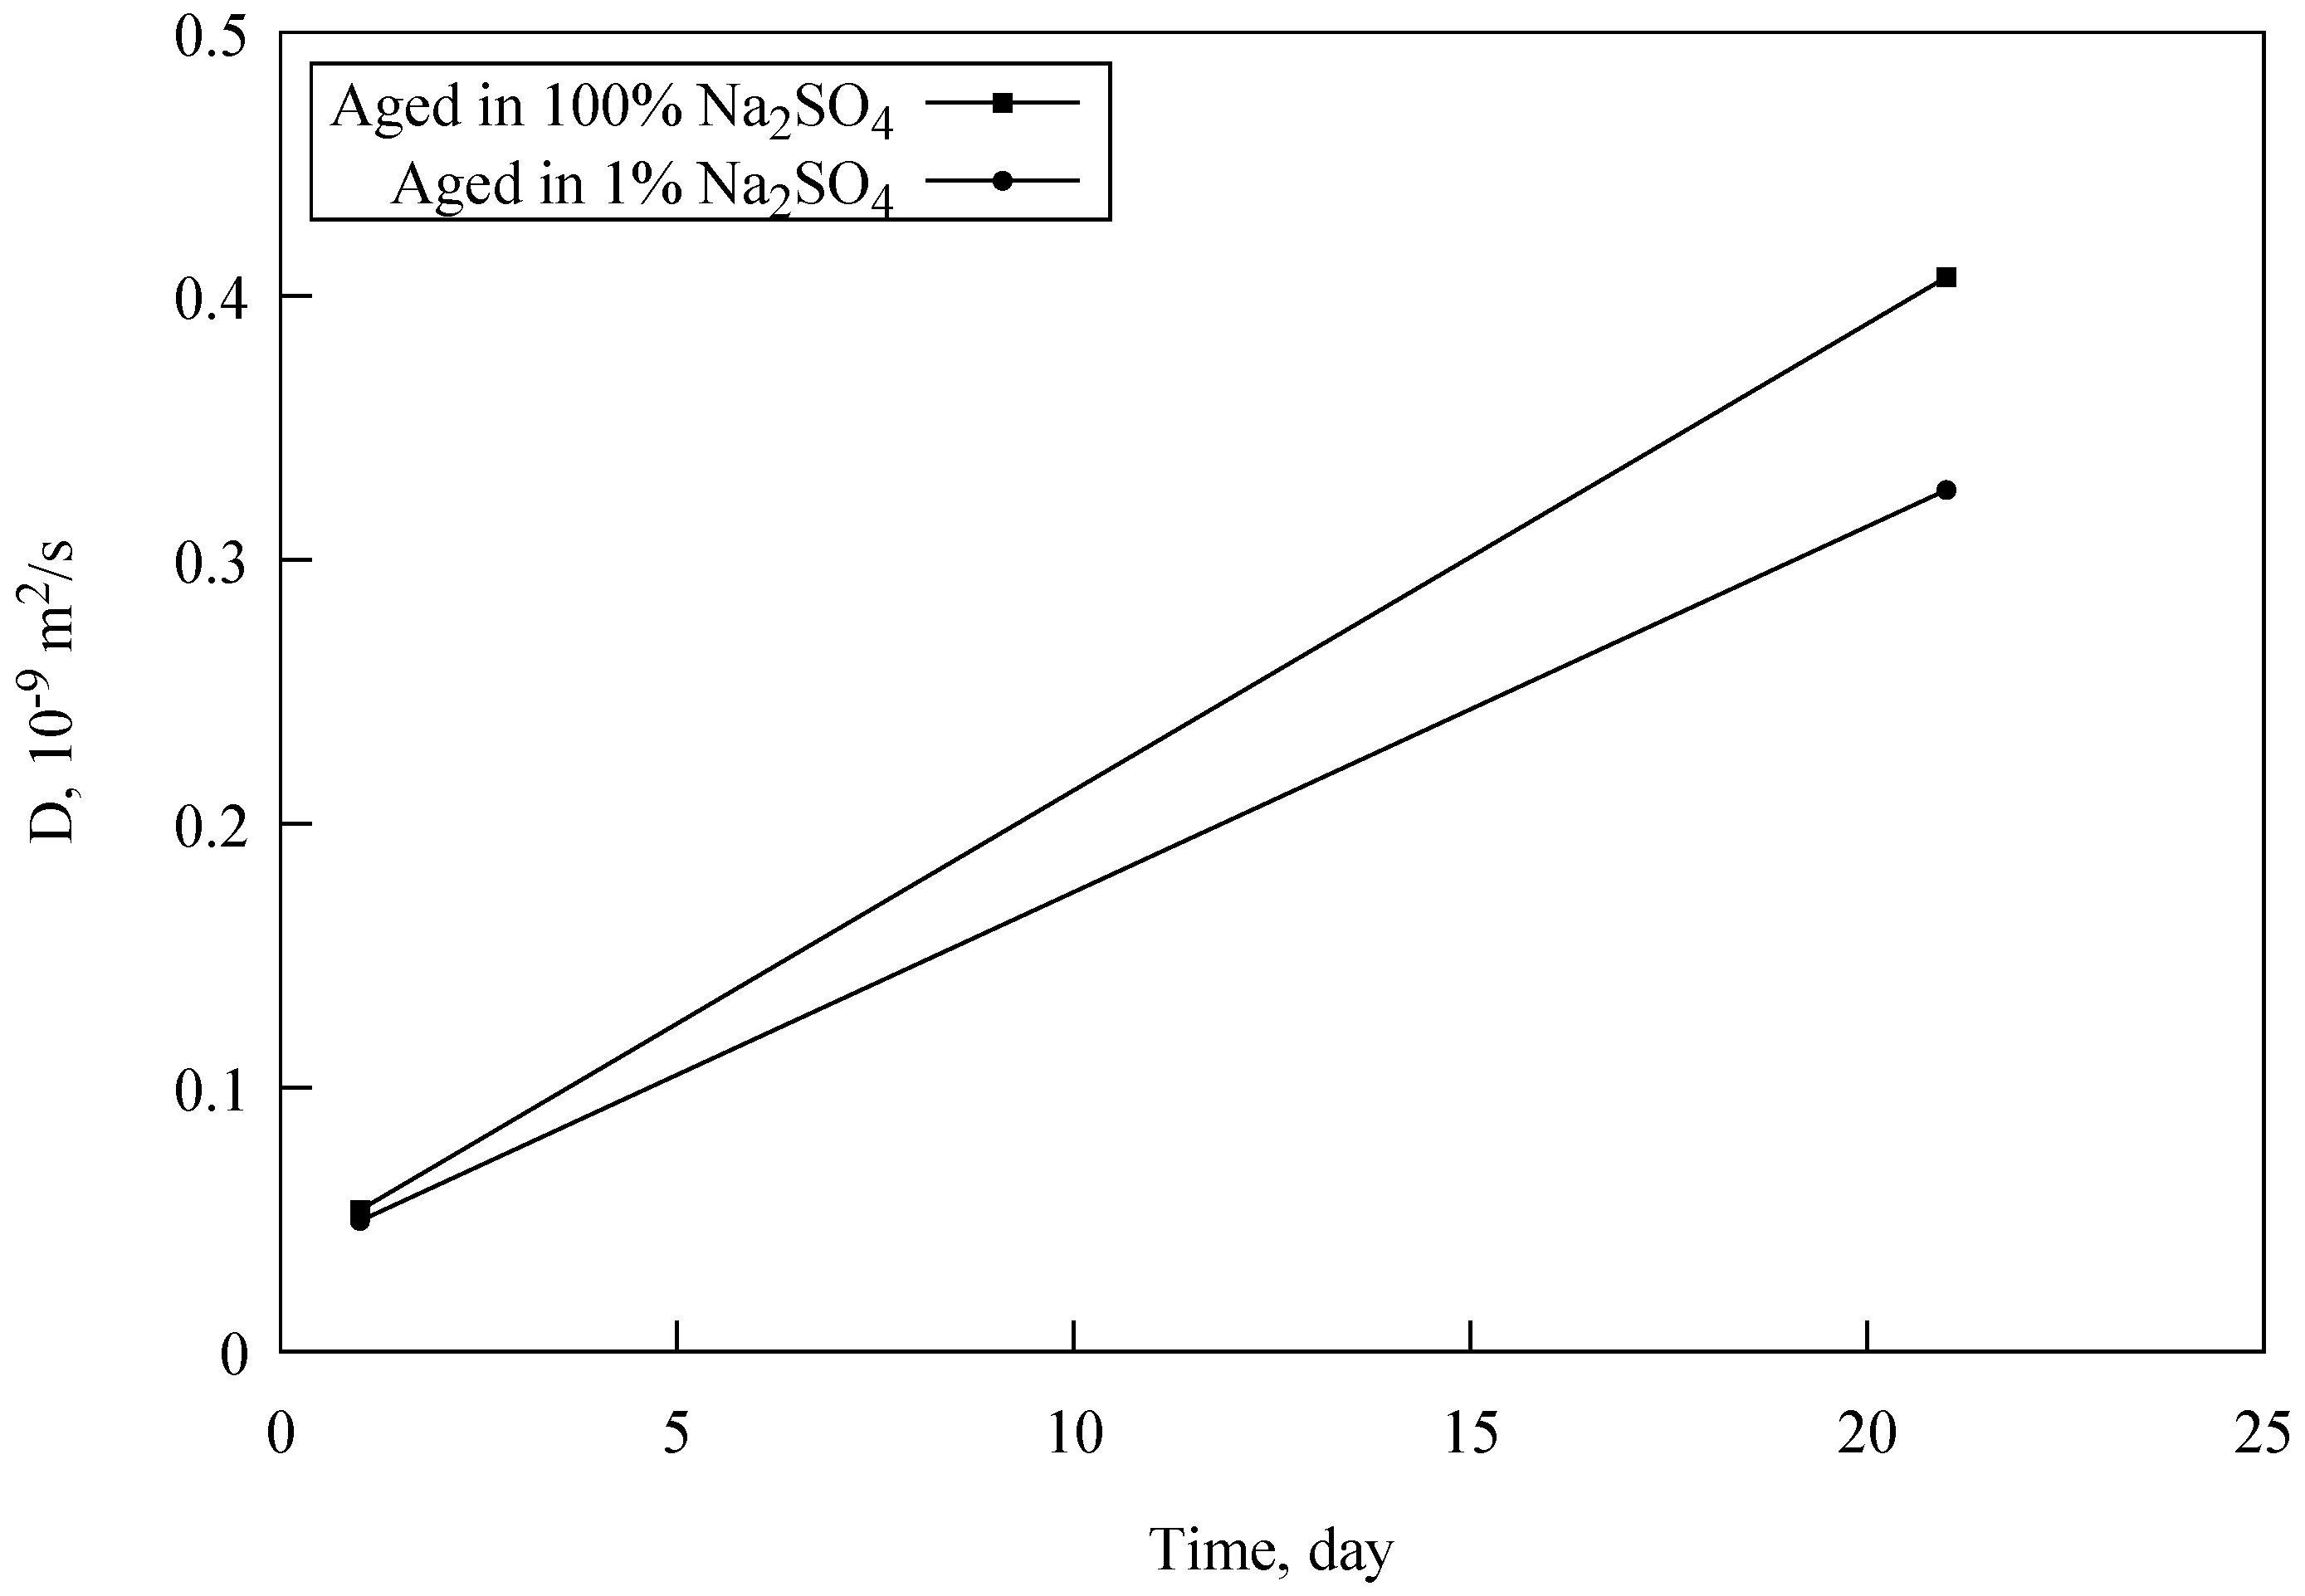
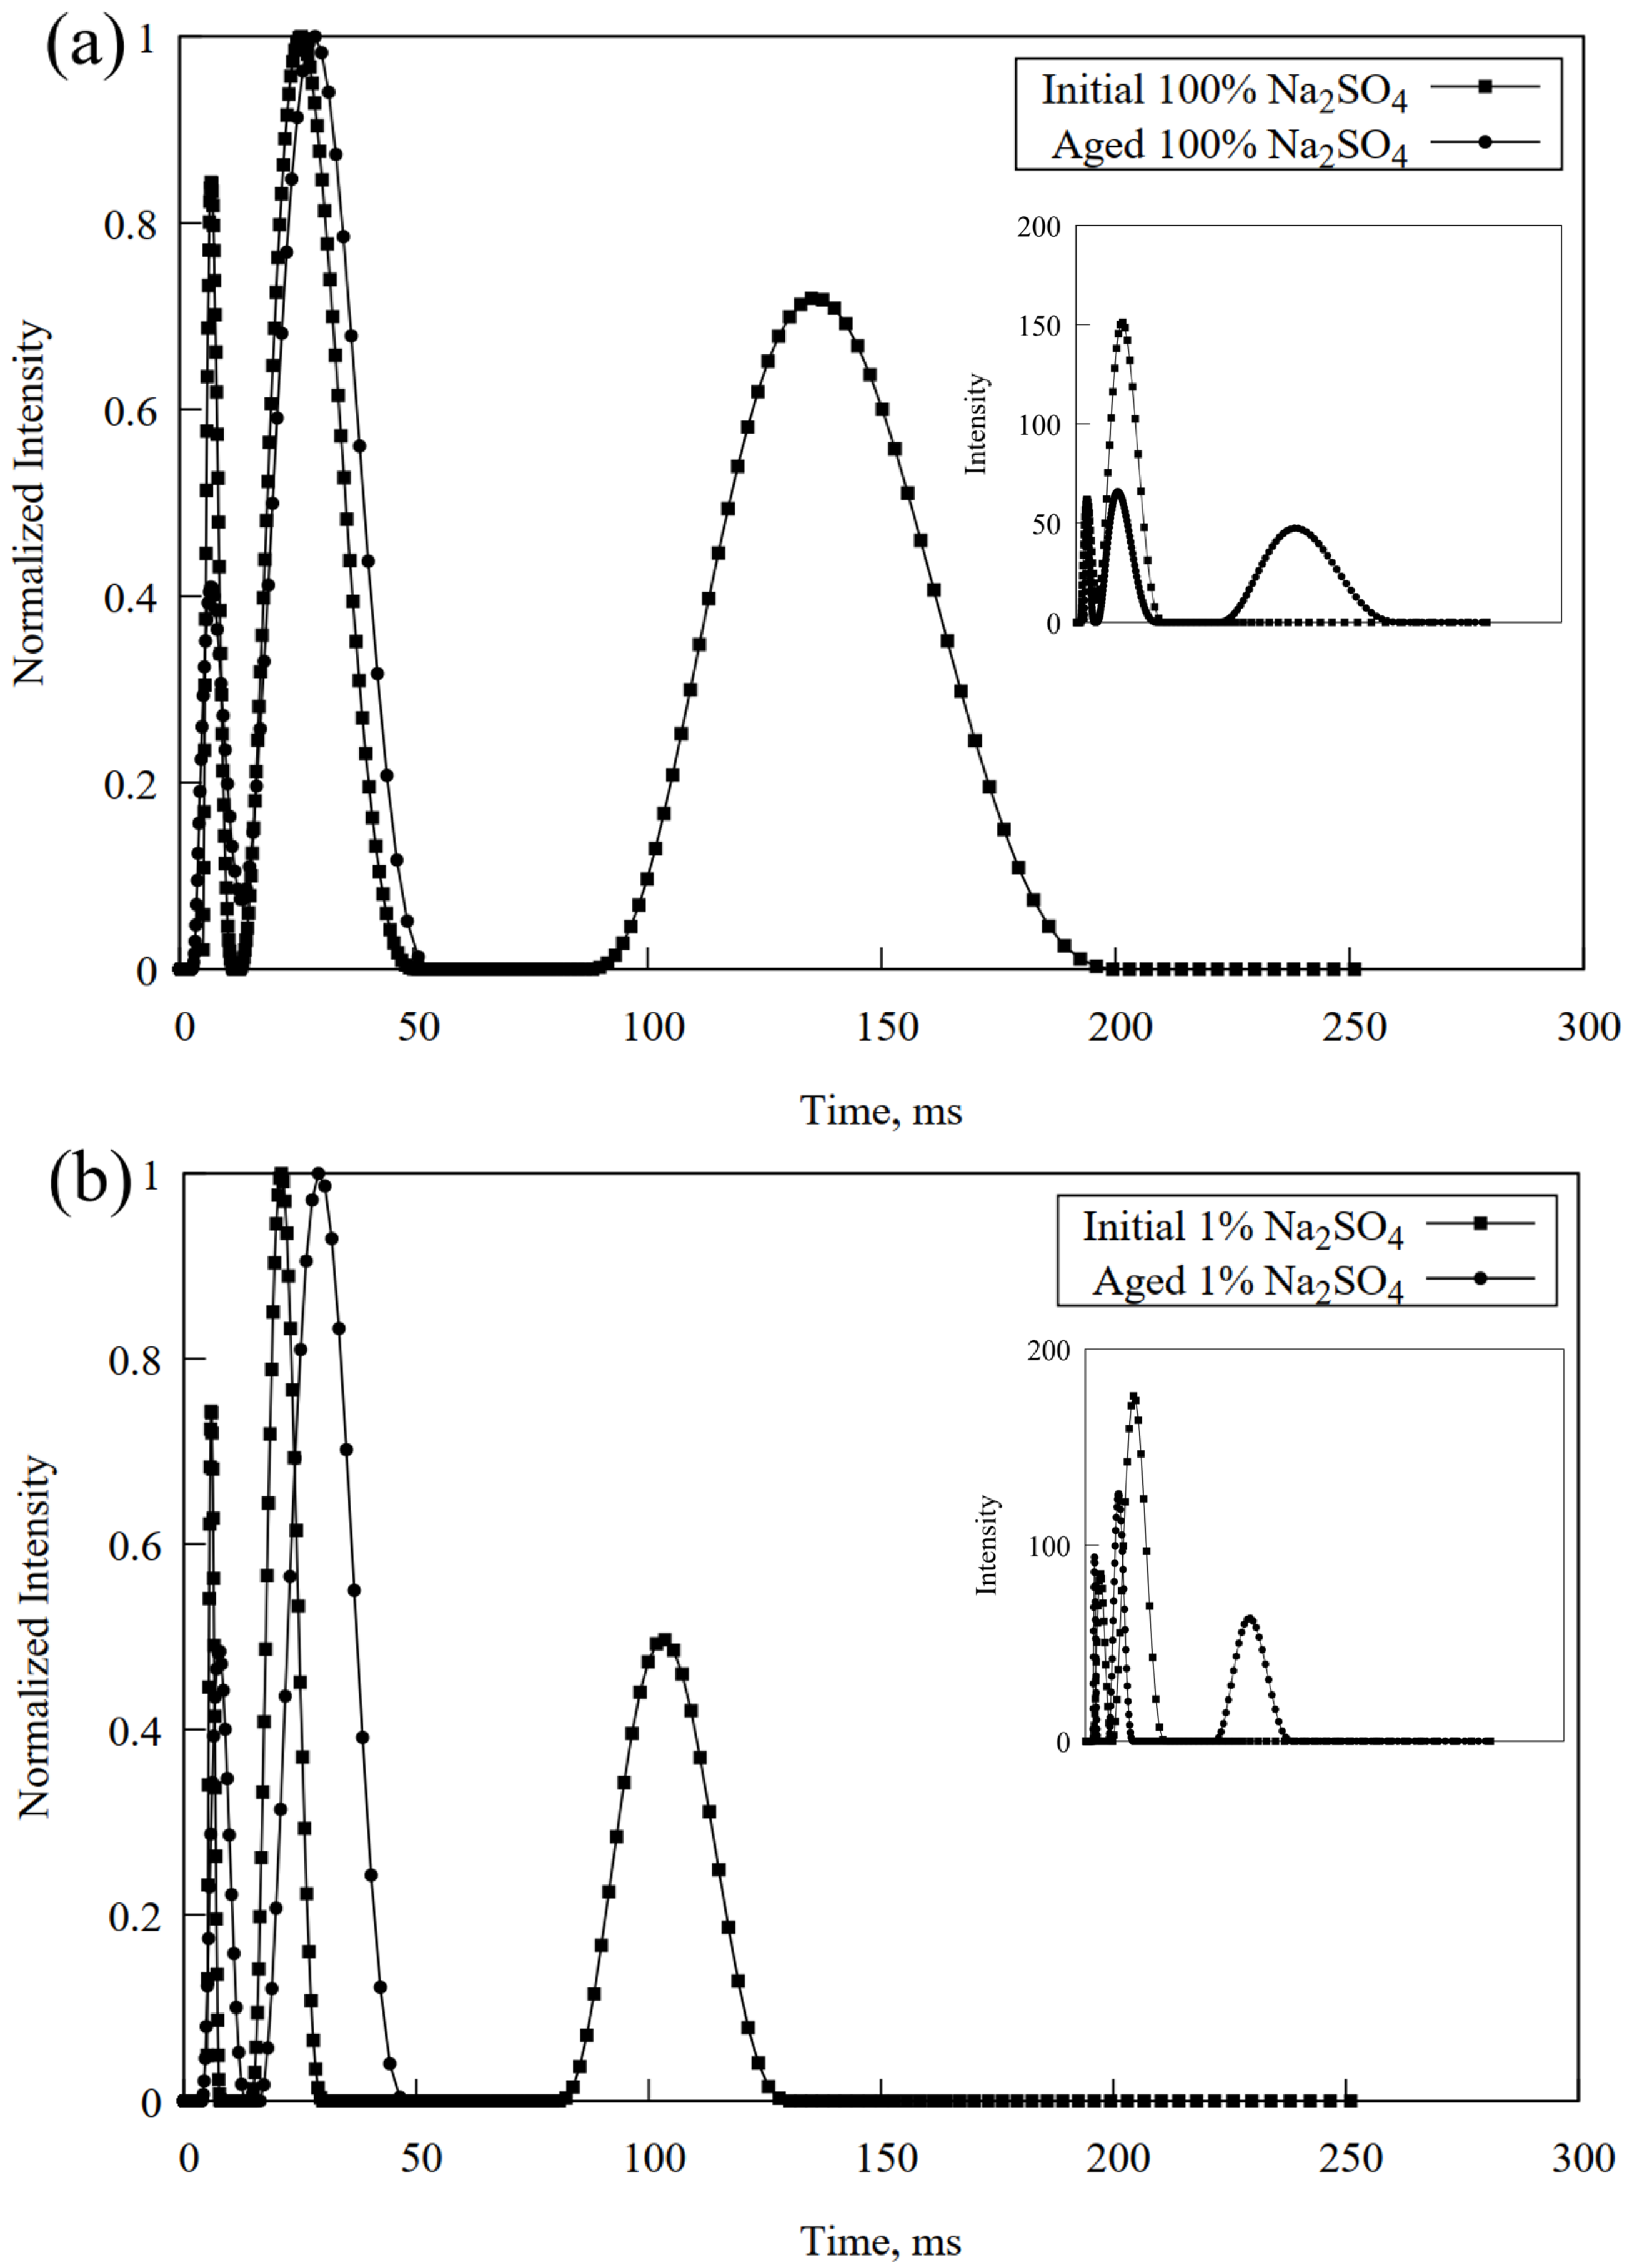
  • Wettability alteration induced as a the result of brine salinity modification has been consistently detected with TD-NMR measurements, that is, T 2 and D distribution shifts.

Author Contributions

Contributions for the work contained herein were distributed as follows: Conceptualization, G.G.-O. and V.A.; methodology, G.G.-O., B.X.M.-R. and E.R.S.; software, H.W. and B.X.M.-R.; validation, H.W., B.X.M.-R., E.S. and T.R.; formal analysis, B.X.M.-R. and H.W.; investigation, T.R., B.X.M.-R. and E.R.S.; resources, V.A.; data curation, V.A.; writing—original draft preparation, T.R. and B.X.M.-R.; writing—review and editing, T.R., H.W., and V.A.; visualization, B.X.M.-R.; supervision, V.A., S.A.; project administration, V.A.; funding acquisition, V.A. All authors have read and agreed to the published version of the manuscript.

Funding

This research was funded by the Department of Energy grant number DE-SC0019165.

Acknowledgments

This work was supported as part of the Center for Mechanistic Control of Water-Hydrocarbon-Rock Interactions in Unconventional and Tight Oil Formations (CMC-UF), an Energy Frontier Research Center funded by the U.S. Department of Energy, Office of Science under DOE (BES) Award DE-SC0019165. Bryan Medina would Like to acknowledge Fulbright-Ecuador for the financial support to pursue his PhD at the University of Wyoming.

Conflicts of Interest

The authors declare no conflict of interest.

Abbreviations

The following abbreviations are used in this manuscript:
EOREnhanced oil recovery
RFRecovery factor
TD-NMRTime-domain Nuclear Magnetic Resonance
IFTInterfacial tension
GBGlass beads
TGBTreated glass beads

References

  1. Craig, F.F. The Reservoir Engineering Aspects of Waterflooding; Doherty Memorial Fund of AIME: New York, NY, USA, 1971; Volume 3. [Google Scholar]
  2. Hirasaki, G.J. Wettability: Fundamentals and surface forces. SPE Form. Eval. 1991, 6, 217–226. [Google Scholar] [CrossRef]
  3. Al-Muthana, A.; Hursan, G.G.; Ma, S.M.; Valori, A.; Nicot, B.; Singer, P.M. Wettability as a function of pore size by NMR. In Proceedings of the SCA Conference Paper, Aberdeen, UK, 27–30 August 2012; Volume 31. [Google Scholar]
  4. Wang, J.; Xiao, L.; Liao, G.; Zhang, Y.; Guo, L.; Arns, C.H.; Sun, Z. Theoretical investigation of heterogeneous wettability in porous media using NMR. Sci. Rep. 2018, 8, 13450. [Google Scholar] [CrossRef]
  5. Buckley, J.; Takamura, K.; Morrow, N. Influence of electrical surface charges on the wetting properties of crude oils. SPE Reserv. Eng. 1989, 4, 332–340. [Google Scholar] [CrossRef]
  6. Chen, Y.; Xie, Q.; Saeedi, A. Role of ion exchange, surface complexation, and albite dissolution in low salinity water flooding in sandstone. J. Petroleum Sci. Eng. 2019. [Google Scholar] [CrossRef]
  7. Wagner, O.; Leach, R. Improving oil displacement efficiency by wettability adjustment. Trans. AIME 1959, 216, 65–72. [Google Scholar] [CrossRef]
  8. Jadhunandan, P.P. Effects of Brine Composition, Crude Oil, and Aging Conditions on Wettability and Oil Recovery. Ph.D. Thesis, Department of Petroleum Engineering, New Mexico Institute of Mining & Technology, Socorro, NM, USA, 1990. [Google Scholar]
  9. Jadhunandan, P.; Morrow, N. Spontaneous imbibition of water by crude oil/brine/rock systems. In Situ 1991, 15. [Google Scholar]
  10. Jadhunandan, P.; Morrow, N.R. Effect of wettability on waterflood recovery for crude-oil/brine/rock systems. SPE Reserv. Eng. 1995, 10, 40–46. [Google Scholar] [CrossRef]
  11. Morrow, N.R. Wettability and its effect on oil recovery. J. Pet. Technol. 1990, 42, 1–476. [Google Scholar] [CrossRef]
  12. Brady, P.V.; Krumhansl, J.L. A surface complexation model of oil–brine–sandstone interfaces at 100 C: Low salinity waterflooding. J. Pet. Sci. Eng. 2012, 81, 171–176. [Google Scholar] [CrossRef]
  13. Graue, A.; Viksund, B.G.; Eilertsen, T.; Moe, R. Systematic wettability alteration by aging sandstone and carbonate rock in crude oil. J. Pet. Sci. Eng. 1999, 24, 85–97. [Google Scholar] [CrossRef]
  14. Al-Mahrooqi, S.; Grattoni, C.; Muggeridge, A.; Jing, X. Wettability alteration during aging: The application of NMR to monitor fluid redistribution. In Proceedings of the International Symposium of the Society of Core Analysts, Toronto, ON, Canada, 21–25 August 2005; pp. 21–25. [Google Scholar]
  15. Awolayo, A.; Sarma, H.; AlSumaiti, A. An experimental investigation into the impact of sulfate ions in smart water to improve oil recovery in carbonate reservoirs. Transp. Porous Media 2016, 111, 649–668. [Google Scholar] [CrossRef]
  16. Hognesen, E.J.; Strand, S.; Austad, T. Waterflooding of preferential oil-wet carbonates: Oil recovery related to reservoir temperature and brine composition. In Proceedings of the SPE Europec/EAGE Annual Conference, Madrid, Spain, 13–16 June 2005. Society of Petroleum Engineers. [Google Scholar]
  17. Mohamed, M.I.; Alvarado, V. Smart Water Flooding in Berea Sandstone at Low Temperature: Is Wettability Alteration the Sole Mechanism at Play? In Proceedings of the SPE Annual Technical Conference and Exhibition, San Antonio, TX, USA, 9–11 October 2017. Society of Petroleum Engineers. [Google Scholar]
  18. Zahid, A.; Shapiro, A.; Stenby, E.H.; Yan, W. Managing injected water composition to improve oil recovery: A case study of North Sea chalk reservoirs. Energy Fuels 2012, 26, 3407–3415. [Google Scholar] [CrossRef] [Green Version]
  19. Bidhendi, M.M.; Garcia-Olvera, G.; Morin, B.; Oakey, J.S.; Alvarado, V. Interfacial Viscoelasticity of Crude Oil/Brine: An Alternative Enhanced-Oil-Recovery Mechanism in Smart Waterflooding. SPE J. 2018. [Google Scholar] [CrossRef]
  20. Tabrizy, V.A.; Hamouda, A.; Denoyel, R. Influence of magnesium and sulfate ions on wettability alteration of calcite, quartz, and kaolinite: Surface energy analysis. Energy Fuels 2011, 25, 1667–1680. [Google Scholar] [CrossRef] [Green Version]
  21. Anderson, W.G. Wettability literature survey—Part 1: Rock/oil/brine interactions and the effects of core handling on wettability. J. Pet. Technol. 1986, 38, 1–125. [Google Scholar] [CrossRef]
  22. Anderson, W.G. Wettability literature survey—Part 3: The effects of wettability on the electrical properties of porous media. J. Pet. Technol. 1986, 38, 1–371. [Google Scholar] [CrossRef]
  23. Anderson, W.G. Wettability literature survey—Part 4: Effects of wettability on capillary pressure. J. Pet. Technol. 1987, 39, 1–283. [Google Scholar] [CrossRef]
  24. Anderson, W.G. Wettability literature survey part 5: The effects of wettability on relative permeability. J. Pet. Technol. 1987, 39, 1–453. [Google Scholar] [CrossRef]
  25. Amott, E. Observations Relating to the Wettability of Porous Rock; Society of Petroleum Engineers: Richardson, TX, USA, 1959. [Google Scholar]
  26. Morrow, N.R.; Mason, G. Recovery of oil by spontaneous imbibition. Curr. Opin. Colloid Interface Sci. 2001, 6, 321–337. [Google Scholar] [CrossRef]
  27. Treiber, L.; Owens, W. A laboratory evaluation of the wettability of fifty oil-producing reservoirs. Soc. Pet. Eng. J. 1972, 12, 531–540. [Google Scholar] [CrossRef]
  28. Hirasaki, G.J.; Huang, C.C.; Zhang, G.Q. Interpretation of wettability in sandstones wit NMR analysis. Petrophysics 2000, 41. [Google Scholar]
  29. Guan, H.; Brougham, D.; Sorbie, K.; Packer, K. Wettability effects in a sandstone reservoir and outcrop cores from NMR relaxation time distributions. J. Pet. Sci. Eng. 2002, 34, 35–54. [Google Scholar] [CrossRef]
  30. Fleury, M.; Deflandre, F. Quantitative evaluation of porous media wettability using NMR relaxometry. Magn. Reson. Imaging 2003, 21, 385–387. [Google Scholar] [CrossRef]
  31. Flaum, M.; Chen, J.; Hirasaki, G. NMR Diffusion Editing for D? T2 Maps: Application to Recognition of Wettability Change. Petrophysics 2005, 46. [Google Scholar]
  32. Looyestijn, W.J.; Hofman, J. Wettability-index determination by nuclear magnetic resonance. SPE Reserv. Eval. Eng. 2006, 9, 146–153. [Google Scholar] [CrossRef]
  33. Chen, J.; Hirasaki, G.; Flaum, M. NMR wettability indices: Effect of OBM on wettability and NMR responses. J. Pet. Sci. Eng. 2006, 52, 161–171. [Google Scholar] [CrossRef]
  34. Wang, J.; Xiao, L.; Liao, G.; Zhang, Y.; Cui, Y.; Sun, Z.; Dong, Y.; Hu, L. NMR characterizing mixed wettability under intermediate-wet condition. Magn. Reson. Imaging 2018. [Google Scholar] [CrossRef]
  35. Howard, J. Quantitative estimates of porous media wettability from proton NMR measurements. Magn. Reson. Imaging 1998, 16, 529–533. [Google Scholar] [CrossRef]
  36. Hsu, W.F.; Li, X.; Flumerfelt, R. Wettability of porous media by NMR relaxation methods. In Proceedings of the SPE Annual Technical Conference and Exhibition, Washington, DC, USA, 4–7 October 1992. Society of Petroleum Engineers. [Google Scholar]
  37. Brown, R.J.; Fatt, I. Measurements of fractional wettability of oil fields’ rocks by the nuclear magnetic relaxation method. In Proceedings of the Fall Meeting of the Petroleum Branch of AIME, Los Angeles, CA, USA, 14–17 October 1956. Society of Petroleum Engineers. [Google Scholar]
  38. Brady, P.V.; Thyne, G. Functional wettability in carbonate reservoirs. Energy Fuels 2016, 30, 9217–9225. [Google Scholar] [CrossRef]
  39. Chang, D.; Vinegar, H.J.; Morriss, C.; Straley, C. Effective porosity, producible fluid and permeability in carbonates from NMR logging. In Proceedings of the SPWLA 35th Annual Logging Symposium. Society of Petrophysicists and Well-Log Analysts, Tulsa, OK, USA, 19–22 June 1994. [Google Scholar]
  40. Coates, G.R.; Xiao, L.; Prammer, M.G. NMR Logging: Principles and Applications; Haliburton Energy Services: Houston, TX, USA, 1999; Volume 344. [Google Scholar]
  41. Wang, H.; Alvarado, V. Ionic strength-dependent pre-asymptoic diffusion coefficient distribution in porous media-Determination through the pulsed field gradient technique. J. Nat. Gas Sci. Eng. 2018, 49, 250–259. [Google Scholar] [CrossRef]
  42. Buntkowsky, G.; Breitzke, H.; Adamczyk, A.; Roelofs, F.; Emmler, T.; Gedat, E.; Grünberg, B.; Xu, Y.; Limbach, H.H.; Shenderovich, I.; et al. Structural and dynamical properties of guest molecules confined in mesoporous silica materials revealed by NMR. Phys. Chem. Chem. Phys. 2007, 9, 4843–4853. [Google Scholar] [CrossRef] [PubMed]
  43. Liu, E.; Dore, J.C.; Webber, J.B.W.; Khushalani, D.; Jähnert, S.; Findenegg, G.; Hansen, T. Neutron diffraction and NMR relaxation studies of structural variation and phase transformations for water/ice in SBA-15 silica: I. The over-filled case. J. Phys. Condens. Matter 2006, 18, 10009. [Google Scholar] [CrossRef]
  44. Vogel, M. NMR studies on simple liquids in confinement. Eur. Phys. J. Spec. Top. 2010, 189, 47–64. [Google Scholar] [CrossRef]
  45. Carr, H.; Purcell, E. Effects of Diffusion on Free Precession in Nuclear Magnetic Resonance Experiments. Phys. Rev. 1954, 94, 630–638. [Google Scholar] [CrossRef]
  46. Meiboom, S.; Gill, D. Modified Spin-Echo Method for Measuring Nuclear Relaxation Times. Rev. Sci. Instrum. 1958, 29, 688–691. [Google Scholar] [CrossRef] [Green Version]
  47. Hahn, E. Spin echoes. Phys. Rev. 1950, 80, 580–594. [Google Scholar] [CrossRef]
  48. Blümich, B. NMR Imaging of Materials; Oxford Science Publications: New York, NY, USA, 2004. [Google Scholar]
  49. Callaghan, P. Principles of Nuclear Magnetic Resonance Microscopy; Oxford Science Publications: New York, NY, USA, 1993. [Google Scholar]
  50. Stilbs, P. Fourier transform pulsed-gradient spin-echo studies of molecular diffusion. Prog. Nucl. Magn. Reson. Spectrosc. 1987, 19, 1–45. [Google Scholar] [CrossRef]
  51. Hamouda, A.A.; Rezaei Gomari, K.A. Influence of temperature on wettability alteration of carbonate reservoirs. In Proceedings of the SPE/DOE Symposium on Improved Oil Recovery, Tulsa, OK, USA, 22–26 April 2006. Society of Petroleum Engineers. [Google Scholar]
  52. Sohal, M.A.; Thyne, G.; Søgaard, E.G. Effect of the temperature on wettability and optimum wetting conditions for maximum oil recovery in a carbonate reservoir system. Energy Fuels 2017, 31, 3557–3566. [Google Scholar] [CrossRef]
  53. Wang, Y.l.; Ma, L.; Bai, B.j.; Jiang, G.c.; Jin, J.f.; Wang, Z.b. Wettability alteration of sandstone by chemical treatments. J. Chem. 2013, 2013. [Google Scholar] [CrossRef] [Green Version]
  54. Saulick, Y.; Lourenço, S.; Baudet, B. Effect of particle size on the measurement of the apparent contact angle in sand of varying wettability under air-dried conditions. In E3S Web of Conferences; EDP Sciences: Les Ulis, France, 2016; Volume 9, p. 09003. [Google Scholar]
  55. Alotaibi, M.B.; Nasralla, R.A.; Nasr-El-Din, H.A. Wettability studies using low-salinity water in sandstone reservoirs. SPE Reserv. Eval. Eng. 2011, 14, 713–725. [Google Scholar] [CrossRef]
  56. Taborda, E.; Franco, C.; Lopera, S.; Alvarado, V.; Cortes, F. Effect of Nanoparticles/Nanofluids on the Rheology of Heavy Crude Oil and Its Mobility on Porous Media at Reservoir Condition. Fuel 2016, 184, 222–232. [Google Scholar] [CrossRef]
Figure 1. Schematic representation of the Carl-Purcell-Meiboom-Gill (CPMG) pulse sequence.
Applsci 10 01017 g001
Figure 2. Average T 2 of the dominant peak location for water-wet glass beads in 1% Na 2 SO 4 .
Applsci 10 01017 g002
Figure 3. Interfacial tension of 1% Na 2 SO 4 with oil (plateau at 12.3 mN/m) and 100% Na 2 SO 4 with oil (plateau at 15.8 mN/m).
Applsci 10 01017 g003
Figure 4. Oil relaxation time distribution (T 2 ) of the bulk oil.
Applsci 10 01017 g004
Figure 5. Oil relaxation time distribution (T 2 ) in a glass beads pack saturated to 100% with oil: (a) Untreated glass beads aged for 21 days at 25 °C; (b) Treated glass beads aged for 21 days at 25 °C.
Applsci 10 01017 g005aApplsci 10 01017 g005b
Figure 6. Diffusion coefficient behavior of treated and untreated glass beads with oil at different aging times at 25 °C.
Applsci 10 01017 g006
Figure 7. Relaxation time distribution (T 2 ) of glass beads saturated with 1% Na 2 SO 4 : (a) Untreated glass beads aged for 21 days at 25 °C; (b) Treated glass beads aged for 21 days at 25 °C. Inset plots correspond to non-normalized distributions.
Applsci 10 01017 g007
Figure 8. Relaxation time distribution (T 2 ) of glass beads saturated with 100% Na 2 SO 4 : (a) Untreated glass beads aged for 21 days at 25 °C; (b) Treated glass beads aged for 21 days at 25 °C.
Applsci 10 01017 g008
Figure 9. Diffusion coefficient behavior of treated and untreated glass beads for different aging times and at 25 °C: (a) 1% Na 2 SO 4 ; (b) 100% Na 2 SO 4 .
Applsci 10 01017 g009
Figure 10. Relaxation time distribution (T 2 ) of Berea Sandstone saturated with crude oil for 21 days at 25 °C.
Applsci 10 01017 g010
Figure 11. Relaxation time distribution (T 2 ) of Berea Sandstone saturated with brine for 21 days at 25 °C. (a) 1% Na 2 SO 4 ; (b) 100% Na 2 SO 4 .
Applsci 10 01017 g011
Figure 12. Diffusion coefficient for rock saturated with different fluids 25 °C. (a) 1% Na 2 SO 4 and 100% Na 2 SO 4 for 21 days; (b) Crude oil for 21 days.
Applsci 10 01017 g012
Figure 13. Relaxation time distribution (T 2 ) of Berea Sandstone: (a) Initial “oil-wet” state (aged in crude oil for 21 days at 80 °C); (b) Effects of aging in 1% Na 2 SO 4 and 100% Na 2 SO 4 at 25 °C.
Applsci 10 01017 g013
Figure 14. (a) Relaxation time distribution (T 2 ) of Berea Sandstone initially saturated with crude oil and then aged in 100% Na 2 SO 4 ; (b) Relaxation time distribution (T 2 ) of Berea Sandstone initially saturated with crude oil and then aged in 1% Na 2 SO 4 .
Applsci 10 01017 g014
Figure 15. Diffusion coefficient behavior of Berea Sandstone before and after the aging process in 1% Na 2 SO 4 and 100% Na 2 SO 4 at 25 °C.
Applsci 10 01017 g015
Table 1. Oil contact angle for  treated and untreated glass slides, in the presence of Na 2 SO 4 brine.
SalinityConditionContact Angle
1%Untreated 122.6 ± 2.8 °
Treated 33.1 ± 2.1 °
100%Untreated 139.6 ± 2.5 °
Treated 21.4 ± 7.3 °

