Article

A Novel Polymer Concrete Composite with GFRP Waste: Applications, Morphology, and Porosity Characterization

1
Department of Manufacturing Engineering, Faculty of Machine Building, Technical University of Cluj-Napoca, Memorandumului 28, 400114 Cluj-Napoca, Romania
2
Department of Manufacturing Engineering, Faculty of Technological Engineering and Industrial Management, Transilvania University of Braşov, Mihai Viteazu 5, 500174 Braşov, Romania
3
Department of Machining and Computer Aided Technology, Institute of Production Technologies, Faculty of Materials Science and Technology, Slovak University of Technology, J. Bottu 25, 917 24 Trnava, Slovakia
*
Authors to whom correspondence should be addressed.
Appl. Sci. 2020, 10(6), 2060; https://doi.org/10.3390/app10062060
Submission received: 27 February 2020 / Revised: 11 March 2020 / Accepted: 12 March 2020 / Published: 18 March 2020
(This article belongs to the Special Issue Progressive Cement and Glass-Based Composites and Structures)

Abstract

:
Composite materials reinforced with recycled fibers gather a great deal of interest with regards to construction applications. A novel polymer concrete composite was proposed, comprised of a surface layer and a structural composite reinforced with recycled glass fibers. The novel multi-material composite included a large amount of glass-fiber-reinforced polymer (GFRP) waste (30%), which is expected to help protect the environment. Large panels comprised of this polymer concrete composite, which reproduce the appearance of natural stone, were manufactured. A new methodology for porosity analysis of a large panel comprised of a multi-material composite was proposed, utilizing three-dimensional (3D) X-ray computed tomography (CT). The volume of pores was distributed between the constituent composite materials and then statistically analyzed. Homogeneous distribution of the pores within the novel multi-material composite was found. The observed mean porosities of the composite panel were 0.146% for the surface layer material and 31.3% for the structural composite material. The mean density of the panel, determined by the CT density method, was 1.73 g/cm3. The composite materials porosity provides a favorable effect for achieving lightweight structures. Using scanning electron microscopy (SEM) analysis, it was observed that a good connection interface between the constituent composite materials existed.

Graphical Abstract

1. Introduction

Composite materials offer greater advantages than most other commonly used materials and continue to grow in importance each day. Composite materials have applicability across almost all domains, including the automotive, railway, aerospace, naval, electronics, medicinal, and civil construction industries. The widespread use of these materials currently generates a large amount of waste products from the technological processes of production or from the product removal process. At present, the frequency of product removals has increased due to two main factors: faster development of new products and shorter product life cycles. Thus, it is very important to identify all possible recycling solutions regarding waste management of composite based products. At present, the main conventional recycling techniques for glass-fiber-reinforced polymer (GFRP) waste materials include incineration, thermal or chemical recycling, and mechanical recycling [1,2,3]. Mechanical recycling through grinding and milling processes is one of the most used techniques; additionally, due to the size reduction of the fibrous products, the recycling process itself does not contribute to atmospheric pollution and much simpler equipment is required as compared to other methods. From this process, the resulting fibers can then be incorporated into new composite materials.
Within the construction field, polymeric composite materials are widely used (e.g., polymeric concrete composites), in which many industrial waste materials can be used as aggregates. One of the most commonly used aggregates for polymeric concretes is glass, which can be utilized in many different ways: glass fibers [4], glass dust, and inorganic waste in the form of coarse aggregates [5]. Polymer concretes produced with recycled materials and polyester resins provide aesthetic and structural benefits, as shown in a number of research studies [6,7]. GFRP waste materials incorporated into a polymer matrix are already used within many building materials, having the potential to reduce the environmental footprint of the materials used. Additional constituents of particulates in the polymeric matrix can be in the form of silica sand, calcium carbonate, mica, white cement, gypsum, perlite, or others [8,9]. The use of these materials enables the producer to reduce cost, control viscosity, and produce a smoother surface finish. In addition to this, glass-fiber-reinforced gypsum composites can be used as an alternative for some building materials [10]. Sultana et al. [9] carried out analysis of sand-reinforced polyester composite materials, where they concluded that this form of composite material may have potential for various engineering applications.
The porosity of the composite materials (polymer concretes) can produce a favorable effect in achieving comparatively lightweight materials. The most commonly used methods for determination of porosity are via direct, optical, mercury intrusion porosimetry, and computed tomography methods. The mercury intrusion porosimetry method [11] is focused on determining the pore volume and the distribution of the pores within soil and rock, within a typical range between pore diameters of about 0.0025 to 400 micrometers. This standard recommends that the larger pores must be measured by a different method. In addition, this method does not give any information about the volume of the closed pores, and involves the application of high pressures to the specimen that may result in temporary or permanent distortion of the pore geometry. Most methods for porosity determination only allow for the porosity of a material to be determined, but a few methods also allow morphological analysis of the pores. The use of X-ray Computed Tomography (CT) is an accurate way to analyze the porosity of the material (pore distribution, pore size, and pore shape). The accuracy of some modern industrial X-ray CT machines can be compared directly to the accuracy of some coordinate measuring machines (CMM) [12].
CT is a radiographic examination technique for metals, plastics, ceramics, and metallic and non-metallic composite materials that generates digital images of an object in three dimensions, including the interior structure. This technique allows for “the non-destructive physical, and to a limited extent, chemical characterization of the internal structure of materials” [13]. X-ray CT [14,15,16,17] became very important among non-destructive inspection techniques because of its applications in the three-dimensional (3D) analysis of the phenomena, material characterization, and analysis of the evolution of critical features during manufacturing or whilst in-service [18]. The main industrial applications of the CT technique, include but are not limited to [16], the detection of flaws such as voids and cracks, analysis of damage in materials [19], non-destructive quality inspections, internal material characterization (porosity), inspection of assemblies, and dimensional measurements [15] of components with internal geometry, difficult-to-reach part features, and easy-to-deform or flexible structures [17]. According to Liu and Chen [20], the size of the part that can be CT scanned is limited by the field-of-view of the digital X-ray detector. Using computed laminography (CL) techniques, Liaptsis and Clarke [21] have proposed a procedure that generates CT data on a small region of interest, where the 360° rotation used in CT is not physically possible. Also, damage detection in the materials of the large structures has to be investigated by other non-destructive methods, including vibration methods [22].
Nikishkov et al. [23] proposed a method for the accurate measurement of defects or voids based on X-ray computed microtomography; however, multi-material composites were not instigated. Nikishkov et al. concluded that the measurements of voids by CT provides the ability to accurately quantify critical voids, as well as the total porosity volume within composite parts. The interface between the component materials of a multi-material fabricated by additive manufacturing (AM) was CT-analyzed by Guessasma et al. [24], who concluded that the interface quality is a determinant for enhancing the performance of multi-materials.
From the completed literature survey, it is suggested that X-ray CT is most often used to characterize the internal structure of limited-size objects. Large objects should be investigated using CT based on a sampling methodology. However, very few research studies have investigated the porosity of multi-materials.
In this paper, a novel polymer concrete composite [25] obtained from ground GFRP waste is proposed. Ground GFRP is mixed with quartz sand, calcium carbonate, and polyester resin to produce a polymer concrete. Using the novel multi-material composite, ornamental tiles used for the cladding of buildings were made. An important study revealed a new methodology for characterizing the porosity of this composite material based on 3D X-ray CT. Samples from the large ornamental panels were then analyzed. The morphological characterization of the multi-material composite now needs to be investigated, in terms of both the surface material finish, desirably reproducing the appearance of natural marble, in addition to the structural material, which includes the glass fiber waste.

2. Materials and Methods

2.1. Polymer Concrete Composite Constituents and Manufacturing Method

A novel multi-material integrating GFRP waste is proposed, made of two different composite materials, named composite 1 and composite 2. The functions of each component in the multi-material are further described in Figure 1.
Composite 1, the surface layer of the multi-material, is composed of 60% polyester matrix and 40% calcium carbonate (CaCO3), with particles size up to 2 µm. It is connected by a second composite, composite 2, representing the structural component. Composite 2 is comprised of 30% ground GFRP waste, 35% sand (up to 0.3 mm in size), and 35% polyester resin. The constituent percent represents a weight fraction ratio of constituents [26]. Norpol 440-M750 polyester resin was used, mixed with 1% methyl ethyl ketone peroxide (MEK-P). The polyester resin was the binder for the constituents.
GFRP (E glass mat fibers and polyester matrix) waste was ground by a GSL 300 Granulator (ZERMA GmbH, Zuzenhausen, Germany). After the grinding process, the glass fiber monofilaments were separated from the polyester matrix using a 6.3 mm size sieve. The size of the waste glass fibers from the grinding process was observed up to 25 mm in length and 5–15 µm monofilaments in diameter. These glass fiber monofilaments are shown in Figure 2a.
At present, the use of ceramic tiles or natural stone as wall cladding by the construction industry is becoming more prevalent. A study investigating the properties of marble determined a density of 2.6 g/cm3 and a very low porosity of 0.42% in the test specimen used [27]. New lightweight materials reinforced with recycled fiber are now able to be considered as an alternative to stone and are used by the construction industry.
The proposed ornamental synthetic plates made of the novel polymer concrete composite detailed above aim to mimic natural marble. The master test model is comprised of small pieces of natural marble assembled by a bonding procedure. The test panel is of a relatively large size (600 × 600 mm) to allow for more efficient mounting (Figure 2b). A silicon rubber mold was built based on the master model, in order to create a similar test subject utilizing the new material. The mold surface was prepared for casting by applying polyvinyl alcohol (PVA), a release agent, and letting the mold dry for 20 min. The composite 1 constituents, calcium carbonate, and catalyzed polyester resin were subsequently mixed in a MCP-001 PLC (MCP Equipment, Staffordshire, United Kingdom) vacuum chamber, at a vacuum pressure of −0.9 bars for 10 min. Composite 1 was then applied on the surface of the mold using a brush. The composite layer thickness is dependent on the mold surface shape. Following this, composite 1 was polymerized for 30 min in order to pass through the gel point and keep the polymer solution in a sticky state, which allows for a good connection between the composite layers. The components of composite 2 (quartz sand, GFRP waste, and polyester resin) were mixed [28] for 10 min using an electric mixer in order to create a homogenous material with uniform distribution of the monofilaments. This composition was then casted over composite 1, pressed, and uniformed in order to produce the same material thickness in all parts of the panel. The mold with the composite material in it was then cured in an oven. The temperature was ramped up from 20 °C to 50 °C for 30 min and held there for 2 h. Following this, the mold was removed from the oven and left to cool to room temperature, where the ornamental synthetic panel was then removed from the mold. All the procedures were carried out under controlled laboratory conditions; the laboratory was regulated at a temperature at 20 °C and relative humidity of 40%.
Three ornamental synthetic panels, entitled panel 1, panel 2, and panel 3, were manufactured using the procedure detailed above. Five samples were taken from the panel, named S1 to S5, with dimensions of 35 mm × 20 mm × 15 mm, based on a sampling methodology (Figure 3). The height values of the specimens differ from one sample to another because the outer surface layer is irregular (Figure 2b). The samples were used to determine the mean porosity and mean density of the novel composite multi-material used to fabricate the large panel.

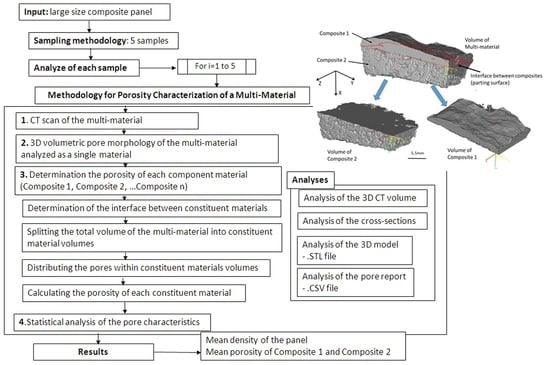
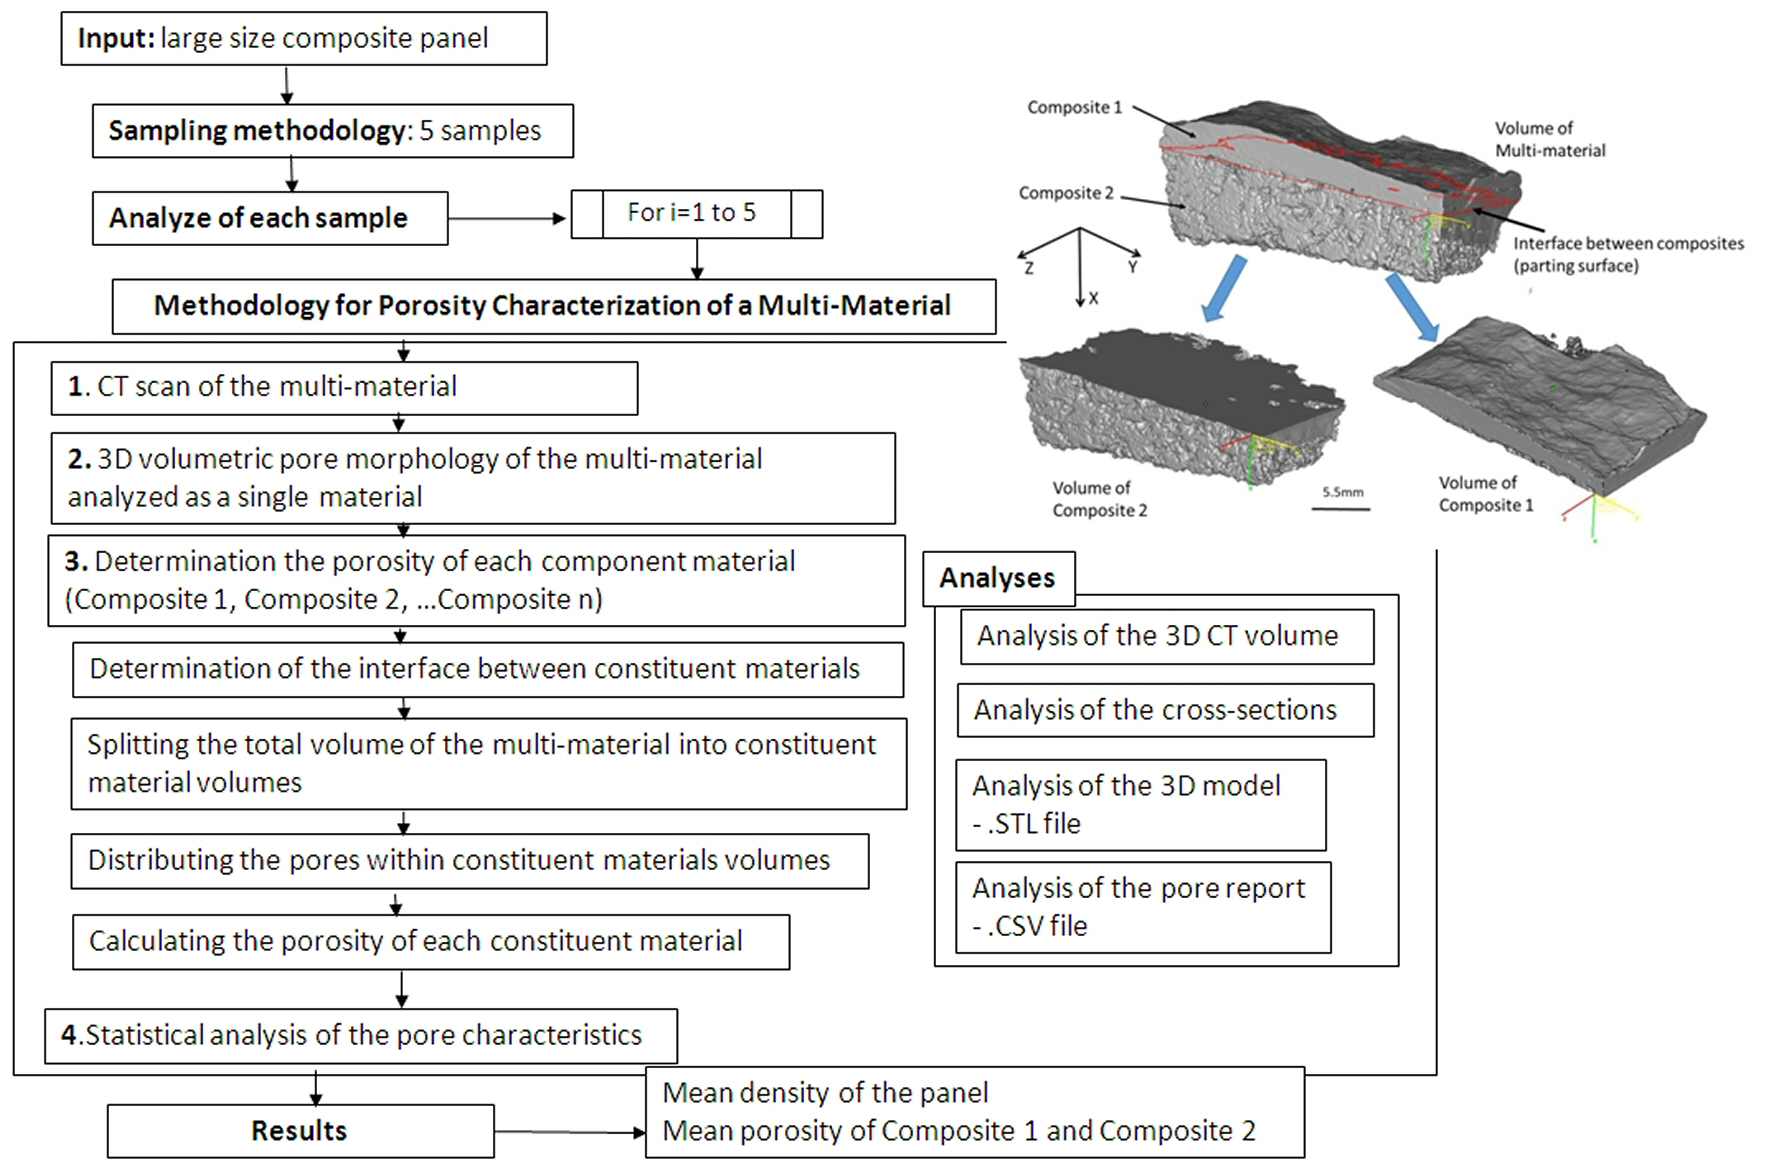
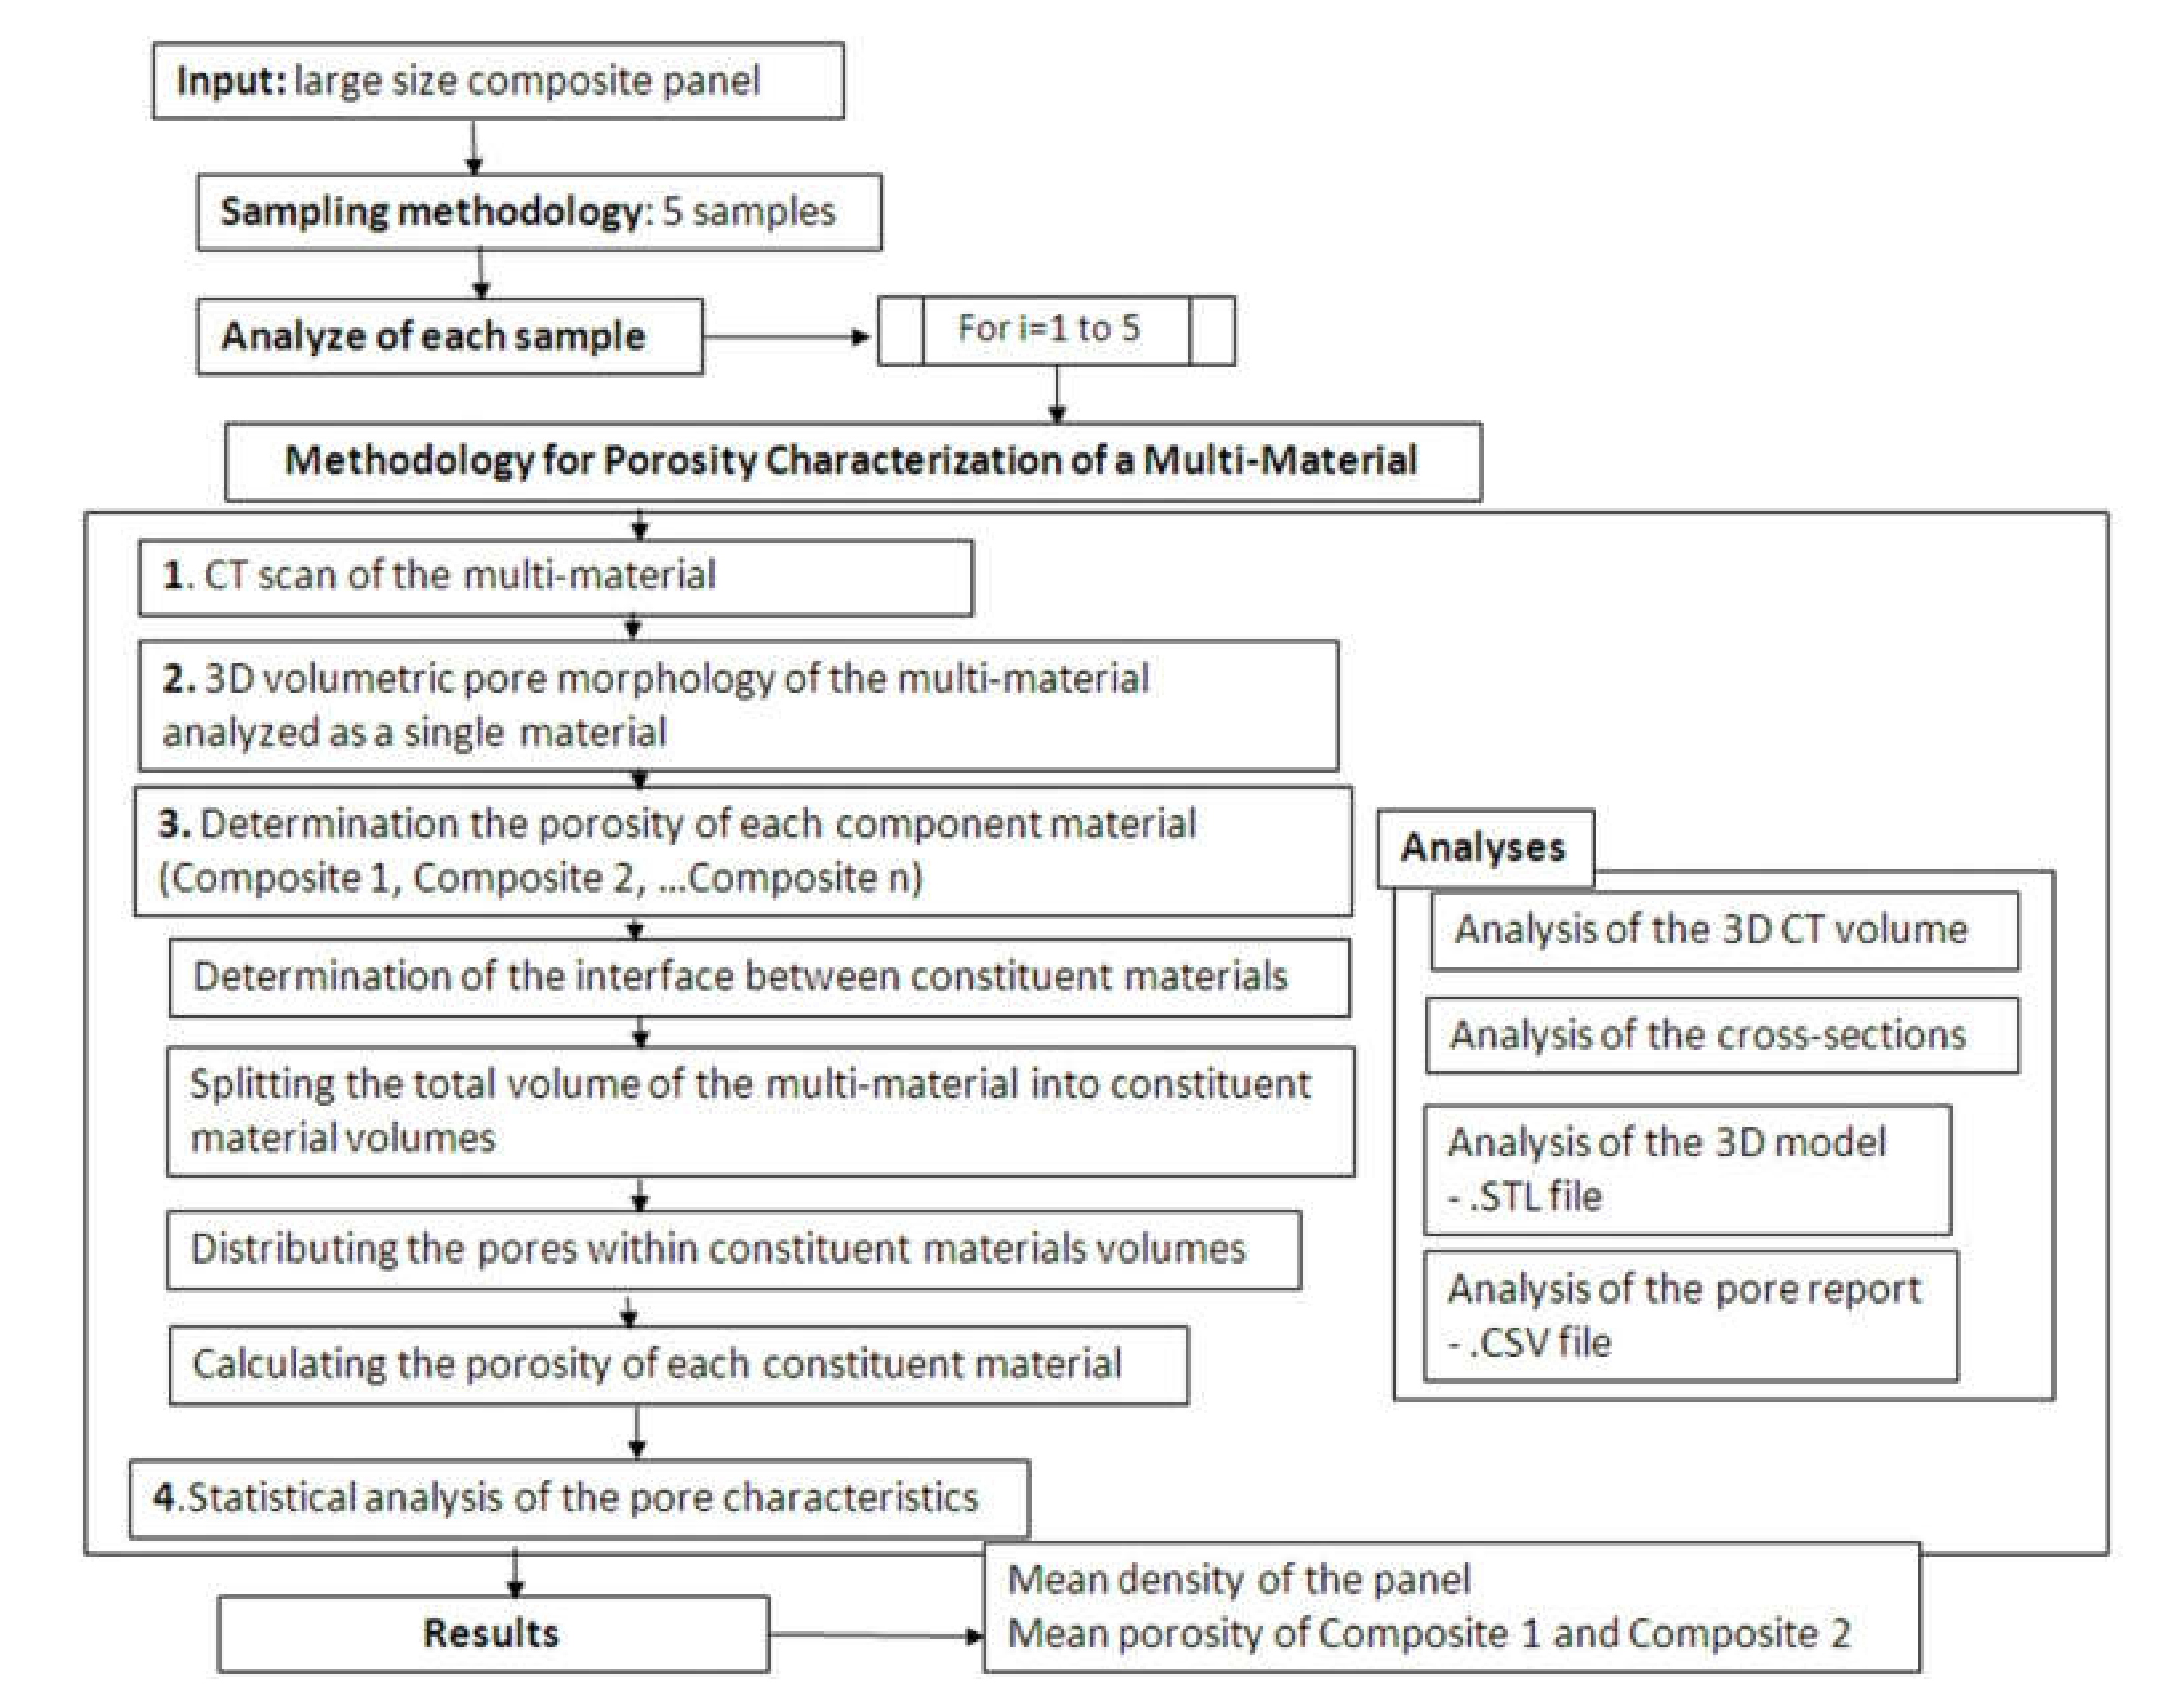
2.2. Method for Determining the Porosity of a Large Size Panel Comprised of a Novel Multi-Material Composite

Using a METROTOM 1500 machine (Carl Zeiss Industrielle Messtechnik GmbH, Oberkochen, Germany), all samples mounted on a polystyrene support were CT scanned based on the layout shown in the panoramic picture from Figure 4a. The source detector distance of this industrial CT machine is 1500 mm and the measuring range is limited to Ø300 × 350 mm. The CT measurement conditions are shown in Table 1. The mass of all the samples were determined using a precision scale, as is shown in Figure 4b.
A new methodology for porosity analysis of a large panel comprised of a multi-material composite based on 3D X-ray computed tomography is proposed (Figure 5). This methodology consists of the following main steps:
  • CT scan of polymer concrete composite samples;
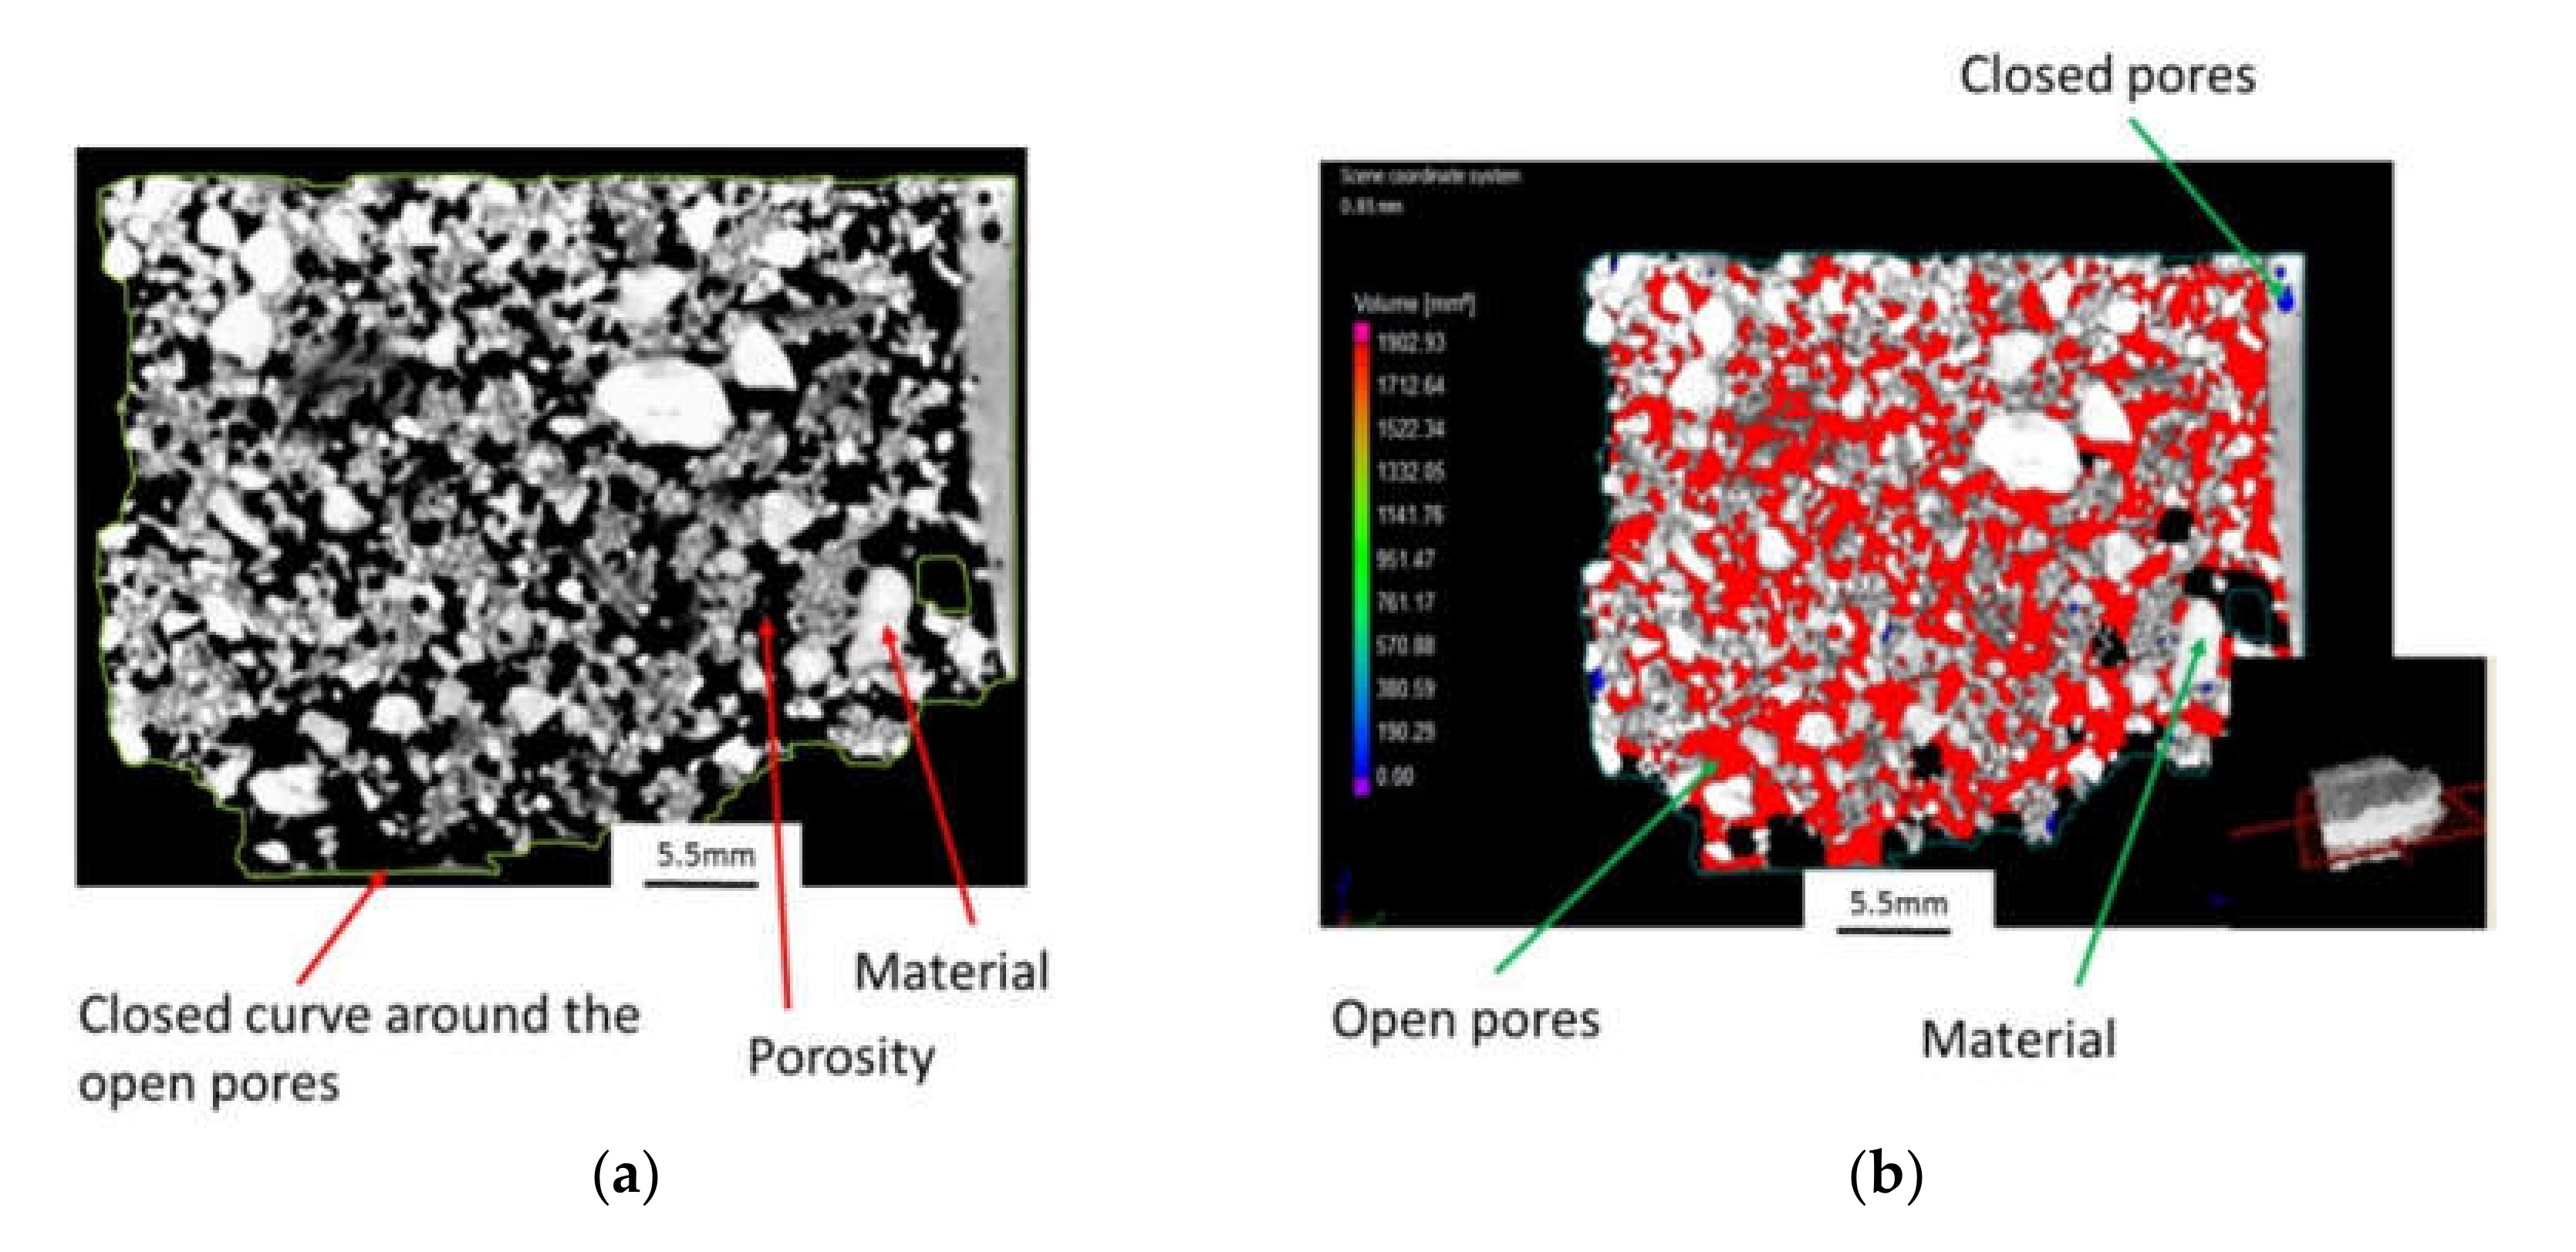
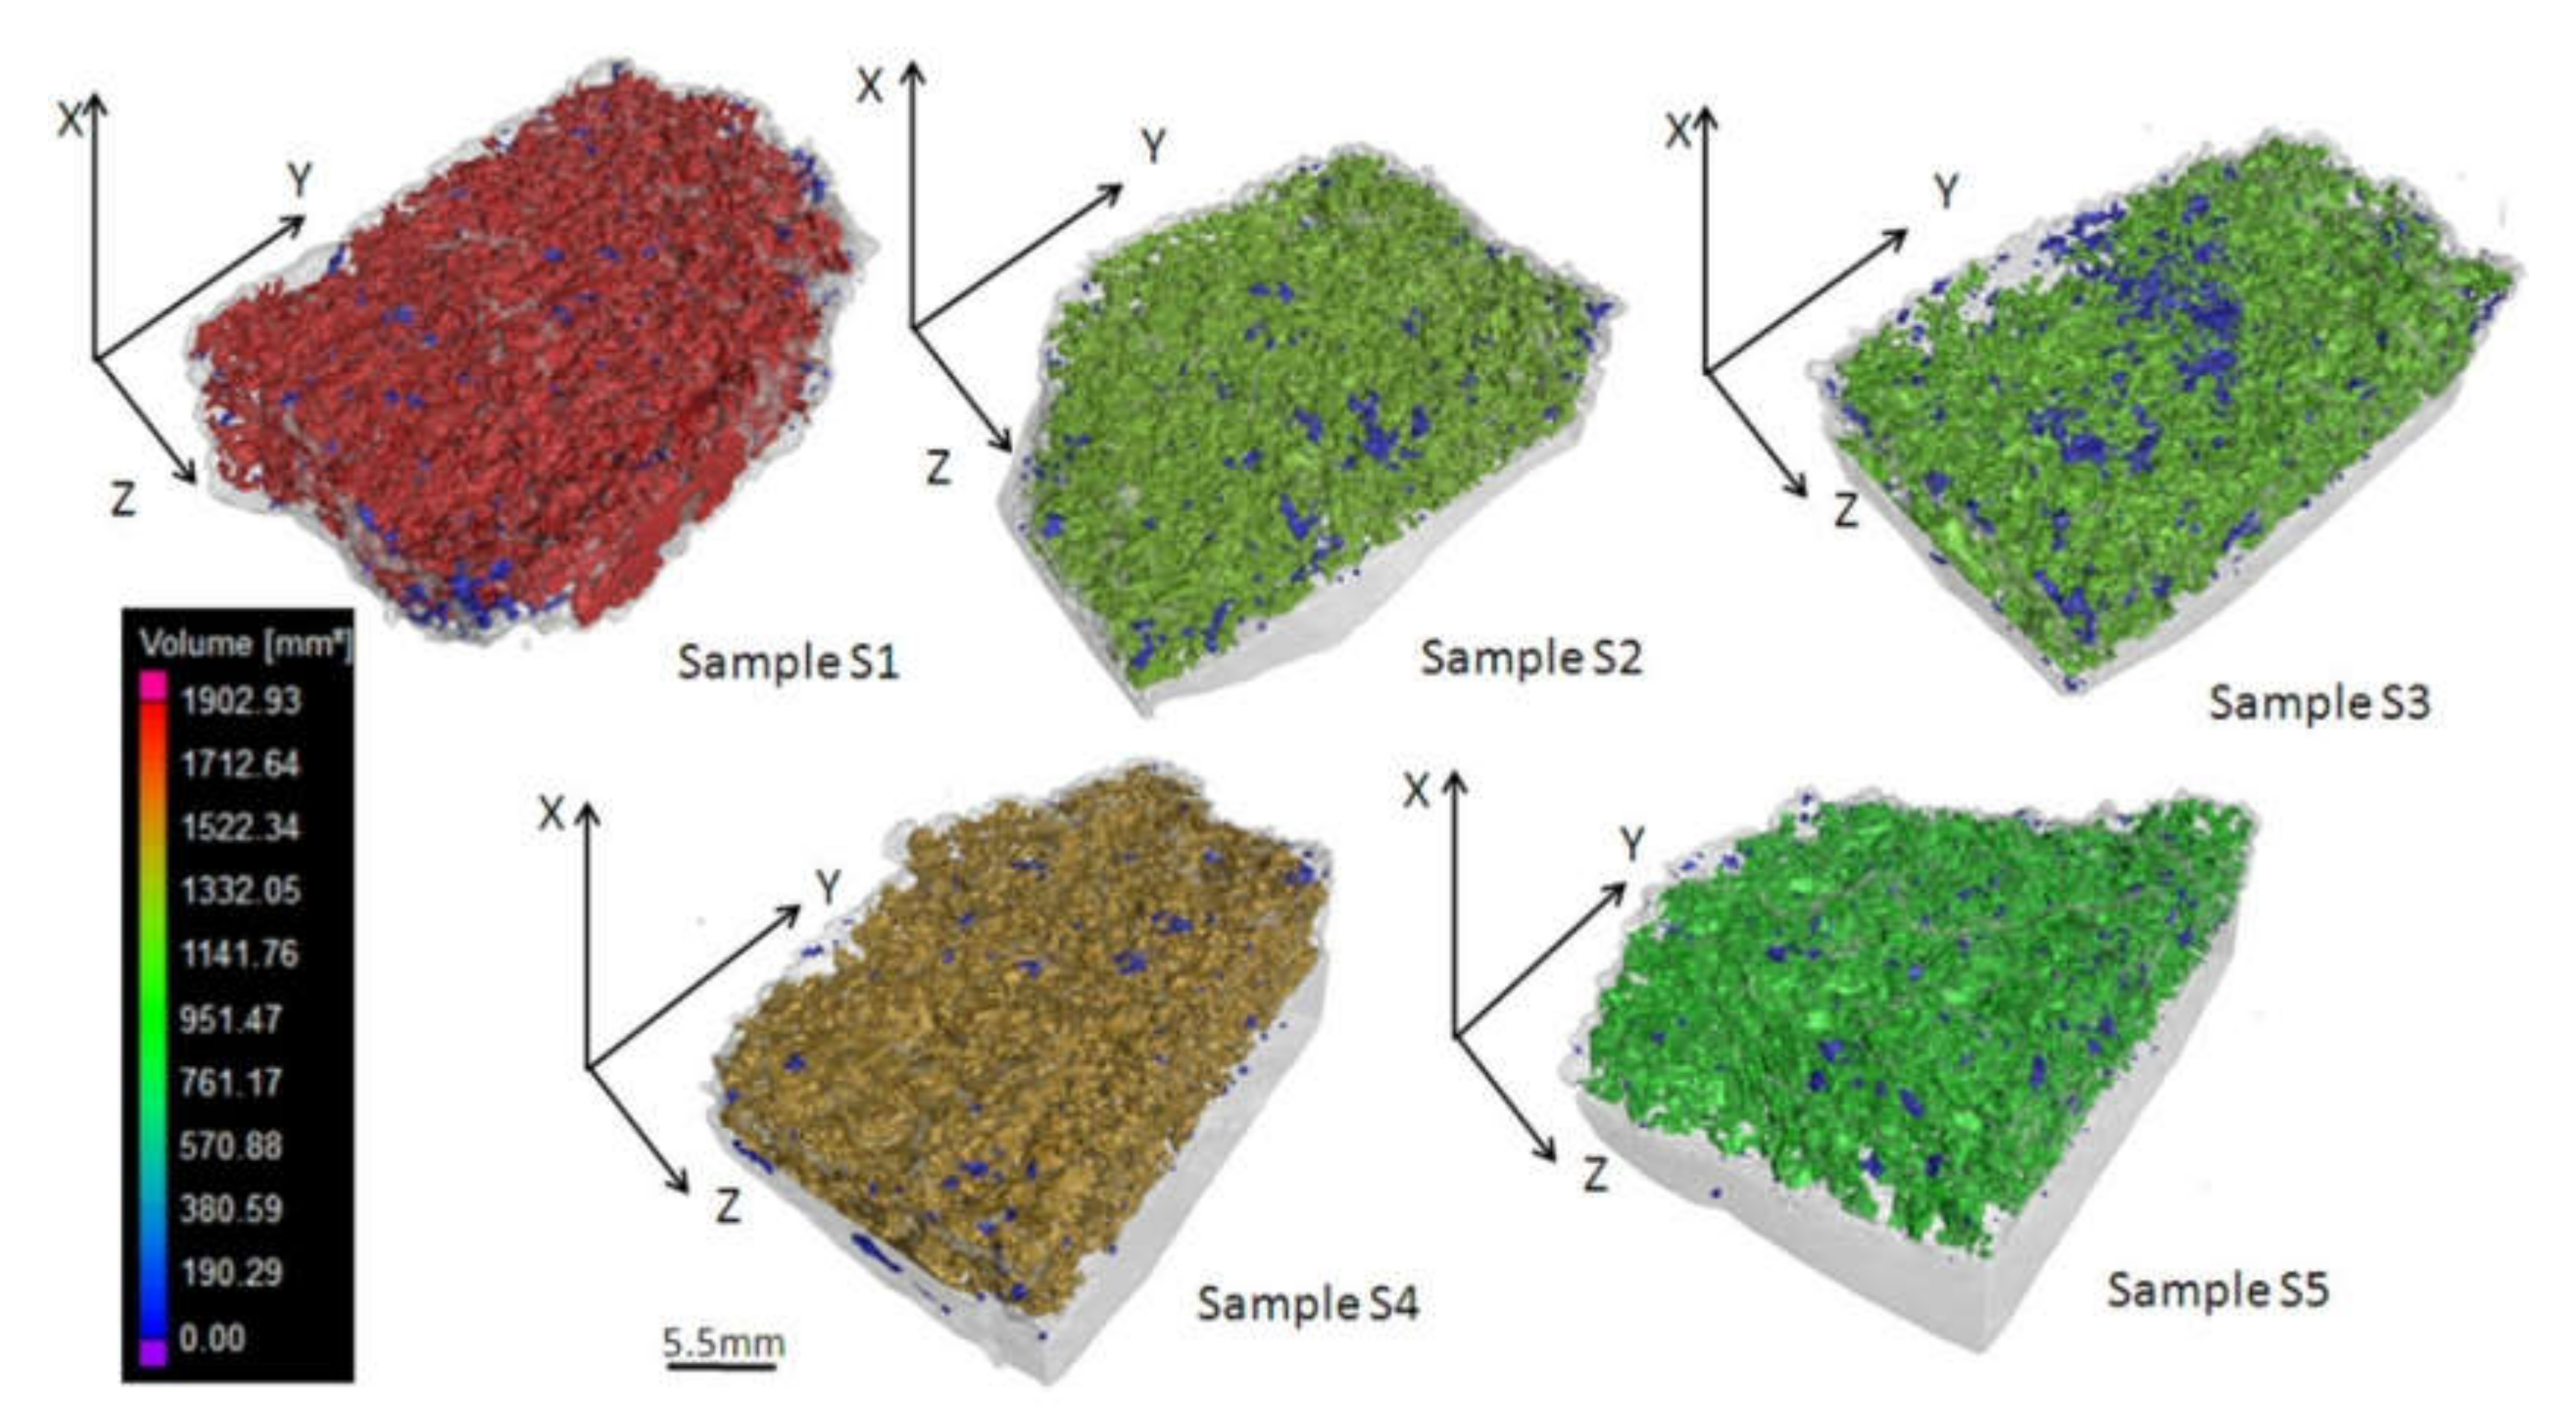
  • A 3D volumetric pore morphology of the multi-material composite analyzed as a single material;
  • Determination of the porosity of each component material;
  • Statistical analysis of pore characteristics.
During the second step of the methodology, the voxel volumes were obtained by reconstruction of the projections performed using Metrotom OS software (Carl Zeiss Industrielle Messtechnik GmbH, Oberkochen, Germany). Using VGStudio Max v3.0 software (Volume Graphics GmbH, Heidelberg, Germany), 3D volumetric pore morphology information was assigned [29] using the porosity and inclusion analysis modules. Each voxel has a gray value intensity that corresponds to the material density [23], where the surface of the material is automatically determined by gray values analysis, with air shown in black and materials are in white [20].
The composite part is prepared for pore morphology analysis by closing the pores, as an open porosity reading was detected previously. A 3D region of interest (ROI) was then created. The VGDefx defect detection algorithm (only threshold) [29] was used for porosity analysis, where the algorithm’s main input parameters were set as follows: noise reduction—“high”; probability criterion—“size”; probability threshold—“1”; and minimum size volume—“0.01 mm3”. The probability threshold represents the certainty of a pore indeed being a pore and not an artifact [29]. The analysis provides characteristics of all pores from the analyzed ROI, of which the pore analysis report contains information about the position, size, surface, and volume of each pore. The results of the pores’ characteristics are saved as customizable test reports in a comma-separated values (CSV) file. The 3D model of the CT scan data was then exported as stereolithography (STL) mesh data for rapid engineering.
The porosity of the composite material can then be calculated using VGStudio Max v3.0, being defined as the ratio of the total volume of pores to the volume of the ROI [29]. However, the porosity of each component material cannot be determined separately using the software.
In the third phase of the proposed methodology, the porosities of each component material of the multi-material composite were determined. The separate analysis of each component material splits the total volume of the multi-material and the information regarding the pores for each constituent material. The porosity of each component material (composite 1 and composite 2) of the multi-material was determined based on a new methodology, consisting of the following steps (Figure 5):
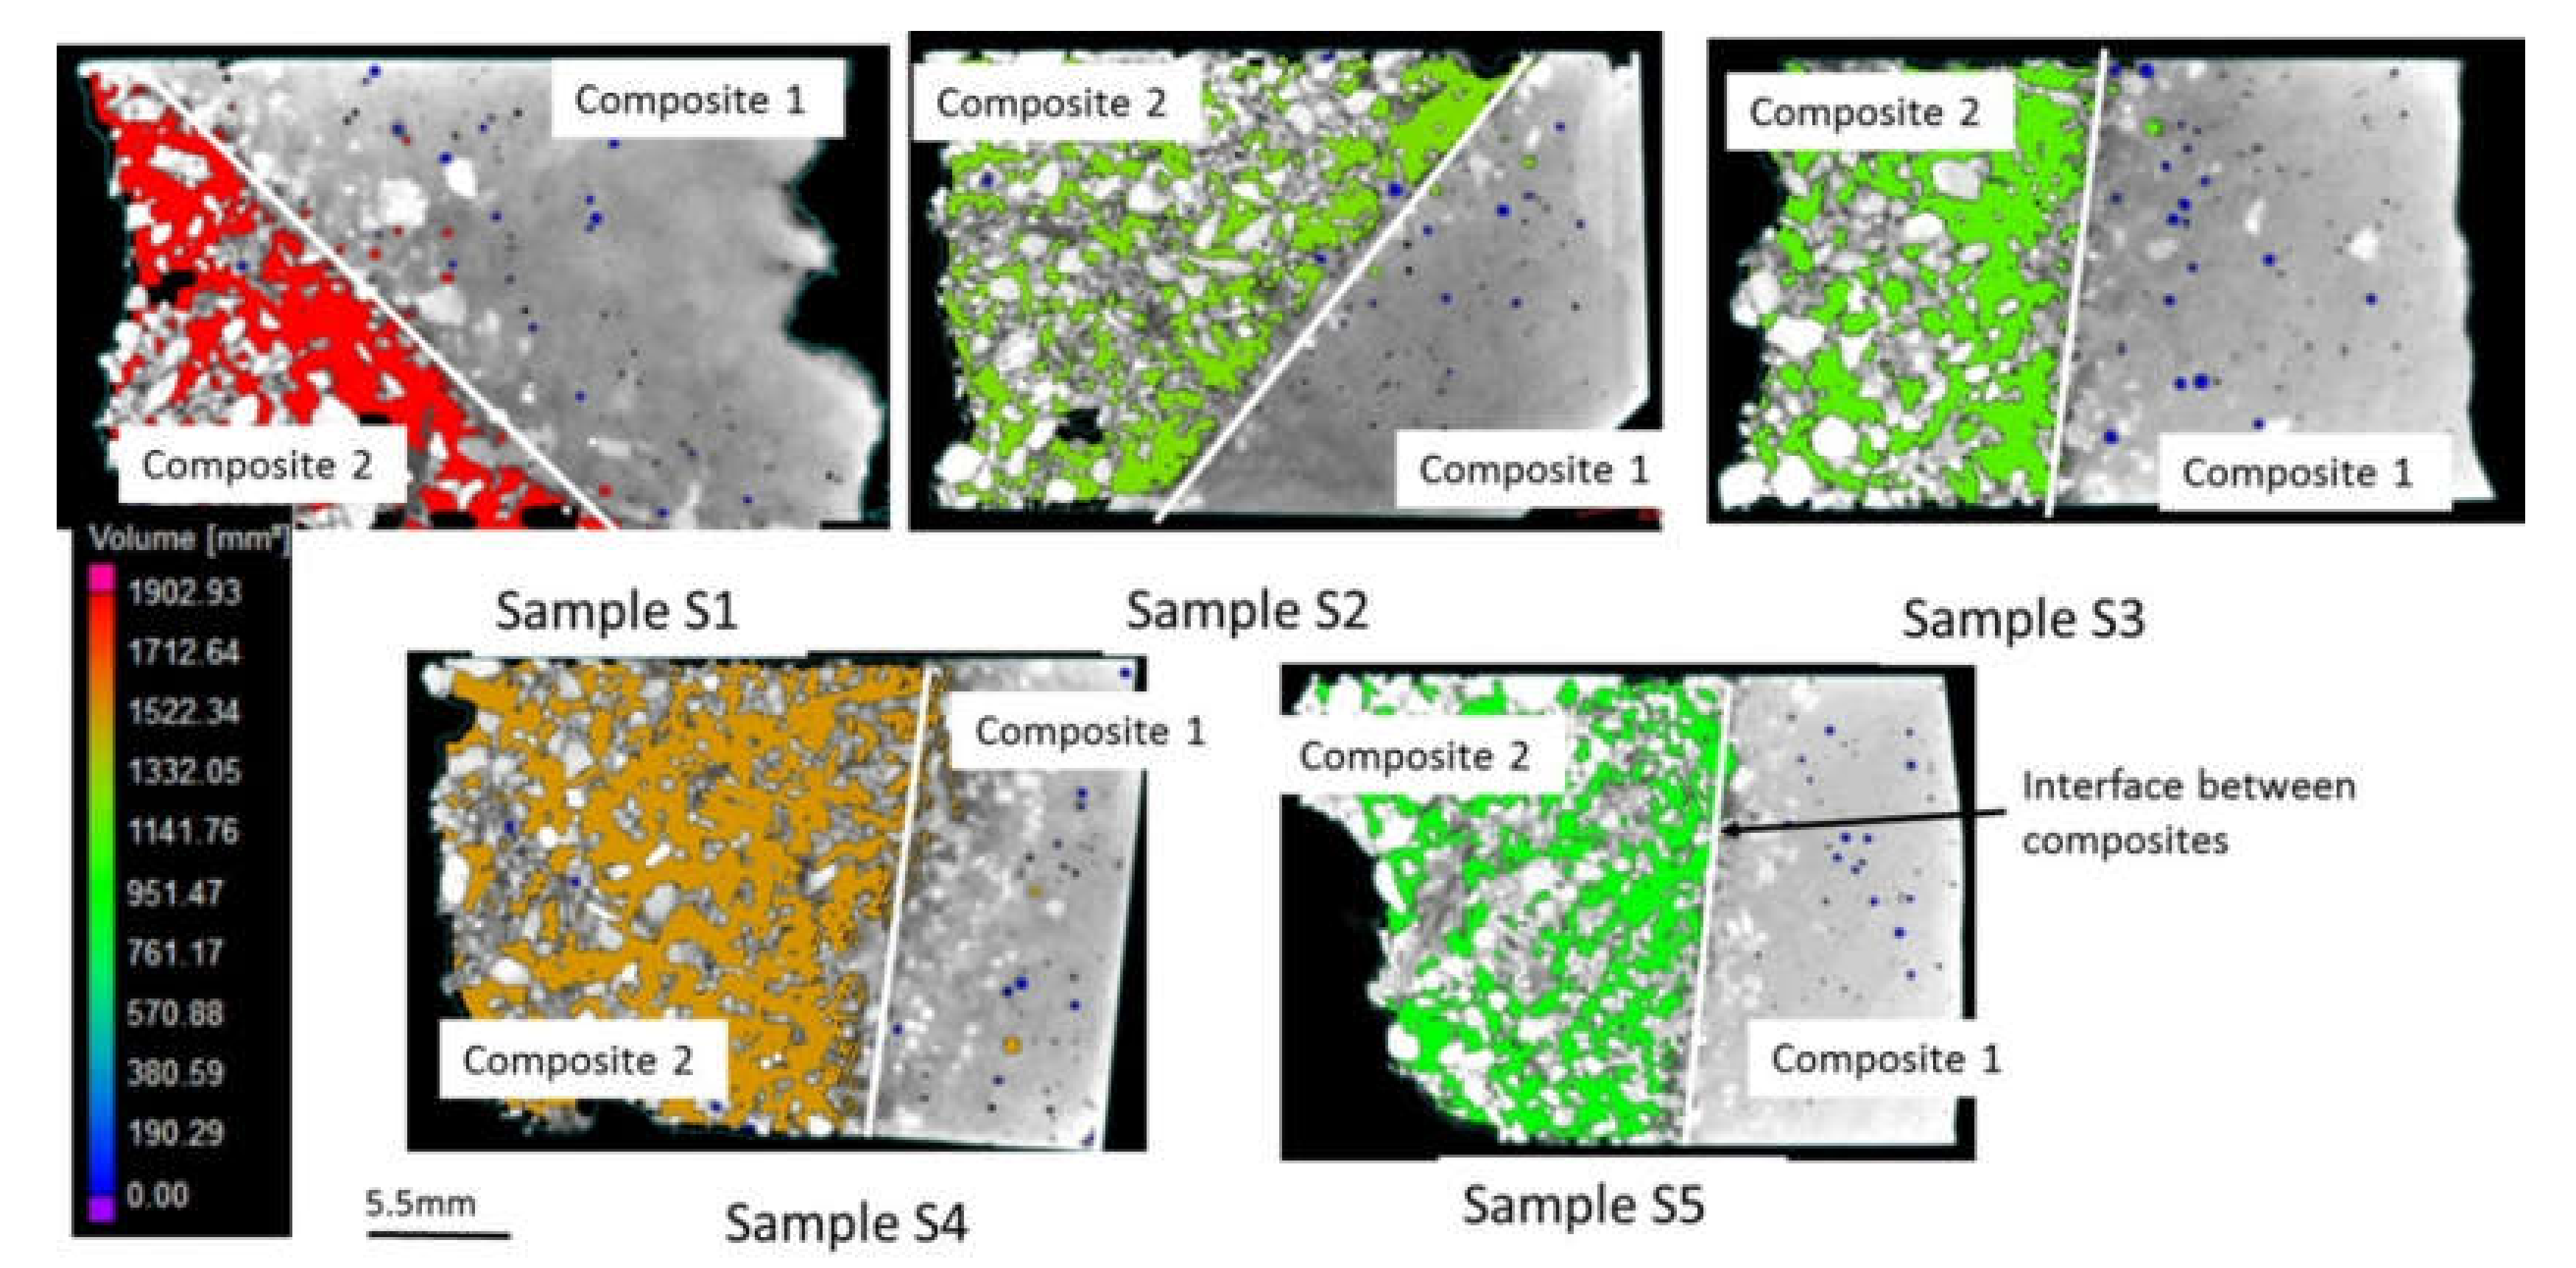
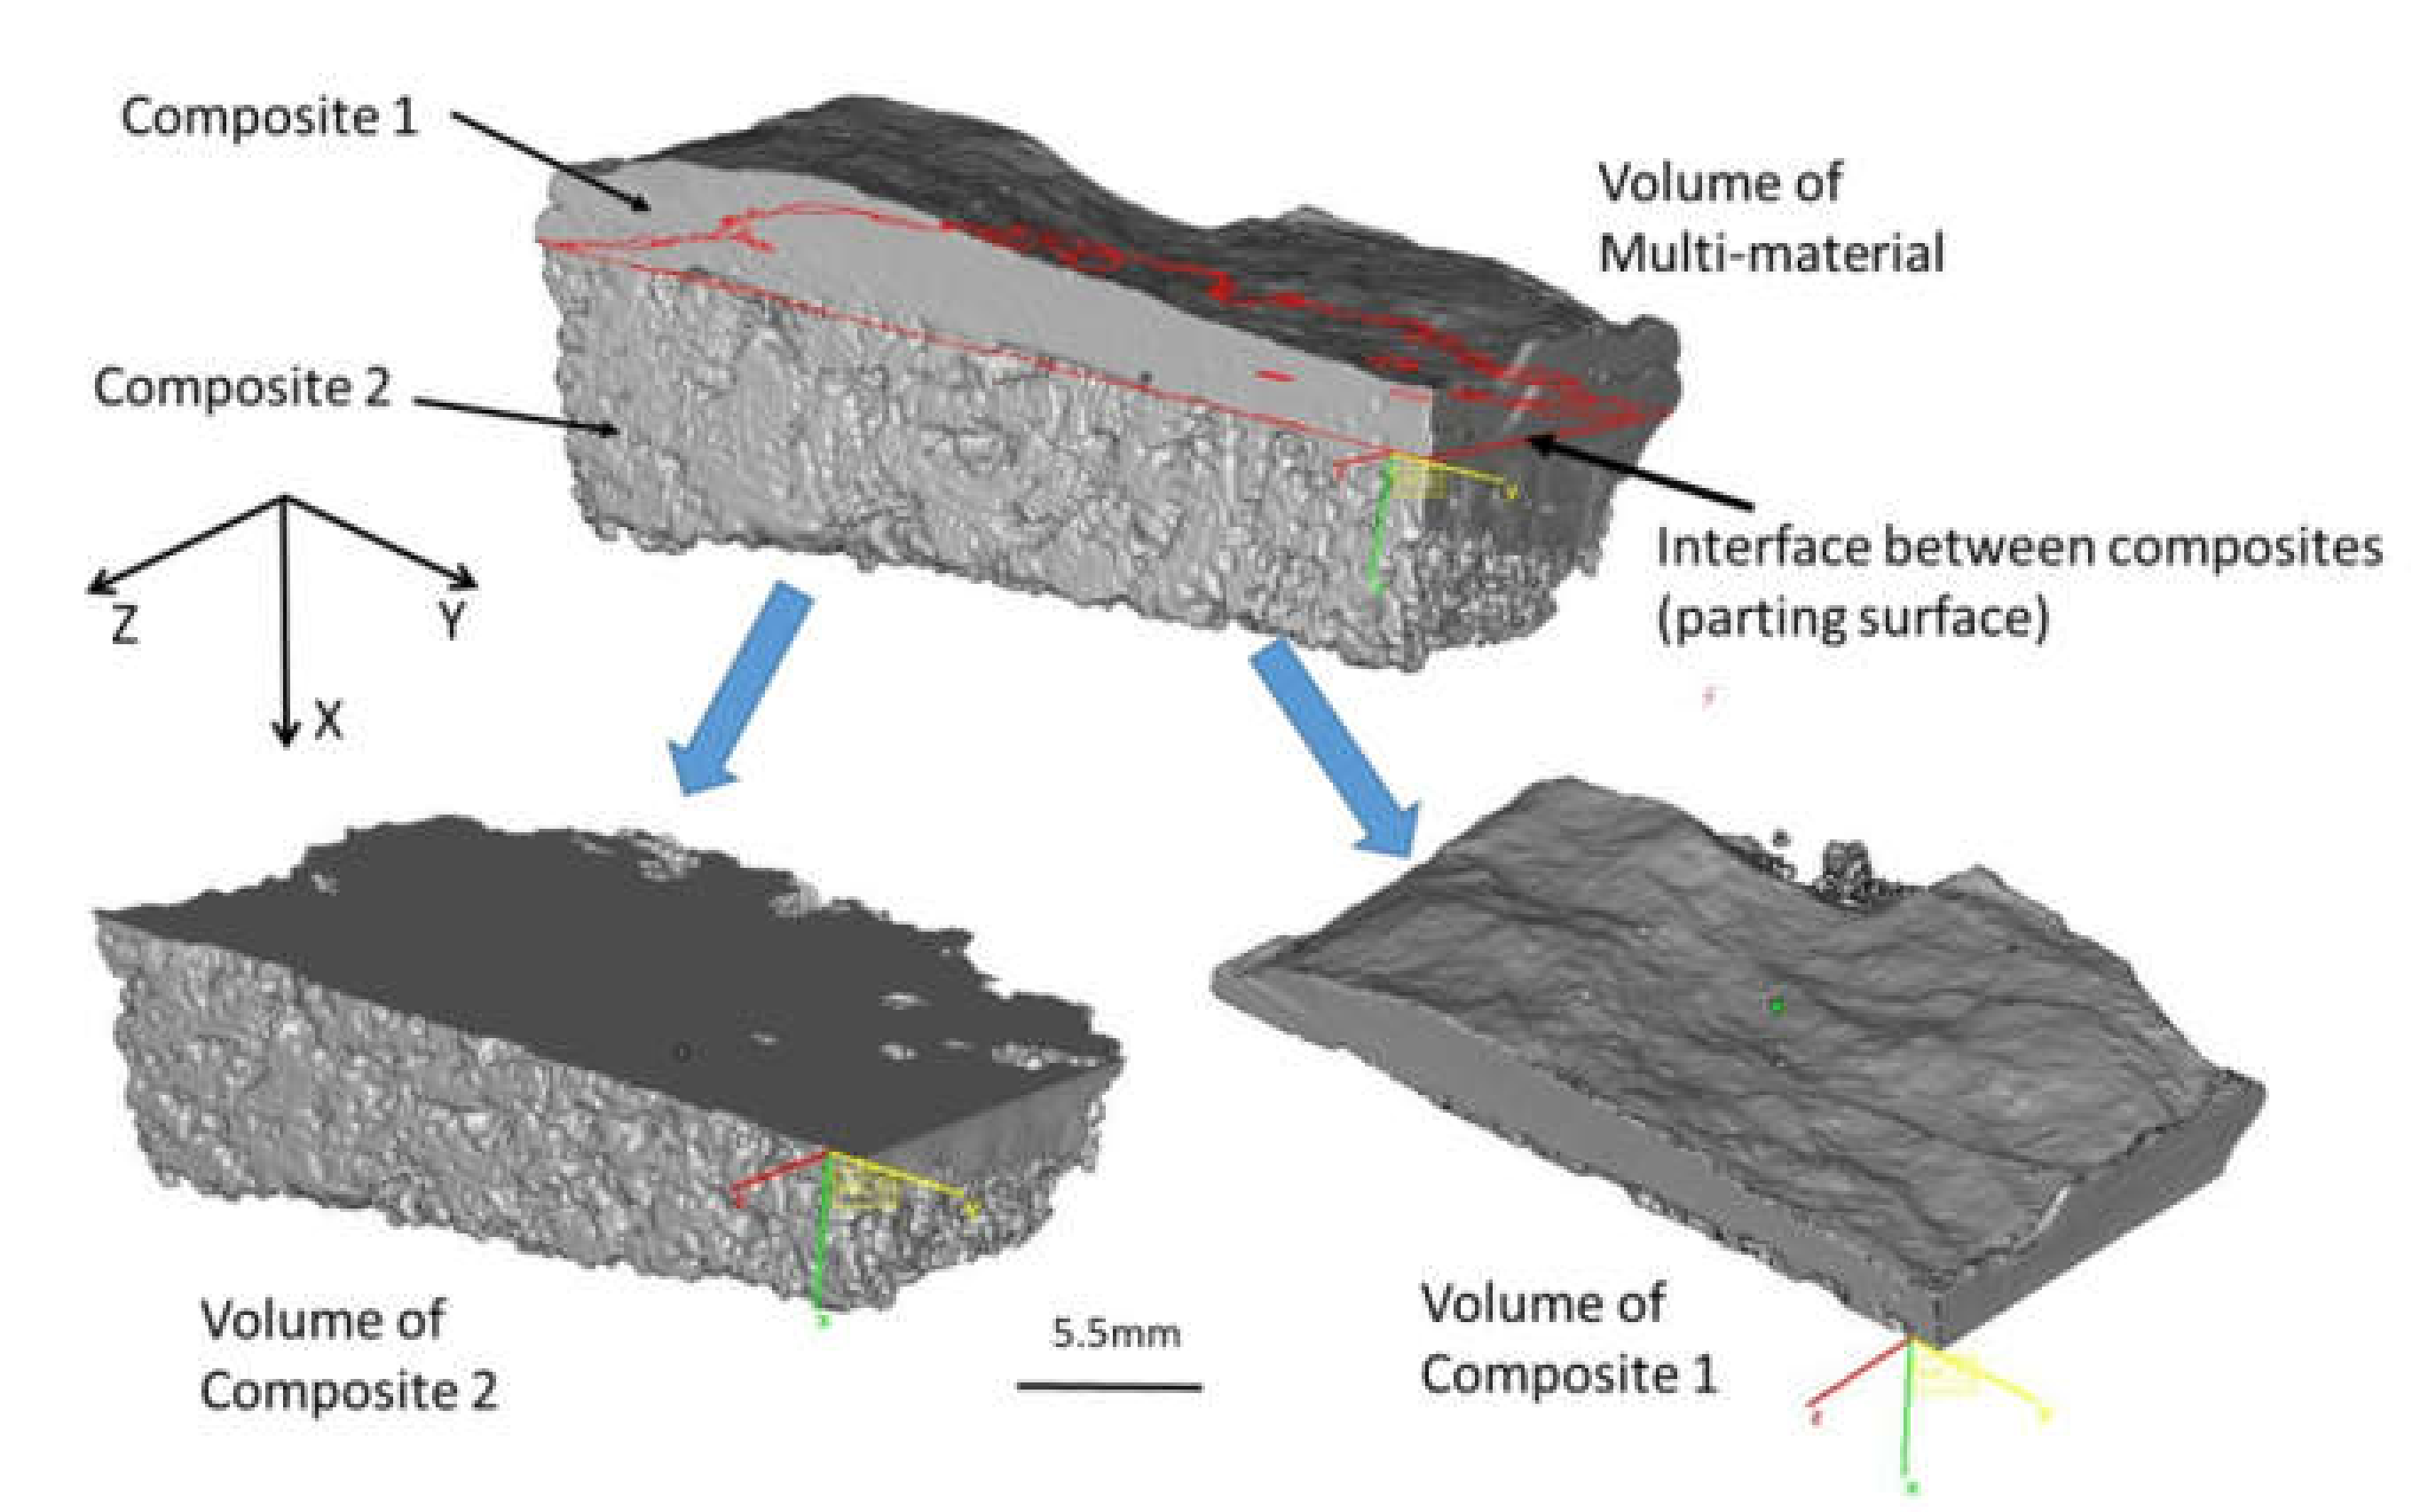
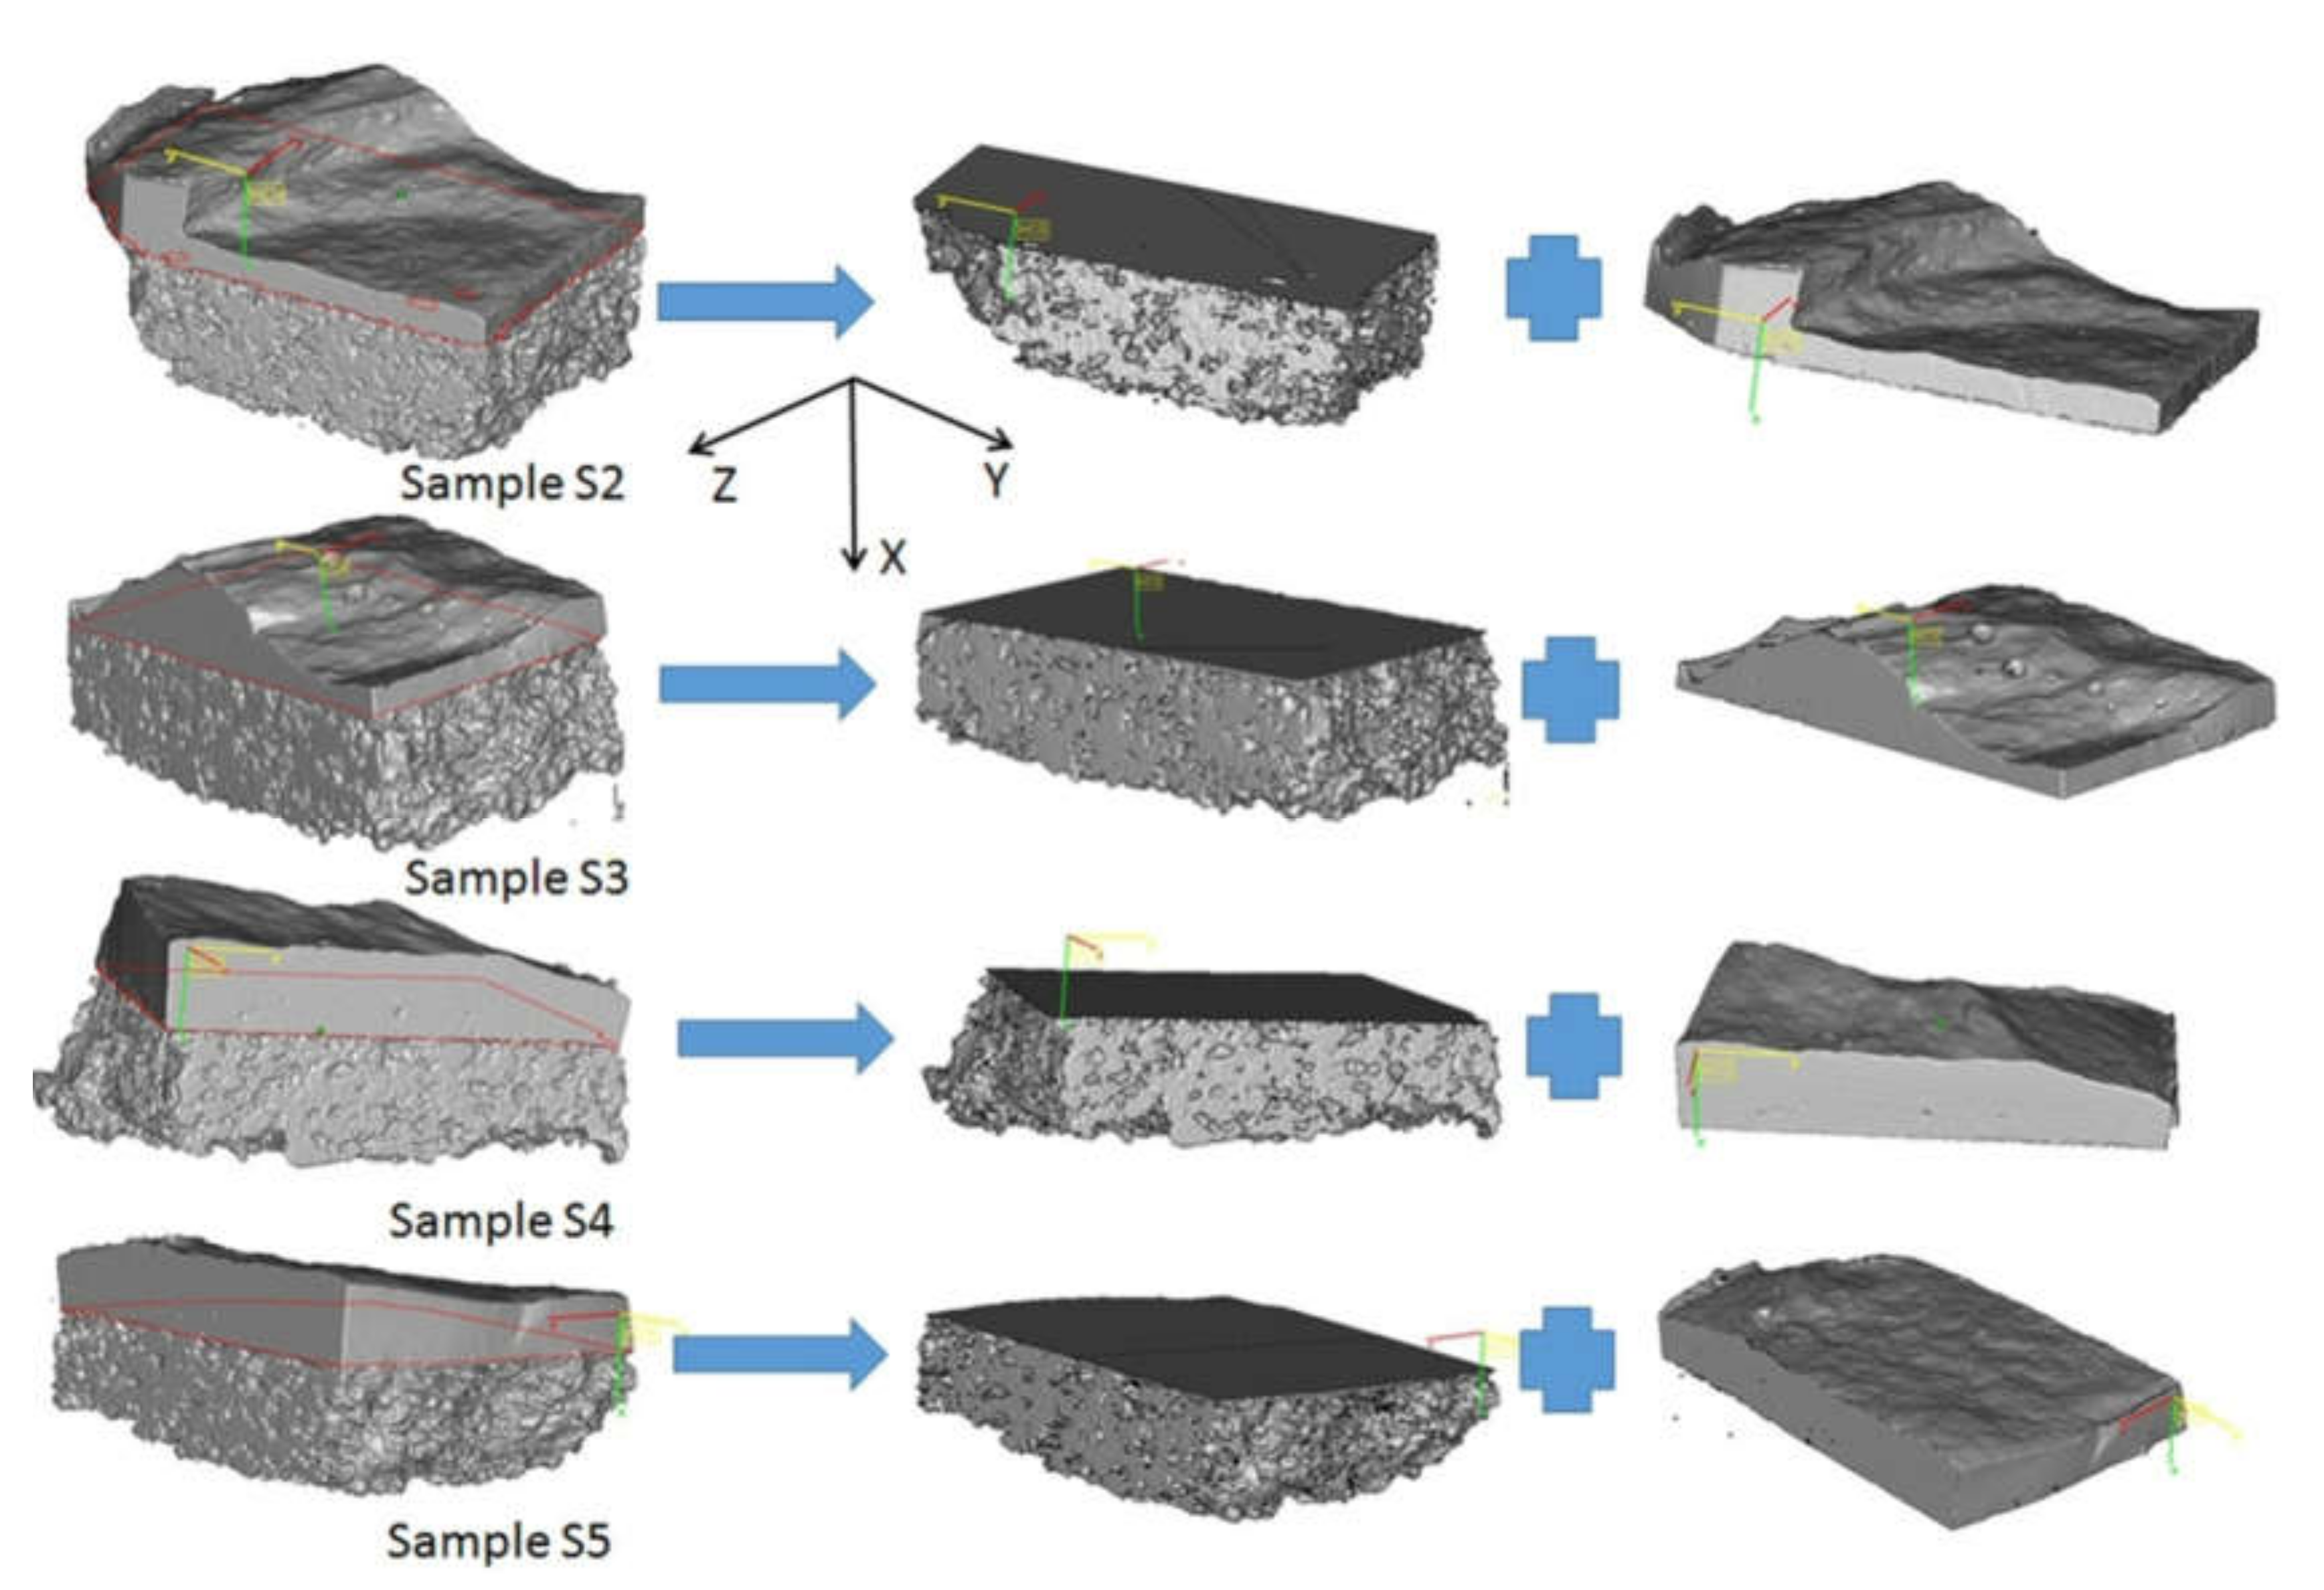
  • Determination of the interface between the constituent materials;
  • Splitting the total volume of the multi-material into constituent material volumes;
  • Distributing the pores within the constituent material volumes;
  • Calculating the porosity of each constituent material.
The interface between constituent materials can be estimated by analyzing the 3D STL model of the multi-material gathered from CT analysis. Magics Software (Materialise, Leuven, Belgium) was used to analyze the STL file for all samples. A parting surface between component materials (composite 1 and composite 2) was then determined. After this, the multi-material volume was split into individual component material volumes, where the volume of each component material was calculated. For this report, it is assumed that the parting surface between composites 1 and 2 can be approximated with a planar surface. The position of the aforementioned planar surface was determined relative to a coordinate system retrieved from the 3D model of the CT scanned part. The procedure regarding the distribution of the pores between constituent material volumes was based on the “smallest to largest” sorting, using the Z-coordinates of the CT pore characteristics stored within the CSV file, which were read using Microsoft Excel software. Using the Z threshold position of the parting surfaces, the excel table was then split into two tables containing the pore morphology information of each component material (composites 1 and 2).
A statistical analysis was then performed to find the distribution, size, and shape of the pores within both composite materials, using the Minitab 17 software (Minitab Ltd., Coventry, UK) [30].
Two different microscopic analyses were carried out to investigate both composite mixtures and their interface. Scanning electron microscopy (SEM) images were created based on the limits of both materials. A Jeol JSM 5510 LV (JEOL Ltd., Welwyn Garden City, U.K.) scanning electron microscope was used for morphology of the structure of this material.
Confirmatory experiments were then performed based on the manufacturing of panels 2 and 3, in similar conditions as the initial experiment (temperature, humidity, same raw materials), to provide validation for the conclusions drawn during the analysis phase and also to confirm a stable process [31].

2.3. Method for Determining the Panel Density

The Archimedes method [32] is commonly used to calculate the density of a part. The open porosity connected to the surface may lead to a large macro-pore that allows water penetration, resulting in a smaller observed part volume. Thus, in the case of open porosity parts, other density measurement methods should be used.
The density of the multi-material can be determined using the CT density method by calculating the volume of the multi-material using CT analysis, in addition to determining the multi-material mass using a precision scale. The CT density method of the large panels proposed within this paper consists of the following steps.
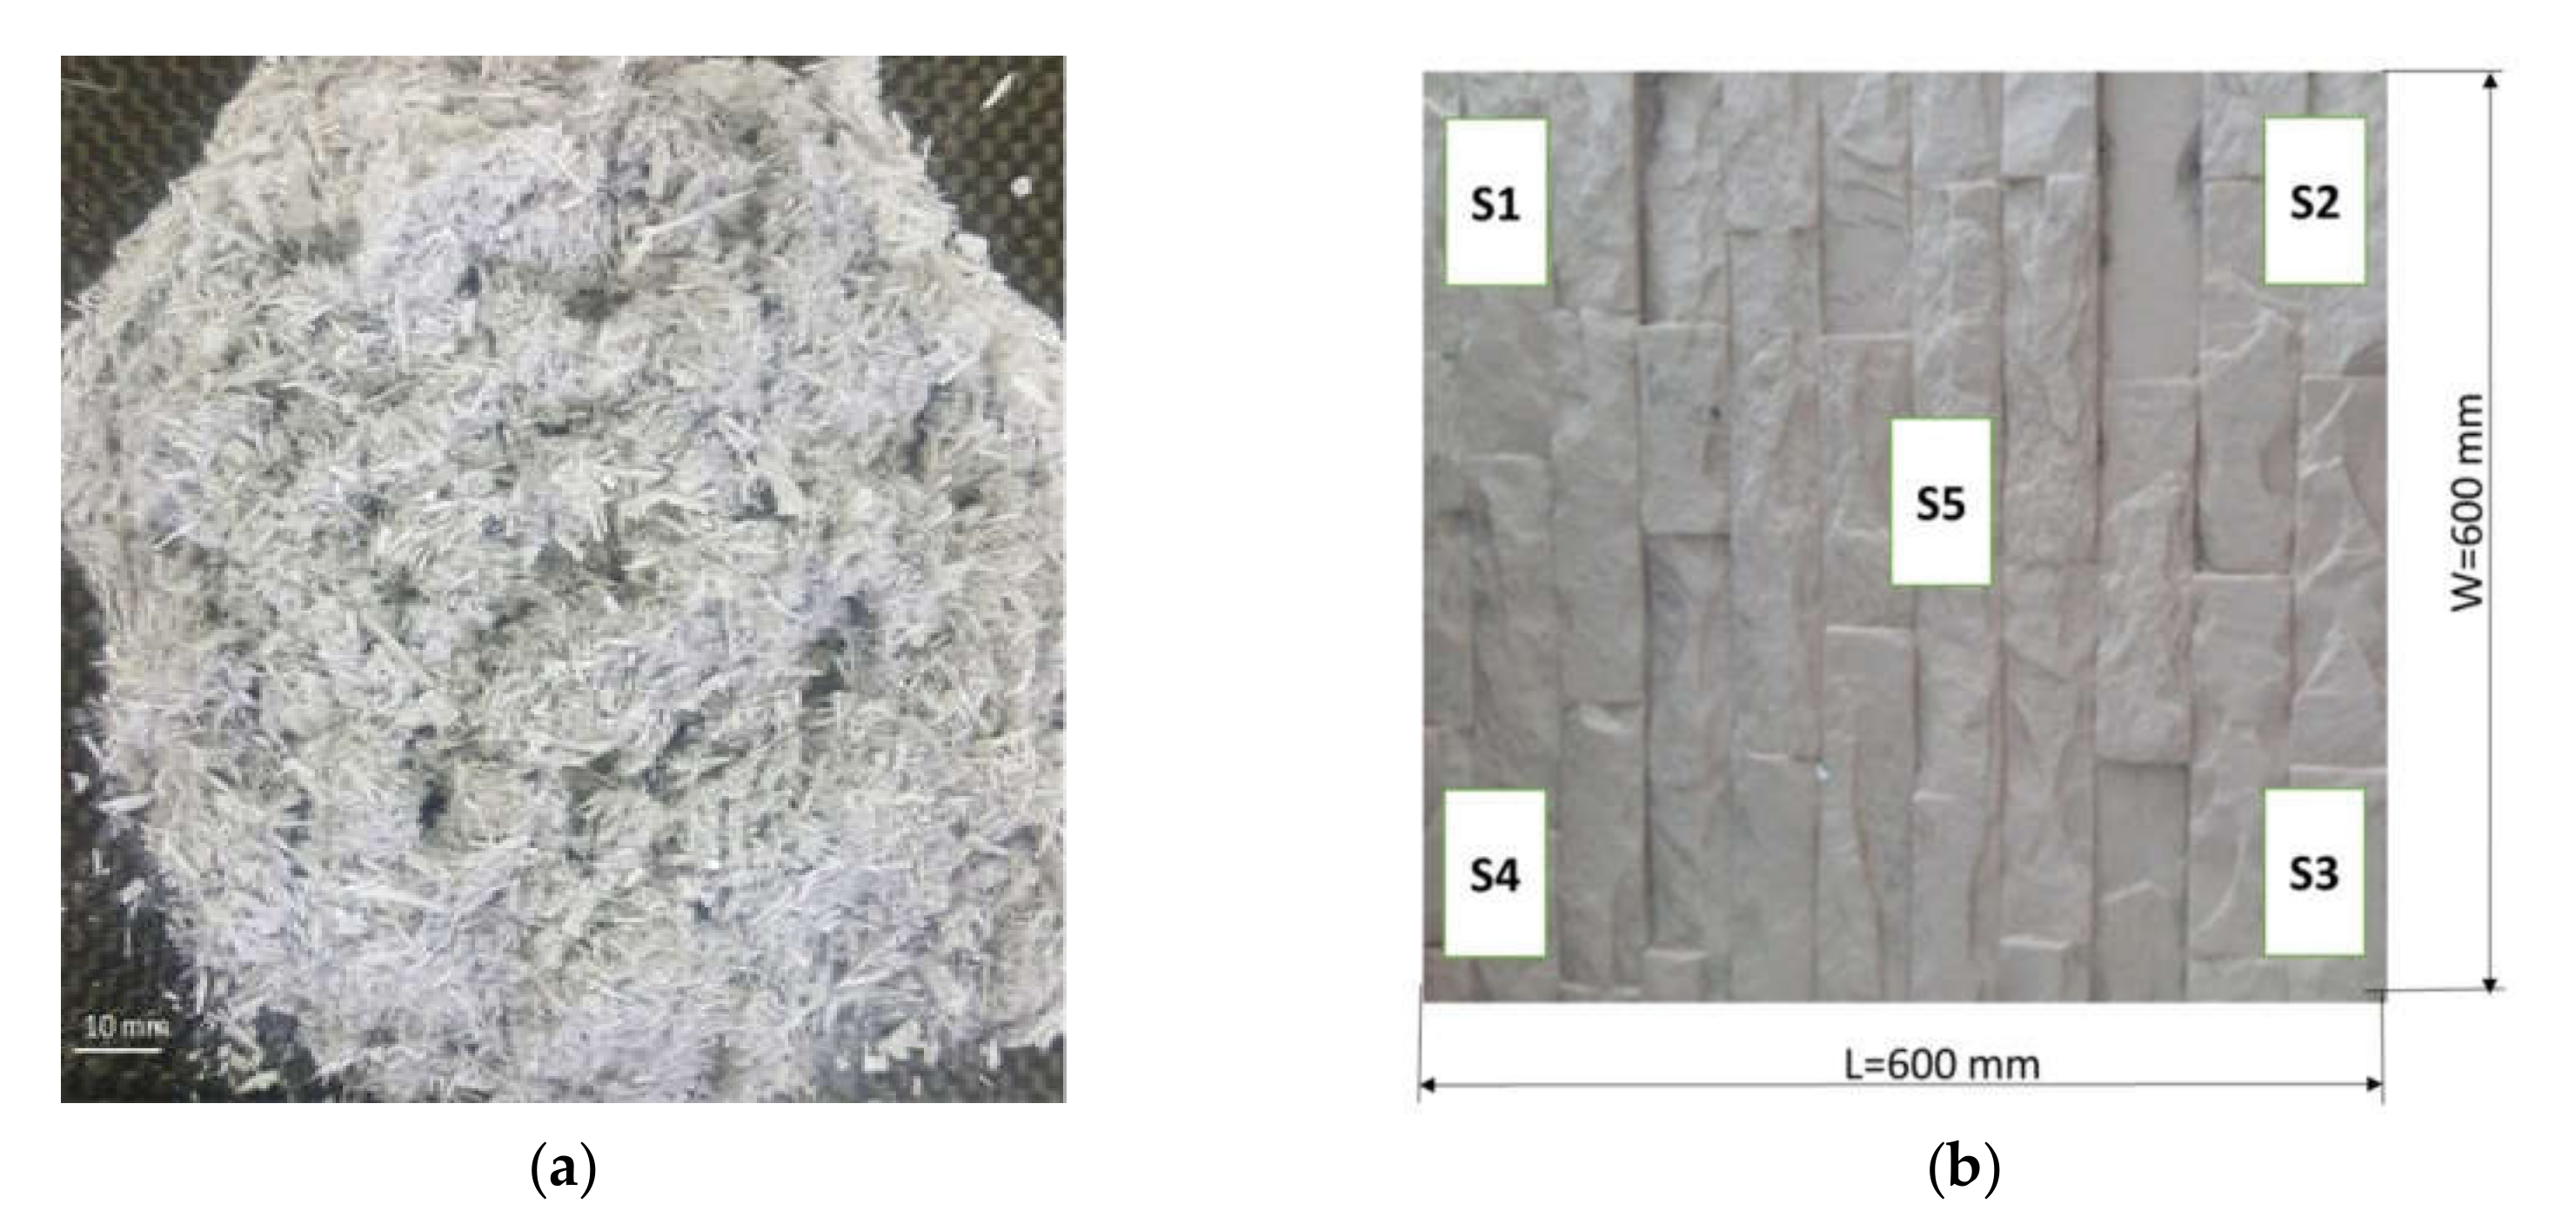
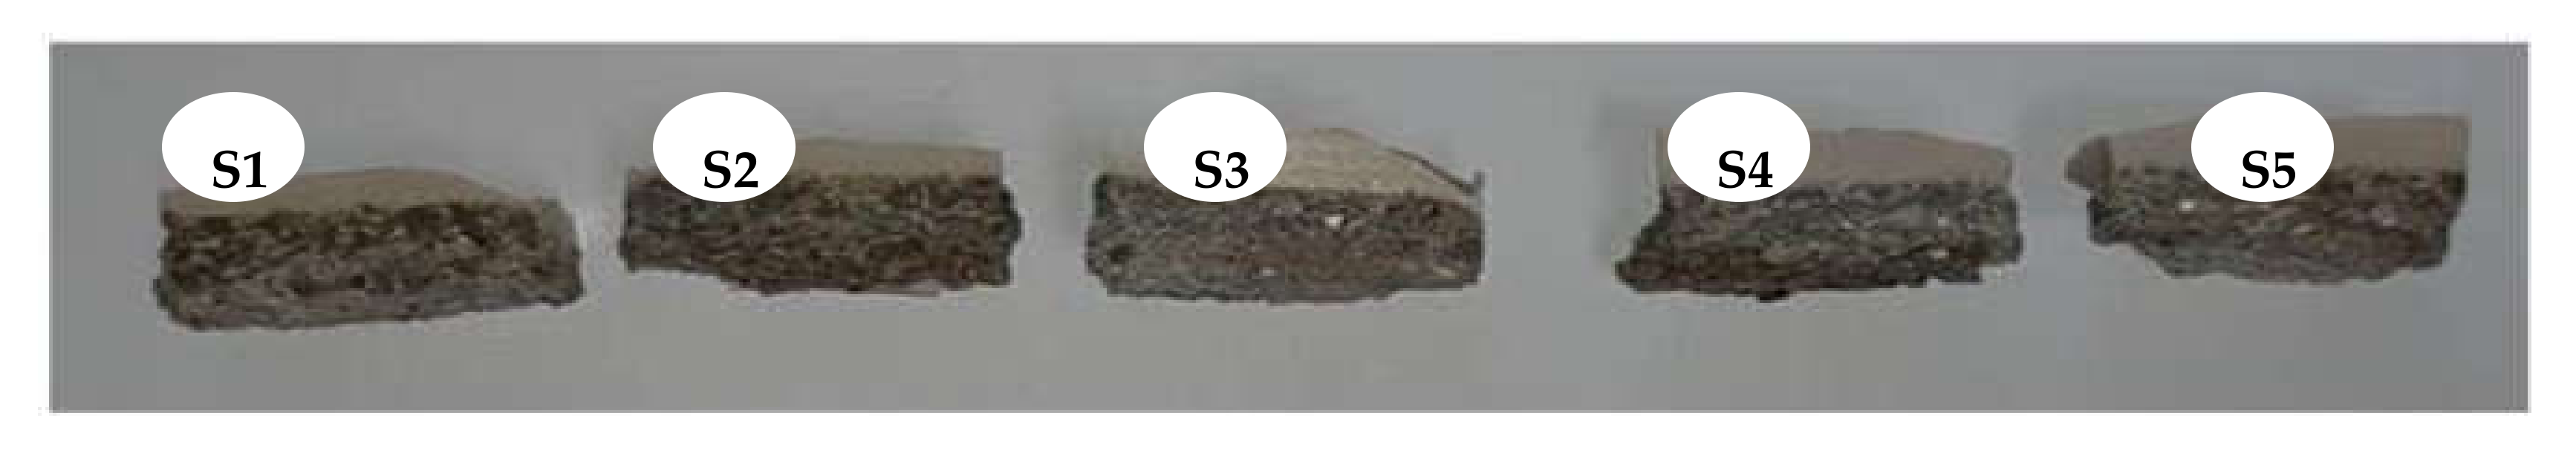
  • Using five samples from gathered from the large panel based on the sampling methodology:
  • Find the volumes of the samples using CT analysis;
  • Weigh the samples using a precision digital scale (Figure 4b);
  • Calculate the density of each sample;
  • Determine the mean density of the panel.

3. Results and Discussions

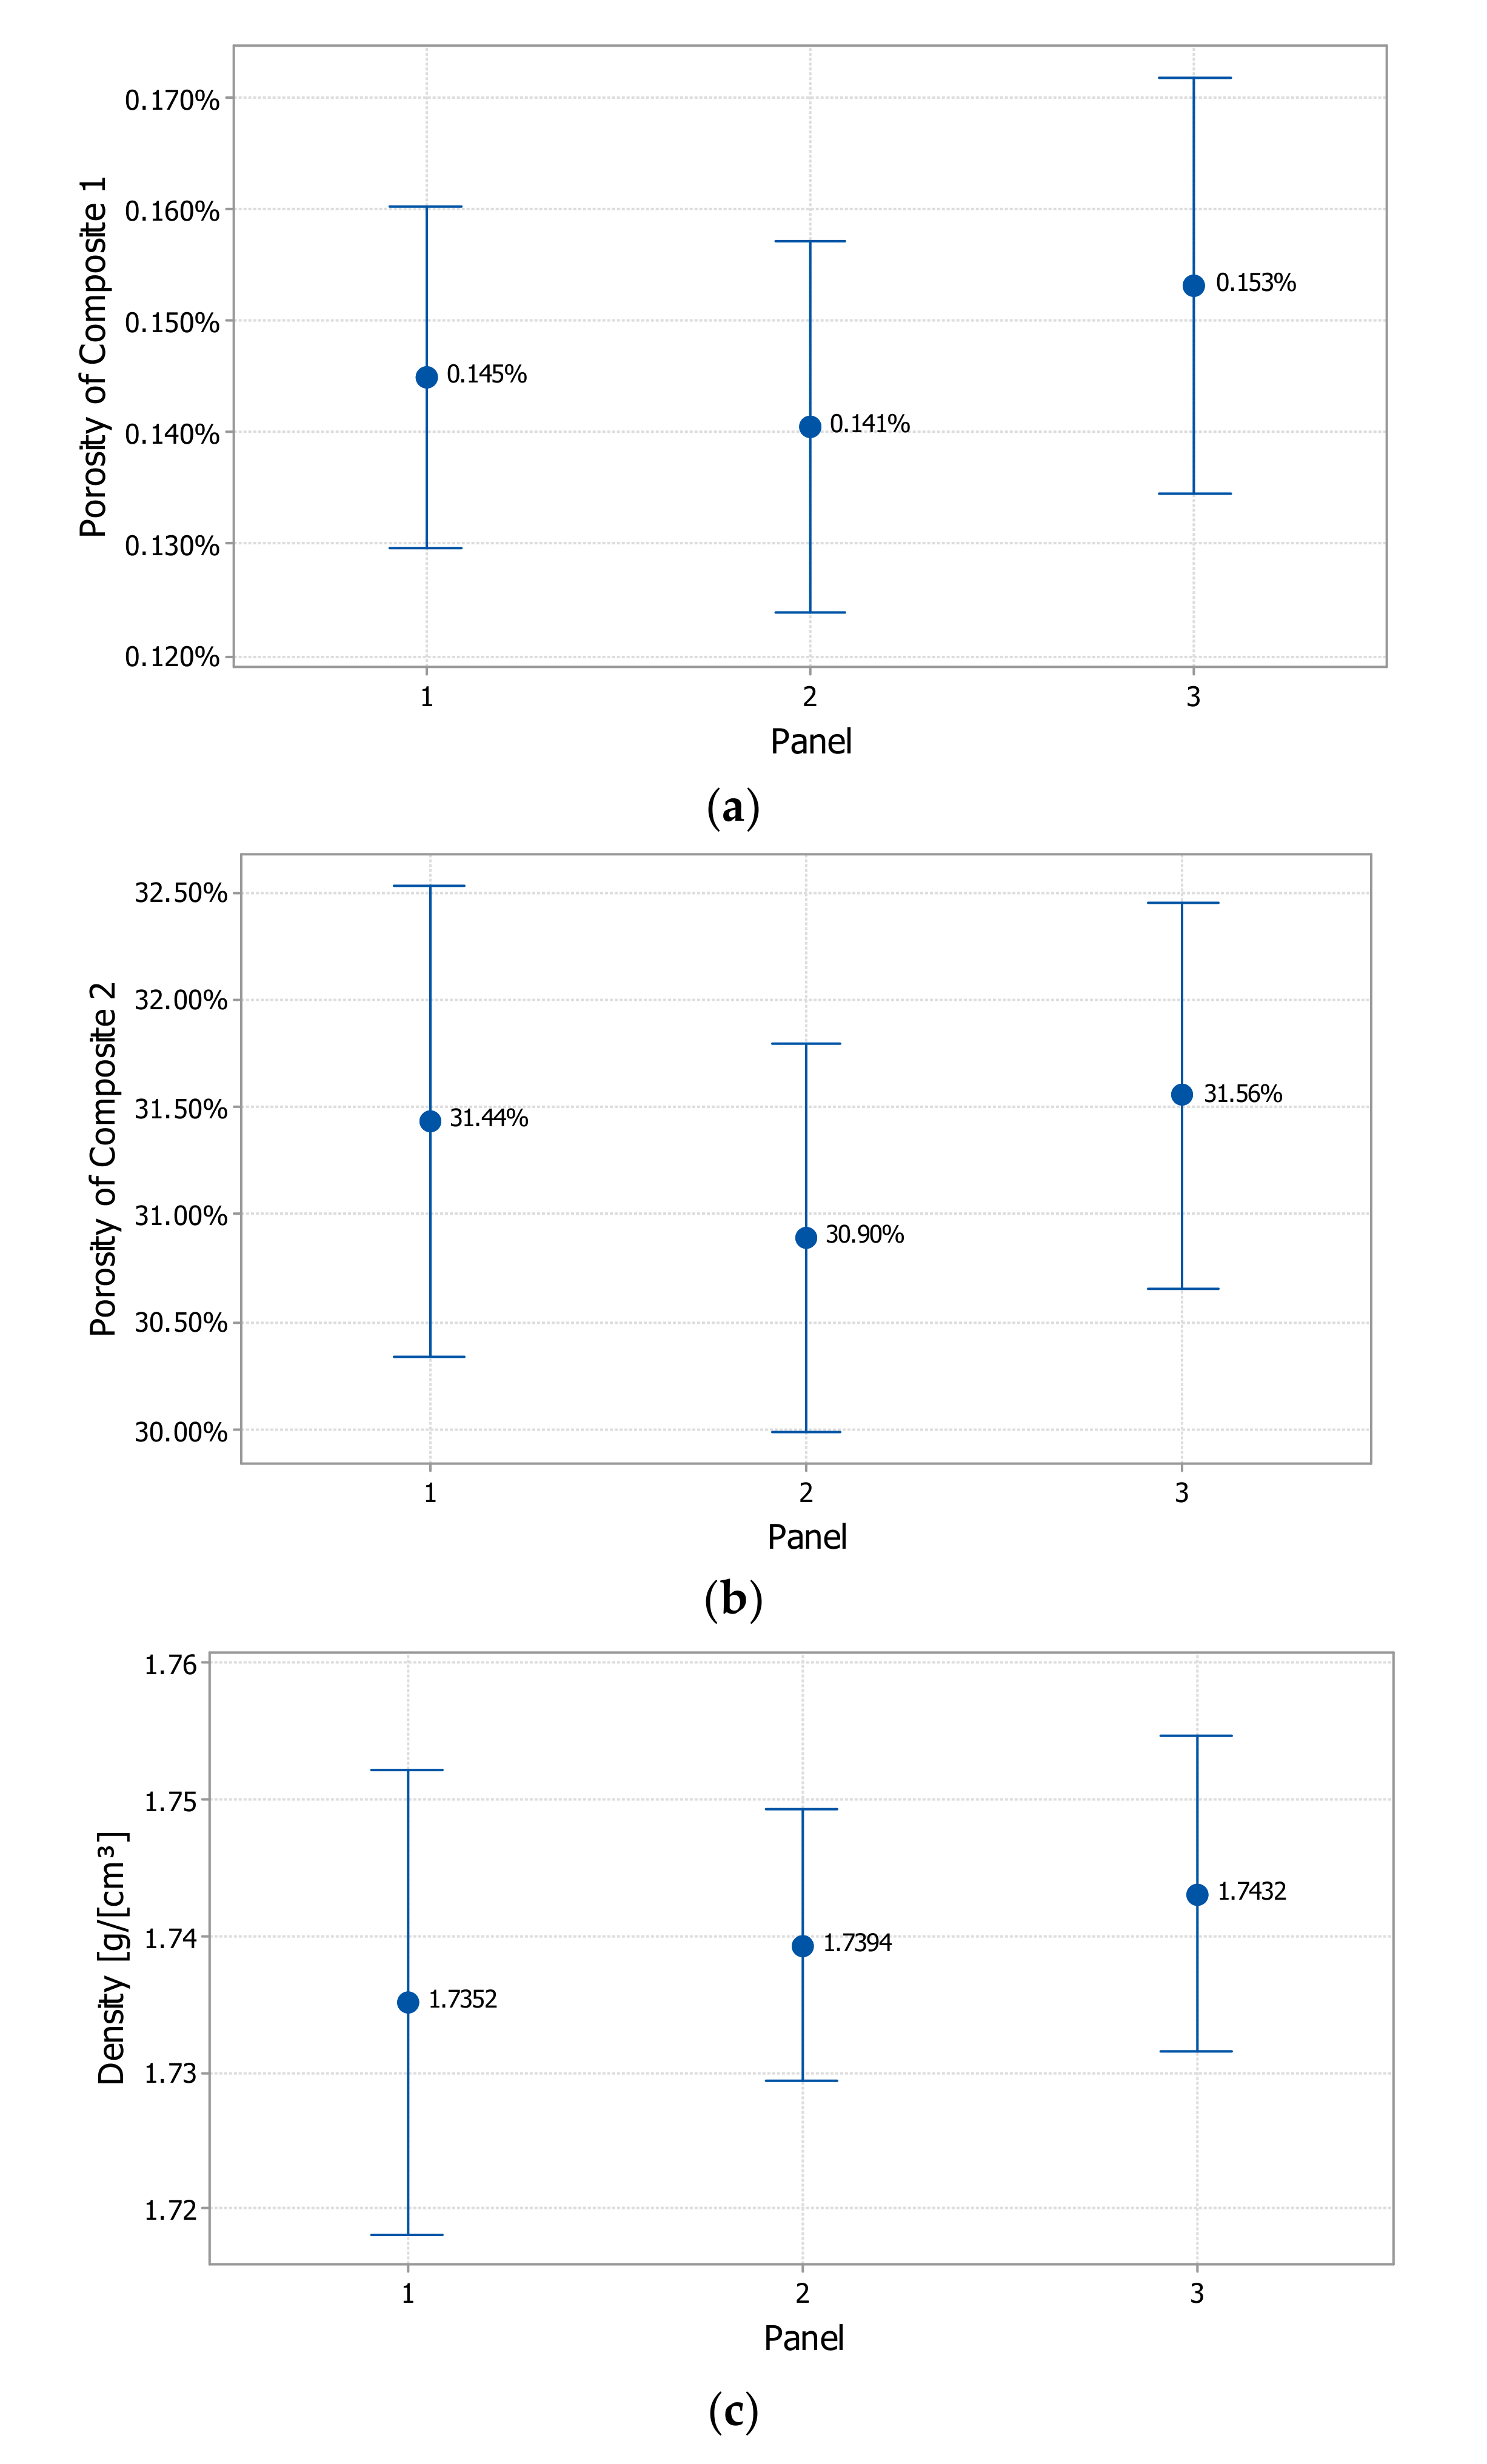
3.1. Porosity Analysis of the Multi-Material Composite

According to the proposed method from Section 2, all samples cut from the panel were CT scanned, prepared for the pore morphology investigation, and subsequently analyzed.
A large open porosity was detected in all the scanned CT samples. The CT parts were then prepared for pore morphology analysis, which was achieved by closing the surface around the open pores. The part is closed by the yellow curve, as is shown in CT cross-section of material in gray values (Figure 6a). The porosity analysis performed by the VGDefx algorithm separated all the pore volumes from the part. This was visualized using a color map to indicate the resultant pore sizes for all scanned CT parts. Figure 6a and Figure 7 show Z-X CT cross-sections of samples S1 through composite 2 and composite 1.
The coordinate system used for the scanned CT parts was bespoke for each specimen (e.g., it indicated a line and one point to define a plane) for better sectioning of the parts.
Customized cross-sections oriented at 15 degree angles relative to the Z-Y reference plane were used to visualize both composite materials within the same picture (Figure 8). The interface between composite 1 and composite 2 is seen to follow a linear shape for all the samples, as is shown in Figure 8. The porosity of composite 1 and composite 2 was analyzed separately for each sample; as a result of the analysis, the porosity levels in cross-sections of both materials (composite 1 and composite 2) can be observed, as is shown in Figure 8.
If multiple open pores are connected, they are treated as a single large open macropore. A large open pore and closed pores were detected within composite 2. Composite 1 was observed as having only closed pores, as is shown in Figure 7 and Figure 8.
The 3D CT images of samples S1, S2, S3, S4, and S5 from panel 1 (Figure 9) show the large open porosity of composite 2. Based on the color coding of the pores, the largest open pore sizes are detected for sample S1 and S4, with samples S2, S3, and S5 having similar values.
From the CT image analysis (Figure 8 and Figure 9), two materials with different porosities were identified (composite 1 and composite 2), with a linear shape interface identified between each material. Based on this analysis, it can be assumed that the interface between composites is a planar surface with a good approximation. The STL volume of the multi-material was split into constituent material volumes (volumes 1 and 2) using Magics Software (Figure 10 and Figure 11), based on the proposed methodology. The volume of all specimens follows an identical splitting procedure.
The numerical results of the CT analysis were saved in a CSV file using VGStudio Max 3.0 for all samples, where the CSV file was imported into Microsoft Excel to prepare the data for statistical analysis. The individual columns identified within the pores table (Microsoft Excel) were titled radius, diameter, center X/Y/Z, volume, and surface. The radius and diameter columns represent the parameters of the circumscribed spheres of the pores. The center X, Y, and Z columns represent the coordinates of the center position of the circumscribed spheres of the pores.
The pores are distributed between the constituent material volumes (volumes 1 and 2) based on the sorting procedure of the proposed methodology. The pore characteristics (radius, diameter, center X/Y/Z, volume, and surface) for each constituent (composite 1 and composite 2) were saved in distinct sheets of a Microsoft Excel file and subsequently analyzed.
  • Based on the numerical CT results, the following parameters were calculated (Table 2):
  • Total volume of the multi-material composite (Vmat);
  • Volume of composites 1 and 2 (Vmat 1 and Vmat 2);
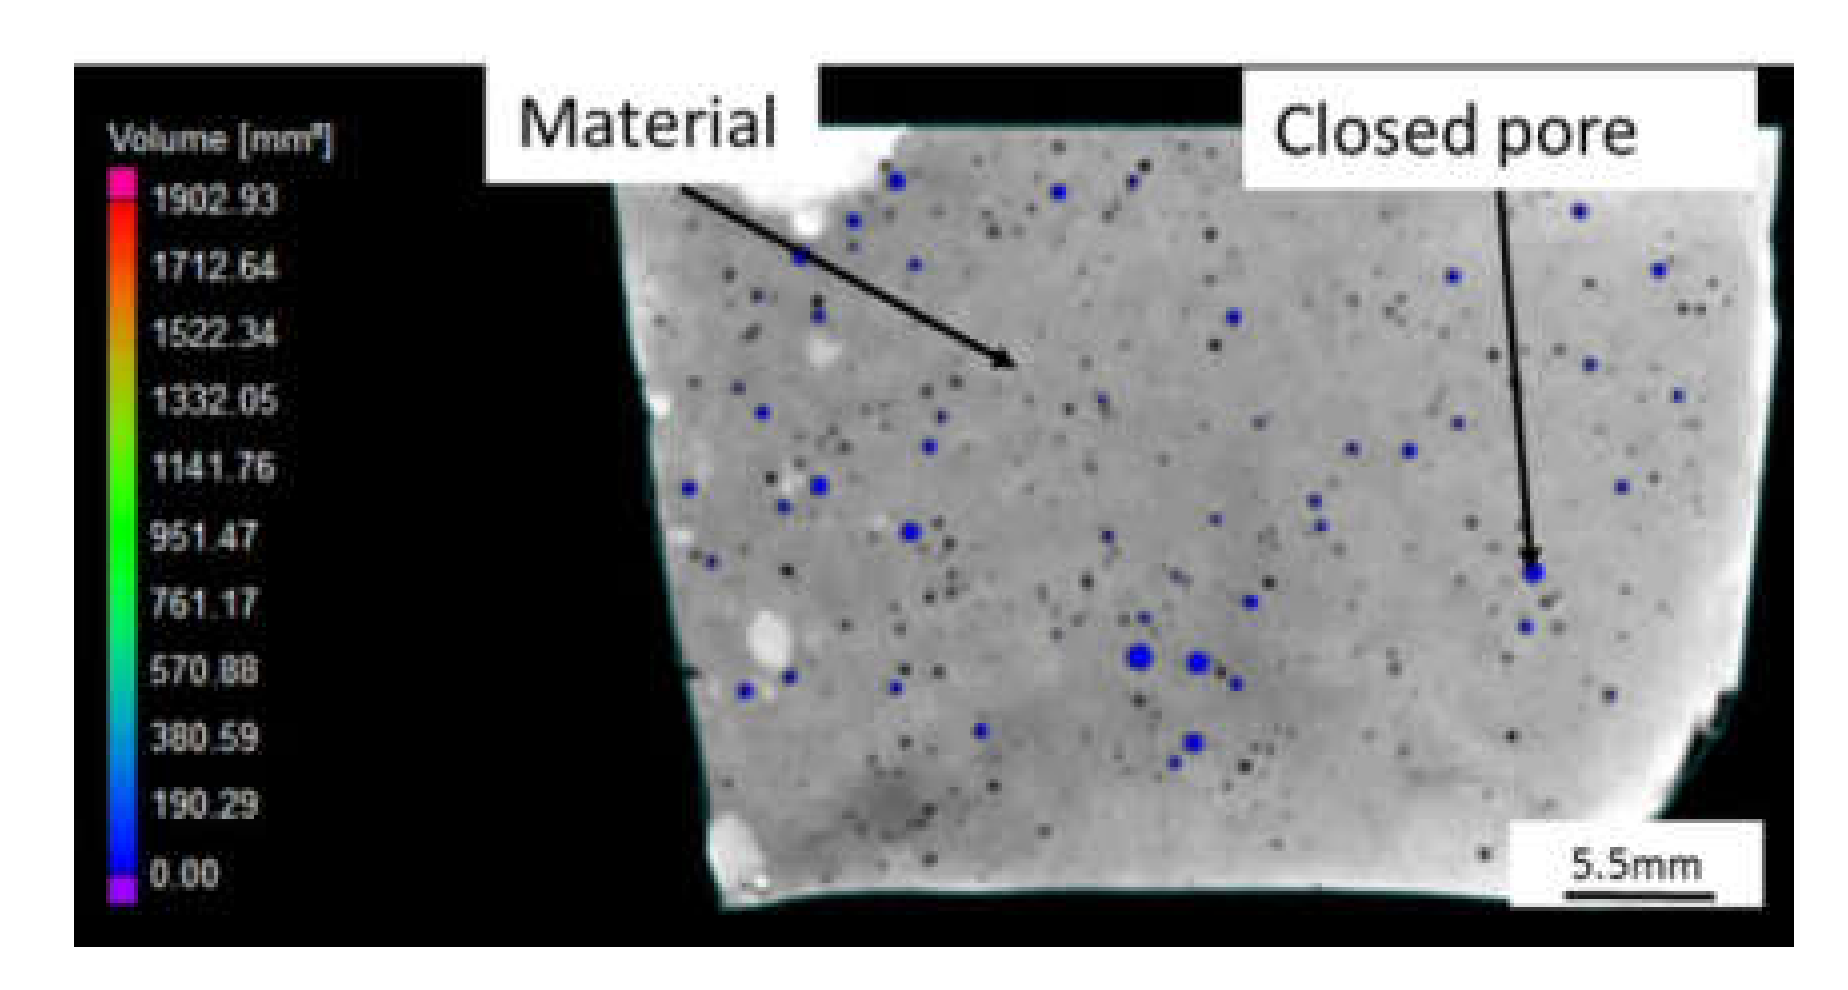
  • Pores volume (Vpore1 and Vpore2) within composites 1 and 2;
  • Porosity of composites 1 (Pmat1) and 2 (Pmat2).
The mass of the multi-material (Mmulti-mat) was determined using a scale for all the samples. Following this, the multi-material density (ρmulti-mat) was then calculated for all samples. Detailed results related to the porosity and the density of panel 1 are shown in Table 2. This procedure was then repeated for panels 2 and 3, the results for which are shown in Table 3.
The porosity of all five samples for three panels was determined based on the proposed methodology. An interval plot to examine the distributions was subsequently created. The confidence level for each interval is 95%. The means and confidence intervals appear to be consistent for all the panels (Figure 12). The interval plot of the multi-material density for all the panels is shown in Figure 12c. Finally, it may be concluded that the variance of the porosity assures the manufacturing reproducibility of the panels.
The results of the confirmatory experiments (Table 3) show that the mean porosity of the composite panel (Figure 12a,b) is confirmed with an error of 0.004% for composite 1 and 0.54% for composite 2.

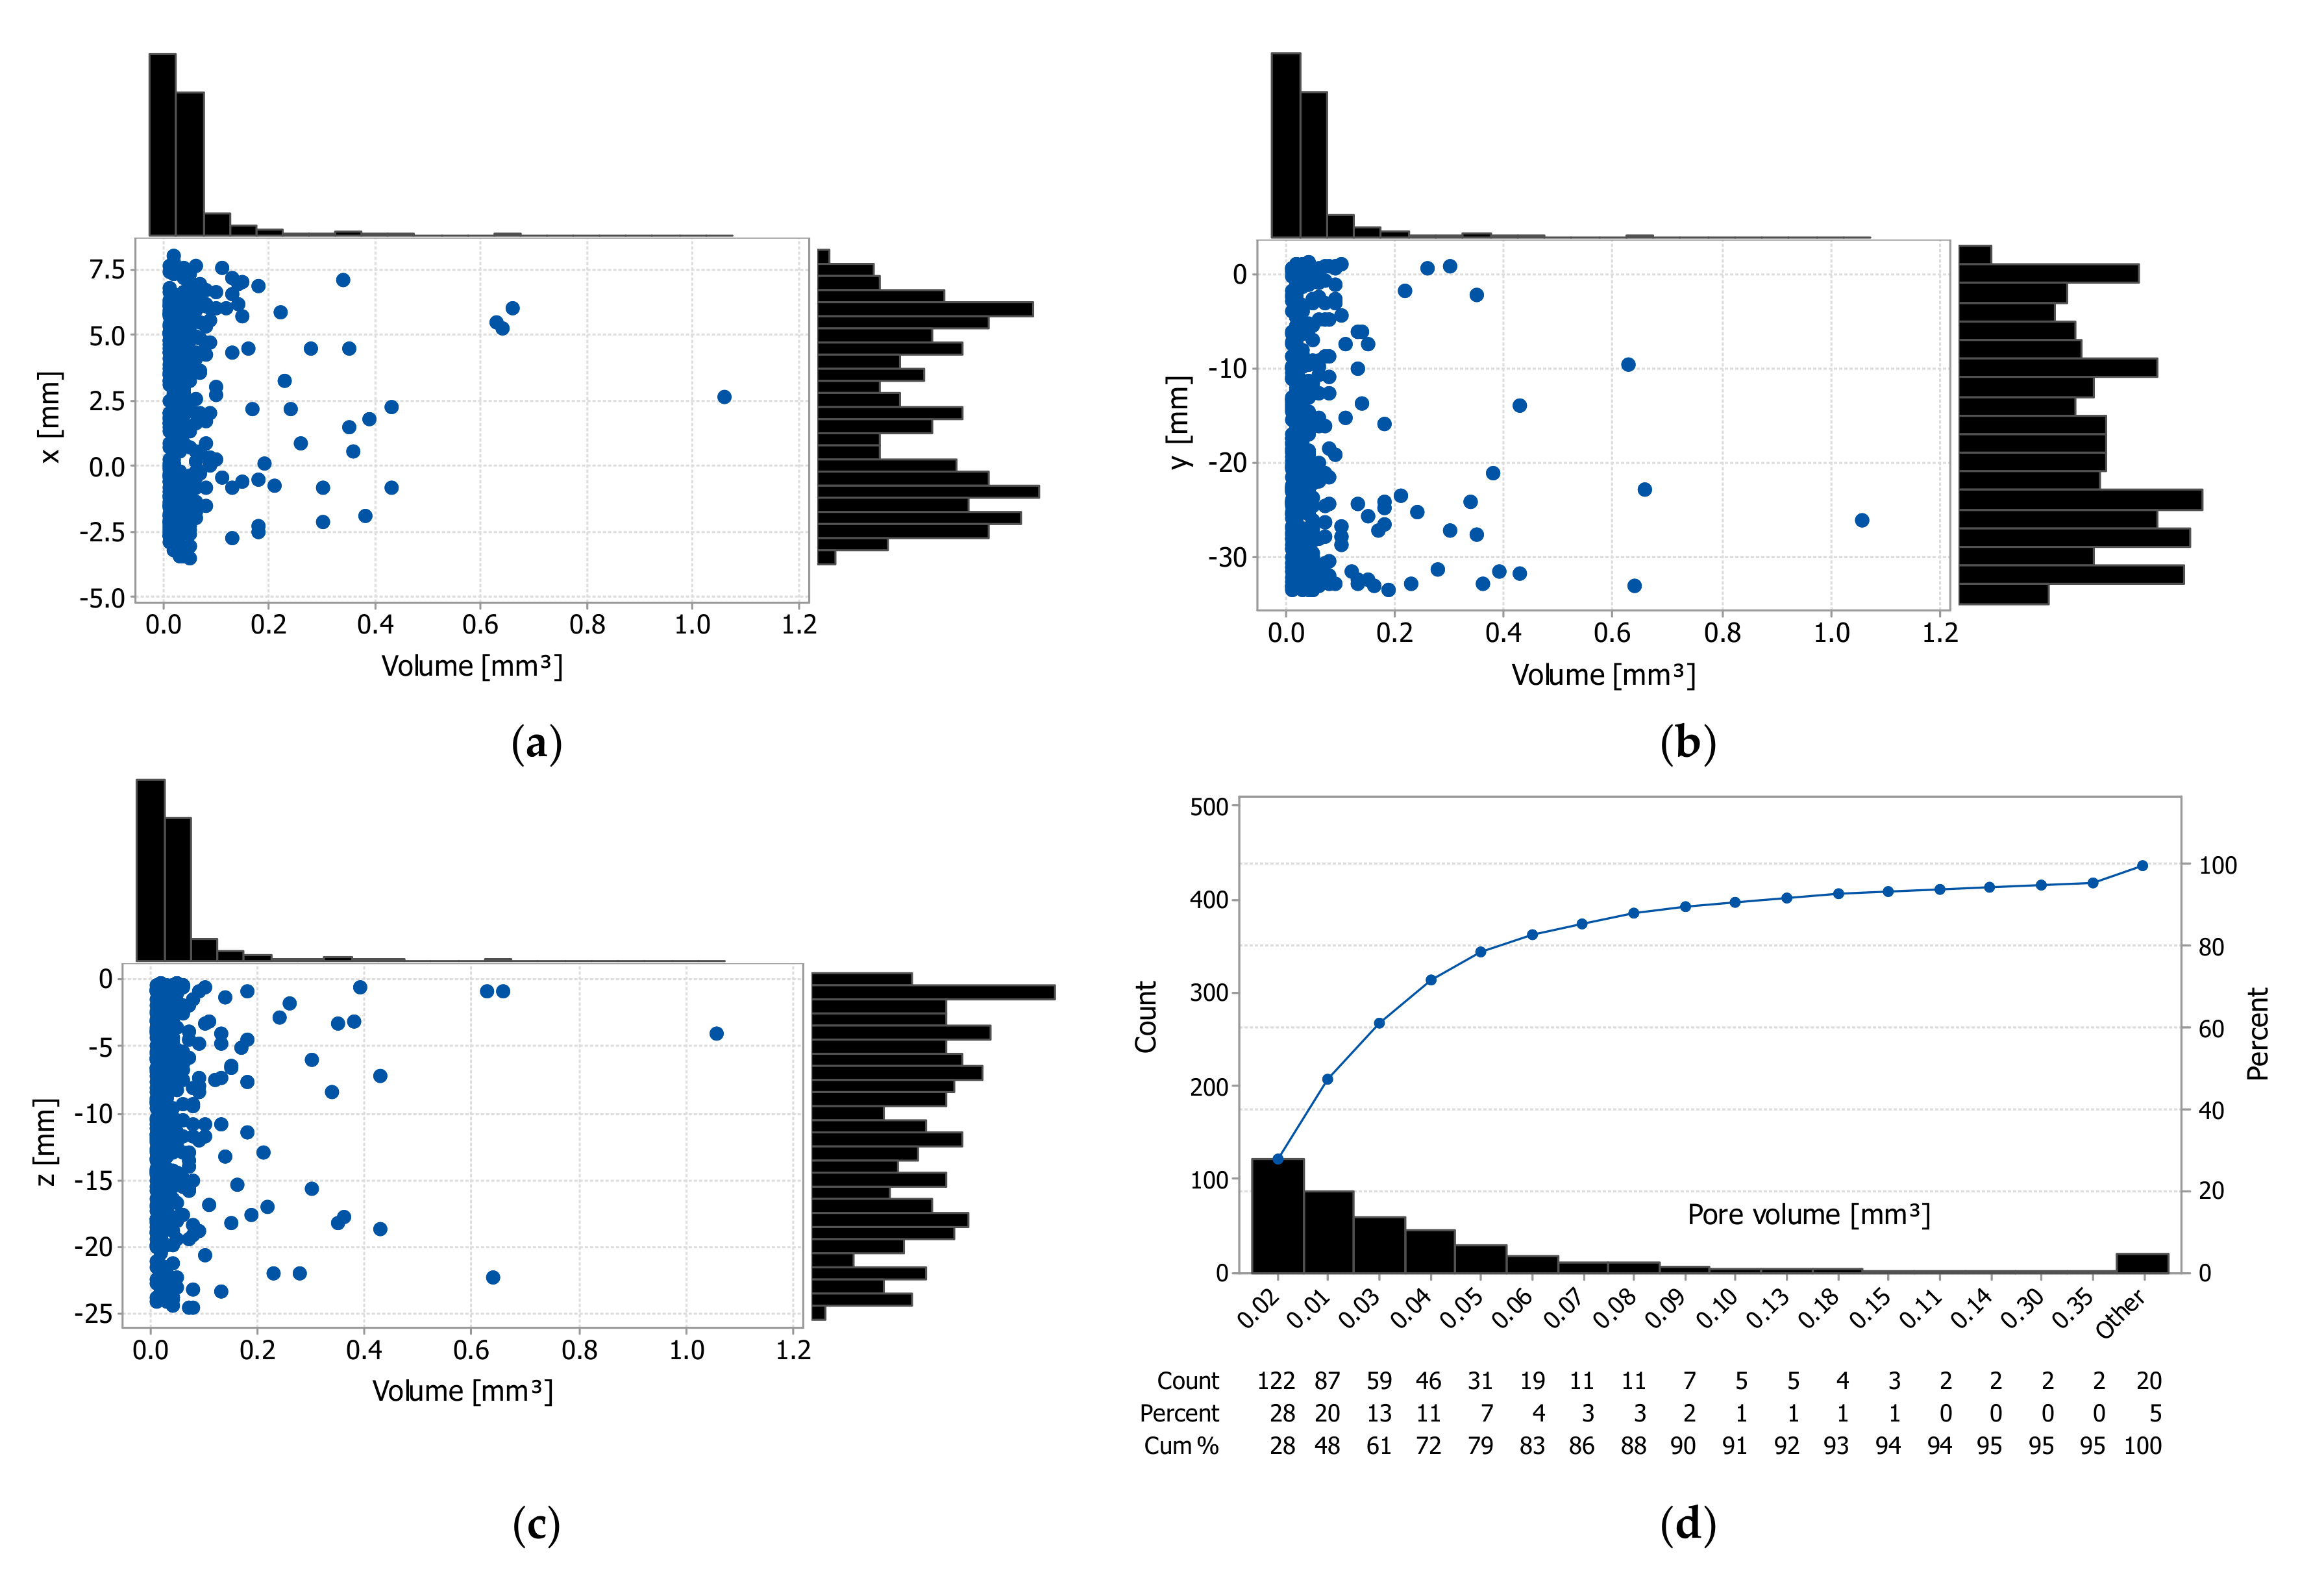
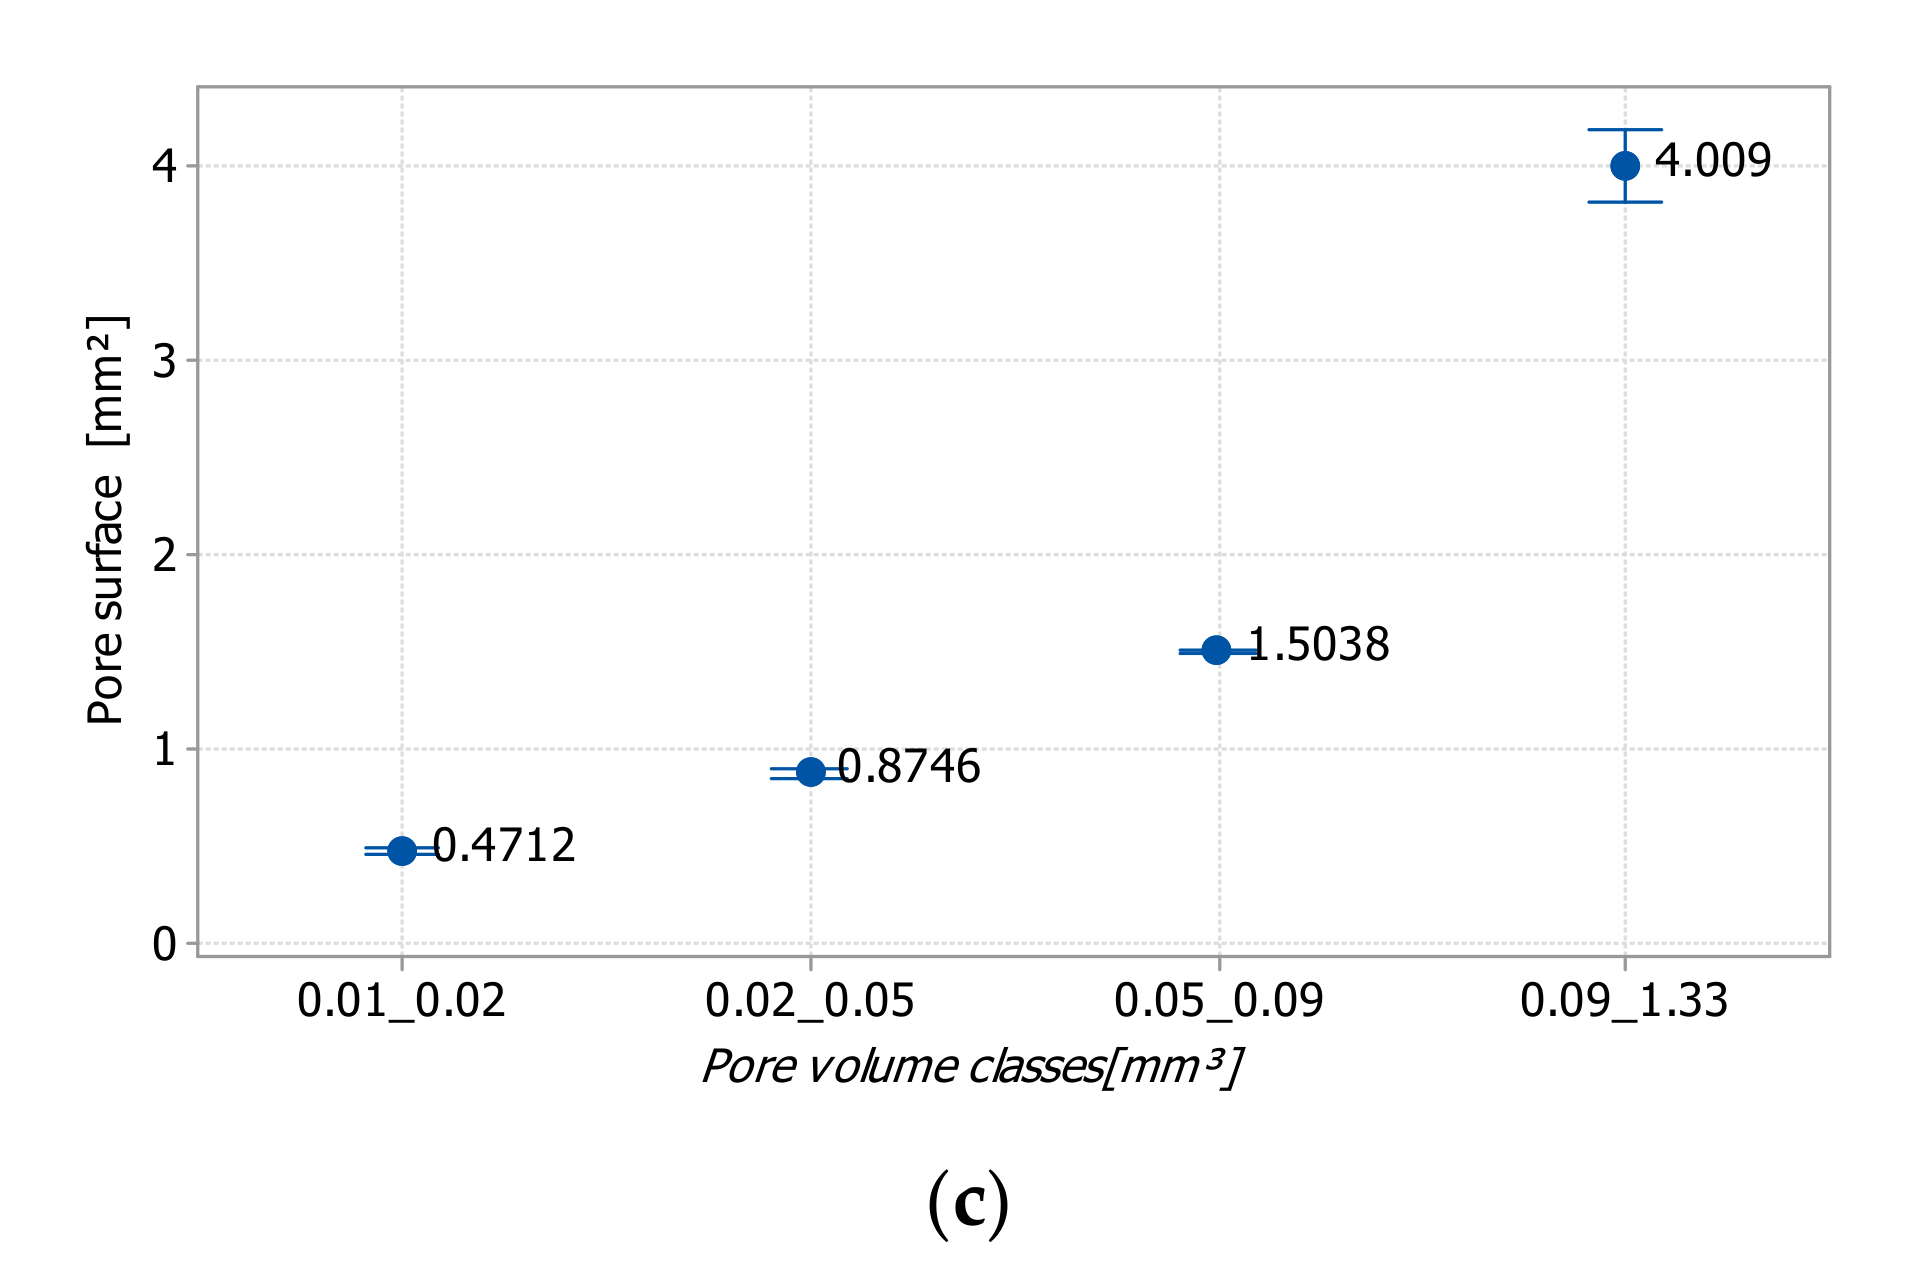
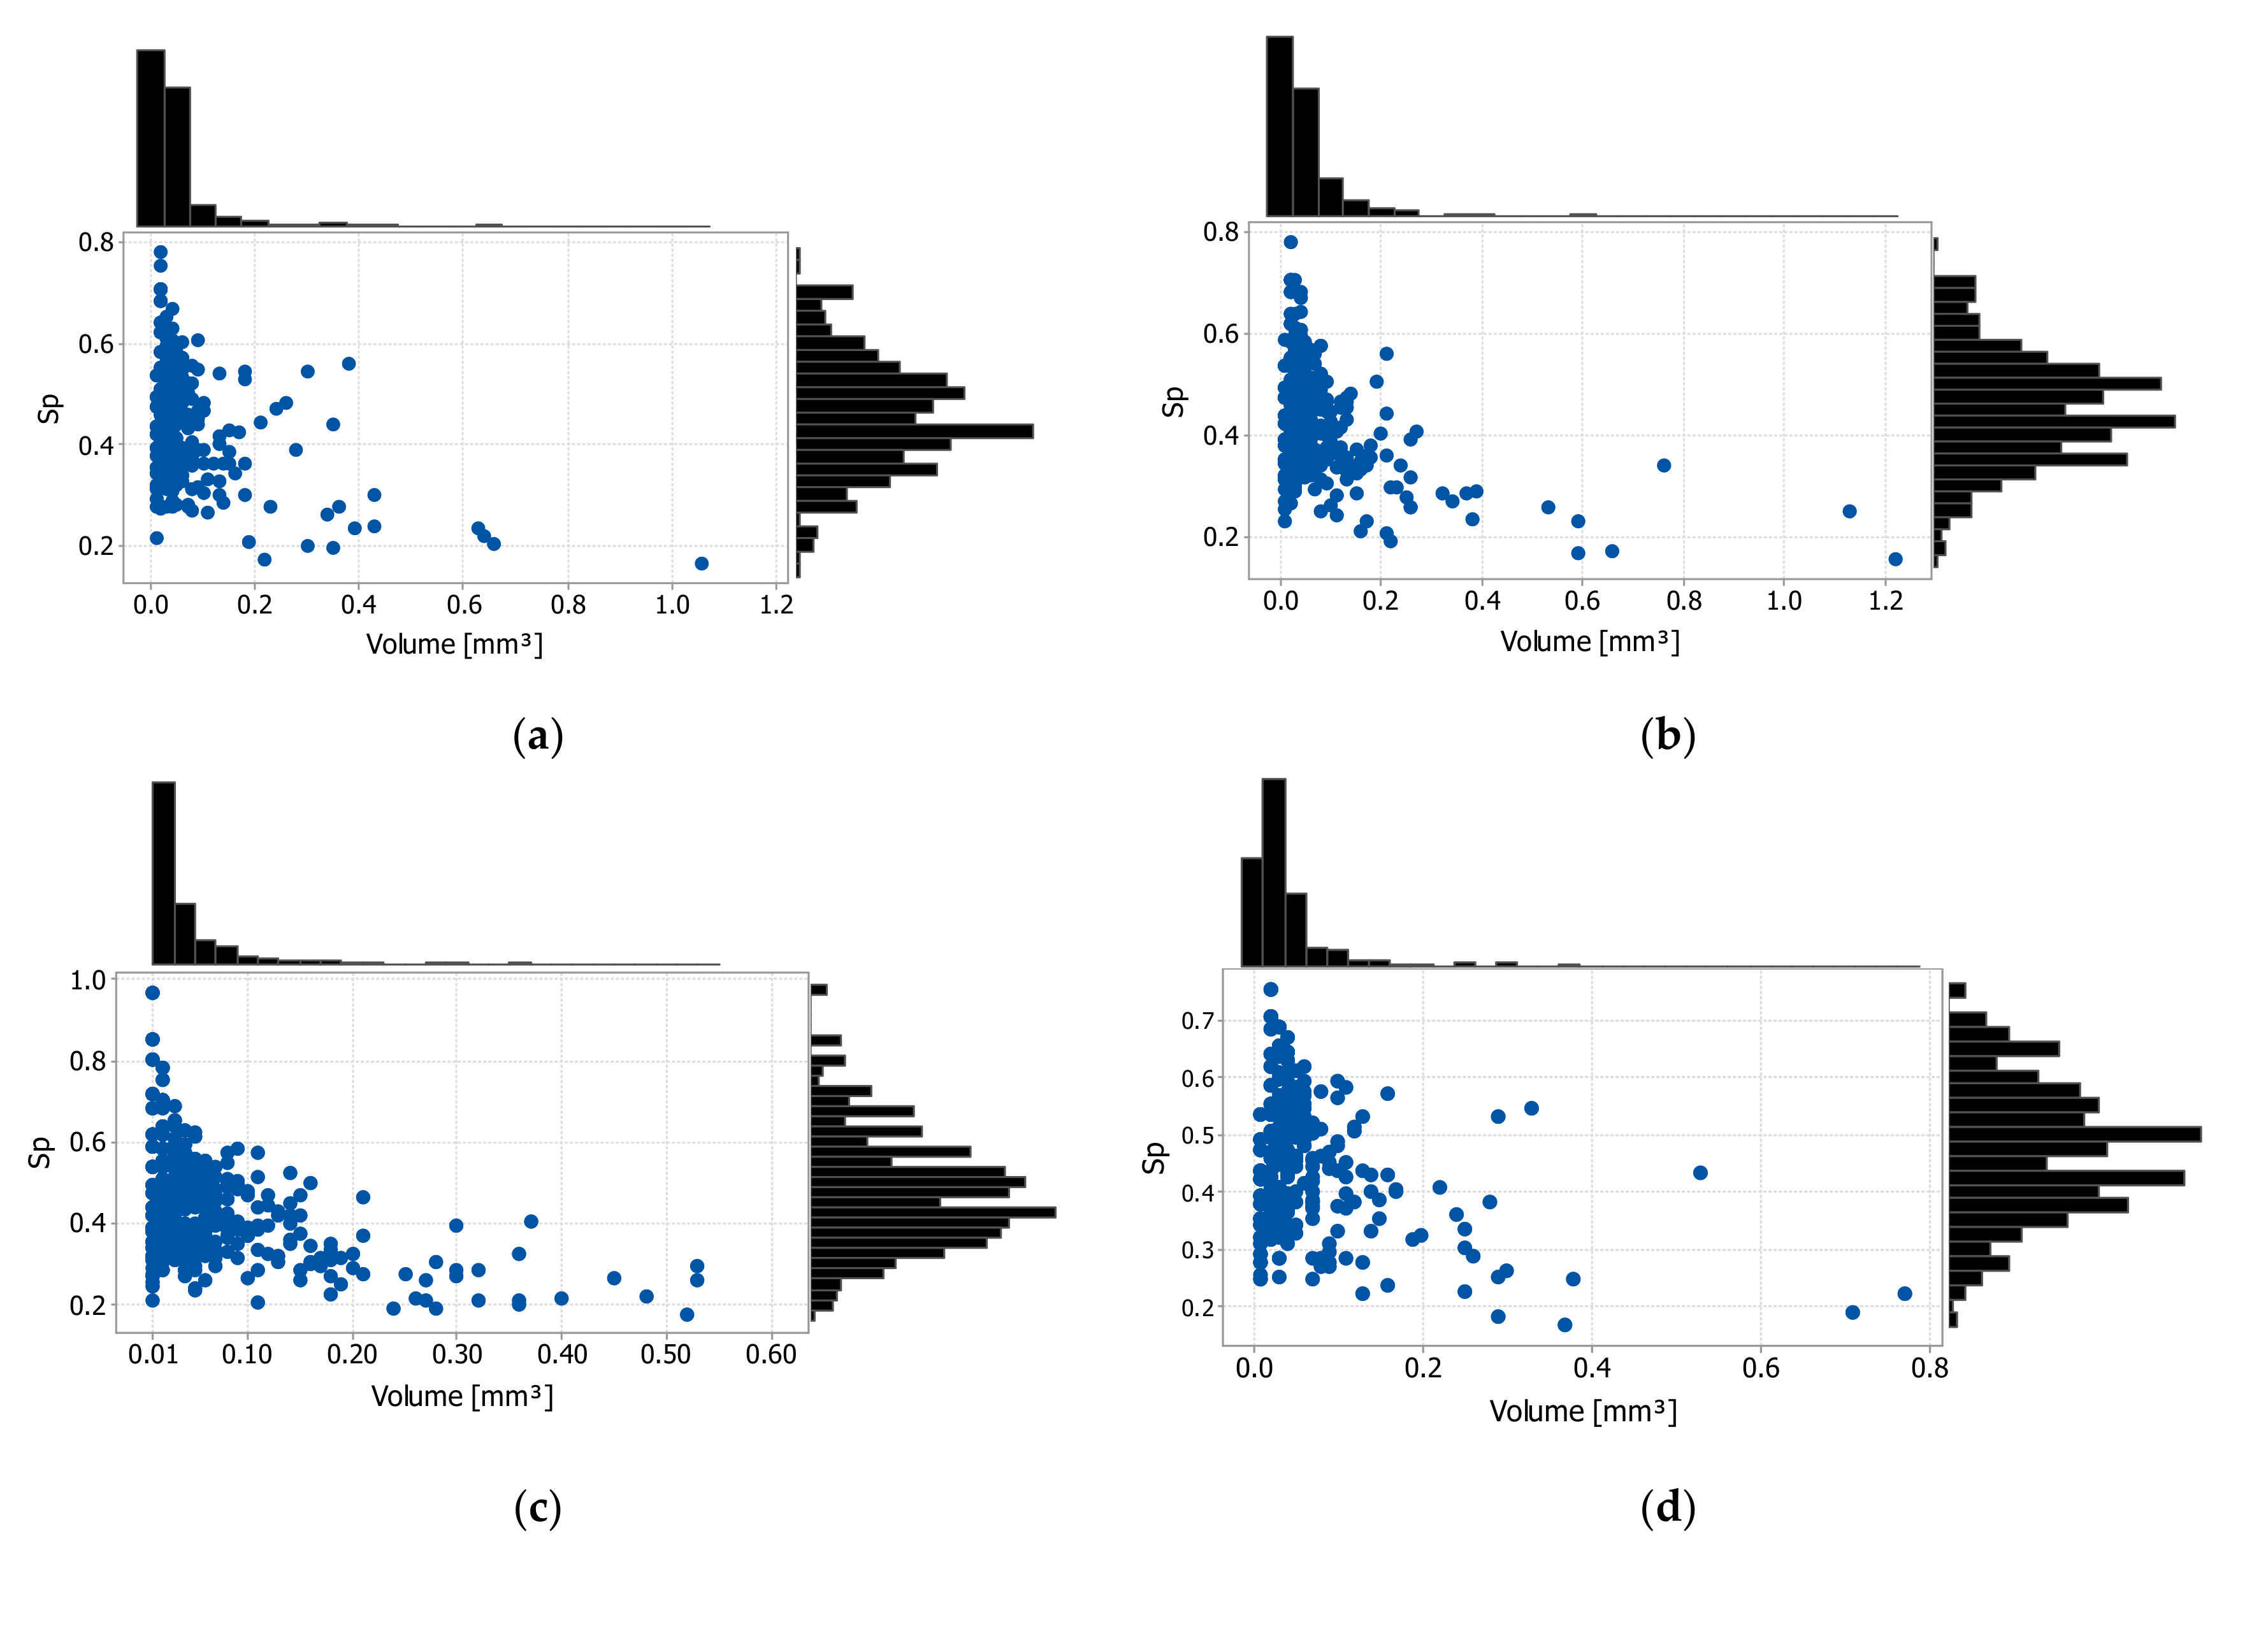
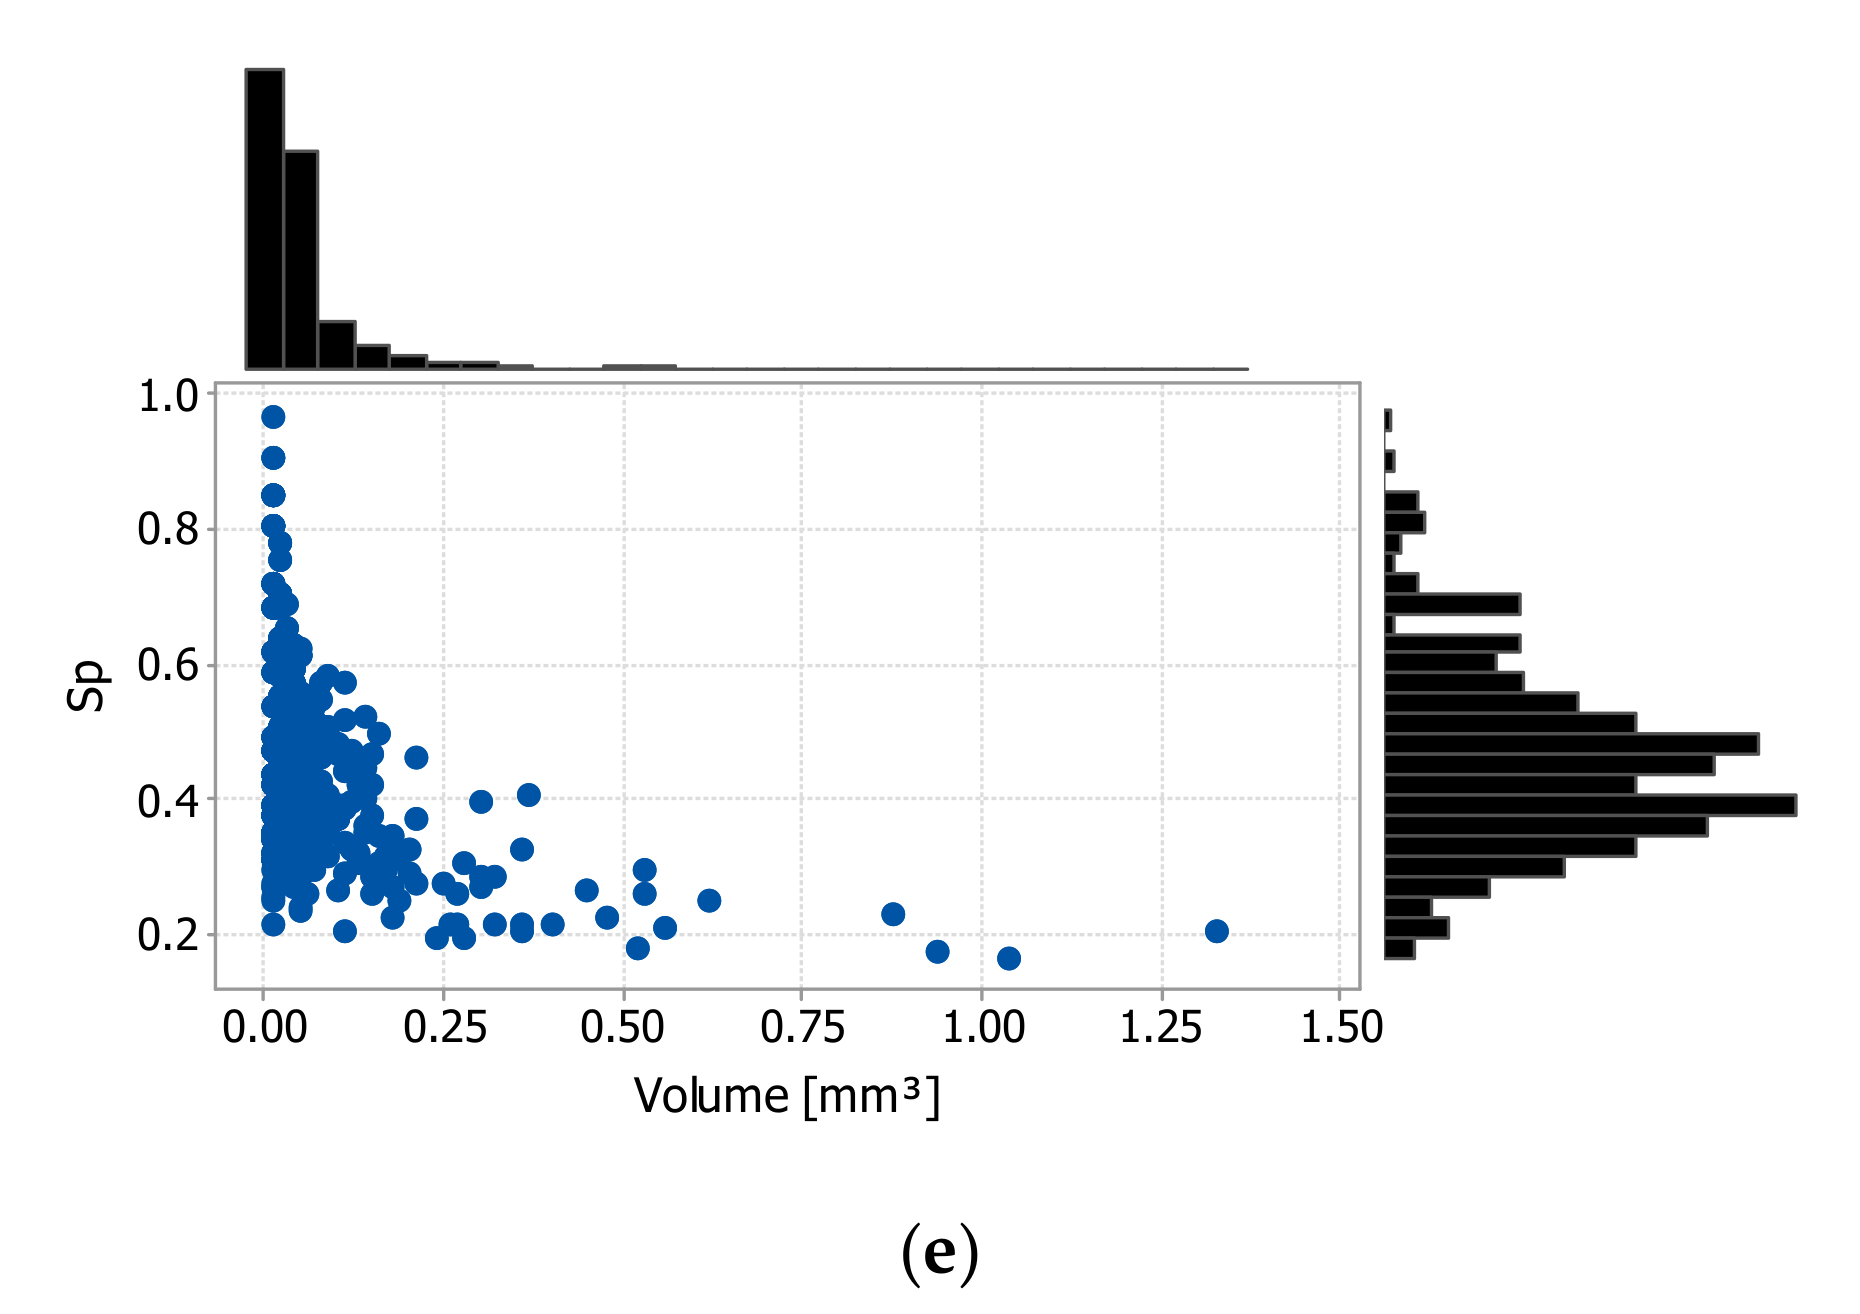
3.2. Statistical Analysis of the Pore Characteristics

The purpose of this subparagraph is to determine the distribution of the pores and to analyze the pore sizes, pore number, and pore shapes. The results of the statistical analysis of panel 1 are presented below, while panels 2 and 3 are seen to follow similar trends.
The 3D distributions of the pores for all five samples of panel 1 are shown in Figure 13. A single point within coordinates X, Y, and Z (Figure 13) represents the center of the circumscribed sphere of the closed pores. The pore distribution is homogeneous across all analyzed samples, with no pore agglomerations on the surface.
The scatter plots of the pores, as well as the distributions in two dimensions using histograms, are shown in Figure 14a–c. The scatter plots show a homogeneous distribution of the pore volume on the X, Y, and Z axes. The distribution has a volume cluster between 0.01 and 0.1 mm3. Outliers indicate a singular pore volume greater than 0.1 mm3. Similar distributions of pore volume versus X, Y, and Z coordinates were found for all the samples.
The bar chart (Figure 14d) shows the most common volume size of the closed pores, the number of pores (NPmulti_mat), and percentages of multi-material. The values are arranged in size from largest to smallest. The most frequently occurring closed pores detected have a volume of around 0.01–0.02 mm3. Similar pore volume distributions were detected across all samples. Using the volume size detected within all samples, the closed pores were classified into four classes of size: 0.01–0.02, 0.02–0.05, 0.05–0.09, and 0.09–1.33 mm3.
The graphs from Figure 15a–c show the interval plots of the diameter, surface, and the number of closed pores versus pore volume classes for panel 1. Individual standard deviations were then used to calculate the intervals plot.
The shape of the pores was characterized based on the sphericity (Sp) parameter [33]. The sphericity parameter of pores is calculated based on Equation (1). The parameters involved in Equation (1) are the volume (V) and the surface area (A) of the pore [34].
S p = 6 π V A 3
The relationship between sphericity vs. pore volume (Figure 16) shows three closed-pore shapes:
  • Few pores having a regular shape (Sp > 0.5);
  • Most of the pores having an irregular shape (0.2 < Sp < 0.5);
  • Very few pores having an elongated shape (Sp < 0.2).

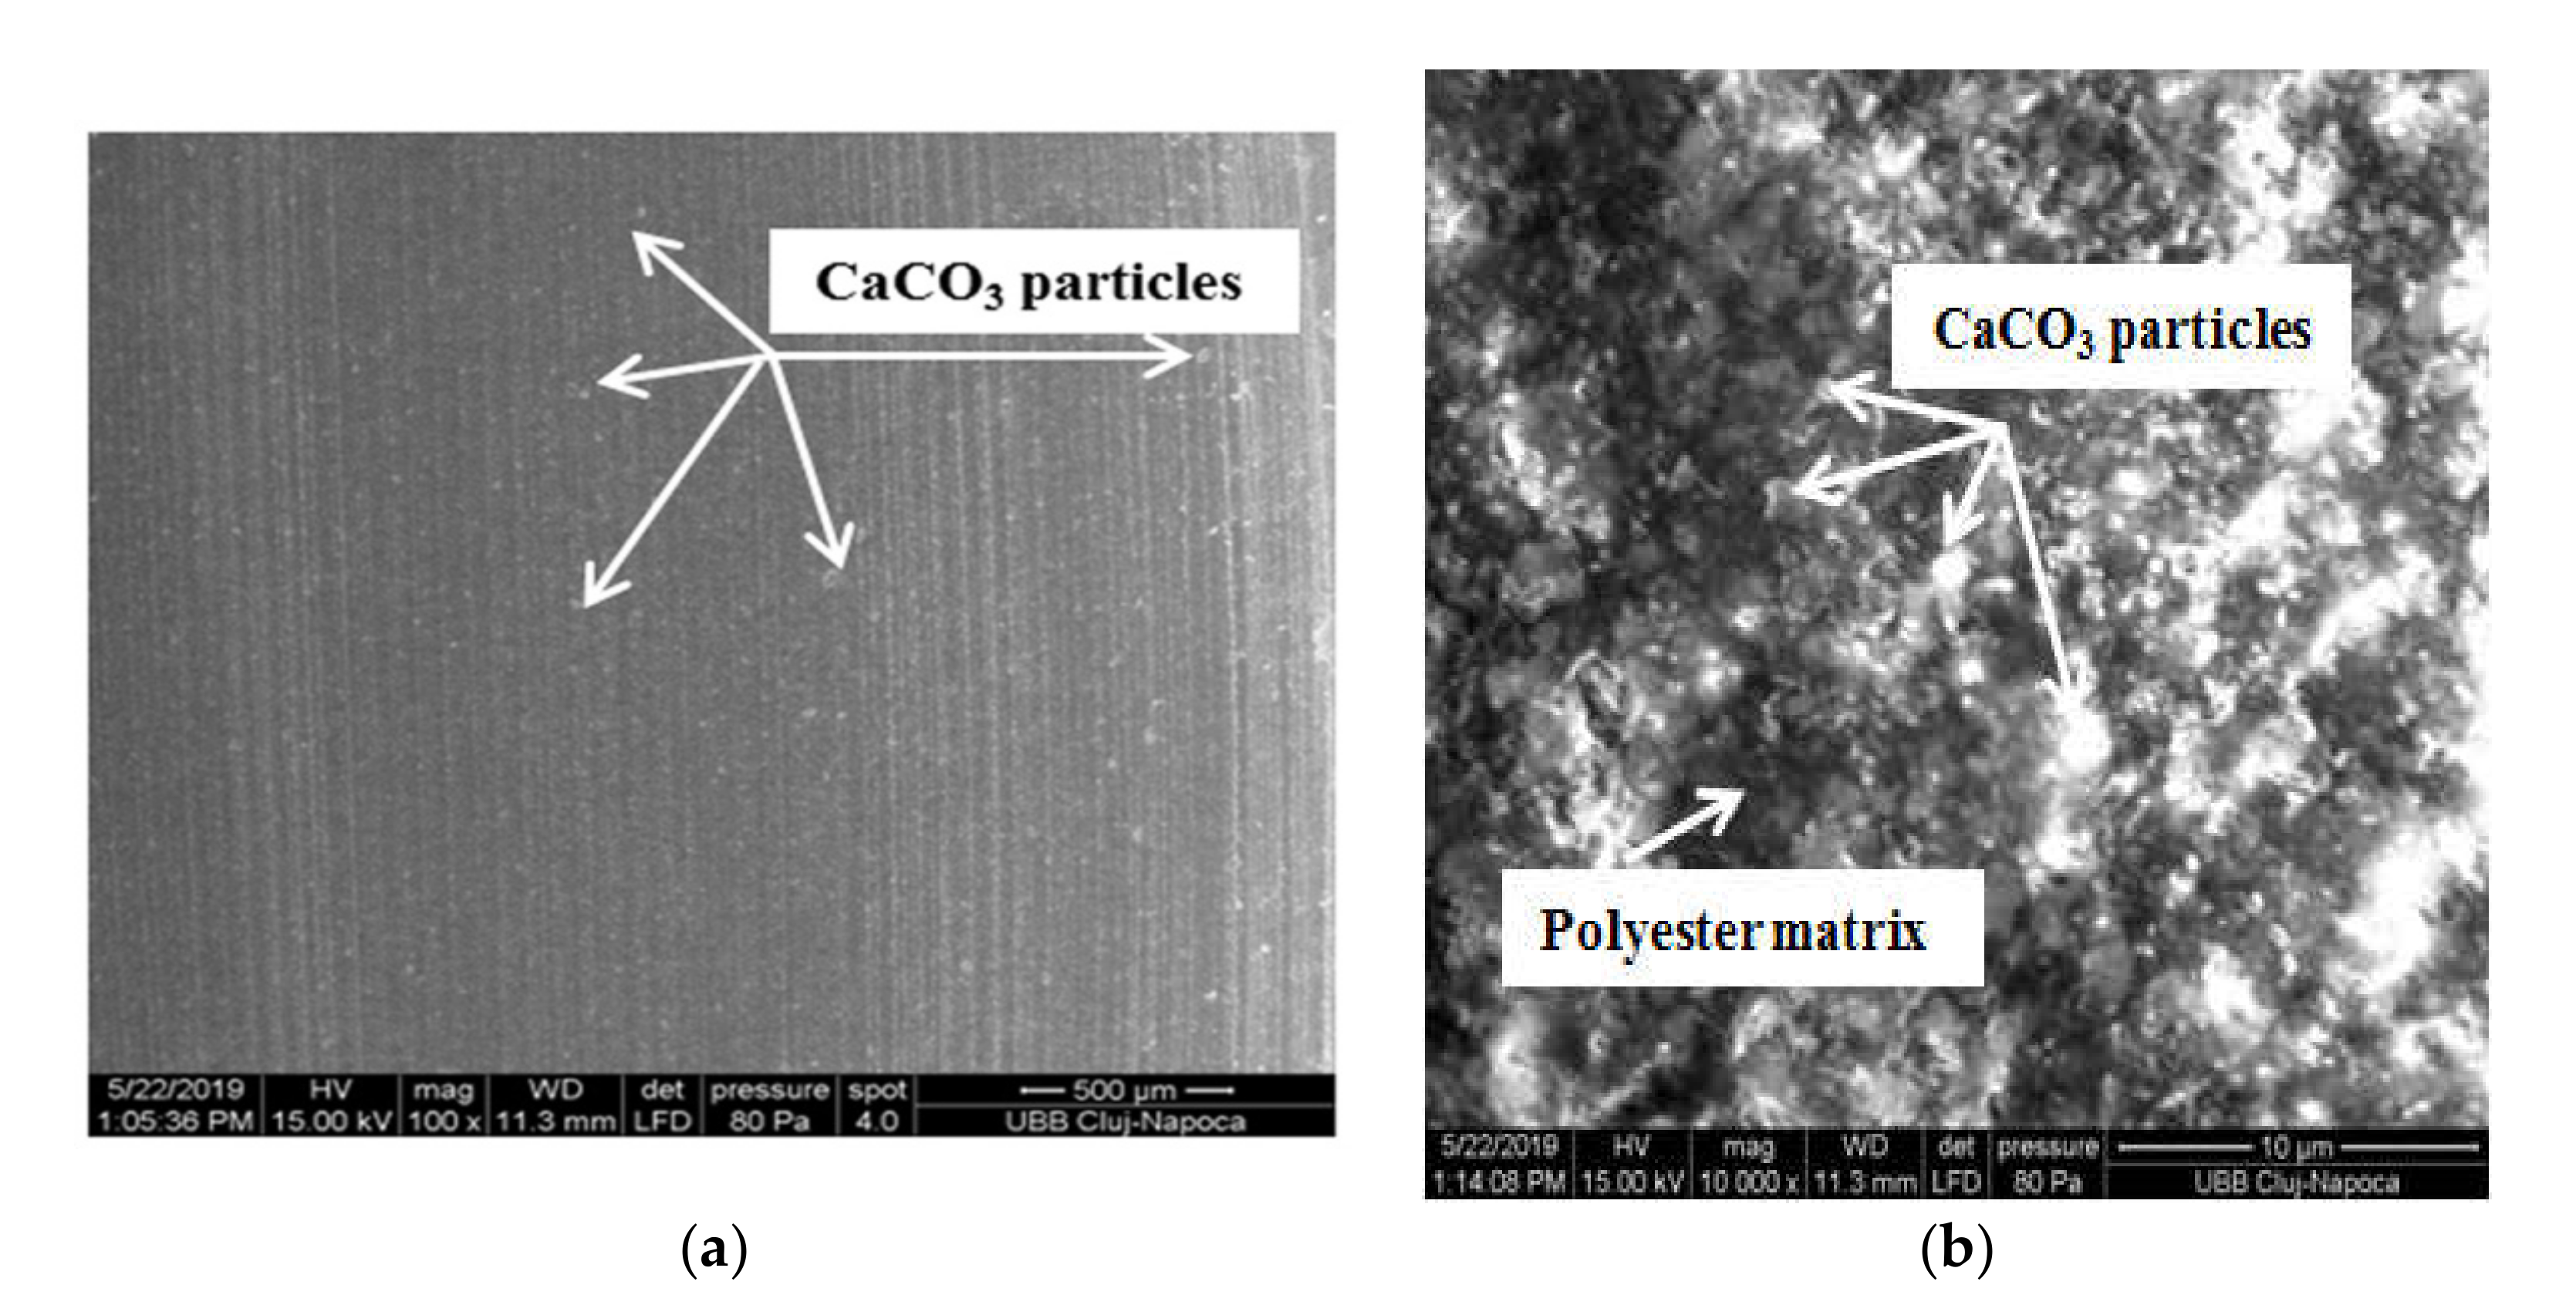
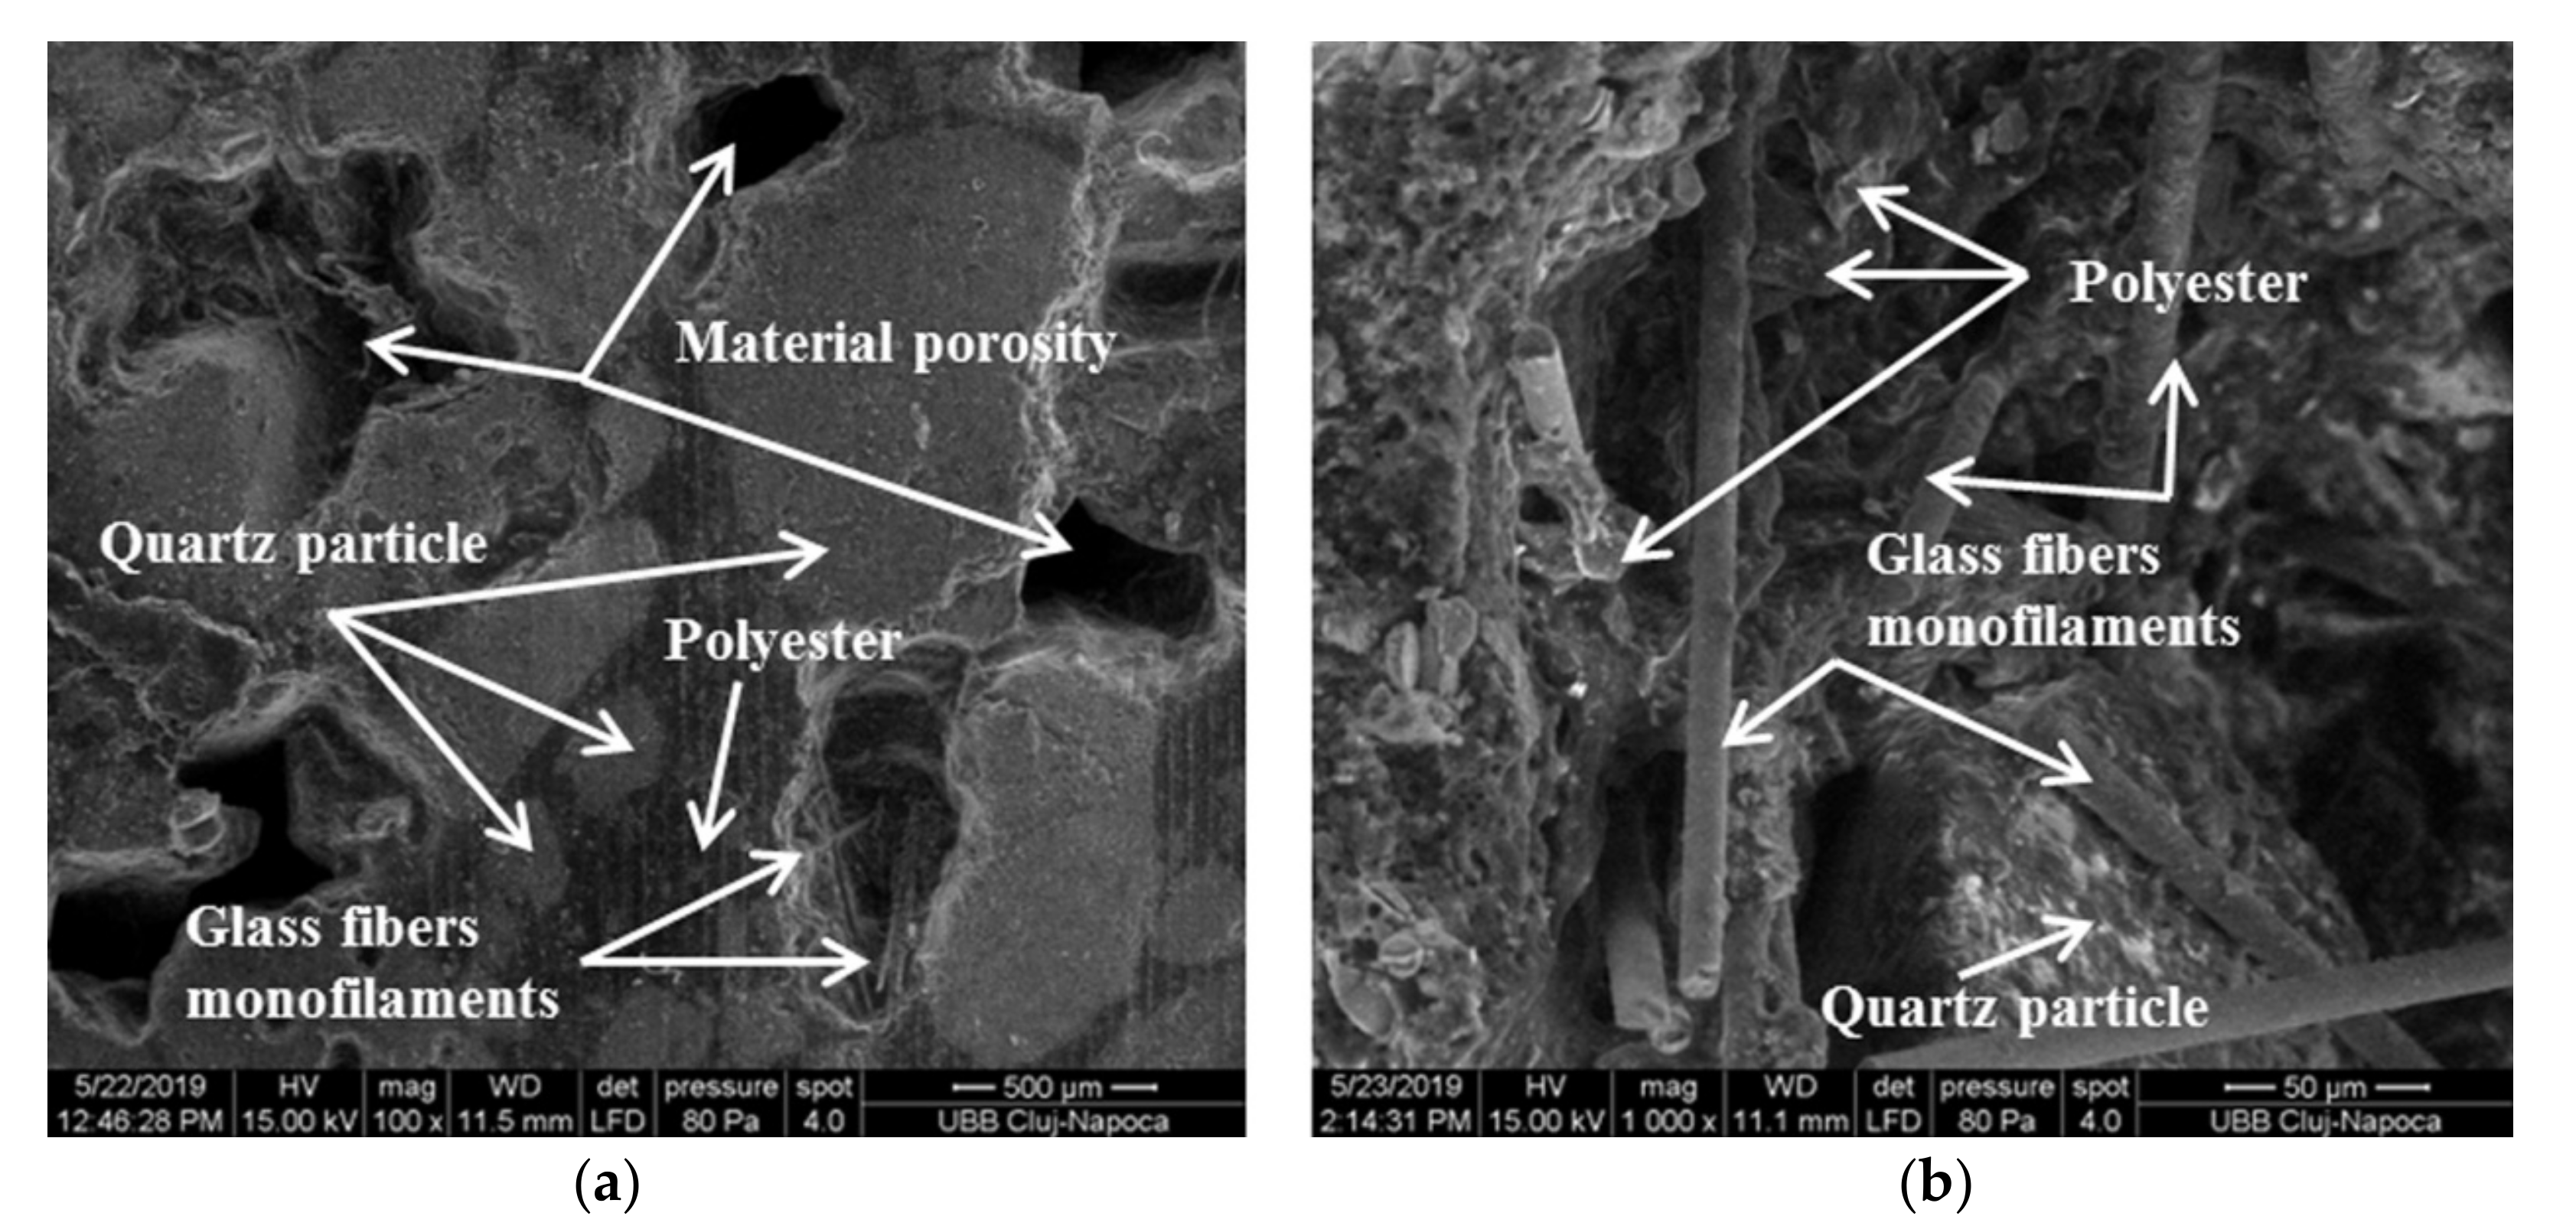
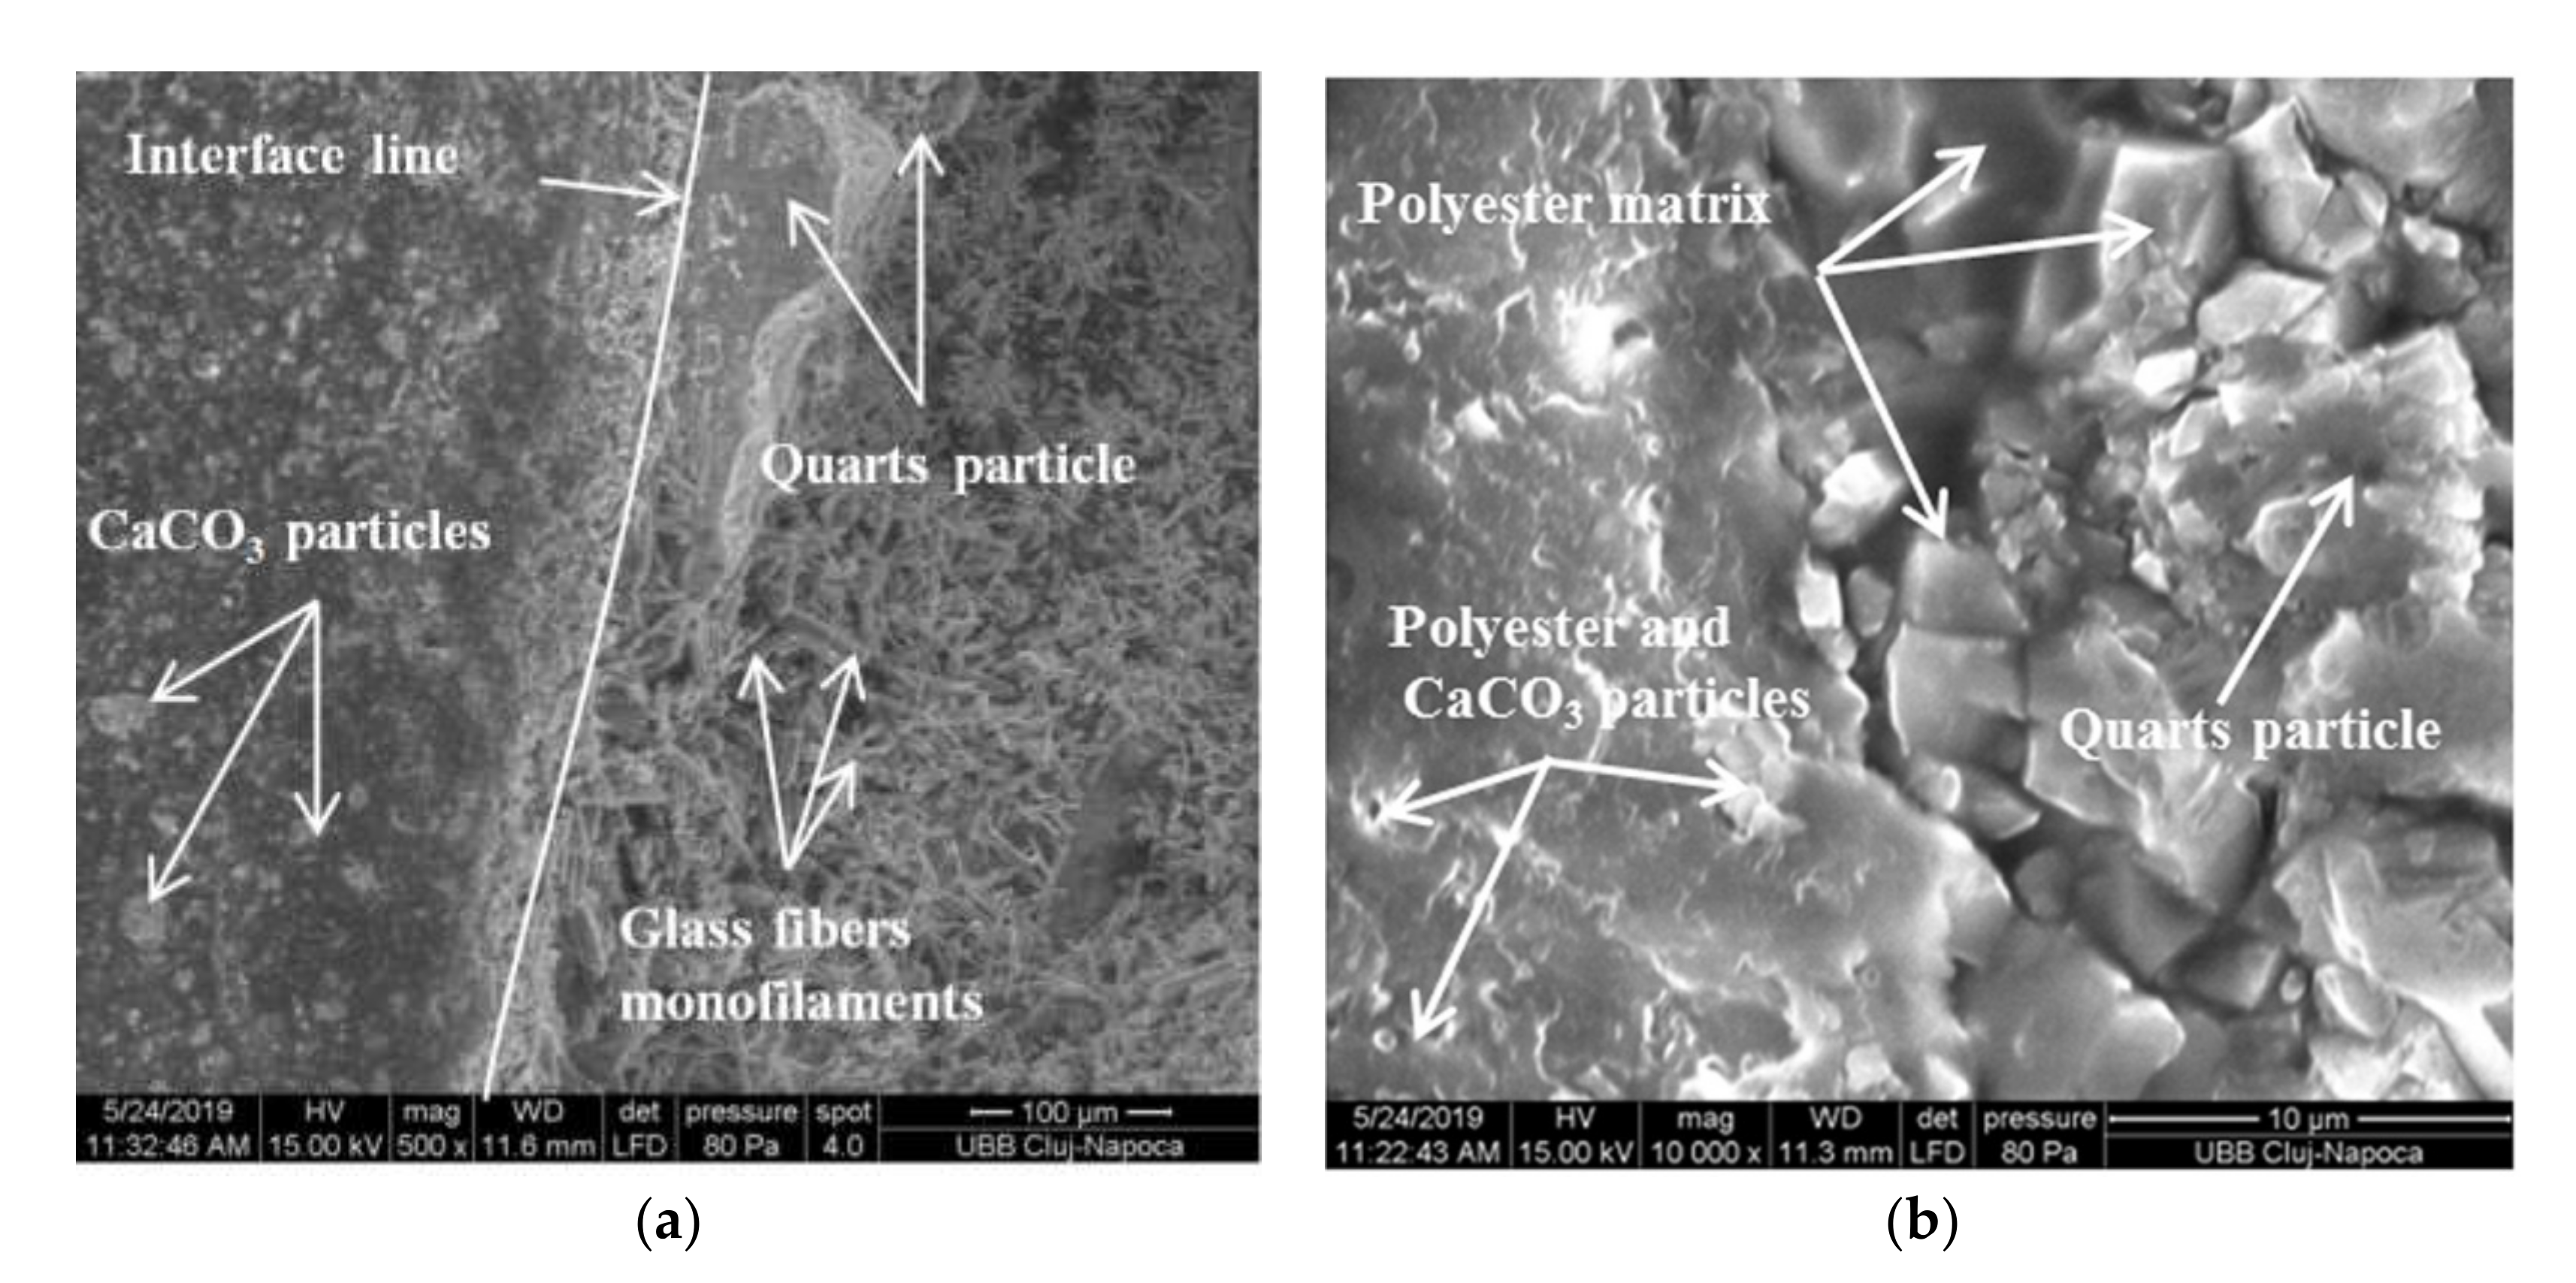
3.3. Microstructure Analysis

Surface analyses were performed for both composite mixtures and for the interface between the two components to identify and analyze the pores of the structures and the compatibility between the matrix and components. The SEM images of the microstructure of composite 1 are shown in Figure 17a,b, where the surface morphology indicates a homogenous material and the presence of both constituents, of which the dark gray area represents the polyester matrix. In addition, it was observed that calcium carbonate particles were integrated into the matrix, while cracks were not detected on the surface of composite 1.
All the constituents used in the manufacturing process can be identified within the microstructure of composite 2 (Figure 18a,b), where polyester resin covers all the constituents. It can be seen that the glass fiber monofilaments are randomly positioned, where it was observed that these monofilaments are glossy and sleek on the exterior, without impregnation from a blinder. The polymer is seen to be attached and bonded on the surface of the composite. The same thing can be observed for quartz particles, where the matrix is present on the particle surfaces.
Open porosity structures were identified (Figure 18), allowing a good connection with the adhesive cement. The bonding of ornamental panels can be realized by mechanical adhesion, where the adhesive enters into the porous material of the panel and forms a strong adhesive connection.
The interface between the surface layer and the structure material can be approximated as a linear shape, as shown in Figure 19a, where all the constituents are presented (shown in Figure 19b). This can be explained by a simplification hypothesis because the surface between composite 1 and composite 2 is not planar. The surface is determined by the stone breaking surface. For a small piece, such as a sample, this can be considered a planar surface. Calcium carbonate particles can be seen to be integrated into the polyester matrices, and quartz particles are covered by the matrix and connected by the surface layer material. A good connection between composite 1 and composite 2 was detected.

4. Conclusions

In this paper, a novel polymer concrete composite obtained by utilizing GFRP waste is investigated by 3D X-ray computed tomography and scanning electron microscopy analysis. This multi-material was used to manufacture ornamental synthetic panels for building decoration. The methodology used for the manufacturing allows for the development of a new class of materials from composite material waste. The manufacturing process was found to be stable.
The following conclusions are drawn:
  • The density of the new material proposed is 33.46% lower than that of the marble used as a datum model. The panel mass for the datum model (marble) was 15 kg, whereas the measured mass of the proposed material was 9.3 kg;
  • The ornamental panels used for building cladding must have a pleasant appearance, yet also have the lowest possible mass and best possible resistance to external factors. A further study will investigate the mechanical characteristics of the proposed material;
  • The proposed polymer concrete composite includes a large amount of GFRP waste (30%), and thus helps to protect the environment with regards to sustainable development;
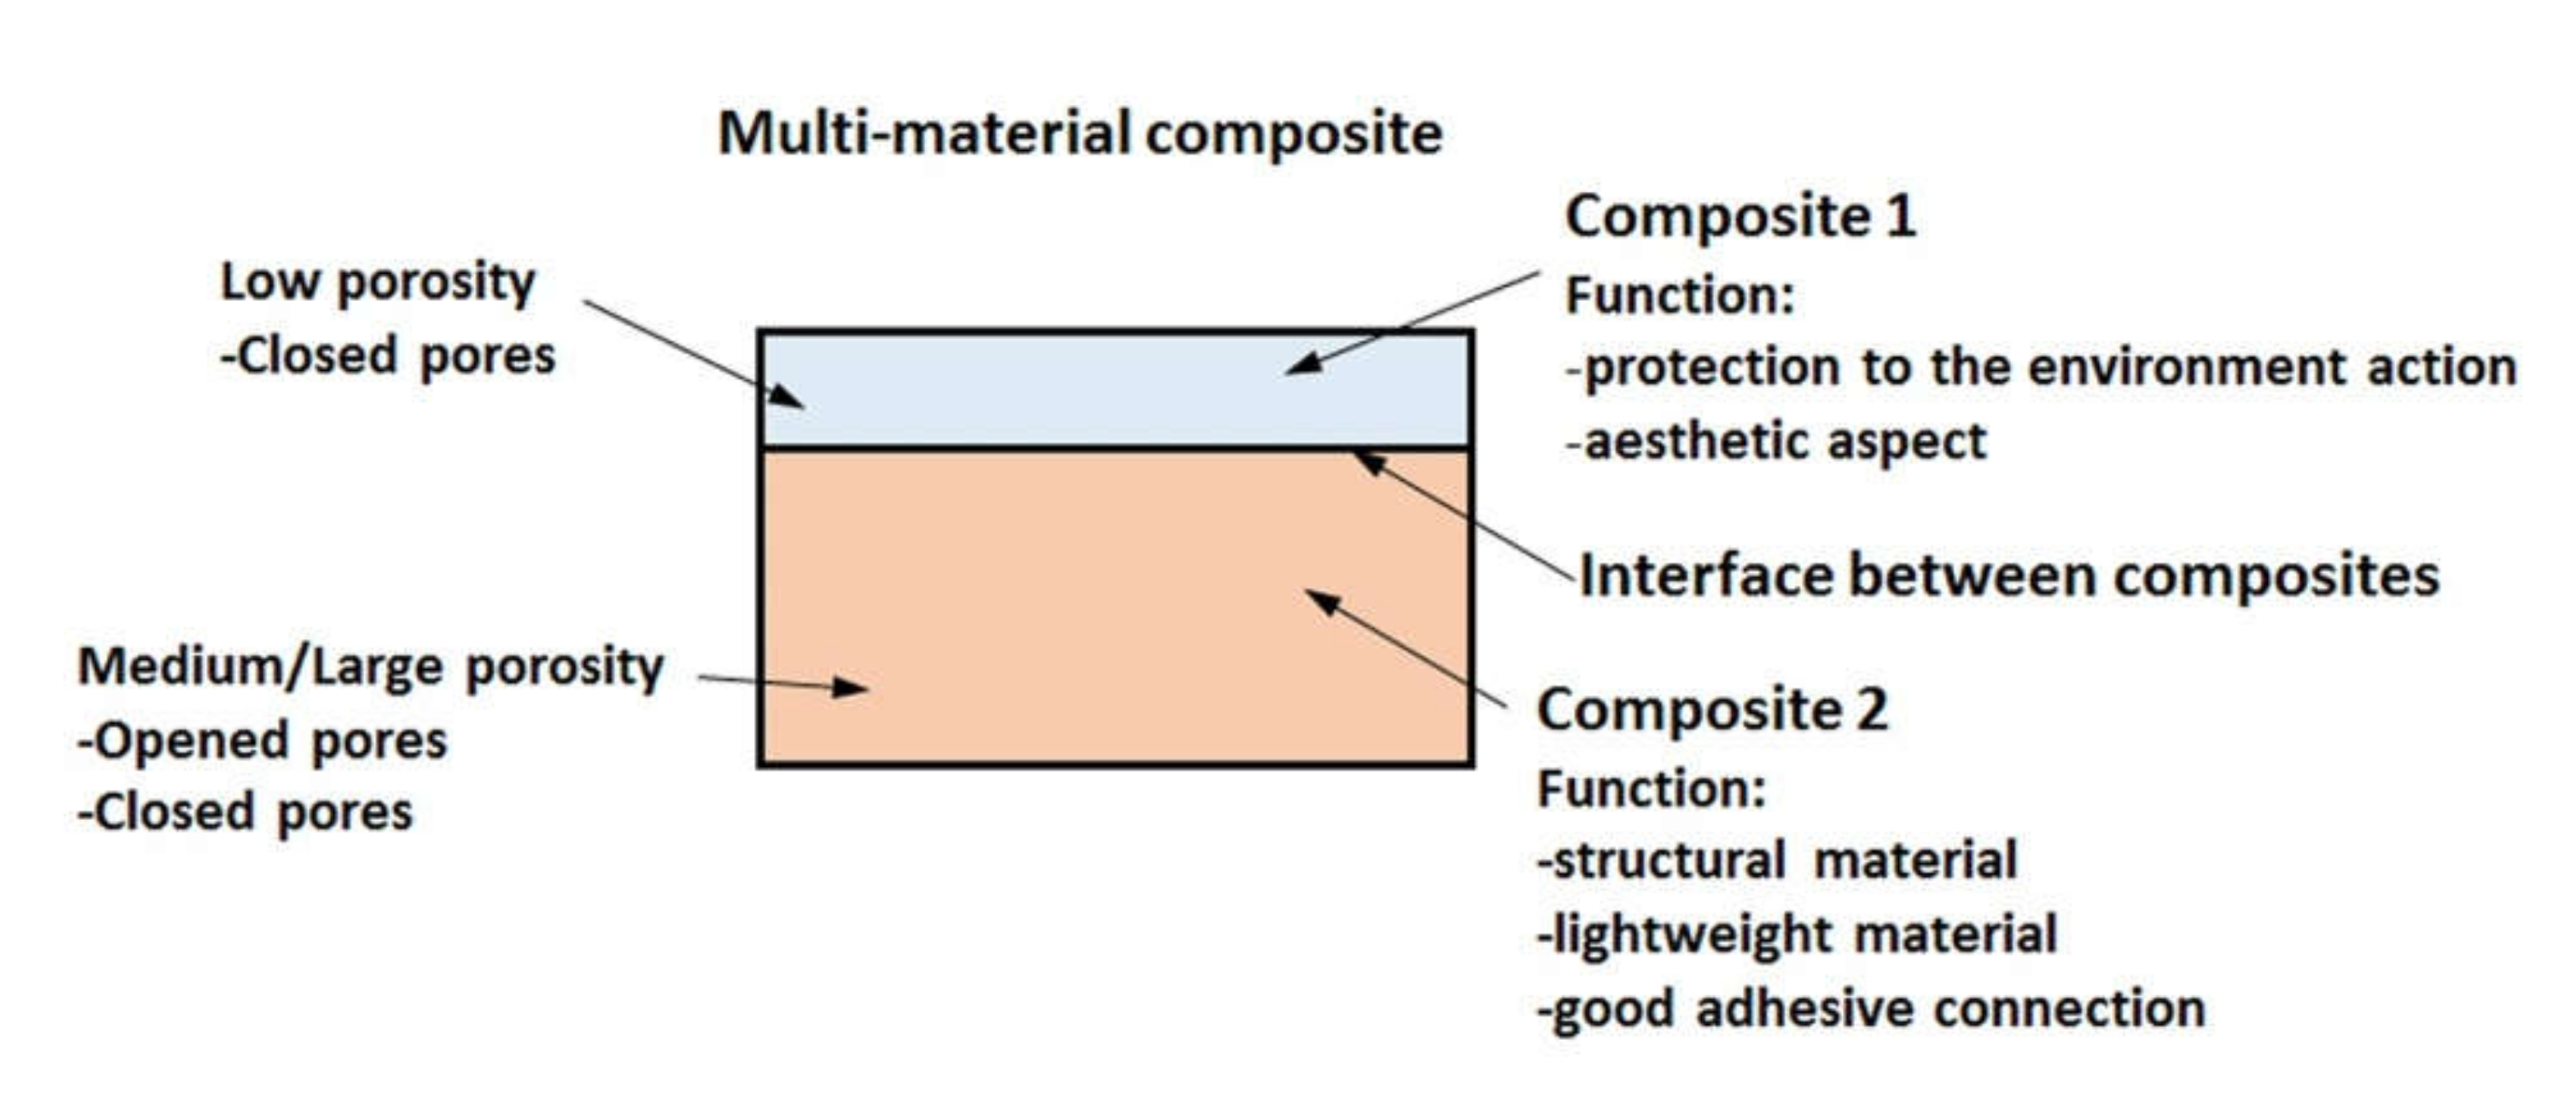
  • The new methodology proposed for CT analysis indicated results with a mean value of 0.146% for the porosity of composite 1 and 31.3% for composite 2. The porosity of composite 2 of the proposed multi-material offers advantages for building construction, such as being a lightweight material and providing good adhesive connection abilities. The porosity of composite 1 was observed as being lower than the porosity of the marble;
  • The mean porosity of a large panel can be obtained as an arithmetic mean of the determined porosities across all five samples cut from the panel, based on a sampling method;
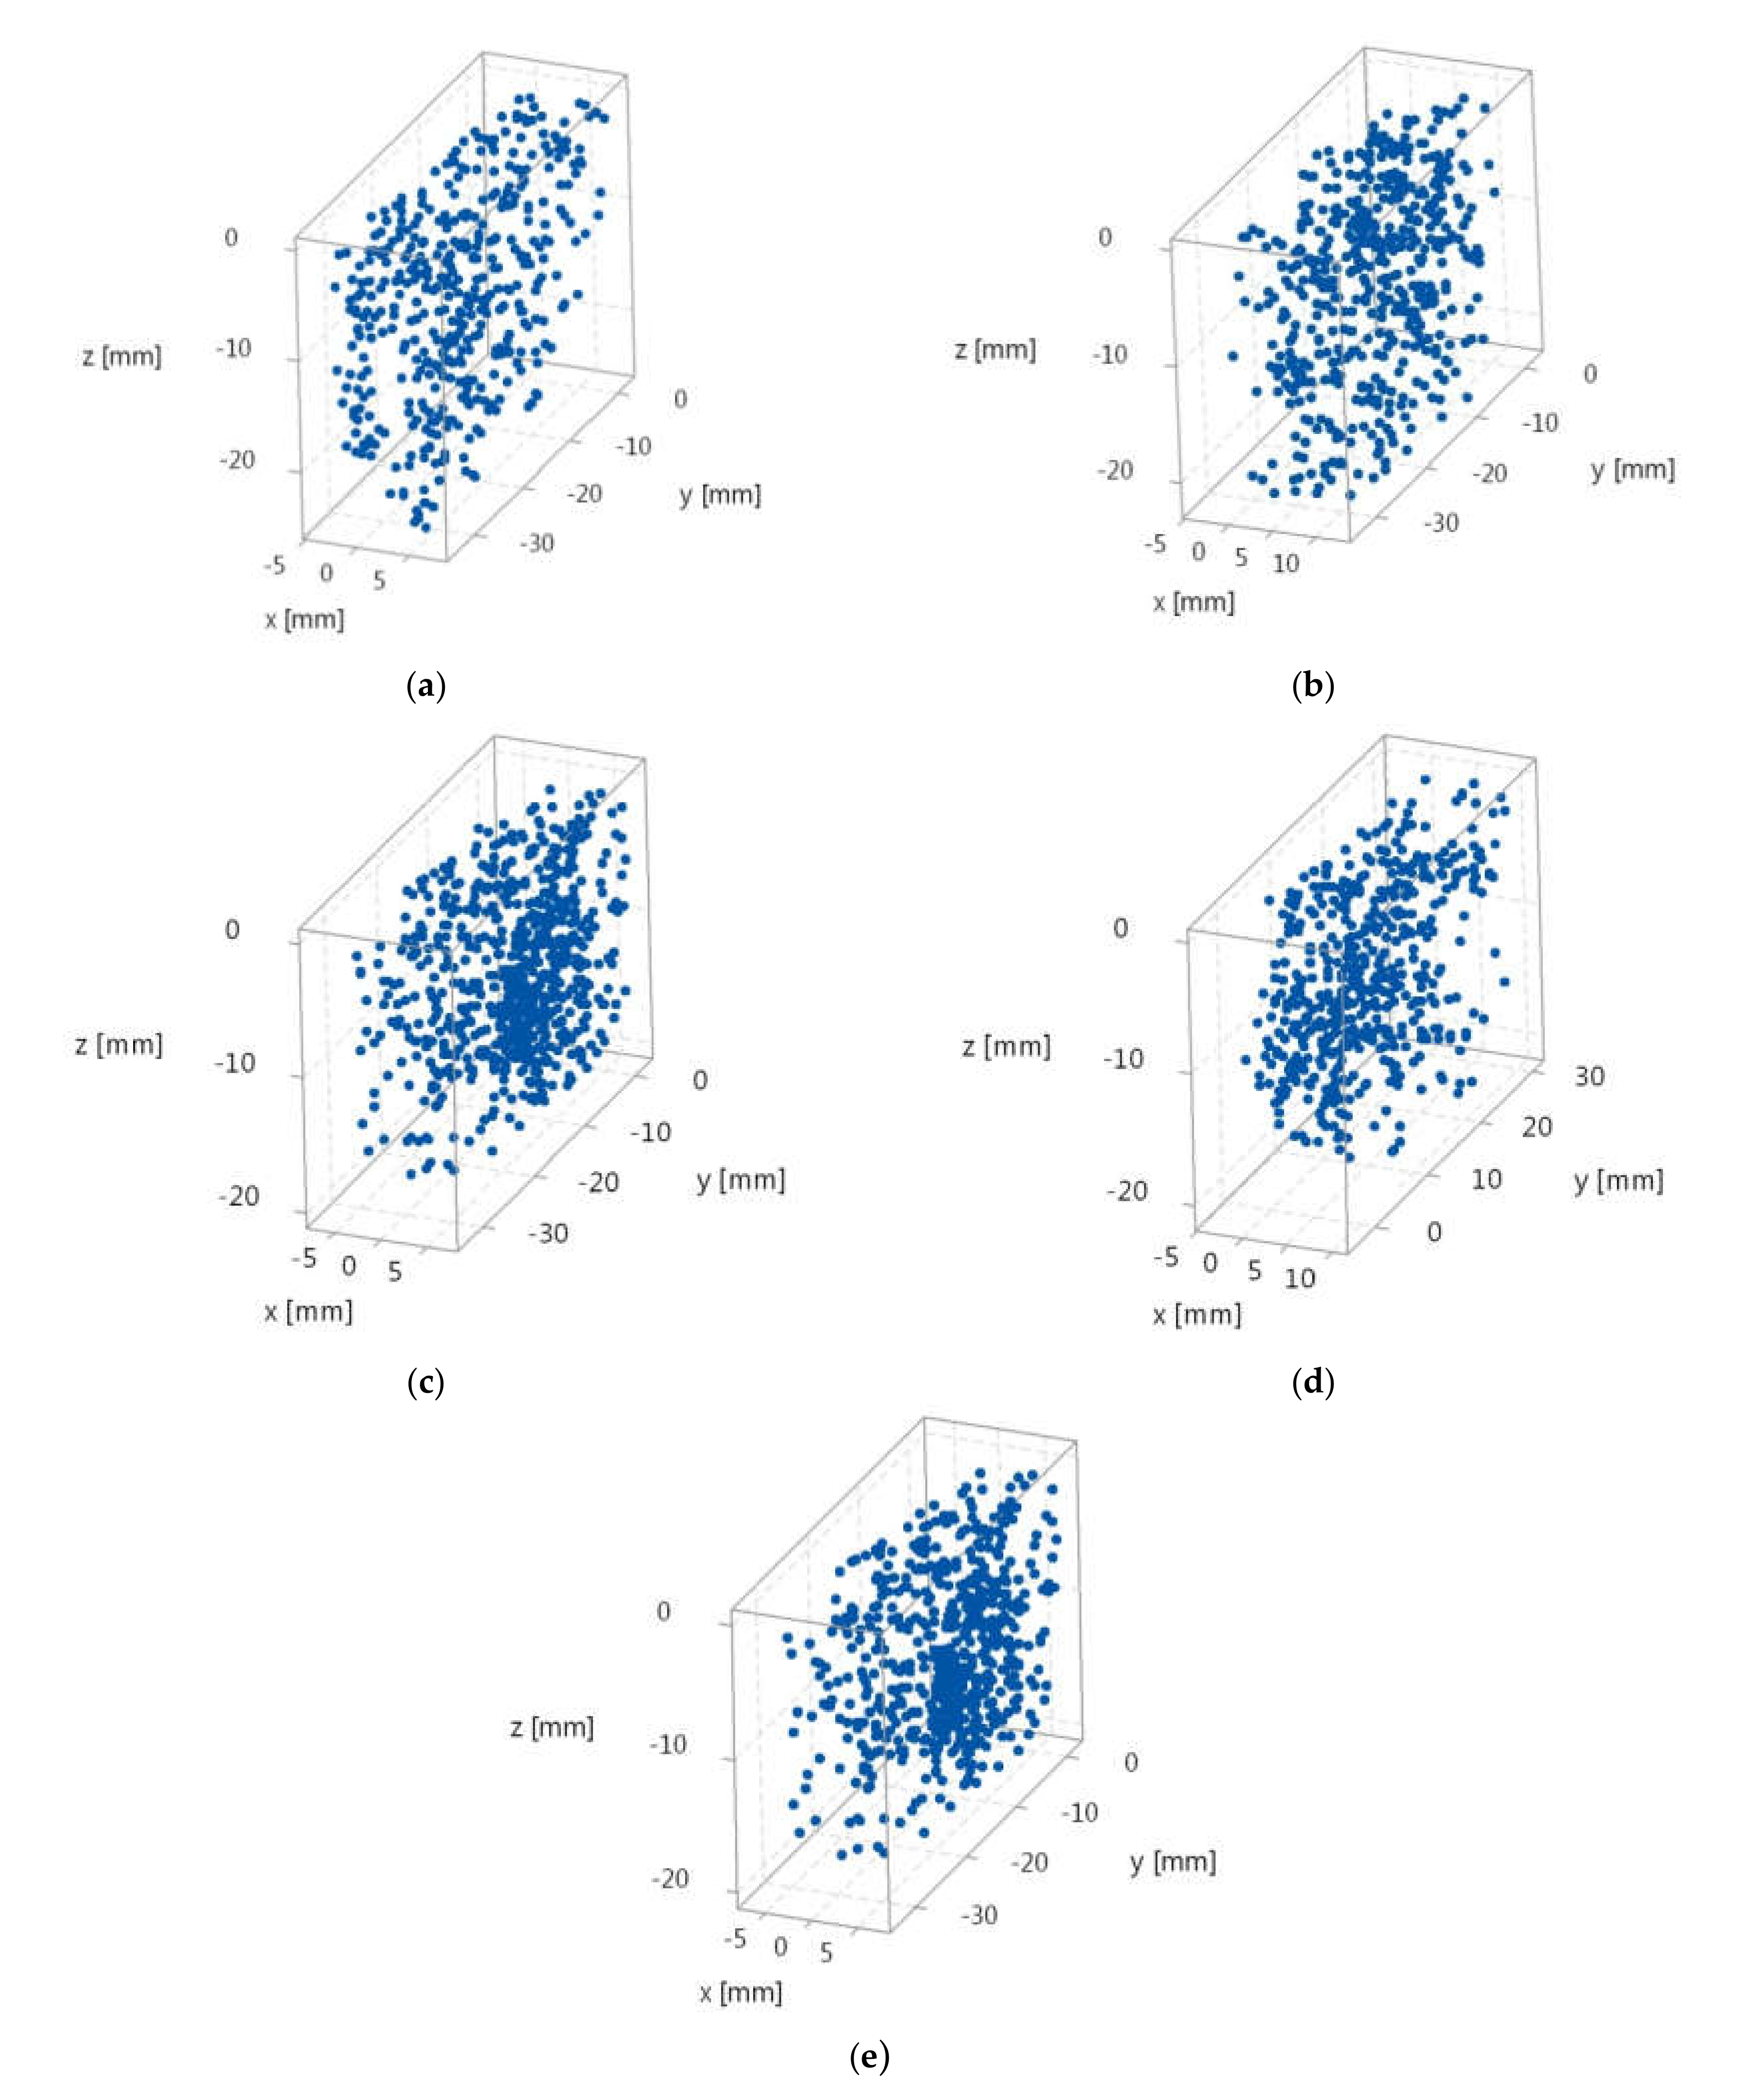
  • The homogeneous distribution of the pores within the multi-material composite for all samples was shown. Most pores detected by CT analysis were shown to be of an irregular shape, which was later confirmed by microstructure analysis;
  • The CT analysis only focused on the porosity investigation. The constituents of the composite material were investigated based only on SEM analysis. The surface morphology indicates constituents in a homogenous material, where a good connection between the surface layer material and structural composite material was detected.

5. Patent

The method and composite material for ornamental synthetic panels manufacturing. Authors: Sabău Emilia, Bâlc Nicolae Octavian, Bere Petru Paul. Patent no. RO 130062 / 28.02.2017, international classification C04B 14/36 (2006.01).

Author Contributions

Conceptualization, E.S., C.-Ş.M.-B., and R.U.; formal analysis, R.U.; investigation, I.B. and C.-Ş.M.-B.; methodology, R.U., E.S., and P.B.; project administration, E.S.; supervision, R.U.; visualization, E.S., R.U., I.B., P.B., and C.-Ş.M.-B.; writing—original draft, R.U. and P.B.; writing—review and editing, R.U. and P.B. All authors have read and agreed to the published version of the manuscript.

Funding

This research received no external funding.

Acknowledgments

The authors acknowledge of Technical University of Cluj-Napoca, Slovak University of Technology, and Transilvania University of Braşov, for providing the infrastructure used in this work.

Conflicts of Interest

The authors declare no conflict of interest.

References

  1. Ribeiro, M.C.S.; Dinis, M.L.; Castro, A.C.M.; Fiúza, A.; Ferreira, A.J.M.; Meixedo, J.P.; Alvim, M.R. On the recyclability of glass fiber reinforced thermoset polymeric composites towards the sustainability of polymers’ industry. Int. J. Waste Resour. 2016, 6. [Google Scholar] [CrossRef] [Green Version]
  2. Oliveux, G.; Dandy, L.O.; Leeke, G.A. Current status of recycling of fibre reinforced polymers: Review of technologies, reuse and resulting properties. Prog. Mater. Sci. 2015, 72, 61. [Google Scholar] [CrossRef] [Green Version]
  3. Meira Castro, A.C.; Ribeiro, M.C.S.; Santos, J.; Meixedo, J.P.; Silva, F.J.G.; Fiúza, A.; Dinis, M.L.; Alvim, M.R. Sustainable waste recycling solution for the glass fibre reinforced polymer composite materials industry. Con. Build. Mat. 2013, 45, 87–94. [Google Scholar] [CrossRef] [Green Version]
  4. Ahmad, S.; Umar, A.; Masood, A.; Gupta, N.; Iqbal, M. Properties of normal concrete, self-compacting concrete and glass fibre-reinforced self-compacting concrete: An experimental study. Plast. Impact Mech. 2017, 173, 807. [Google Scholar] [CrossRef]
  5. Aliabdo, A.; Abd Elmoaty, A.; Aboshama, A. Utilization of waste glass powder in the production of cement and concrete. Constr. Build. Mater. 2016, 124, 866. [Google Scholar] [CrossRef]
  6. Shokrieh, M.; Rezvani, S.; Mosalmani, R. Mechanical behavior of polyester polymer concrete under low strain rate loading conditions. Polym. Test. 2017, 63, 596. [Google Scholar] [CrossRef]
  7. Zegardło, B.; Szeląg, M.; Ogrodnik, P.; Bombik, A. Physico-mechanical properties and microstructure of polymer concrete with recycled glass aggregate. Materials 2018, 11, 1213. [Google Scholar] [CrossRef] [Green Version]
  8. Sathiyamurthy, S.; Syed Abu Thaheer, A.; Jayabal, S. Mechanical behaviours of calcium carbonate impregnated short coir fibre-reinforced polyester composites. Proc. IMechE Part L J. Materials Des. Appl. 2012, 226, 52–60. [Google Scholar] [CrossRef]
  9. Sultana, R.; Akter, R.; Alam, M.Z.; Qadir, M.R.; Begum, M.H.A.; Gafur, M.A. Preparation and characterization of sand reinforced polyester composites. IJET IJENS 2013, 13, 111–118. [Google Scholar]
  10. Yildizel, S.A. Mechanical performance of glass fiber reinforced composites made with gypsum, expanded perlite and silica sand. Rom. J. Mater. 2018, 48, 229–235. [Google Scholar]
  11. ASTM D4404-18, Standard Test Method for Determination of Pore Volume and Pore Volume Distribution of Soil and Rock by Mercury Intrusion Porosimetry; ASTM International: West Conshohocken, PA, USA, 2018; Available online: www.astm.org (accessed on 25 January 2020). [CrossRef]
  12. Kritikos, M.; Buranský, I.; Buranská, E.; Mojžiš, M. Evaluation of accuracy of seamless steel tube scanning by industrial computed tomography. MATEC Web Conf. 2019, 299, 04009. [Google Scholar] [CrossRef] [Green Version]
  13. ASTM E1441-19, Standard Guide for Computed Tomography (CT); ASTM International: West Conshohocken, PA, USA, 2019; Available online: www.astm.org (accessed on 27 January 2020). [CrossRef]
  14. Carmignato, S. Accuracy of industrial computed tomography measurements: Experimental results from an international comparison. CIRP Ann. Manuf. Technol. 2012, 61, 491–494. [Google Scholar] [CrossRef]
  15. Kruth, J.P.; Bartscher, M.; Carmignato, S.; Schmitt, R.; De Chiffre, L.; Weckenmann, A. Computed tomography for dimensional metrology. CIRP Ann. Manuf. Technol. 2011, 60, 821–842. [Google Scholar] [CrossRef]
  16. De Chiffre, L.; Carmignato, S.; Kruth, J.P.; Schmitt, R.; Weckenmann, A. Industrial applications of computed tomography. CIRP Ann. Manuf. Technol. 2014, 63, 655. [Google Scholar] [CrossRef]
  17. Villarraga-Gómez, H.; Lee, C.B.; Smith, S.T. Dimensional metrology with X-ray CT: A comparison with CMM measurements on internal features and compliant structures. Precis. Eng. 2018, 51, 291–307. [Google Scholar] [CrossRef]
  18. Garcea, S.C.; Wang, Y.; Withers, P.J. X-ray computed tomography of polymer composites. Compos. Sci. Technol. 2018, 156, 305. [Google Scholar] [CrossRef]
  19. Crupi, V.; Epasto, G.; Guglielmino, E. Computed tomography analysis of damage in composites subjected to impact loading. Frat. Integrità Strutt. 2011, 17, 32–41. [Google Scholar] [CrossRef] [Green Version]
  20. Liu, X.; Chen, F. Defects characterization in CFRP using X-ray computed tomography. Polym. Polym. Compos. 2016, 24, 149. [Google Scholar] [CrossRef]
  21. Liaptsis, G.; Clarke, A.L.; Nithiarasu, P. High resolution X-ray volumetric inspection of large planar amples using SART based computed laminography. In In Proceedings of the 56th Annual Conference of The British Institute of Non-Destructive Testing, Telford, UK, 5–7 September 2017. [Google Scholar]
  22. Grębowski, K.; Rucka, M.; Wilde, K. Non-destructive testing of a sport tribune under synchronized crowd-induced excitation using vibration analysis. Materials 2019, 12, 2148. [Google Scholar] [CrossRef] [Green Version]
  23. Nikishkov, Y.; Airoldi, L.; Makeev, A. Measurement of voids in composites by X-ray Computed Tomography. Compos. Sci. Technol. 2013, 89, 89–97. [Google Scholar] [CrossRef]
  24. Guessasma, S.; Nouri, H.; Roger, F. Microstructural and mechanical implications of microscaled assembly in droplet-based multi-material additive manufacturing. Polymers 2017, 9, 372. [Google Scholar] [CrossRef] [PubMed] [Green Version]
  25. Sabău, E.; Bâlc, N.; Bere, P. Method and composite material for ornamental synthetic panels manufacturing. RO 130062, International Classification C04B 14/36 (2006.01), 2017. [Google Scholar]
  26. Sabău, E. Recycling of polymeric composite materials. In Product Lifecycle Management—Terminology and Applications; Udroiu, R., Bere, P., Eds.; IntechOpen: London, UK, 2018; pp. 103–121. [Google Scholar] [CrossRef] [Green Version]
  27. Wahab, G.M.A.; Gouda, M.; Ibrahim, G. Study of physical and mechanical properties for some of Eastern Desert dimension marble and granite utilized in building decoration. Ain Shams Eng. J. 2019, 10, 907. [Google Scholar] [CrossRef]
  28. Krolczyk, J.B.; Legutko, S. Devices and equipment for mixing granular materials in industry. Appl. Mech. Mater. 2015, 809–810, 742–747. [Google Scholar] [CrossRef]
  29. VGSTUDIO. Available online: https://www.volumegraphics.com/de/produkte/vgstudio.html (accessed on 2 May 2019).
  30. Minitab. Getting Started with Minitab 17. Available online: https://www.minitab.com (accessed on 15 May 2019).
  31. Udroiu, R.; Braga, I.C.; Nedelcu, A. Evaluating the quality surface performance of additive manufacturing systems: Methodology and a material jetting case study. Materials 2019, 12, 995. [Google Scholar] [CrossRef] [Green Version]
  32. Plessis, A.; Sperling, P.; Beerlink, A.; Tshabalala, L.; Hoosain, S.; Mathe, N.; Rouxa, S.G. Standard method for micro CT-based additive manufacturing quality control 2: Density measurement. MethodsX 2018, 5, 1117. [Google Scholar] [CrossRef]
  33. Chung, S.Y.; Lehmann, C.; Abd Elrahman, M.; Stephan, D. Pore characteristics and their effects on the material properties of foamed concrete evaluated using micro-CT images and numerical approaches. Appl. Sci. 2017, 7, 550. [Google Scholar] [CrossRef] [Green Version]
  34. Vecchio, I.; Schladitz, K.; Godehardt, M.; Heneka, M.J. Geometric Characterization of Particles in 3D with an Application to Technical Cleanliness; Fraunhofer-Institut Fur Techno- Und Wirtschaftsmathematik: Kaiserslautern, Germany, 2011; pp. 1–33. [Google Scholar]
Figure 1. Schematic representation of the multi-material composite.
Applsci 10 02060 g001
Figure 2. (a) Resultant glass fiber waste from the grinding process. (b) Scheme stating material sampling positions taken from the panels.
Applsci 10 02060 g002
Figure 3. Cut samples from ornamental panel 1.
Applsci 10 02060 g003
Figure 4. (a) Layout of the X-ray CT analysis. (b) Precision digital scale.
Applsci 10 02060 g004
Figure 5. Methodology for porosity and density analysis of a multi-material composite.
Applsci 10 02060 g005
Figure 6. CT cross-sections through composite 2 of sample S1: (a) gray values indicate the material and porosity; (b) color map is used to indicate the pore volume size.
Applsci 10 02060 g006
Figure 7. CT cross-section images through composite 1 of sample S1: color map is used to indicate the pore volume size.
Applsci 10 02060 g007
Figure 8. Representative CT cross-sections of composite 1 and composite 2, with color-coding of pore volumes for samples S1, S2, S3, S4, and S5. The color map and the scale are valid for all subfigures. The visible white lines indicate the interfaces between composites for all the samples.
Applsci 10 02060 g008
Figure 9. The three-dimensional (3D) visualization of CT data for samples S1, S2, S3, S4, and S5; the sample was positioned with the composite 2 material facing upwards.
Applsci 10 02060 g009
Figure 10. Splitting procedure of the multi-material volume into constituent materials volumes for sample S1. A local coordinate system is represented within the figure.
Applsci 10 02060 g010
Figure 11. Visualization of the 3D stereolithography (STL) model for the multi-material composite (left column), composite 2 (middle column), and composite 1 (right column).
Applsci 10 02060 g011
Figure 12. (a) The interval plot of the panel porosity for composite 1. (b) The interval plot of the panel porosity for composite 2. (c) The interval plot of the panel density. Bars are one standard error from the mean. Individual standard deviations were used to calculate the intervals.
Applsci 10 02060 g012
Figure 13. The 3D distribution of the pores x, y, and z are the coordinates of the circumscribed sphere center of the pore: (a) sample S1; (b) sample S2; (c) sample S3; (d) sample S4; (e) sample S5.
Applsci 10 02060 g013
Figure 14. Closed pore volume distribution of sample S1: (a) versus X; (b) versus Y; (c) versus Z; (d) the number of pores versus pore volume.
Applsci 10 02060 g014
Figure 15. Panel 1: the intervals plot of (a) the number of pores, (b) pore diameters, (c) and the surfaces of the pores versus pore volume classes. Bars are one standard error from the mean.
Applsci 10 02060 g015aApplsci 10 02060 g015b
Figure 16. The sphericity (Sp) parameter of closed pores for: (a) sample S1; (b) sample S2; (c) sample S3; (d) sample S4; (e) sample S5.
Applsci 10 02060 g016aApplsci 10 02060 g016b
Figure 17. Scanning electron microscopy (SEM) images of composite 1: (a) 1:5 × 10⁻⁴ m scale (b); 1:1 × 10⁻⁵ m scale.
Applsci 10 02060 g017
Figure 18. SEM images of composite 2: (a) 1:5 × 10⁻⁴ m scale (b); 1:5 × 10⁻⁵ m scale.
Applsci 10 02060 g018
Figure 19. SEM images of the interface between composite 1 and the composite 2: (a) 1:1 × 10⁻⁴ m scale; (b) 1:1 × 10⁻⁵ m scale.
Applsci 10 02060 g019
Table 1. METROTOM 1500 measurement conditions.
Voxel Size (μm)88
Resolution1 k (1024 × 1024)
Number of projection1600
Cu filter (mm)0
Voltage (kV)160
Current (μA)550
Integration time (ms)1000
Gain
Position from source (mm)330
Measurement time (min)30
Scatter radiationoff
Table 2. Material characterization for the first experiment (panel 1).
Panel 1
SampleS1S2S3S4S5MeanSD 1
Vmulti_mat [mm3]777083507250718074807606-
V mat 1 [mm3]220631562283244528972597.4-
V mat 2 [mm3]556451944967473545835008.6-
V pore 1 [mm3]3.934.012.672.855.393.77
V pore 2 [mm3]189014851443156114941581.8-
P mat 1 [%]0.178%0.127%0.117%0.117%0.186%0.145%0.0003
P mat 2 [%]33.97%28.59%29.05%32.97%32.60%31.44%0.024
Mmulti-mat [g]13.33515.03112.53612.21612.04113.032-
ρmulti-mat [g/cm3]1.7161.81.7291.7011.7301.7350.038
1 SD—standard deviation.
Table 3. Material characterization of panels 2 and 3.
SamplesS1S2S3S4S5MeanSD 1
Panel 2
P mat 1 [%]0.171%0.100%0.113%0.187%0.132%0.141%0.0003
P mat 2 [%]31.49%28.62%33.92%30.81%29.64%30.90%0.0201
ρmulti-mat [g/cm3]1.7751.7251.7451.7181.7341.7390.0223
Panel 3
P mat 1 [%]0.177%0.107%0.119%0.154%0.209%0.153%0.00041
P mat 2 [%]33.19%28.44%31.96%33.34%30.86%31.56%0.02013
ρmulti-mat [g/cm3]1.731.7771.711.741.7591.7430.0258
1 SD—standard deviation.

