Article

Morphological Changes in H1299 Human Lung Cancer Cells Following W-Band Millimeter-Wave Irradiation

1
Department of Physics, Ariel University, Ariel 40700, Israel
2
Department of Molecular Biology, Ariel University, Ariel 40700, Israel
3
Department of Electrical & Electronic Engineering, Ariel University, Ariel 40700, Israel
*
Author to whom correspondence should be addressed.
Appl. Sci. 2020, 10(9), 3187; https://doi.org/10.3390/app10093187
Submission received: 26 March 2020 / Revised: 22 April 2020 / Accepted: 29 April 2020 / Published: 2 May 2020
(This article belongs to the Section Applied Biosciences and Bioengineering)

Abstract

:

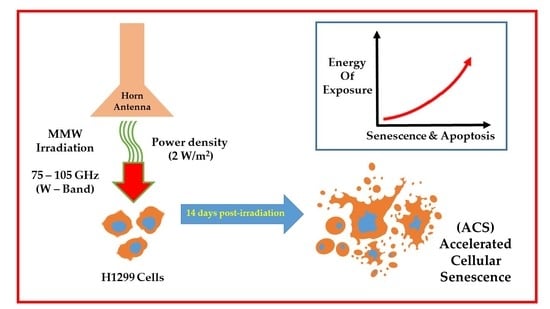
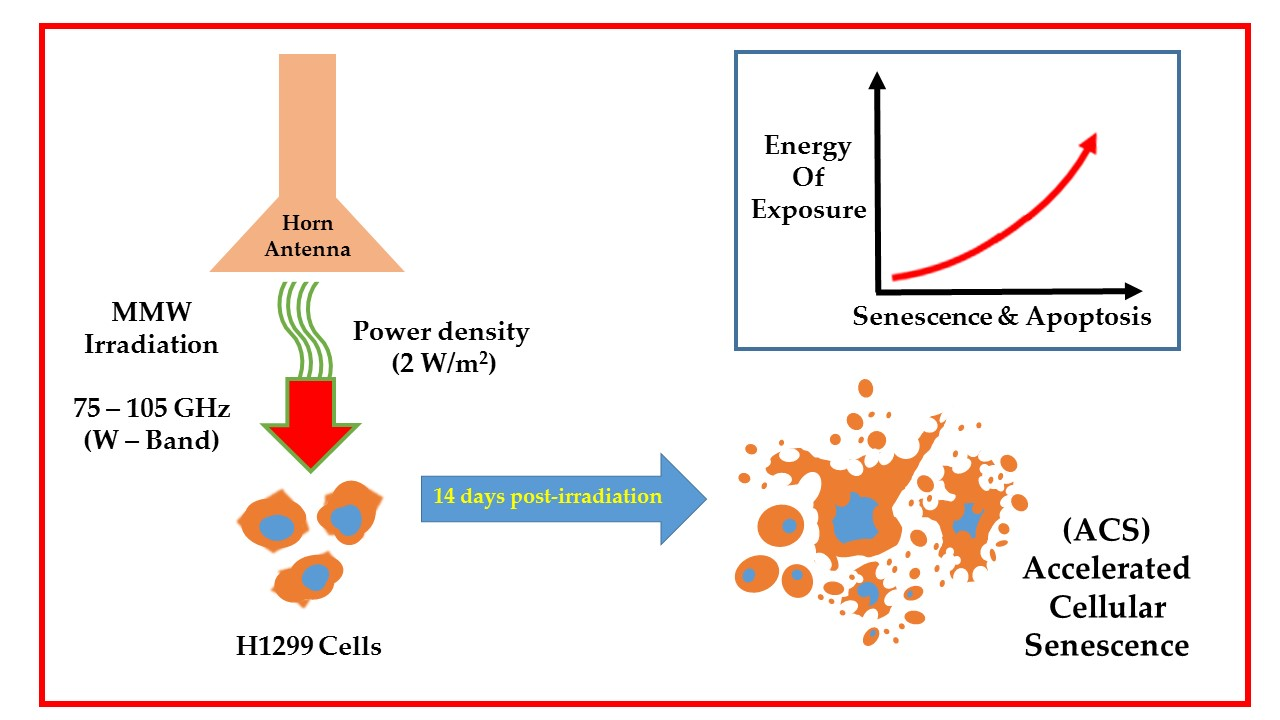
Featured Application

W-Band Millimeter-wave irradiation therapy for noninvasive treatment of human non-small cell lung cancer (NSCLC).

Abstract

Efficiently targeted cancer therapy without causing detrimental side effects is necessary for alleviating patient care and improving survival rates. This paper presents observations of morphological changes in H1299 human lung cancer cells following W-band millimeter wave (MMW) irradiation (75–105 GHz) at a non-thermal power density of 0.2 mW/cm2, investigated over 14 days of subsequent physiological incubation following exposure. Microscopic analyses of the physical parameters measured indicate MMW irradiation induces significant morphological changes characteristic of apoptosis and senescence. The immediate short-term responses translate into long-term effects, retained over the duration of the experiment(s), reminiscent of the phenomenon of accelerated cellular senescence (ACS), and achieving terminal tumorigenic cell growth. Further, results were observed to be treatment specific in an energy (dose)-dependent manner and were achieved without the use of chemotherapeutic agents, ionizing radiation, or thermal ablation employed in conventional methods, thereby overcoming the associated side effects. Adaptation of the experimental parameters of this study for clinical oncology concomitant with current developmental trends of non-invasive medical endoscopy alleviates MMW therapy as an effective treatment procedure for human non-small cell lung cancer (NSCLC).

Graphical Abstract

1. Introduction

Lung cancer is the leading cause of cancer deaths among men and second among women worldwide [1]. The 5-year survival rates are very low, ranging from 15.6% in the USA to as low as 8.9% in Europe, China, and developing countries [1]. Lung cancer is histologically categorized as small cell lung cancer (SCLC) and non-small cell lung cancer (NSCLC). Arising from epithelial cells [2] NSCLC accounts for 80–85% of all cases. Common types of treatment methods include surgery, radiotherapy [3], and chemotherapy. However, most conventional treatments to control tumor growth are often reported to give rise to many other detrimental side effects [4] due to cross reactions of chemotherapy drugs with healthy tissue and the use of ionizing radiations in radiotherapy. Further, post-treatment supportive care after chemotherapy is reported to go only so far as to improve survival rates very slightly [5]. Therefore, the development of new and innovative therapies allowing efficient targeting of tumor growth without giving rise to unfavorable after effects is necessary to improve survival rates and alleviate patient care.
Millimeter waves (MMWs) classified as non-ionizing radiation are electromagnetic fields (EMFs) of extremely high frequencies (30–300 GHz) with corresponding wavelengths of 10–1 mm. With a relatively low photon energy of 0.0004 eV (1 eV = 1.6 × 19 J), MMWs are unable to destroy inter-atomic bonds [6], but they are capable of exciting rotational, torsional, and longitudinal vibration modes of molecules, potentially causing heating. The guidelines of the International Commission on Non-Ionizing Radiation Protection (ICNIRP) stipulate the measurement of power density (PD) using units of W/m2 for the exposure of biological tissue to MMW irradiation [6]. The ICNIRP recommends limiting the power density within 200 W/m2 in order to limit adverse thermal effects on biological tissue. Long-term (94 h) MMW irradiation within the 70–300 GHz range maintained at a low incident power of 10 μW so as not to adversely increase cell temperature (non-thermal effects) [7] reported no difference in cellular activity or toxicity between exposed and sham normal human skin fibroblast (NB1RBG) or human glioblastoma (A172) cells.
Low power (<10 mW/cm2) MMW at 42 GHz reduces cell proliferation in yeast [8] although 341 GHz irradiation (at 5.78 mW/cm2) enhances yeast growth [9], the dichotomy explained as an application of the Frohlich hypothesis. In contrast, 42–53 GHz MMW within an incident power density (IPD) of <1 mW/cm2 does not affect the cell proliferation or cell cycle of Roswell Park Memorial Institute Medium (RPMI) 7932 human skin malignant melanoma cells [10]. MMW irradiation of a specific frequency and dosimetry gives rise to changes of the organelle structures and cell membrane permeability [11,12,13]; alterations of DNA, RNA, and proteins; and the activation or inhibition of signal transduction mechanisms [14]. Such observed effects have led to a growing interest in the application of non-thermal effects of MMW irradiation to target and kill cancer cells using tuned systems triggering biological actions. Previously, our group reported non-thermal effects of 75–105 GHz (W-band) MMW irradiation on human lung cancer cells [15]. In this study, we characterized the associated morphological changes corresponding to specific exposure conditions, using physical parameters of cell dimensions in order to better understand the mechanism of the radiation effect on the cell. This will allow the optimization of MMW irradiation therapy to treat human non-small cell lung cancer (NSCLC) within the most efficient safety limits with targeted specificity. For this purpose, H1299 human lung cancer cells were exposed to MMW irradiation in the range of 75–105 GHz within a stipulated non-thermal range of 2 W/m2. Irradiation was performed under 2- and 4-min exposure regimes in order to determine the energy dependence of the observed effects. After irradiation, cells were incubated under physiological conditions and their physical dimensions/parameters analyzed over a period of 14 days to identify immediate and prolonged effects. The dielectric properties of the cell carrier vessels (Petri dishes) and the culture medium were characterized prior to irradiation of the cell samples.

2. Materials and Methods

2.1. Cell Culture

Human lung cancer cells, H1299 (also known as NCI-H1299 or CRL-5803), were generously provided by Professor Uri Alon of the Weizmann Institute (Rehovot, Israel). Cells were cultured in RPMI 1640 medium (Biological Industries, Beth Ha’emek, Israel) supplemented with 10% fetal bovine serum (FBS) from Biological Industries (Cat. Nub. 04-001-1A), 1% penicillin-streptomycin (Sigma, St Louis, MO, USA), and 2 mM glutamine (Biological Industries, Beth Ha’emek, Israel). Cells were incubated at 37 °C with 5% CO2 supply. The proliferation rate of all cells was similar, with a doubling time of 12 to 14 h, under these conditions.

2.2. Irradiation Setup

An experimental setup similar to the one described by Homenko et al. [16] was used, modified for operation in the full W-band (75–110 GHz). It consisted of a Scanning 8360B Series Swept Signal Generator and an 8757D Scalar Network Analyzer (Agilent™). The sweeping frequency synthesizer was operated at 10–20 GHz serving as an input into a solid-state multiplier. A multiplying factor of 6 generated an output signal of 75–110 GHz corresponding to wavelengths (λ) of 4–2.725 mm. The waves transmit through the reflectometer connected to two directional couplers arranged facing each other in opposite directions. The setup was calibrated for the reflection mode and the reflection coefficient measured on the analyzer. MMWs were partly reflected, partly absorbed, and partly transmitted through the sample. The reflection coefficient was estimated in decibels (dB) as a logarithmic ratio:
s = 10 log 10 ( P r P o )
where P r and P o are the reflected and incident powers, respectively. Cell irradiation was performed in a sweeping regime from 75 to 110 GHz over 2000 steps in frequency. One run over this range took 200 ms.

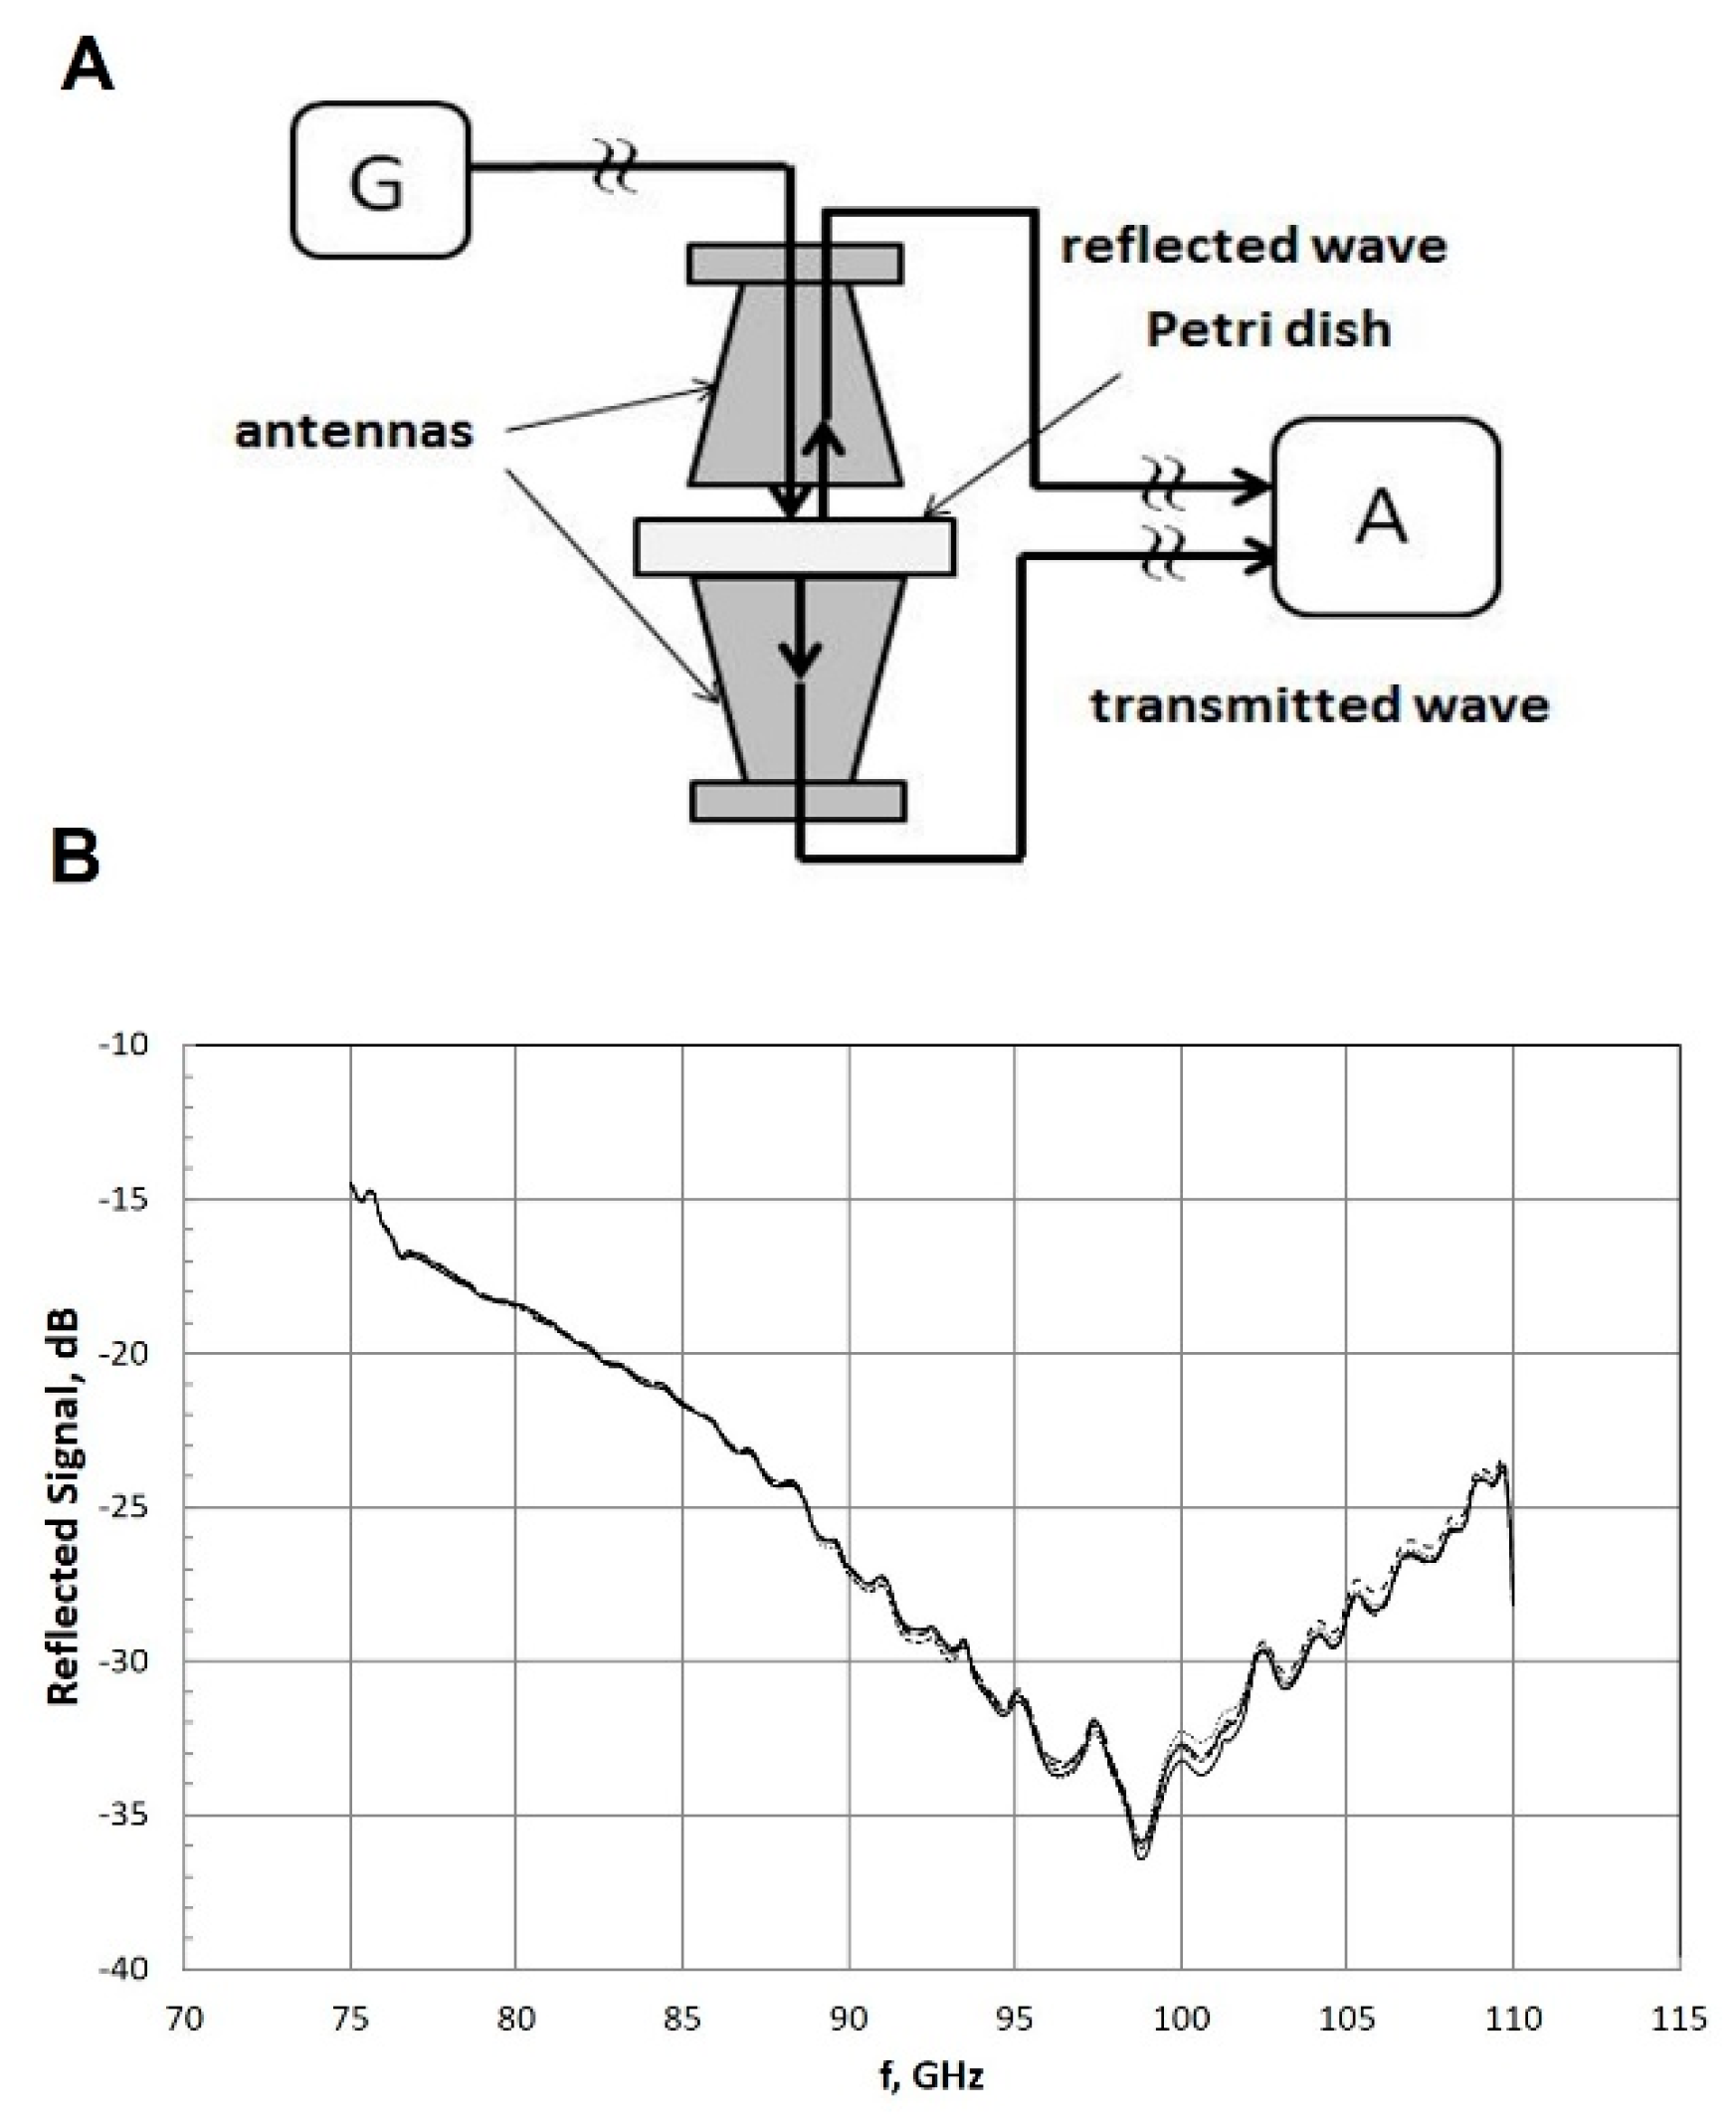
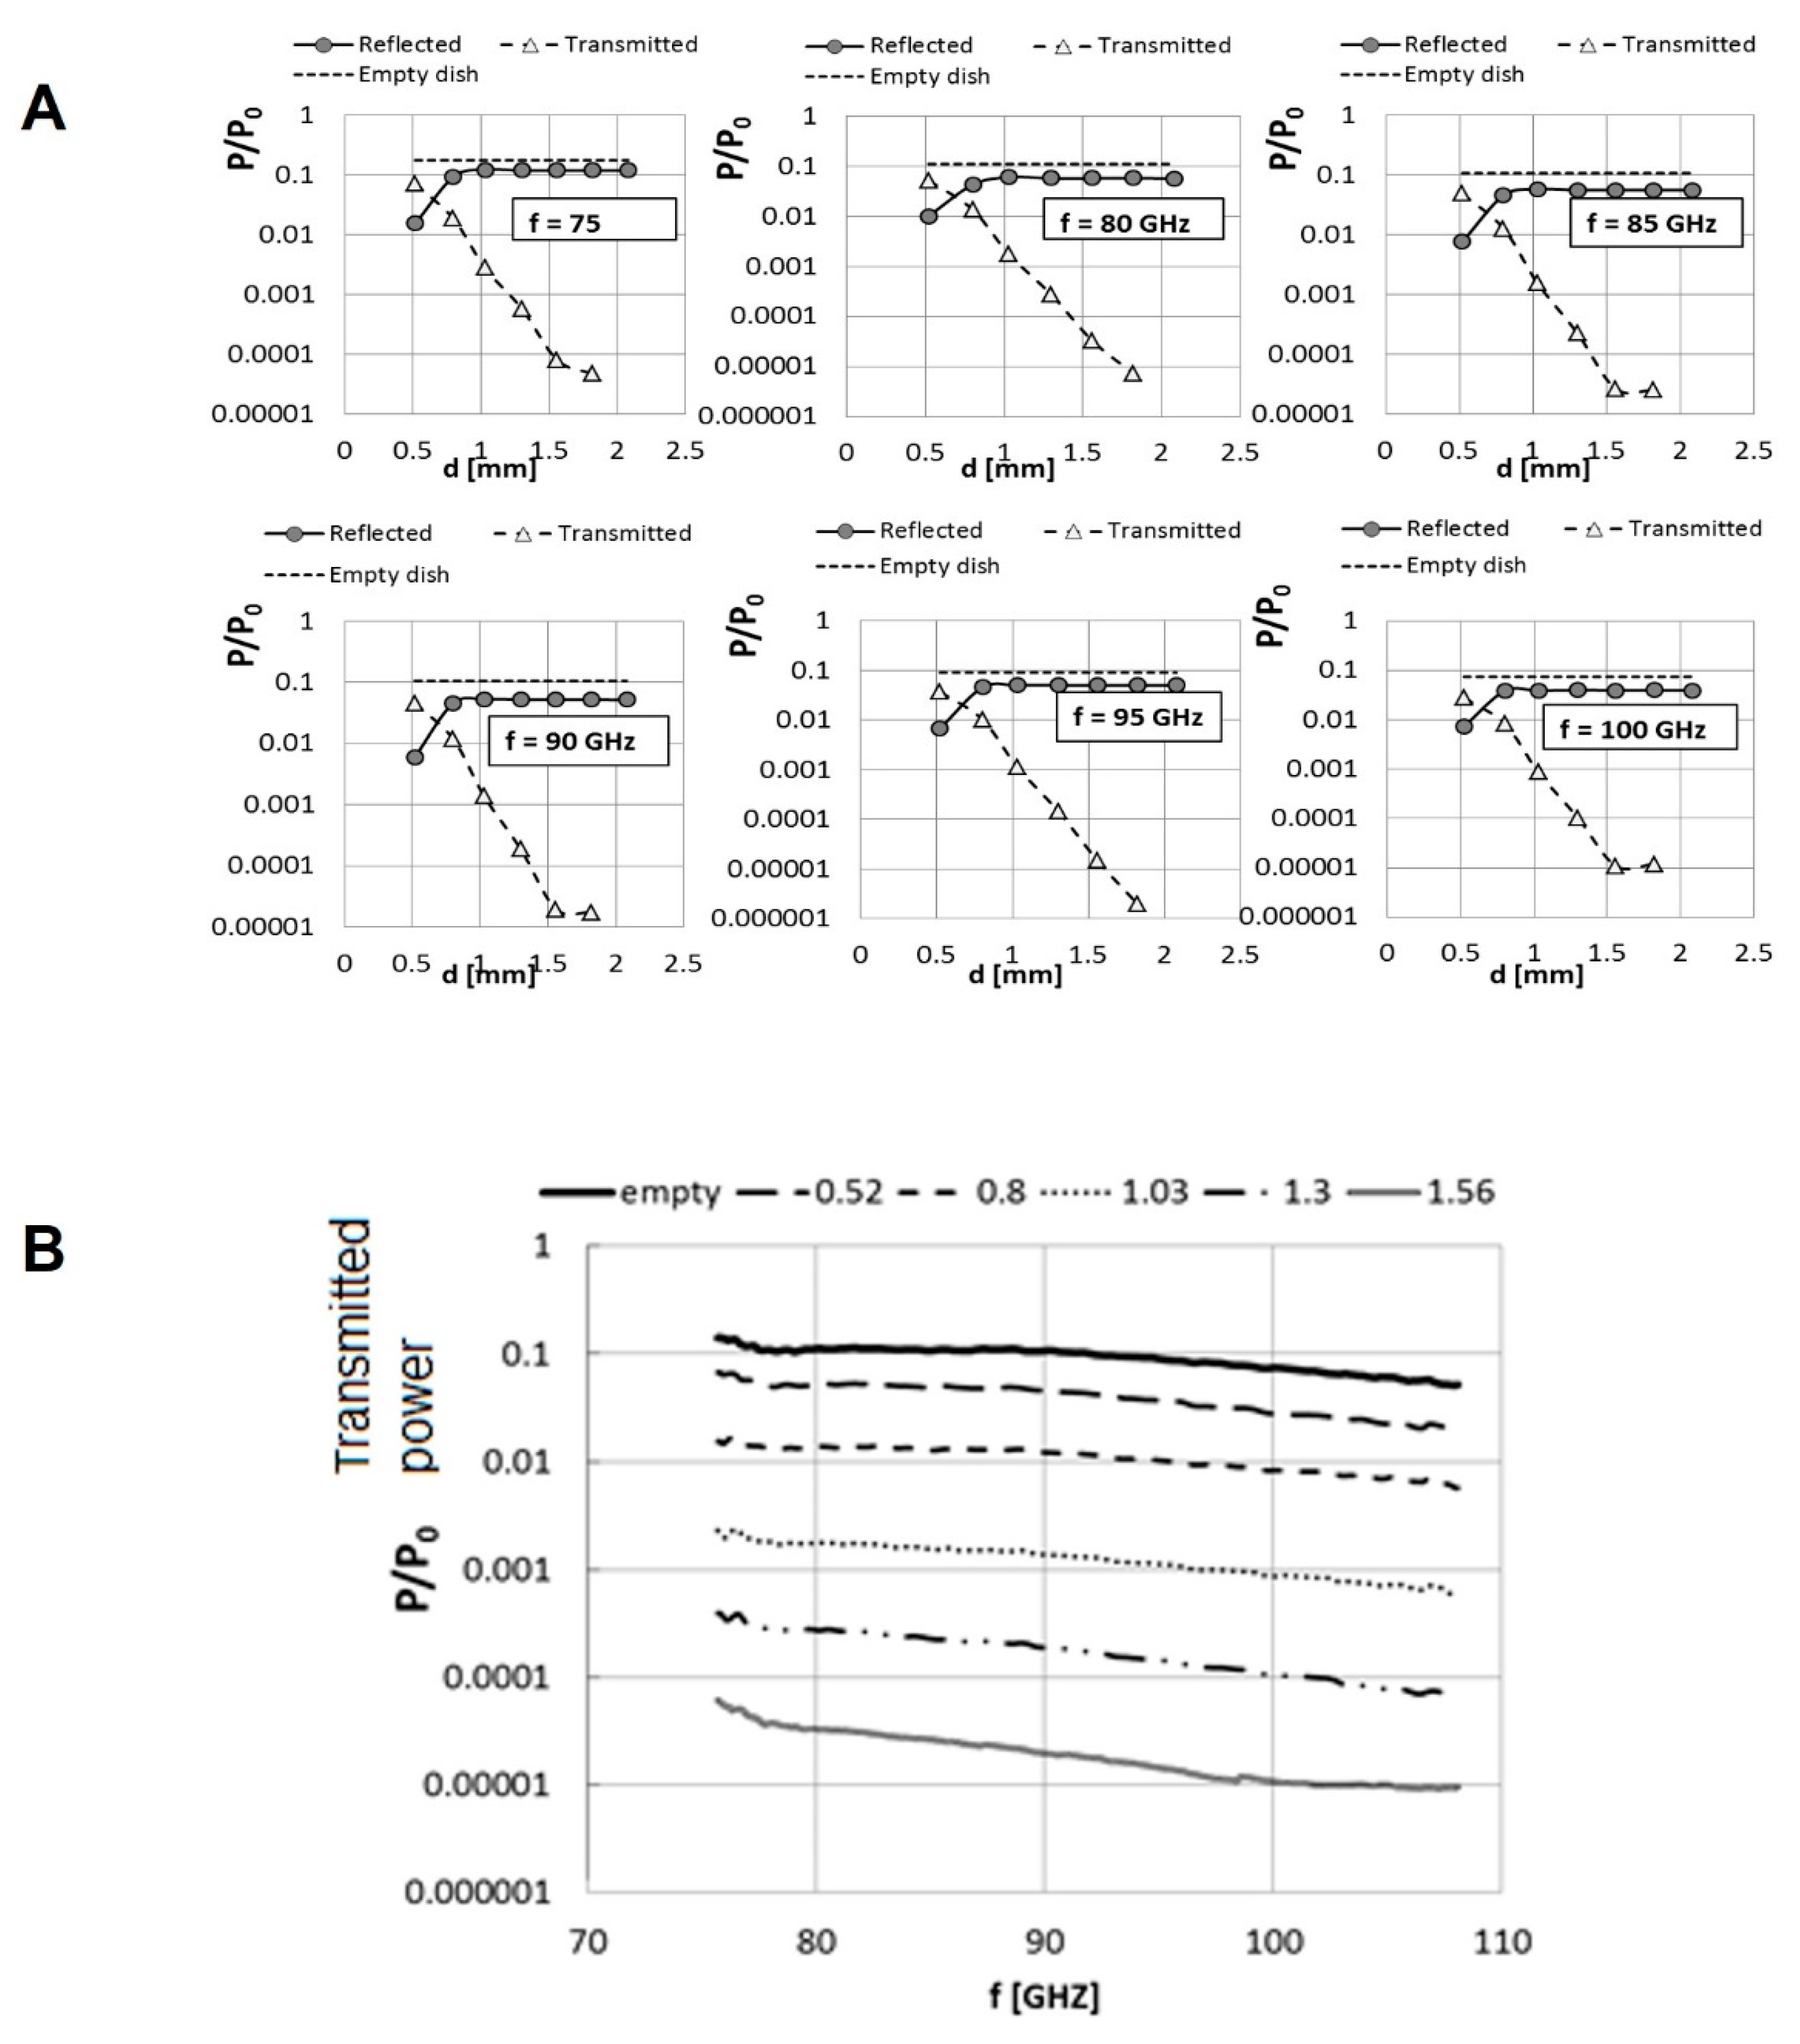
2.3. Penetration of MMW through Petri Dish and Cell Growth Medium

The responses of five empty Petri dishes from different manufacturers to low-intensity MMW irradiation were recorded and compared. Petri dishes from Nunc™ (Thermo Fisher Scientific®) showed the best results in terms of uniformity and good transparency, hence all experiments were performed using these Petri dishes. An empty dish was placed over the lower antenna and the reflected and transmitted signals were measured in the sweeping regime from 75 to 110 GHz. Then, using a micropipette with an accuracy of 1 µL several doses of 0.25 mL RPMI 1640 medium were successively added to obtain volumes of 0.5, 0.75, 1.00, 1.25, 1.50, 1.75, and 2.00 mL. These volumes correspond to an RPMI 1640 medium layer thickness d = 0.52, 0.80, 1.03, 1.30, 1.56, 1.82, and 2.08 mm in the Petri dish. For each new volume, a new sweeping run was executed. From the obtained measurements in dB presented by Equation (1), the normalized reflected and transmitted powers were calculated by:
P P o = 10 s / 10 ,
where P is either the reflected or transmitted power and P o the incident power, respectively.

2.4. Exposure Conditions

A pyramidal horn antenna, model SGH-10 (Millitech Inc.), with aperture dimensions of 20 mm × 25 mm was used to irradiate the test samples. Here, 1 mW incident power was used for all irradiation experiments, translating to a power density of 2 W/m2 (0.2 mW/cm2). Every single experiment was repeated four times and involved irradiation of approximately 2 × 10⁵ cells per dish when the cells reached 30% confluence. To investigate the MMW effects on morphology, cells were irradiated under specific time regimes. Cells were seeded on (15 mm) microscopic coverslips in a cell culture dish of a 30 mm diameter prior to irradiation. Samples for irradiation were prepared from cells reaching 30% confluence. The number of plates prepared corresponded to the experimental schematics presented below. Control and test samples were examined every 2–3 days in order to prevent 100% confluence. Cells reaching 60% confluence were detached and transferred to new plates in order to avoid overcrowding. Transferred cells were seeded again at 30% confluence for future growth and examination. These procedures were repeated over the 14-day observation period.
Each experiment lasted up to 14 days. On day 1, cells were irradiated with MMW for 2 (Group a) or 4 min (Group b), respectively. Following irradiation, cells were incubated at 37 °C with 5% CO2 for up to 14 days. Slides of cell samples were prepared at specific time points: Day 1 (90 min after irradiation), Day 7, and Day 14. Digital images of live cells were taken using a light microscope on Day 1, Day 7, and Day 14, respectively. In order to rule out morphological changes due to cell proliferation and not specific to MMW irradiation, two controls were used: 1) Cells that underwent the same procedures but were not irradiated, and 2) cells that were left untouched in the incubator. Control samples were assessed at the same time points as the irradiated cells (i.e., at Day 1, Day 7, and Day 14 of the experiment).

2.5. Microscopy and Image Processing

MMW effects on the morphology of the cells were examined using a Nikon fluorescent microscope (Nikon Instruments Inc., Melville, NY) at a magnification of 200×. H1299 cancer cells present high morphological heterogeneity. Magnification at 200× allowed an examination of sufficiently high numbers of cells to make statistically significant quantitative analysis. Images were captured using a digital color-chilled 3CCD camera (Hamamatsu, Bridgewater, NJ) and visualized using the NIS Elements microscope software program (Nikon Instruments Inc.). Image processing and analysis were performed using the ImageJ (Java-based image processing program developed at the National Institutes of Health, MD). Parameters of cell area, cell circularity, and Feret’s diameter were evaluated for irradiated and control samples. In total, 8000 to 10,000 cells were examined in each experiment. Every experiment was repeated four times.

2.6. Statistical Analysis

Statistical analyses were performed using the GraphPad Prism program (GraphPad Software, La Jolla, CA). Multivariate analysis of variance (MANOVA) and the Tukey–Kamer multiple comparison test were used for comparing the irradiated cells with the control groups, and for comparing the changes in irradiated cells at different exposure times. The means of the measured parameters (area, circularity, and Feret’s diameter) for the respective groups were considered equal for the null hypothesis in all cases. A p-value < 0.05 was considered significant for rejecting the null hypothesis for all experiments.

3. Results

3.1. Millimeter Waves Can Penetrate through Petri Dishes

In order to characterize their dielectric properties, Petri dishes were irradiated from above (Figure 1a). MMWs reflected from the petri dishes were detected. The range of reflected power for frequencies of 75–100 GHz was found to be reduced by −15 to −35 dB with respect to the incident power (corresponding to 3–0.03% of the incident power), respectively (Figure 1b). The frequency spectrum of the reflected signal of all tested Petri dishes coincided.

3.2. Millimeter Waves Transmit through RPMI 1640 Cell Growth Medium without Generating Thermal Heat

The wavelength of MMWs is comparable to the layer thickness of the RPMI 1640 medium (2–3 mm) used. Additionally, MMWs undergo multiple reflections in the RPMI 1640 medium. Reflected waves (from the sample) are a combination (interference) of waves reflected from the surface of the nutrition media, the bottom of the dish, and from the cells under investigation. Single (discrete) frequency irradiation regime requires fine adjustments of the distance between the sample and antenna in order to obtain conditions of constructive interference. In contrast, irradiation under a continuous sweeping of frequency allows for repeated wavelength changes over each run, providing conditions of constructive and destructive interference successively. This is advantageous and overcomes the necessity for fine adjustments. Thus, at least during half the duration of a single run, efficient power delivery is obtained. Therefore, all experiments were conducted in the sweeping regime.
Although several studies have evaluated the real and simulated dielectric constant of RPMI medium for frequencies up to 72 GHz [17,18], such data is lacking in the MMW W-band (75–105 GHz) range used in our experiments. Hence, we tested the amount of energy that gets reflected from and penetrates through the culture medium consisting of RPMI 1640 cell growth medium supplemented with 10% fetal bovine serum (FBS) and 1% penicillin/streptomycin. This basic medium consists of about 40 nutrition ingredients, including various types of proteins present in FBS, diluted in water. The dependence of the reflected and the transmitted signals (normalized to the antenna emitting power P0 ≈ 1 mW) on the thickness of RPMI 1640 medium layer in the Petri dishes was studied for different frequencies (Figure 2a). The ratio of the transmitted and incident power decreases as the thickness of the media increases. For a medium layer thickness of 2 mm, the ratio decreases by a factor of 10−4–10−5. In absolute values, this ratio corresponds to 10–100 nW of power reaching the population of cells adhered at the bottom of the dish. In other words, maximum incident power is absorbed in an RPMI 1640 medium layer thickness of 2 mm. As the medium consists mostly of water, we used the heat capacity of water to estimate the temperature rise during irradiation using:
Δ T P T t c m
where t is the exposure time, c is the heat capacity (4.18 J/g·K), and m is the sample mass (1.50 g). This estimation is based on the assumption that the penetrating power decreases exponentially with depth due to an increased absorption of incident energy. Our calculations predict a temperature rise of no more than 0.2–0.4 K for 2–4 min of irradiation of samples immersed in 2 mL of RPMI 1640 medium. Further, the temperature of the medium during the duration of exposure was measured to be in the range of 24–26 °C.
In order to maximize the power delivery to cells under irradiation and minimize attenuation loss arising from absorption by culture media, we examined the full frequency spectra (75–105 GHZ) of the transmitted signals penetrating through Petri dishes with different RPMI 1640-layer thicknesses (Figure 2b). Here, −7.6 dB is the free space path loss (FSPL) for the 25-mm separation distance between the two +24 dB gain antennas of our setup, as detailed above (Figure 1). Insertion of an empty dish increased the loss of the initial power by approximately 70% due to attenuation by the polystyrene of the dish (Figure 2b). The transmitted power level in the empty dish decreased by one order of magnitude with the introduction of culture medium, corresponding to an attenuation of about −10 dB. The results indicate an RPMI layer thickness of 0.5 mm as the best working range, translating to a volume of 0.5 mL of RPMI 1640 medium. Maximum transmitted power is allowed to reach the suspended cells upon irradiation at 75–105 GHz in this range. Therefore, all subsequent experiments were performed using this volume of culture media.

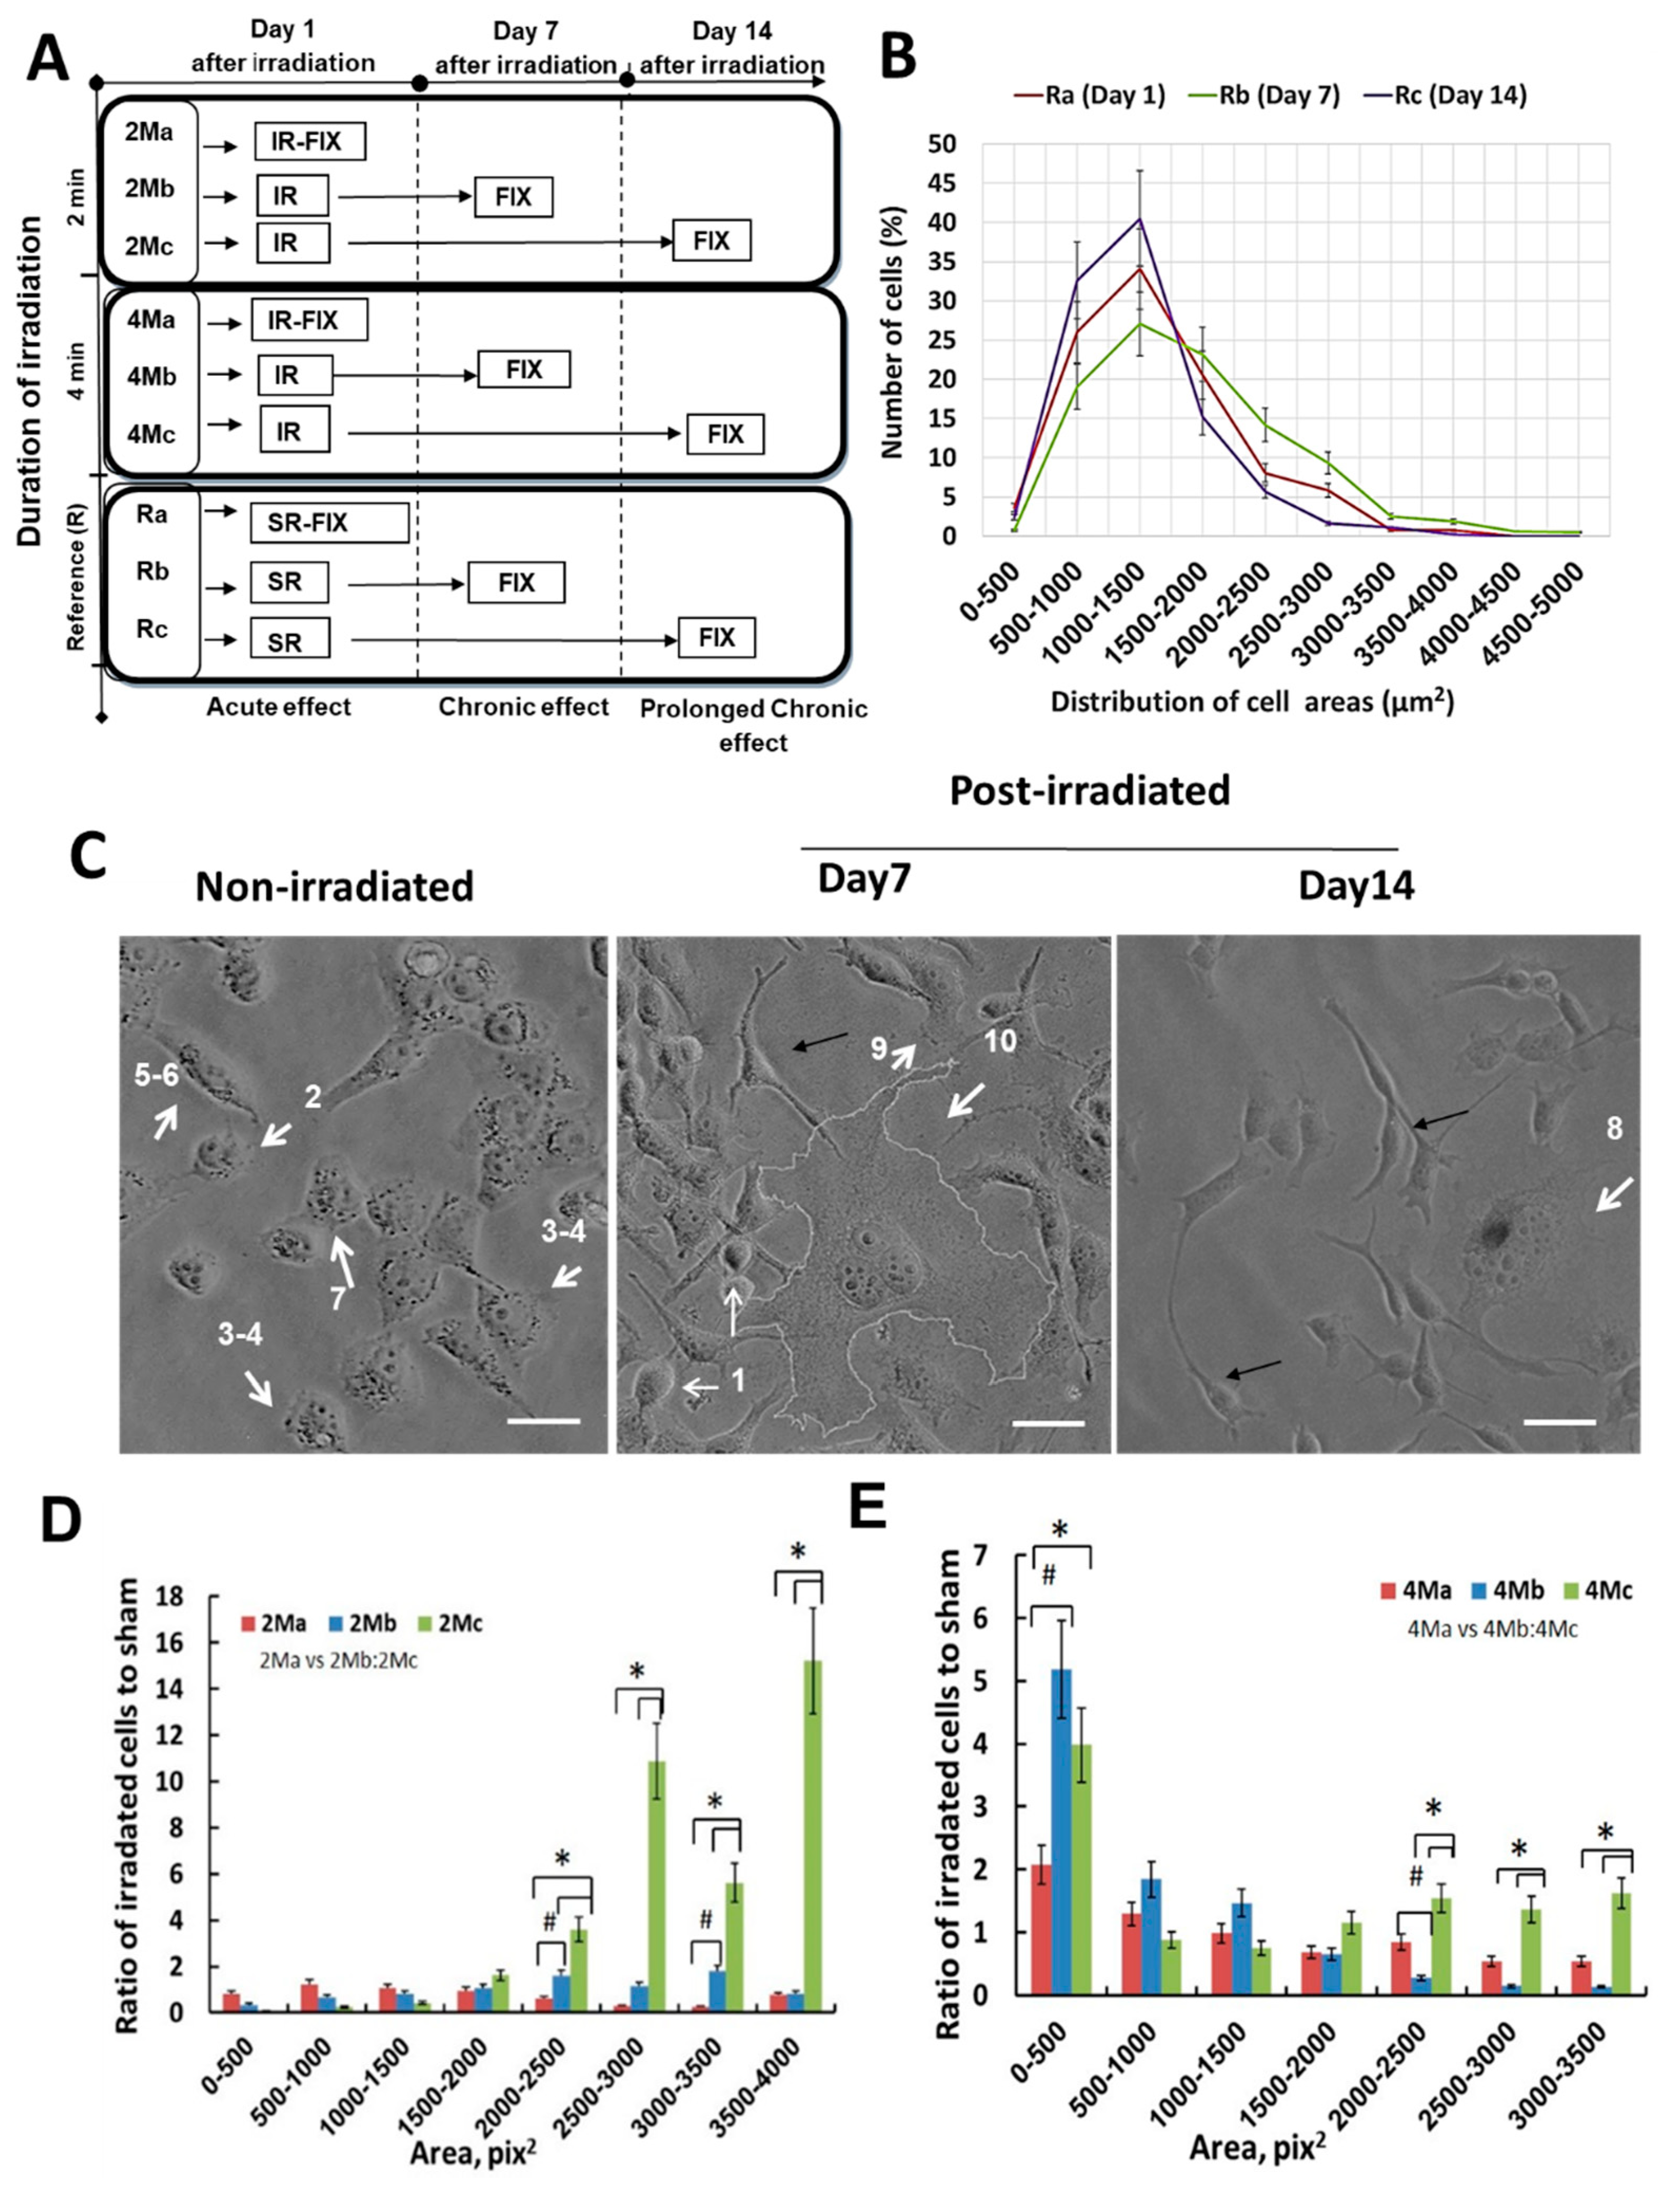
3.3. MMW Irradiation Changes the Morphology and Size of H1299 Cancer Cells

H1299 lung cancer cells were irradiated with MMWs and were subsequently incubated under the physiological conditions before further evaluation. Analyses of the irradiated and control cells were conducted on Day1 (90 min post irradiation), Day 7, and Day 14 (Figure 3a). Exposure power density was maintained at 0.2 mW/cm2 over the duration of exposure, much below the maximum permissible exposure of 1 mW/cm2, as stipulated by the US Federal Communications Commission [19,20,21,22]. This power density along with the estimates and measurements of the temperature increase mentioned above allowed for the thermal effects arising from this irradiation regime to be ruled out. Therefore, the effects observed experimentally were considered non-thermal in nature. Prior to irradiation, cell morphology was examined by microscopy. H1299 cells were observed to be adherent flattened cells with a thickness of less than 5 μm, indicating that the measurements of the cell area are representative of their actual size.
Prior to quantifying the changes in their morphology following irradiation, cells were divided into 10 subgroups of 500 µm2 each based on their area size (Figure 3b) as a non-irradiated reference. The number of cells for each subgroup from the controls (non-irradiated and incubator control; see methods) was determined by counting during imaging observation in the light microscope. The square root of the observed top-view area was found to be 25–30 μm for the average population. Non-irradiated control cells were observed to be in interphase with polygonal, slightly elongated, or oval forms. The majority of these cells (35–45%) in the interphase stage presented areas in the range of 1000–2000 µm2 (Figure 3b). In total, 3–15% of the cells were relatively smaller (500–1000 µm2), accounting for pro-apoptotic cells. Dividing cells with areas ranging from 2000–2500 µm2 and 3000–3500 µm2 constituted about 12–15% of the population (Figure 3b). Huge (giant) polyploid cells, about 2.5–3.5 times larger than the main cell population with areas ranging from 3500 µm2 to 5000 µm2, constituted about 1–3% of the cell population (Figure 3b). The observations demonstrate non-significant changes amongst all the sham (non-irradiated and incubator control; see methods) cell size subgroups examined over the experimental period (14 days) (Figure 3b). The results showed that H1299 cell populations present a heterogeneous morphology corresponding to the physiological status of the cells in their cell cycle states, concomitant with studies reporting cancer cell diversity and genetic instability [23].
To determine the dependence of the observed morphological changes on the energy delivered by MMW exposure, cells were irradiated under two separate exposure regimes of 2 and 4 min, respectively. Depending on the frequency, a single run at a maximum incident power of 1 mW incident power was almost completely attenuated in 2 mL of RPMI 1640 medium, reaching a level of about P ≈ 1 µW at the bottom of the Petri dish (Figure 2). In this regime, the energy delivered to the bottom of the dish was 200 nJ (1 µW × 200 ms). Exposure for 2 min translates into 600 runs (i.e., 120 s divided by 0.2 s of a single run), providing 120 µJ of energy. Similarly, 4 min of exposure translates into 240 µJ of energy. Since 2 × 10⁵ cells were irradiated in every single experiment, the estimates detailed above give an average energy dose of of 0.6 and 1.2 nJ per cell for the 2- and 4-min exposure regimes, respectively.
Subsequent to the MMW exposure treatment, sham and irradiated groups were incubated under the same growth conditions during the period of observation. Cells were split appropriately several times over 14 days to maintain constant confluence rates (30%) for stringency of analyses (see methods), allowing the comparison of morphological changes between sham and treatment groups. The monitoring of the possible changes in cell morphology were examined in the control (sham) and irradiated groups (2- and 4-min exposure regimes) on Day 1 (acute response) and Day 7 and 14 following irradiation (accumulated response to irradiation, Figure 3c,d). Images of the cell morphology of sham and MMW-treated cells on Day 7 and 14 are presented in Figure 3c. Pro-apoptotic cells characterized by shrinkage and fragmentation [24] increased in the irradiated cell population as compared to the sham. Further, 10% of the population changed their form and developed protrusions 2 to 3 times longer than the cell body (Figure 3c, black arrow). The percentage of polyploids (giant cells) also increased (Figure 3c, white arrow num. 8–10), suggesting the induction of senescence [25,26] and problems in cell division. The observed changes are represented as a ratio of the number cells in each size subgroup of the irradiated samples (2- and 4-min regimes, Figure 3d,e) as compared to the sham (Figure 3b).
Under the 2-min exposure regime, samples analyzed on the same day of irradiation did not show any significant change (Figure 3d) in the population as compared to control non-irradiated cells (Figure 3b,c). However, the chronic or accumulated effects of MMW irradiation on the cell morphology were observed on Day 7 and Day 14 following exposure. The cells in the 2-min exposure regime presented a significant increase in the number of the relatively larger cells (2000–4000 µm2 in size) present in the H1299 cell populations. These cells, which originally constituted 25% of the sham untreated population (Figure 3b), increased in number by 1.7–2 and 6–14 times on Day 7 and Day 14, respectively (Figure 3d). In this range, the cells presented two size groups. The first group (2000–3500 µm2 in size) comprising of the cells in early and late stage cell division, and the second group (3500–4000 µm2 in size) comprising of the giant polyploid cells originally constituting only 5–15% of the untreated population (Figure 3b,c, Day 7). These results indicate that under 2 min of MMW irradiation, H1299 cells accumulate irreversible morphological changes characteristic of senescence [25,26,27], and/or undergo cell cycle arrest at G1/2/M phases, which is usually observed after anticancer drug treatment [28].
In contrast, the 4-min exposure regime led to the population of irradiated cells splitting into two groups of small shrunken and larger cells, respectively (Figure 3e), immediately following exposure and retained over the period of observation, as compared to the control non-irradiated cells (Figure 3c). Under the 4-min exposure regime, the majority of the population (35–40%), which were initially cells of 1000–2000 µm2 in size in the sham (Figure 3b), had shifted, turning into small shrunken cells (500–1500 µm2 in size) on the same day of irradiation (Figure 3e). Originally constituting only 15–25% of the untreated population, this group of small shrunken cells (500–1500 µm2 in size) increased by 1.2–2 times in number (Figure 3e). These effects of the 4-min exposure regime were observed to be more profound on Day 7 and Day 14, with the number of small shrunken cells (Figure 3c, num. 1) rising by 2–5 times (Figure 3e). These results demonstrate that following the 4-min exposure regime, the irradiated cell populations develop an additional terminal group of notably shrunken cells (500–1500 µm2 in size) undergoing apoptosis [24]. The other group of the cell population comprising the larger cells (2000–3500 µm2 in size) showed a significant increase of 1.6–1.9 times in number (Figure 3e) observed on Day 14 following exposure, as compared to the sham (Figure 3b). This group of larger cells (2000–3500 µm2 in size) were also observed under the 2-min exposure regime (Figure 3d), indicating senescent [25,26,27] and/or mitotically arrested giant enlarged cells [28]. A comparative analysis of the size change in the cell population arising due to the irradiation regimes (2 and 4 min, respectively) with reference to the control is presented in the Supplementary Material (Supplementary Material Table S1). These results indicate that the morphological changes of H1299 cell populations are affected most by irradiation under the 4-min exposure regime with a power density of 0.2 mW/cm2 and the effects are observed to be stable and accumulated over the period of observation.
The experiments demonstrate that the duration of MMW exposure directly determines the extent to which cell morphology is affected. A short 2-min exposure does not produce any immediate effects but induces the development of enlarged cells, indicative of senescence [25,26,27]. In contrast, a 4-min exposure regime providing a higher dosage of MMW energy results in both short- and long-term effects. Immediately following exposure in this regime, cells are induced to a far greater degree of shrinkage as compared to that under the 2-min regime, indicating acute apoptosis [24]. Further, the 4-min regime also induces the development of enlarged polyploid cells indicative of senescence [25,26,27] over a long-term period of 14 days following irradiation.

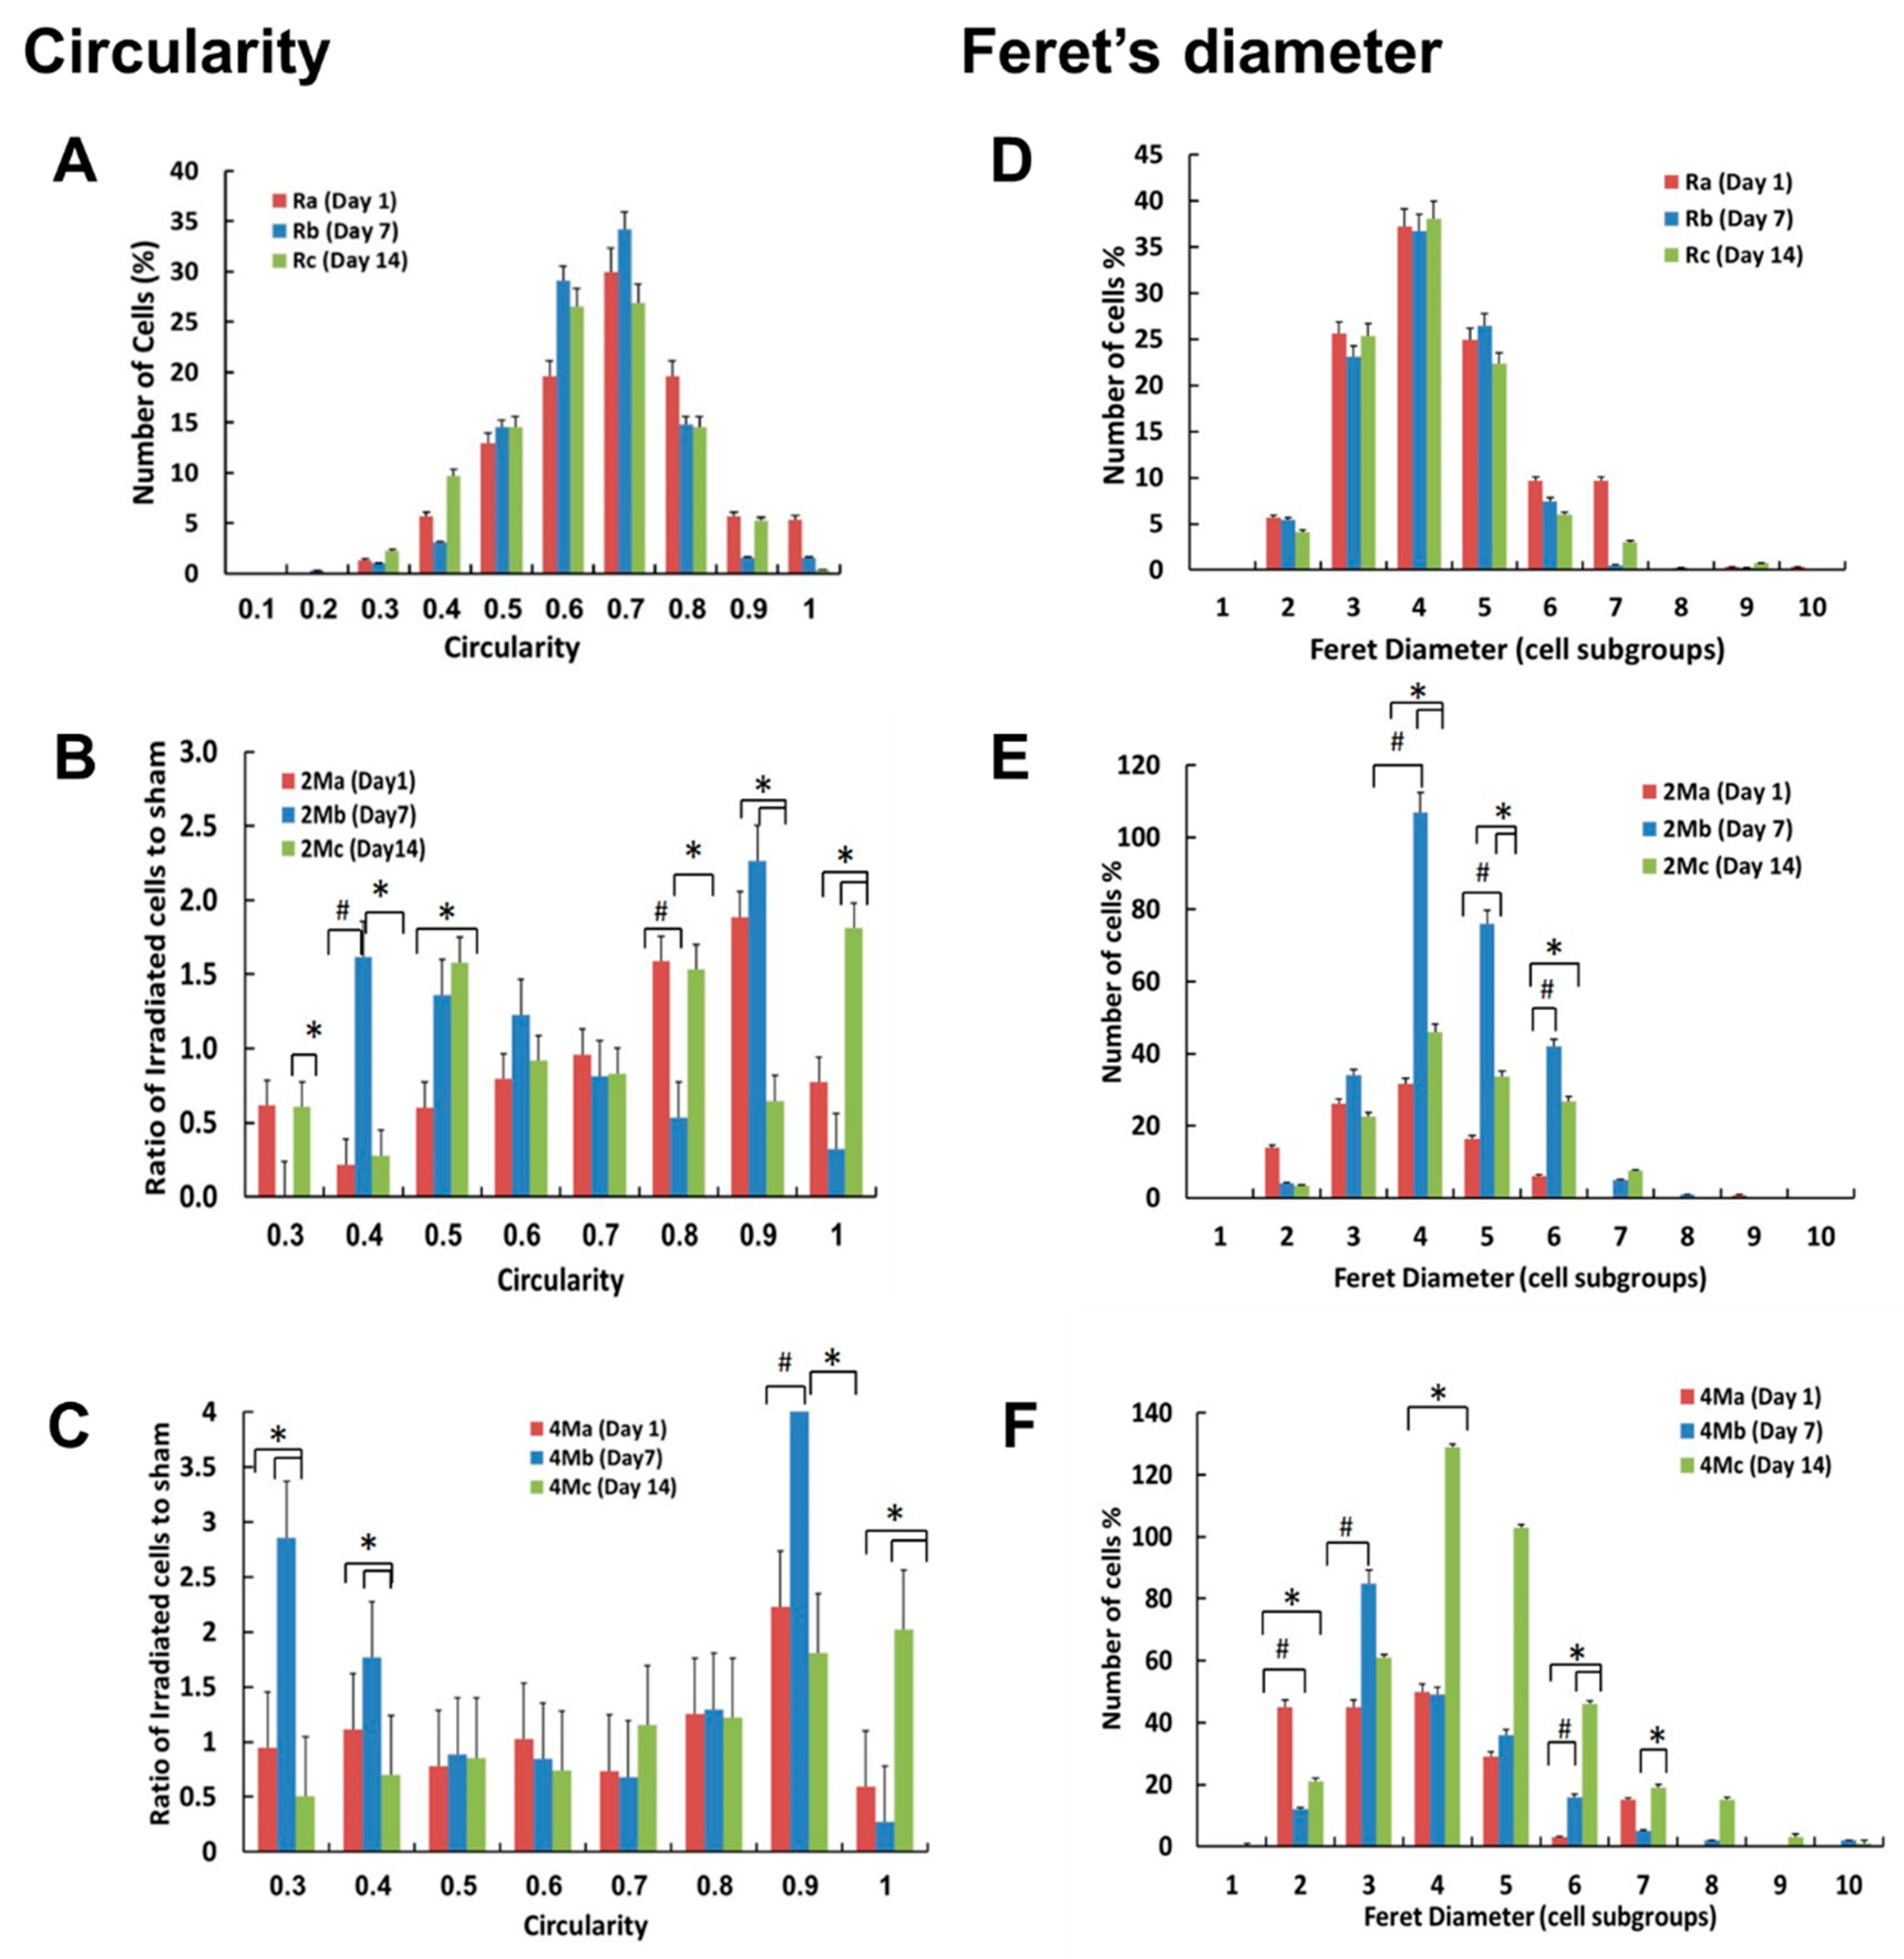
3.4. MMW Irradiation Increases Cell Circularity and Feret’s Diameter of H1299 Cancer Cells

In order to ascertain that MMW irradiation induced apoptosis and senescence as suggested by the results above, further stringent parameters were quantified. Specifically, cell circularity and Feret’s diameter were measured to determine the extent of the said effects. Circularity values ranging from the least circular shape (value 0) to a perfect circle (value 1) are used to denote the degree of dimensional roundness of an object. Increased cell circularity resulting from cytoplasmic shrinkage and cell fragmentation is a hallmark of apoptosis [24,27]. The majority (80%) of untreated control cells presented circularity values between 0.5 and 0.8 (Figure 4a). Following MMW exposure, the circularity of irradiated cell populations increased by 1.5 times as compared with that of control untreated cells. The 2-min irradiation regime led to a population shift towards a more circular shape (0.8–0.9) on Day 1 (Figure 4b). Seven days of physiological incubation following exposure in this regime presented cell populations split into two groups. One group retained the circular form (0.8–0.9), indicating apoptotic or programmed cell death (PCD) cells, and another a less circular form (0.3–0.5) than untreated cells, likely to be fragments of PCD cells that lost their normal form and size. Interestingly, the split in the population was retained even after 14 days following irradiation. The 4-min irradiation regime resulted in a similar but more marked trend of the population shift (Figure 4c). As these effects persisted over 7 to 14 days of the post-irradiation period and were not observed in the untreated control cells, the changes in cell circularity were concluded to be a specific response to MMW irradiation.
Feret’s diameter (FD) measured as the longest straight line between two points on the periphery of a cell is an important morphological marker of cells undergoing senescence [29]. Larger FD corresponds to longer cellular extensions (i.e., protrusions), and enlarged structurally aberrant cells characteristic of senescence [30]. The FD of non-irradiated cells did not change over the experimental time course (Figure 4d). The 2-min exposure regime led to a significant increase of FD over 7 days of physiological incubation following irradiation (Figure 4e) and was reversed after 14 days. In contrast, the 4-min irradiation regime resulted in an FD increase over 14 days and not 7 days (Figure 4f). Percentages higher than 100% are accountable to the splitting and reseeding of cells over the period of observation in order to maintain constant confluence rates (30%) for stringency of analyses (see methods). These results demonstrate that a significant number of cells changed their shapes and sizes in an energy (dose)-dependent manner as a specific response to MMW irradiation. Trigonal, flattened, and adherent cells of the control groups changed to oval-shaped cell bodies with long protrusions following the MMW exposure treatment.

4. Discussion

Cancer is characterized by an excessive and uncontrolled division of abnormal malignant cells that display morphological, proliferative, and functional heterogeneity [23]. Cell size is an important morphological criterion characterizing the physiological status of a cell. The majority of animal cells are 10–20 μm in diameter and rarely vary more than two folds outside of this range, suggesting that the mechanism for cell size regulation is highly conserved [31]. Changes in H1299 cell morphology following exposure to 75–110 GHz MMW for 2- and 4-min irradiation regimes, respectively, were examined in this study. Past investigations of MMW irradiation effects on normal and cancer cells reported distinct non-thermal biological effects using discrete narrow range(s) of frequency with very low energy [32,33]. The majority of the H1299 human lung cancer cells ranged from 1000 µm2 to 2500 µm2 in size before MMW treatment. In response to 2- and 4-min exposure regimes, the cells showed significant changes in the size, circularity, and Feret’s diameter. Two morphologically distinct cell groups were found in the post-irradiation observation period lasting up to 14 days. Based on a comparison with sham-untreated samples, these morphological criteria identified two distinct groups: One with a smaller size (500–1000 µm2) and more oval shape characterizing pro-apoptotic cells and a second group comprised of cells bigger in size (2500 to 4000 µm2) with a flattened morphology characteristic of non-dividing senescent cells. The changes in morphology were observed on the same day of MMW exposure treatment (short-term effects), as well as over 7–14 days post-irradiation (long-term effects). The short-term effects may result from regular stress responses following irradiation. The long-term effects arise specifically as a result of MMW irradiation and were observed to be retained over the duration of the experiment(s). Senescent cells are known to present an enlarged phenotype as compared to non-senescent cells [30]. This suggests that the dramatic increment of cell size observed under the 2-min irradiation regime indicates a population shift towards a higher number of senescent cells induced by MMW irradiation. In contrast, the results from the 4-min exposure regime, which delivered a higher dose of MMW energy, indicated an induction of apoptosis as well as senescence. Prior to exposure, a small proportion of the cell population comprised mitotically arrested huge polyploid cells whose numbers increased following irradiation. Recent publications demonstrated that they may form due to perturbations of the molecular mechanisms controlling replication and cell division [34,35]. In H1299 cells, they were represented by two phenotypes: One with a large single nucleus and the other with multinucleated cells (MNCs) containing up to 11 nuclei. A relatively small proportion of the senescent group (following MMW exposure) were observed to be huge polyploid cells, as it has previously been reported that they generally constitute a part of the cancer cell population responsible for giving rise to drug resistance in anticancer treatments [36]. The 2-min exposure regime induced the development of large cells gradually over 14 days of observation while the 4-min regime induced such effects immediately and over 7 and 14 days following exposure. This indicates that the effects are dose dependent, explaining the absence of enlarged cells immediately following the 2-min exposure regime and induction of both apoptosis and senescence in the 4-min exposure regime. The experiments show that without any treatment, the morphological heterogeneity presented by different size groups is maintained. Following exposure to MMW treatment, the number of cells in different subgroups changed significantly.
MMW exposure at an incident power density (IPD) of 20 mW/cm2 corresponding to the ICNIRP safe public exposure standards results in thermal stress on cells [37]. However, irradiation within an IPD range of 0–5 mW/cm2 does not generate cellular stress or thermal effects [32], concomitant with a stable temperature range of 24–26 °C measured during MMW exposure at 0.2 mW/cm2 in our experiments. These indicate that both the short- and long-term morphological effects reported here arise as a treatment-specific non-stress response corresponding directly to the duration of treatment. This study demonstrates that W-band MMW exposure at a minimal power density of 0.2 mW/cm2 is applicable to efficiently target H1299 cancer cells without harming healthy epithelial cells, which tolerate irradiation at 1 mW/cm2 [38] without developing effects of cytotoxicity. Further, the estimates of the cellular energy dosage presented here allow our findings to be effectively calibrated to patient-specific clinical adaptations of MMW therapy for controlling tumor metastasis.
Reports of morphological heterogeneity [23], as well as our results, demonstrate that cancer cells maintain generally constant sizes throughout their lifetime. In addition, the cells, being highly dynamic, can either grow or shrink in size in response to changes of the specific conditions via robust and adaptable control mechanisms. Illustratively, alterations of the cell morphologies in response to the chemical cancer drug paclitaxel have been observed with similar results [39]. Cancer cell tumorigenicity is associated with cell softening and a decrease in cell stiffness arising from cytoskeletal restructuring [40]. Integral membrane proteins mediate this transition of normal cells into cancer cells [41]. Changes in cell shape and size following MMW irradiation in the present study were specific and irreversible, directly corresponding to changes of the cell circularity and Feret’s diameter. MMW irradiation affects cell growth [8,9,10] by changing the organelle structure and cell membrane permeability [11,12,13]. Such interactions lead to the activation and inhibition of signal transduction mechanisms due to MMWs interacting with DNA, RNA, and proteins [14]. Increased membrane stiffness resulting in apoptosis of cells has been shown to correspond to changes in prostate cancer cells responding to anti-neoplastic treatment [42]. These suggest the accelerated cellular senescence (ACS) effect [43] occurring in an energy (dose)-dependent manner observed in this study arise from the non-thermal low power density MMW exposure affecting H1299 membrane fluidity. The biochemical properties of oncogenic heterogeneity [23] are accountable for the altered physical properties of cancer cells [44], allowing for distinct electromagnetic interactions [45] as compared to normal cells. Exposure to 35 GHz irradiation activates the apoptotic caspase pathway [46] in A375 melanoma cells in vitro and is likely to be the mechanism behind the ACS effect reported here involving W-band MMW treatment.

5. Conclusions

The experimental results of this study suggest MMW irradiation in the frequency range of 75–110 GHz (W-band) promotes specific morphological changes following exposure in H1299 human lung cancer cells in an energy (dose)-dependent manner. Changes were observed to be stable with chronic characteristics accumulated and retained even after 10 days of physiological incubation post-irradiation. The effects observed and quantified using physical dimensions/parameters of cell size, circularity, and Feret’s diameter demonstrated characteristic features of induced apoptosis and senescence following MMW exposure. The phenomenon of accelerated cellular senescence (ACS) [43], wherein cancer cells undergo terminal growth arrest, is conventionally achieved by using radiotherapy in conjunction with specific chemotherapeutic agents for targeted blockage of cellular pathways. However, radiotherapy results in immun-ocompromise [4] and chemotherapeutics drive drug resistance [23], thereby complicating full recoveries and leading to drug dependence. Although developments of microwave bronchoscopy [47] and cytotoxic effects of MMW exposure have been demonstrated [48], clinical adaptation is restricted due to the presence of thermal ablation used in these methods, which complicates the targeted application at lung tumor sites. This study provides the first threshold energy limits for using MMW irradiation within a non-thermal power density to elicit H1299 cancer cell annihilation, thereby making a clinical adaptation possible. Further, in vivo studies suggest MMWs activate natural killer (NK) cells [49], helping to reduce tumor metastasis. Low-power MMW exposure of mice alleviates the immunosuppressive effects of cancer drugs like Cyclophosphamide (CPA) and enhances the effector functions of CD4 (+) T cells [50]. The present study reports the apoptosis and senescence of cancer cells without the use of chemotherapeutic agents, ionizing radiation, or thermal ablation, thereby overcoming the associated side effects. Prospective clinical application of this method requires further investigations of the penetration depths achievable using endoscopic methods, calibration of dosimetry on clinical samples, and the development of prophylactic detection measures in order to improve the efficacy of treatment. Meta-analysis of NSCLC prognosis shows very high rates of mortality without treatment [51] and more than half the number of patients dying within one year of diagnosis even with treatment due to associated complicacies. With rising trends for the development of biomedical devices, the MMW irradiation parameters described in this study hold promising potential for the development of non-invasive procedures to treat human non-small cell lung cancer (NSCLC) in the future.

Supplementary Materials

The following are available online at https://www.mdpi.com/2076-3417/10/9/3187/s1. Table S1. Fold Changes (the indicated values represent ratios of fold change with reference to control).

Author Contributions

Conceptualization, K.K., A.Y., J.L. and S.L.-A.; Methodology, K.K., A.Y., J.L., B.K.; and S.L.-A.; Software, K.K., T.B., A.B. and S.L.-A. Validation, K.K., T.B., A.B. and S.L.-A.; Formal analysis, K.K.; T.B. and S.L.-A.; Investigation, K.K., T.B. and S.L.-A. Resources, K.K., A.Y., J.L. and S.L.-A. Data curation, K.K., A.Y. and S.L.-A. Writing—original draft preparation, K.K., A.B. and S.L.-A. Writing—review and editing, K.K., A.B., A.Y. and S.L.-A. Visualization, K.K., T.B., A.B. and S.L.-A. Supervision, S.L.-A. Project administration, S.L.-A. Funding acquisition, K.K., A.Y., J.L. and S.L.-A. All authors have read and agreed to the published version of the manuscript.

Funding

This research was funded by Ariel University’s Internally Supported Grant (Ariel Center for Applied Cancer Research, ACACR) and the Eva and Henry Fraenkel Foundation (Denmark).

Acknowledgments

We are grateful for the very useful discussions with H. G. Bohr (Denmark); and for B. Kapilevich., D. Hardon and B. Litvak’s help in performing the irradiation experiments.

Conflicts of Interest

The authors declare no conflict of interest.

References

  1. Cruz, C.S.D.; Tanoue, L.T.; Matthay, R.A. Lung cancer: Epidemiology, etiology, and prevention. Clin. Chest Med. 2011, 32, 605–644. [Google Scholar] [CrossRef] [PubMed] [Green Version]
  2. Hann, C.L.; Rudin, C.M. Management of small-cell lung cancer: Incremental changes but hope for the future. Oncology 2008, 22, 1486–1492. [Google Scholar] [PubMed]
  3. De Angelis, C.; Salvo, N.; Barnes, E.; Van Draanen, J.; Stacey, E.; Mitera, G.; Breen, D.; Giotis, A.; Czarnota, G.; Pang, J. Prophylaxis and management of acute radiation-induced skin reactions: A systematic review of the literature. Curr. Oncol. 2010, 17, 94–112. [Google Scholar] [CrossRef] [PubMed] [Green Version]
  4. Ryan, J.L. Ionizing Radiation: The Good, the Bad, and the Ugly. J. Investig. Dermatol. 2012, 132, 985–993. [Google Scholar] [CrossRef] [PubMed] [Green Version]
  5. NSCLC Meta-Analyses Collaborative Group. Chemotherapy in Addition to Supportive Care Improves Survival in Advanced Non–Small-Cell Lung Cancer: A Systematic Review and Meta-Analysis of Individual Patient Data from 16 Randomized Controlled Trials. J. Clin. Oncol. 2008, 26, 4617–4625. [Google Scholar] [CrossRef] [PubMed]
  6. (ICNIRP) International Commission on Non-Ionizing Radiation Protection. Guidelines for limiting exposure to Electromagnetic Fields (100 kHz to 300 GHz). Health Phys. 2020, 118, 483–524. [Google Scholar] [CrossRef] [PubMed]
  7. Yaekashiwa, N.; Otsuki, S.; Hayashi, S.; Kawase, K. Investigation of the non-thermal effects of exposing cells to 70–300 GHz irradiation using a widely tunable source. J. Radiat. Res. 2017, 59, 116–121. [Google Scholar] [CrossRef] [Green Version]
  8. Grundler, W.; Keilmann, F. Sharp Resonances in Yeast Growth Prove Nonthermal Sensitivity to Microwaves. Phys. Rev. Lett. 1983, 51, 1214–1216. [Google Scholar] [CrossRef]
  9. Hadjiloucas, S.; Chahal, M.S.; Bowen, J. Preliminary results on the non-thermal effects of 200 350 GHz radiation on the growth rate ofS. cerevisiaecells in microcolonies. Phys. Med. Biol. 2002, 47, 3831–3839. [Google Scholar] [CrossRef]
  10. Beneduci, A. Evaluation of the Potential In Vitro Antiproliferative Effects of Millimeter Waves at Some Therapeutic Frequencies on RPMI 7932 Human Skin Malignant Melanoma Cells. Cell Biophys. 2009, 55, 25–32. [Google Scholar] [CrossRef]
  11. Siegel, P.; Pikov, V. Impact of low intensity millimetre waves on cell functions. Electron. Lett. 2010, 46, S70. [Google Scholar] [CrossRef] [Green Version]
  12. Shapiro, M.G.; Priest, M.F.; Siegel, P.H.; Bezanilla, F. Thermal Mechanisms of Millimeter Wave Stimulation of Excitable Cells. Biophys. J. 2013, 104, 2622–2628. [Google Scholar] [CrossRef] [PubMed] [Green Version]
  13. Curecheriu, L.; Foca-Nici, E.; Vlahovici, A.L.; Avadane, O.; Sandu, D.D.; Creangai, D.; Miclaus, S. Radiofrequency wave effects on DNA and RNA levels in some animal tissues. Rom. J. Phys. 2007, 52, 389–395. [Google Scholar]
  14. Titushkin, I.A.; Rao, V.S.; Pickard, W.F.; Moros, E.G.; Shafirstein, G.; Cho, M.R. Altered Calcium Dynamics Mediates P19-Derived Neuron-Like Cell Responses to Millimeter-Wave Radiation. Radiat. Res. 2009, 172, 725–736. [Google Scholar] [CrossRef] [PubMed]
  15. Komoshvili, K.; Levitan, J.; Aronov, S.; Kapilevich, B.; Yahalom, A. Millimeter waves non-thermal effect on human lung cancer cells. In Proceedings of the 2011 IEEE International Conference on Microwaves, Communications, Tel Aviv, Israel, 7–9 November 2011; pp. 1–4. [Google Scholar]
  16. Homenko, A.; Kapilevich, B.; Kornstein, R.; Firer, M.A. Effects of 100 GHz radiation on alkaline phosphatase activity and antigen-antibody interaction. Bioelectromagnetics 2009, 30, 167–175. [Google Scholar] [CrossRef] [PubMed]
  17. Beneduci, A.; Chidichimo, G.; Tripepi, S.; Perrotta, E. Transmission electron microscopy study of the effects produced by wide-band low-power millimeter waves on MCF-7 human breast cancer cells in culture. Anticancer. Res. 2005, 25, 1009–1013. [Google Scholar]
  18. Grenier, K.; Dubuc, D.; Chretiennot, T.; Chen, T.; Artis, F.; Poupot, M.; Fournie, J.-J. Recent Advances in Microwave-Based Dielectric Spectroscopy at the Cellular Level for Cancer Investigations. IEEE Trans. Microw. Theory Tech. 2013, 61, 2023–2030. [Google Scholar] [CrossRef] [Green Version]
  19. Prohofsky, E.; Eyster, J. Prediction of giant breathing and rocking modes in double helical RNA. Phys. Lett. A 1974, 50, 329–330. [Google Scholar] [CrossRef]
  20. Gründler, W.; Keilmann, F.; Frohlich, H. Resonant growth rate response of yeast cells irradiated by weak microwaves. Phys. Lett. A 1977, 62, 463–466. [Google Scholar] [CrossRef]
  21. Frohlich, H. Coherent Processes in Biological Systems. J. Am. Chem. Soc. 1980, 157, 47. [Google Scholar]
  22. Belyaev, I.Y.; Alipov, Y.D.; Polunin, V.A.; Shcheglov, V.S. Evidence for Dependence of Resonant Frequency of Millimeter Wave Interaction with Escherichia coli K12 Cells on Haploid Genome Length. Electro Magnetobiol. 1993, 12, 39–49. [Google Scholar] [CrossRef]
  23. Burrell, R.A.; Swanton, C. Tumour heterogeneity and the evolution of polyclonal drug resistance. Mol. Oncol. 2014, 8, 1095–1111. [Google Scholar] [CrossRef] [PubMed]
  24. Saraste, A.; Pulkki, K. Morphologic and biochemical hallmarks of apoptosis. Cardiovasc. Res. 2000, 45, 528–537. [Google Scholar] [CrossRef]
  25. Cho, K.A.; Ryu, S.J.; Oh, Y.S.; Park, J.H.; Lee, J.W.; Kim, H.-P.; Kim, K.T.; Jang, I.S.; Park, S.C. Morphological Adjustment of Senescent Cells by Modulating Caveolin-1 Status. J. Biol. Chem. 2004, 279, 42270–42278. [Google Scholar] [CrossRef] [Green Version]
  26. Bharadwaj, D.; Mandal, M. Senescence in polyploid giant cancer cells: A road that leads to chemoresistance. Cytokine Growth Factor Rev. 2020, 52, 68–75. [Google Scholar] [CrossRef]
  27. Helmy, I.M.; Azim, A.M.A. Efficacy of ImageJ in the assessment of apoptosis. Diagn. Pathol. 2012, 7, 15. [Google Scholar] [CrossRef] [Green Version]
  28. Choi, J.Y.; Hong, W.G.; Cho, J.H.; Kim, E.M.; Kim, J.; Jung, C.-H.; Hwang, S.-G.; Um, H.-D.; Park, J.K. Podophyllotoxin acetate triggers anticancer effects against non-small cell lung cancer cells by promoting cell death via cell cycle arrest, ER stress and autophagy. Int. J. Oncol. 2015, 47, 1257–1265. [Google Scholar] [CrossRef] [Green Version]
  29. Liu, N.; Wang, Y.A.; Sun, Y.; Ecsedy, J.; Sun, J.; Li, X.; Wang, P. Inhibition of Aurora A enhances radiosensitivity in selected lung cancer cell lines. Respir. Res. 2019, 20, 230. [Google Scholar] [CrossRef] [Green Version]
  30. Hernandez-Segura, A.; Nehme, J.; DeMaria, M. Hallmarks of Cellular Senescence. Trends Cell Biol. 2018, 28, 436–453. [Google Scholar] [CrossRef]
  31. Conlon, I.J.; Raff, M.C. Size Control in Animal Development. Cell 1999, 96, 235–244. [Google Scholar] [CrossRef] [Green Version]
  32. Zhadobov, M.; Chahat, N.; Sauleau, R.; Le Quément, C.; Le Dréan, Y. Millimeter-wave interactions with the human body: State of knowledge and recent advances. Int. J. Microw. Wirel. Technol. 2011, 3, 237–247. [Google Scholar] [CrossRef] [Green Version]
  33. Apollonio, F.; Liberti, M.; Paffi, A.; Merla, C.; Marracino, P.; Denzi, A.; Marino, C.; D’Inzeo, G. Feasibility for Microwaves Energy to Affect Biological Systems Via Nonthermal Mechanisms: A Systematic Approach. IEEE Trans. Microw. Theory Tech. 2013, 61, 2031–2045. [Google Scholar] [CrossRef]
  34. Lee, H.O.; Davidson, J.; Duronio, R.J. Endoreplication: Polyploidy with purpose. Genes Dev. 2009, 23, 2461–2477. [Google Scholar] [CrossRef] [PubMed] [Green Version]
  35. Weihua, Z.; Lin, Q.; Ramoth, A.J.; Fan, M.; Fidler, I.J. Formation of solid tumors by a single multinucleated cancer cell. Cancer 2011, 117, 4092–4099. [Google Scholar] [CrossRef] [PubMed] [Green Version]
  36. Wang, Q.; Wu, P.C.; Dong, D.Z.; Ivanova, I.; Chu, E.; Zeliadt, S.; Vesselle, H.; Wu, D.Y. Polyploidy road to therapy-induced cellular senescence and escape. Int. J. Cancer 2012, 132, 1505–1515. [Google Scholar] [CrossRef] [PubMed]
  37. Le Quément, C.; Nicolaz, C.N.; Habauzit, D.; Zhadobov, M.; Sauleau, R.; Le Dréan, Y. Impact of 60-GHz millimeter waves and corresponding heat effect on endoplasmic reticulum stress sensor gene expression. Bioelectromagnetics 2014, 35, 444–451. [Google Scholar] [CrossRef] [PubMed]
  38. Koyama, S.; Narita, E.; Shimizu, Y.; Suzuki, Y.; Shiina, T.; Taki, M.; Shinohara, N.; Miyakoshi, J. Effects of Long-Term Exposure to 60 GHz Millimeter-Wavelength Radiation on the Genotoxicity and Heat Shock Protein (Hsp) Expression of Cells Derived from Human Eye. Int. J. Environ. Res. Public Health 2016, 13, 802. [Google Scholar] [CrossRef] [Green Version]
  39. Kim, K.S.; Cho, C.H.; Park, E.K.; Jung, M.-H.; Yoon, K.-S.; Park, H.-K. AFM-Detected Apoptotic Changes in Morphology and Biophysical Property Caused by Paclitaxel in Ishikawa and HeLa Cells. PLoS ONE 2012, 7, e30066. [Google Scholar] [CrossRef] [Green Version]
  40. Osborne, L.D.; Li, G.Z.; How, T.; O’Brien, E.T.; Blobe, G.C.; Superfine, R.; Mythreye, K. TGF-β regulates LARG and GEF-H1 during EMT to affect stiffening response to force and cell invasion. Mol. Biol. Cell 2014, 25, 3528–3540. [Google Scholar] [CrossRef]
  41. Lin, H.-H.; Lin, H.-K.; Lin, I.-H.; Chiou, Y.-W.; Chen, H.-W.; Liu, C.-Y.; Harn, H.I.-C.; Chiu, W.-T.; Wang, Y.-K.; Shen, M.-R.; et al. Mechanical phenotype of cancer cells: Cell softening and loss of stiffness sensing. Oncotarget 2015, 6, 20946–20958. [Google Scholar] [CrossRef] [Green Version]
  42. Raudenska, M.; Kratochvilova, M.; Vicar, T.; Gumulec, J.; Balvan, J.; Polanska, H.; Pribyl, J.; Masarik, M. Cisplatin enhances cell stiffness and decreases invasiveness rate in prostate cancer cells by actin accumulation. Sci. Rep. 2019, 9, 1660. [Google Scholar] [CrossRef] [PubMed]
  43. Roberson, R.S.; Kussick, S.J.; Vallieres, E.; Chen, S.-Y.J.; Wu, D.Y. Escape from Therapy-Induced Accelerated Cellular Senescence in p53-Null Lung Cancer Cells and in Human Lung Cancers. Cancer Res. 2005, 65, 2795–2803. [Google Scholar] [CrossRef] [PubMed] [Green Version]
  44. Hong, J.-L.; Lan, K.-C.; Jang, L.-S. Electrical characteristics analysis of various cancer cells using a microfluidic device based on single-cell impedance measurement. Sens. Actuators B Chem. 2012, 173, 927–934. [Google Scholar] [CrossRef]
  45. Garg, A.; Jones, T.; Moss, S.M.; Mishra, S.; Kaul, K.; Ahirwar, D.K.; Ferree, J.; Kumar, P.; Subramaniam, D.; Ganju, R.K.; et al. Electromagnetic fields alter the motility of metastatic breast cancer cells. Commun. Biol. 2019, 2, 303–316. [Google Scholar] [CrossRef] [PubMed] [Green Version]
  46. Zhao, R.; Liu, Y.; Liu, S.; Luo, T.; Zhong, G.; Liu, A.; Zeng, Q.; Xin, X. Millimeter wave exposure induces apoptosis in human melanoma A375 cells in vitro. Nan Fang Yi Ke Da Xue Xue Bao 2019, 39, 76–81. [Google Scholar] [CrossRef]
  47. Yuan, H.-B.; Wang, X.-Y.; Sun, J.-Y.; Xie, F.-F.; Zheng, X.-X.; Tao, G.-Y.; Pan, L.; Hogarth, D.K. Flexible bronchoscopy-guided microwave ablation in peripheral porcine lung: A new minimally-invasive ablation. Transl. Lung Cancer Res. 2019, 8, 787–796. [Google Scholar] [CrossRef]
  48. Orlacchio, R.; Le Page, Y.; Le Dréan, Y.; Le Guével, R.; Sauleau, R.; Alekseev, S.; Zhadobov, M. Millimeter-wave pulsed heating in vitro: Cell mortality and heat shock response. Sci. Rep. 2019, 9, 15249. [Google Scholar] [CrossRef] [Green Version]
  49. Logani, M.K.; Szabó, I.; Makar, V.; Bhanushali, A.; Alekseev, S.; Ziskin, M.C. Effect of millimeter wave irradiation on tumor metastasis. Bioelectromagnetics 2006, 27, 258–264. [Google Scholar] [CrossRef]
  50. Makar, V.; Logani, M.; Szabó, I.; Ziskin, M. Effect of millimeter waves on cyclophosphamide induced suppression of T cell functions. Bioelectromagnetics 2003, 24, 356–365. [Google Scholar] [CrossRef]
  51. Wao, H.; Mhaskar, R.; Kumar, A.; Miladinovic, B.; Djulbegovic, B. Survival of patients with non-small cell lung cancer without treatment: A systematic review and meta-analysis. Syst. Rev. 2013, 2, 10. [Google Scholar] [CrossRef] [Green Version]
Figure 1. Illustration of the irradiation setup (A). G represents the millimeter wave generator and A represents the network signal analyzer. The scalar network analyzer measured the waves reflected partly into the upper antenna and transmitted partly into the lower antenna. Characterization of the dielectric properties of petri dishes (B). The graph represents the frequency spectra of the reflected signal of five empty Petri dishes (NuncTM, Thermo Fisher Scientific®). In total, 43 dishes were tested with the same results.
Applsci 10 03187 g001
Figure 2. Dependence of the reflected and the transmitted signals on the level of the RPMI 1640 medium layer’s thickness (A). Signals were evaluated for different frequencies ranging from 75 to 100 GHz. For the empty dish, only the transmitted signal and not the reflected signal is presented. Shown is one representative sample of seven dishes that were irradiated for each frequency. Exposure times were a few seconds and the temperature of the medium was measured to be 24–26 °C. Dependence of the transmitted power through the Petri dish on the frequency of irradiation (B). The signals were normalized to the antenna emitting power P0 ≈ 1 mW on an empty dish.
Applsci 10 03187 g002
Figure 3. Pictogram of the experimental strategy (A), depicting the time schedule and analytical conditions (R—Non-irradiated control retained in the incubator, 2M—two minutes, 4M—four minutes. IR—irradiation, SR—Control cells that underwent the same procedures as the irradiated cells without being irradiated, IMAGE—Microscopy and image analysis). Cells were irradiated for two minutes (2M) or four minutes (4M). Image analysis was performed on day 1 (short-term, a), day 7 (long-term, b), or day 14 (long-term, c). Controls were assessed at the same time points as the irradiated cells (i.e., Ra, day 1; Rb, day 7; and Rc, Day 14 of the experiment). Quantification of the size distribution of control non-irradiated cell areas (B) for day 1 (Ra, red line), day 7 (Rb, green line), and day 14 (Rc, violet line). Cell areas were grouped into 10 intervals (500 µm2 each) and the number of cells in each group counted and examined by microscopic observation followed by image analysis of cell sizes using the ImageJ program. The observations demonstrate non-significant changes amongst the sham (non-irradiated) cell size subgroups examined over the experimental period (14 days). Morphological changes of H1299 cells following MMW irradiation (C). Prior to irradiation, the majority (35–45%) of the cells presented polygonal-form cells in the interphase stage with areas in the range of 1000–2000 µm2 (white arrowhead 2–6), with 3–15% of small shrunken/pro-apoptotic cells in the range of 500–1000 µm2, and 12–15% of dividing cells in the range 2000–3500 µm2 (white arrow 7) constituting the cell population. Analysis of cell areas 7 and 14 days after MMW irradiation revealed an increased number of pro-apoptotic cells (white arrow 1). In total, 1–3% of cells showed characteristics of huge (giant) polyploid cells (white arrow 8 and 10) in the range of 3500–5000 µm2; 10% of the cells showed an oval cell morphology with highly elongated protrusions, two to three times longer than the cell itself (black arrow). Bars correspond to 20 µm. Changes in H1299 cell size irradiated under the 2-min exposure regime (D); analyzed on day 1 (2Ma), day 7 (2Mb), and day 14 (2Mc). Cells ranging 2000–4000 µm2 in size increased significantly by 2–14 times following this treatment regime over a long-term period of 7 and 14 days, comprising of the cells in different cell division stages and the giant polyploid cells. Changes in H1299 cell size irradiated under the 4-min exposure regime (E); analyzed on day 1 (4Ma), day 7 (4Mb), and day 14 (4Mc). Following the 4-min exposure regime, the irradiated cells divided into two populations: One group consisting of shrunken cells (500–1500 µm2 in size) undergoing apoptosis and a second group consisting of large senescent and mitotically arrested giant enlarged cells (2500–3500 µm2 in size). Cells groups ranging 500–1500 µm2 and 2500–3500 µm2 in size increased significantly by 2–5 and 1.6–1.9 times, respectively, following this treatment regime immediately over a long-term period of 7 and 14 days, respectively. The morphological changes of H1299 cells the under the 4-min exposure regime are observed to be stable and accumulated over the period of observation (14 days). In total, 8000–10,000 cells were analyzed for every single experiment using Image J. Error bars represent the standard deviations of four biologically independent experiments (N = 4); p-values < 0.05 was considered statistically significant with * representing p < 0.05 (for a versus c or b versus c) and # representing p < 0.05 (for a versus b).
Applsci 10 03187 g003
Figure 4. Distributions of cell circularity (AC) and Feret’s diameter (DF) following effects of MMW irradiation; analyzed on Day 1 (red bars), Day 7 (blue bars) and Day 14 (green bars). Values of cell circularity were divided into 10 subgroups and the number of cells in each group counted. The Y-axis represents the ratios of the number of irradiated cells to the number of untreated control cells for the same subgroup. Cell circularity of H1299 cells left untreated (A); analyzed on day 1 (Ra), day 7 (Rb) and day 14 (Rc). Cell circularity of H1299 cells irradiated under 2 min exposure regime (B); analyzed on day 1 (2Ma), day 7 (2Mb) and day 14 (2Mc). Cell circularity of H1299 cells irradiated under the 4-min exposure regime (C); analyzed on day 1 (4Ma), day 7 (4Mb), and day 14 (4Mc). Values of Feret’s diameter were divided into 10 subgroups and the number of cells in each group counted. Each subgroup corresponds to 25 µm for all experiments. The Y-axis represents the ratios of the number of irradiated cells to the number of untreated control cells for the same subgroup. Feret’s diameter of H1299 cells left untreated (D); analyzed on day 1 (Ra), day 7 (Rb), and day 14 (Rc). Feret’s diameter of H1299 cells irradiated under the 2-min exposure regime (E); analyzed on day 1 (2Ma), day 7 (2Mb), and day 14 (2Mc). Feret’s diameter of H1299 cells irradiated under the 4-min exposure regime (F); analyzed on day 1 (4Ma), day 7 (4Mb), and day 14 (4Mc). In total, 8000–10,000 cells were analyzed for every single experiment using Image J. Error bars represent the standard deviations of four biologically independent experiments (N = 4); p-values < 0.05 was considered statistically significant with * representing p < 0.05 (for a versus c or b versus c) and # representing p < 0.05 (for a versus b).
Applsci 10 03187 g004

