1. Introduction
A microspeaker is a tiny electroacoustic actuator that converts electrical signals into sound. With the rapid development of 4C (computer, communication, consumer electronics, and car electronics) products, such as smartphones, notebooks, true wireless stereo earphones, computers, and smart speakers, etc., the microspeaker has become indispensable. In 1924, a patent was awarded to Rice and Kellogg for the moving coil direct radiator loudspeaker. Today, this remains the most significant design in the electroacoustic product (loudspeaker, microspeaker, earphone, headphone, etc.) market. Its miniature version essentially involves the same fundamental components. Loudspeakers include horn loudspeaker, moving coil loudspeaker, electrostatic loudspeaker, ribbon loudspeaker, flat panel loudspeaker, bending wave loudspeaker, and balanced armature loudspeakers, in addition to MEMS speaker, etc. In 1957, the loudspeaker principles and design were carefully addressed in detail by McLean [
1], with loudspeaker design criteria have also been established by Chernof [
2] in 1957. In 2006, an optical measurement of loudspeaker cone vibration was reported by W. Klippel and Schlechter [
3], using the “Laser Triangulation” technique, which is a cost-effective alternative to “Doppler Interferometry” and has been proven to be the most versatile tool for loudspeaker research and industry. Loudspeaker modifications have been suggested for high fidelity sound reproduction [
4,
5,
6]. In a significant contribution, Small [
7,
8,
9,
10,
11,
12] made a significant contribution to this field by elaborating on loudspeaker performance in closed and vented boxes. An equivalent circuit method (ECM) for portable multimedia loudspeaker was discussed by Tashiro et al. [
13]. Moreover, Hwang et al. published an extensive report on the microspeaker design and development [
14,
15,
16,
17]. Acoustic analysis and design of a miniature mobile phone loudspeaker (microspeaker) were carried out by Bai et al. [
18,
19] using an ECM and finite element method (FEM). Electroacoustic simulation and experimentation were conducted on cellular phone microspeaker have been performed by Huang et al. [
20]. To improve the overall sound pressure level (SPL) performance over the mid-frequency spectrum for a microspeaker investigated by Shiah et al. [
21] analyzed a few key design parameters in 2008.
In 2003, Moholkar and Warmoeskerken [
22] attempted to identify the acoustical characteristics (effects of entrapped air pocket, power consumption of ultrasound horn, transmitted acoustic pressure amplitude, structural and hydrodynamic characteristics, and acoustic impedance) of textile materials using precision woven monofilament fabrics as a model textile. In 2013, Nordgren et al. [
23] discovered the influence of anisotropy in open-cell porous materials on the vibroacoustic response. Wintzell [
24] extensively documented on acoustic textiles for home wall panels and demonstrated that low-density textile materials are disadvantageous for the sound diffusion. In addition, textiles may be either acoustically absorbent or transparent, depending on the textile build up. The textile structure includes small air pockets that could affect the acoustic properties. Additionally, textiles can be non-woven, woven, or knitted and are normally not homogenous. Various methods are used to make acoustic textiles. In 2013, Ballantyne and Heden [
25] utilized an acoustic grille for the loudspeaker cabinet. Tsai et al. [
26] have tuned the acoustic impedance of porous materials used in an insert earphone for SPL response based on ECM modeling and measurements to validates and understand the effect of acoustic porous material in 2012. In another study, Liu et al. [
27] have investigated the acoustic parameters (air permeability, reflection coefficient, and acoustic impedance) of acoustic cloth used in electroacoustic products in 2014. McIntosh [
28] conducted measurements and modeling of circumaural headphones for a desktop computer speaker to investigate the correlation between the measurement and modeling. However, it has been reported that most electro-acoustic devices are designed through “experience” and “trial-and-error” due to the non-availability of acoustic component’s impedance, precisely a black cloth (very low acoustic flow resistance) and white cloth (much higher flow resistance) that generally covers the speaker flange. In their work, Klasco and Tatarunis [
29] measured the impedance of an acoustical speaker’s impedance and highlighted that the acoustic resistance of a meshed cloth could prove to be influential in optimizing the transient response of larger speaker drivers into smaller enclosures. Both woven and non-woven materials result in acoustic impedance. Woven materials are repeatable, uniform, and have less than 10% maximum performance deviation, however, they are costly. In contrast, non-woven materials are cheap but show 30% acoustic resistance variation and are affected by humidity. Acoustic meshes can improve impulse response settling time (damping) and be modeled as a “resistor” across an inductor or capacitor or other tuned circuit. Acoustic meshes control venting, air bearing, damping, acoustic transparency and absorption of dirt, dust, and moisture. Acoustic cloths also provide for the chuffing of the vented pole piece resulting from air velocity turbulence and reduces the volume of air in the vicinity of the vented pole piece to reduce the vent noise and cooling requirements. In 2017, Horoshenkov [
30] reviewed the acoustical laboratory methods for determination of porous material’s morphological characteristics. Various studies have been carried out on the ECM modeling of the microspeaker. For example, Tashiro et al. [
13] have used ECM to study the performance of a flat-panel loudspeaker, generally used for portable multimedia. To improve and control the overall sound-pressure performance of cellular phones, many scholars conducted SPL research on microspeakers of the cellular phones for SPL investigations.
The resistance of the ventilation cloths (papers) to the airflow changes the amount of air passing through it; hence, ventilation cloths can adjust the sound quality. The use of ventilation cloths has been widely adopted in the industry for acoustic purposes, but the knowledge required to properly choose ventilation cloths is not widely available in the literature. As aforementioned, the ventilation cloths are selected based on “experience” and “trial-and-error.” The lack of research data on and analyses of various ventilation cloths to determine resistance to the sound propagation limits the development of electroacoustic products (microspeakers, earmuff headphones, earphones, etc.). In this study, the influence of different ventilation cloths on the frequency response of the microspeaker was investigated. An inverse calculation method was used to obtain the acoustic resistance of the ventilation cloths to predict the frequency response curve with a greater accuracy. Particle swarm optimization (PSO) was employed to estimate the acoustic resistance of the ventilation cloths using initially measured frequency response as a target function. Furthermore, the acoustic impedance and frequency response of five different types of woven and five different types of non-woven acoustic ventilation cloths were studied.
3. Equivalent Circuit of Microspeaker
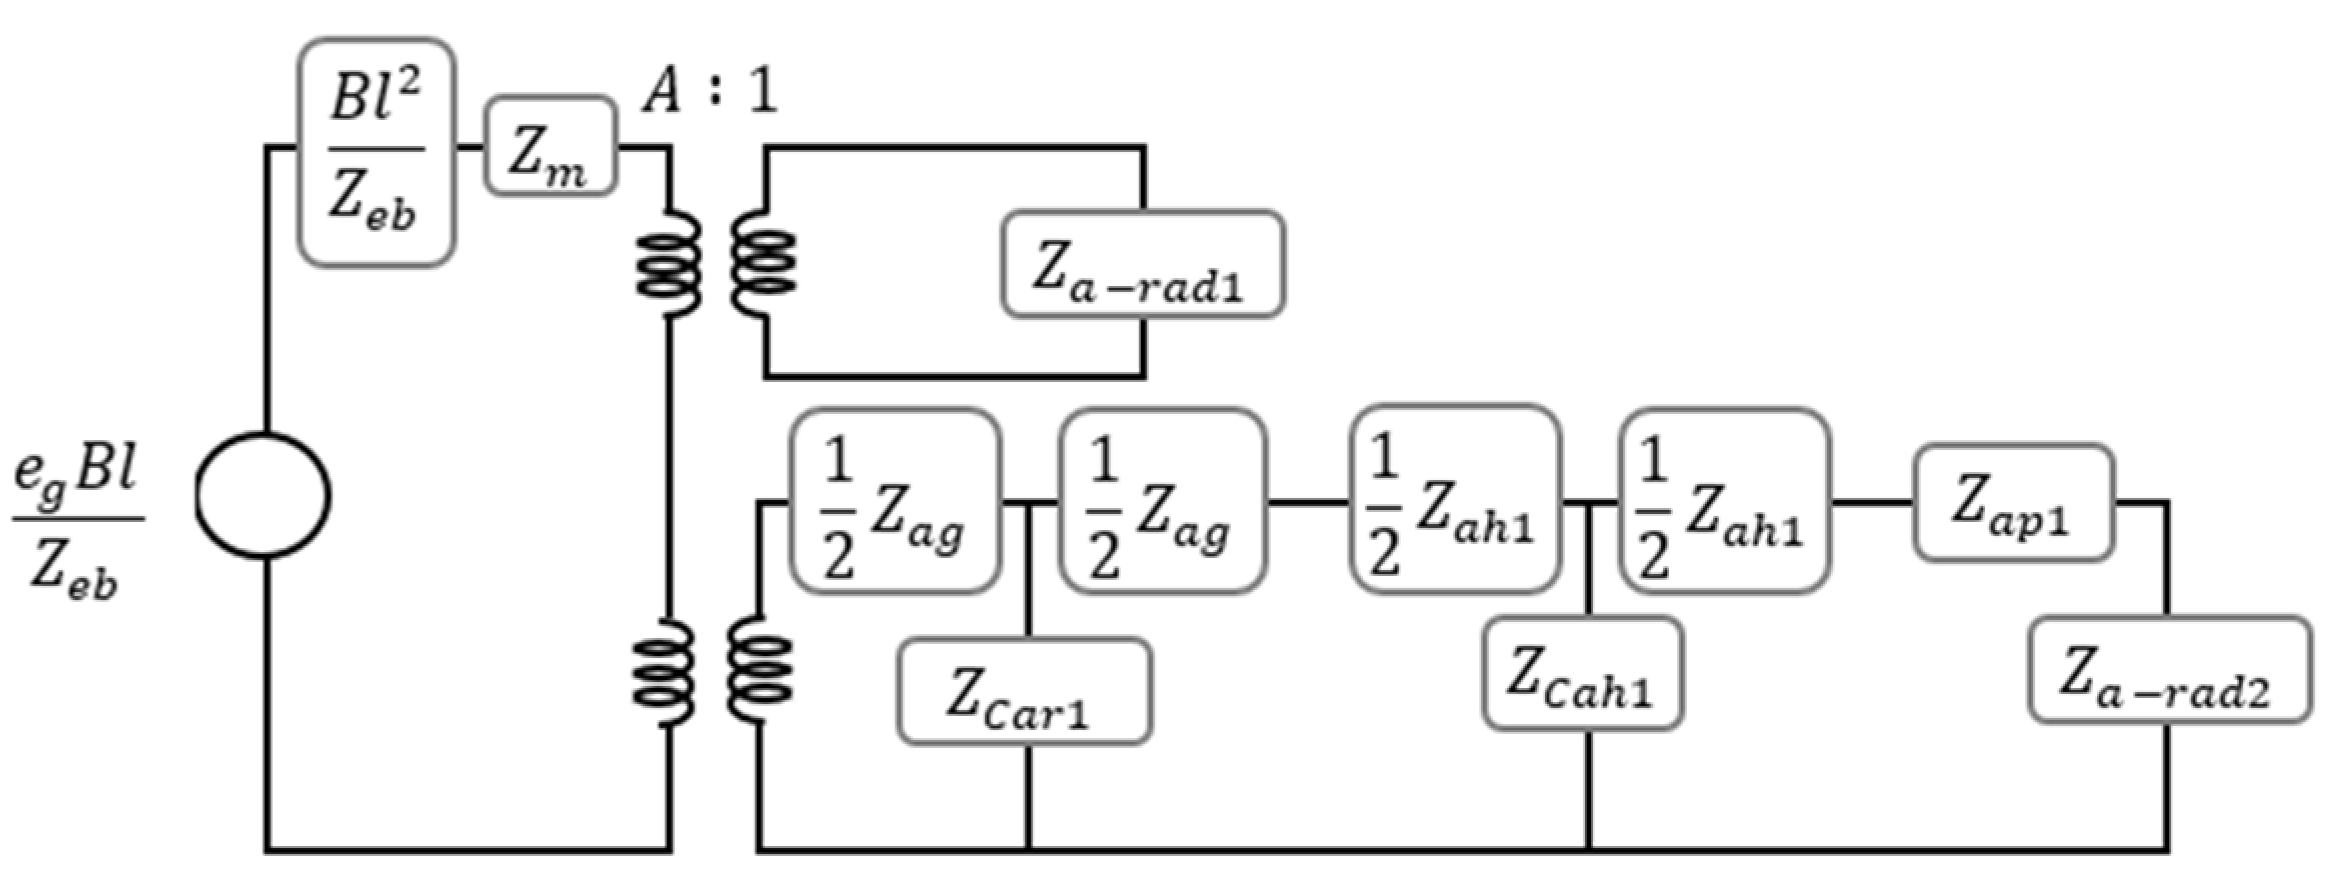
ECM was used to model the microspeaker when it was placed on an infinite baffle in an anechoic chamber for measurement of frequency response. The detailed ECM of microspeaker is given in our earlier work [
31], with the front chamber and holes in the front chamber after the diaphragm and towards the front. In brief, for quick reference, the ECM of the present microspeaker is discussed in brief as follows (
Figure 2). The excitation voltage
eg is input to the microspeaker that generates Lorentz force for driving VC. The product
Bl is the force factor. The blocked electrical impedance of the VC is represented by
Zeb and the mechanical impedance of diaphragm by
Zm. The VC drives diaphragm with velocity
v. The ECM circuit, which is shown in
Figure 2, includes two transformers, one towards the front side of the microspeaker’s diaphragm and the other towards the rear side of the diaphragm. The area of the diaphragm is given by
A, which acts as a transduction factor between the mechanical domain of the diaphragm and the associate acoustic domains.
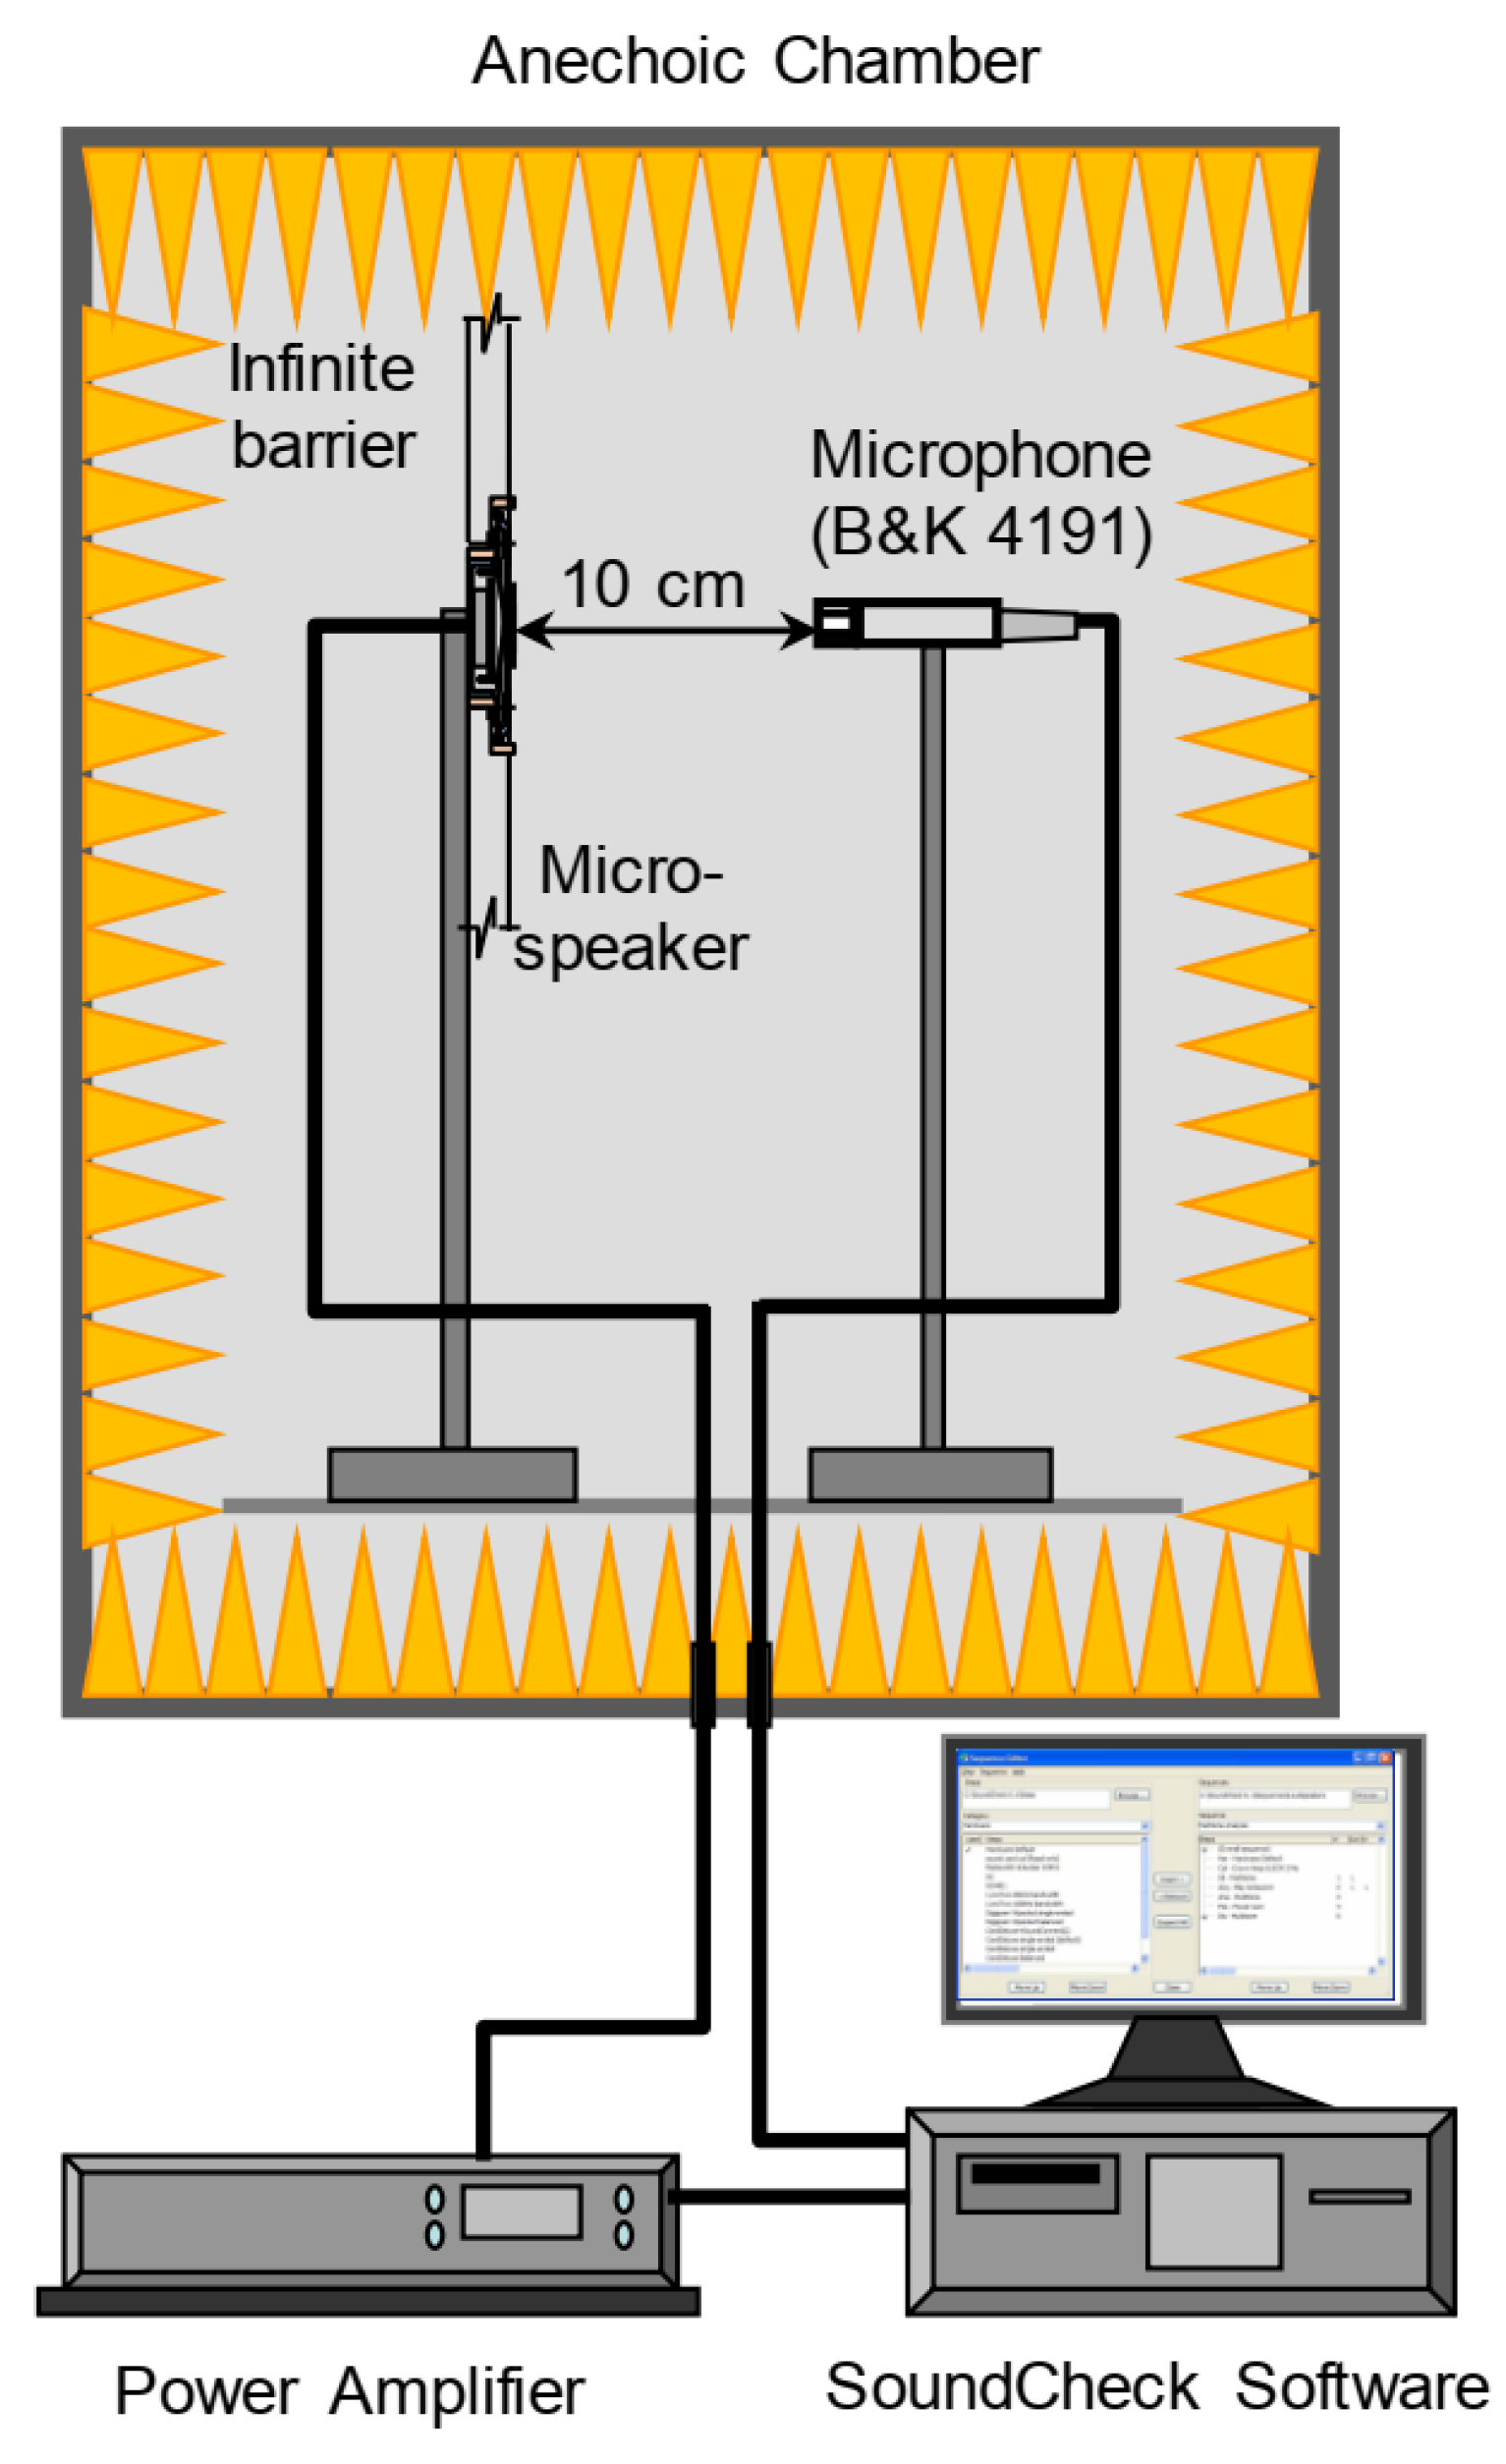
As shown in
Figure 3, the microspeaker was placed on an infinite barrier; hence, only the sound waves that radiated in the forward direction were received by the microphone, located 10 cm from the microspeaker center. This radiated sound was represented by acoustic resistance (
Ra-rad1) and acoustic mass (
ma-rad1), collectively giving the radiation impedance (
Za-rad1). The sound waves that radiated backward were propagated through the volume of the rear chamber, which was responsible for the cavity compliance impedance Z
Car1. Additionally, it was estimated that the cavity behind the diaphragm is thin, resulting in a slit-like effect due to acoustic resistance
Rag and acoustic mass
mag, leading to impedance
Zag. Collectively, this cavity was expressed with a T-circuit. Similarly, the sound propagating through the rear openings (vents) of the microspeaker demonstrated acoustic resistance
Rah1 and acoustic mass
mah1, collectively giving acoustic impedance
Zah1, which was expressed with a T-circuit. The effect of cavity volume of the rear openings was taken care of by the cavity compliance impedance (
ZCah1) in the T-circuit. A ventilation cloth covered the rear openings, and their combined acoustic impedance was estimated as
Zap1. Finally, sound that radiated to the external environment was represented as a parallel combination of acoustic radiation resistance
Ra-rad2 and acoustic radiation mass
ma-rad2 resulting in acoustic radiation impedance
Za-rad2.
Our group has reported detailed ECM modeling of loudspeaker (woofer) [
32], microspeaker [
31], earphones [
33,
34], and headphone [
35]. The mathematical formulation used in the ECM of the current microspeaker is given below in brief:
All symbols have their usual meaning.
Zm is the mechanical impedance of the diaphragm (assuming it as a simple spring-mass-dashpot system),
Rm is the mechanical resistance,
mm is the mechanical mass, and
Cm is the mechanical compliance of the diaphragm. The blocked electrical impedance,
Zeb is modeled as a series combination of the electrical inductance of VC (
Le) and electrical resistance of VC (
Re), along with the addition of a parallel combination of resistance due to eddy current (
R2) and inductance induced at high frequency (
L2). The acoustic impedance of the small duct/port/tube along with the cavity is modeled analogously to the “Helmholtz Resonator” as a series combination of acoustic mass (
ma) and acoustic resistance (
Ra). Thus,
Zag is the acoustic impedance of the air gap below the diaphragm, and
Zah1 is the effective acoustic impedance of the vent, such that
Nah1 is the number of vents. The acoustic impedance of the cavity (
ZCa) is calculated by the compliance of cavity (
Ca), volume of cavity (
Vc), density of air (
ρ0), and speed of sound in air (
c). Thus,
ZCar1 represents the acoustic impedance of cavity below the diaphragm and
ZCah1 represents the acoustic impedance cavity due to all vents. Finally, the acoustic cloth covered all vents, so
Zap1 represents the acoustic impedance of acoustic cloth, by considering the number of vents (
Nah1). For more details, readers can refer to our group’s earlier works [
31,
32,
33,
34,
35]. Further, ECM circuit has to be simplified by removing transformers to form a typical three loop circuit to solve it according to Kirchhoff’s voltage law. Loops are driven by velocities
v1,
v2, and
v3, respectively, and can be represented by
where the impedance matrix
Z is given by
and
The diaphragm velocity
can be obtained by
Finally, the sound pressure
p can be obtained by
where
r (=10 cm, see
Figure 3) is the distance of the microphone from the microspeaker. Finally, the sound pressure level of the microspeaker is the pressure level of the sound measured in decibels (dB) and abbreviated dBSPL. On axis SPL can be obtained by
where
pref is the reference sound pressure in air, 2 × 10
−5 N/m
2 (0.00002 Pa). The
pref is the lowest sound pressure possible for human hearing.
4. Inverse Calculation for Acoustic Impedance of Ventilation Cloth
The acoustic impedance of the ventilation cloth placed over vents is not easy to obtain, and, hence, has mostly been neglected in earlier research. Moreover, it may compromise the accuracy of the ECM circuit. In this study, an estimation of the acoustic impedance of the ventilation cloth was attempted. Due to the porous nature and thickness of the ventilation cloth, it was assumed that the contribution to acoustic impedance (
Zap) was due to acoustic resistance (
Rap) only and the effect of acoustic mass (
map) was negligible. The PSO algorithm was used to set the SPL measurement curve as the target function, and the acoustic resistance of the ventilation cloth was obtained by inverse calculation. The PSO algorithm was proposed by Kenned and Eberhart [
36,
37] in 1995. It was originally conceived to imitate the movement of birds or fishes.
The transmission behavior of natural swarms or flocks with a group of particles dropped in the search space has been reported [
38]. The PSO optimization revolves around two primary component methodologies. It is understandable due to its ties to artificial life and bird flocking (swarming). It is also related to evolutionary computation and links both genetic algorithms and evolutionary programming. The PSO comprises a straightforward concept that can be executed in a few lines of computer code, requires only primitive mathematical operators, and is computationally inexpensive (in terms of memory requirement and speed). The implementation of PSO relies on two things, nearest-neighbor velocity matching and craziness. Random initialization of the population of birds is performed on a torus pixel grid with a position and X and Y velocities. At each iteration, for each bird, with other agent as its nearest neighbor, determinations are made and X and Y velocities are assigned to the bird in focus. This simple rule creates synchrony of movement. However, the flock quickly settles on a unanimous, unchanging direction. Therefore, a stochastic variable called craziness has been introduced. Each iteration adds some change to randomly chosen X and Y velocities. Such factors introduce enough variation into the system to provide an exciting and “lifelike” appearance to the simulation, while at the same time being wholly artificial. Thus, using the concept of information sharing in a biological society to provides opportunities for the particles in a group to communicate with each other and exchange information in the search for a more effective solution for finding the system optimization parameters. In recent years, PSO has been widely used in acoustics including automatic adjustment of off-the-shelf reverberation effects [
39], comparison of optimization methods for compression driver design [
40], optimization of micro-perforated sound absorber [
41], and optimization of acoustic filters [
42].
In this work, the parameter to be solved was treated as a particle swarm, and its initial position was
x. An objective function
J(
x,
f) was defined to derive the best position
x_opt (best solution) of this particle swarm, as follows:
The
SPLm is the measured sound pressure level, and
SPLs is the simulated sound pressure level (from the ECM model) of the microspeaker. When the objective function
J(
x,
f) reached the minimum value during the optimization, the simulated SPL approaches the measured SPL. This indicates that the unknown parameter
x in the objective function has converged to the optimal solution
x_opt. The particle positions and velocities have to be updated continuously during particle movement as follows:
where
is the position of the
ith particle at the (
k + 1)th iteration (new position),
is the position at the
kth iteration (original position),
is a new velocity,
is the original velocity,
ω is the inertia weight,
is the empirical weight of the particle,
is the empirical weight of the group, and
and
are the random variables between 0 and 1. The random variables change randomly with each iteration, representing the random directions of particles and groups, respectively. Moreover,
is the best solution of
ith particle at the
kth iteration, and
is the
kth best solution of the group. The best solution can be judged by the following formula
The
Rap of 10 commonly used ventilation cloths were estimated their
Rap in this work. These ventilation cloths were sub grouped into two categories viz. (1) Non-woven (NW-1 to NW-5, varying in thicknesses) and (b) Meshed (M-250 to M-450, varying in number of meshes). The details of all 10 ventilation cloths are provided in
Table 2 and
Table 3 (non-woven and meshed ventilation cloths, respectively).
As aforementioned, the acoustic resistances of all ventilation cloths were estimated by inverse calculation. The ventilation cloths were glued over the vents to the rear side of the microspeaker (
Figure 1d), and the frequency response curves were obtained by anechoic chamber measurements. The measured curves were set as a target function in the PSO implementation to estimate the acoustic resistance. The built-in function “particleswarm” in MATLAB software [
43] was used to execute the PSO algorithm. The syntax of the MATLAB “particleswarm” in-built function was “
x = particleswarm(fun,nvars,lb,ub,options)” to attempts to find a vector “
x” that achieves a local minimum of “fun” for the given number of design variables “nvars”. The “lb” and “ub” are the set of lower (0.01) and upper bounds (20) on the design variables (
x) to find a solution in the range (lb ≤
x ≤ ub). “Options” include the default optimization parameters. The PSO consists of seven steps. Step 1 confirms the known parameters (T/S parameters) and target curve (
SPLm). Step 2 establishes an ECM model and defines a “particle swarm” (parameter) to be optimized in the model. Step 3 uses a random number function to initialize the particle’s position and velocity (say
k = 0, for the first iteration). The particle solution
is substituted into the ECM in Step 4 to calculate
SPLs. Further, the objective function is used to evaluate
. Step 5 updates the velocity and position of each particle group by updating the particle’s velocity
and substituting it to obtain updated position
. In Step 6, the updated position
is used to obtain
and
. Step 7 tests the convergence. If the convergence is derived, then the best particle swarm solution is provided. Otherwise, the process is repeated from Step 4. Thus, the best value of acoustic resistances of all ventilation cloths is determined separately.
In this work, the number of iterations was used as the condition for the termination of the calculations. The upper and lower boundaries of 10 to 50 times, number of particles of 20 to 50, number of iterations of 50 to 200, inertia weight
ω of 0.729, and acceleration constants of 1.494 were set during PSO execution. All the PSO parameters are were based on [
44]. Since the PSO algorithm is a random search algorithm, the results of each operation are different, so for the stability of result, multiple calculations must be made to obtain stable and convergent results. Hence, the coefficient of variation was obtained to measure the degree of dispersion of the probability distribution. The closer the coefficient of variation is to 1, the greater the degree of dispersion and stability of results. Thus, the acoustic resistances of all ventilation cloths were obtained for use in ECM simulation.
6. Results and Discussion
First, the T/S parameters of microspeaker DSH742-005 have been obtained from the KLIPPEL measurement system (
Figure 4) using laser vibrometry and are given in
Table 4. These parameters define the specified low-frequency performance of a microspeaker. Other important parameters are also shown in
Table 4.
The frequency response curve of the microspeaker without ventilation cloth are shown in
Figure 5. The simulated and measured curves are in agreement before the second resonance. The frequency response rises monotonously until the fundamental frequency and becomes flat afterwards until the next resonance frequency. The obvious error between frequency response is at the peak and valley, 4~5 kHz. This difference may arise from the impedance value of the rear openings (vents) of the microspeaker. It could also be due to the mode splitting of the diaphragm at high frequencies. Overall, based on the results, one can conclude that the ECM model of the microspeaker has accurately estimates the preliminary prediction of the characteristics of the microspeaker’s frequency response. Thus, the validity of the proposed ECM circuit (
Figure 2) has been established, which leads to further was investigated.
The initial results of the PSO algorithm implementation in terms of the number of particles and the number of iterations, are shown in
Table 5. The coefficients of variation after 30 numbers of particles were all close to 0, indicating that the set of parameters exhibits stable convergence. With selection of the combination of 30 particles and 50 iterations, the result of the upper and lower boundaries are shown in
Table 6. Stable and convergent results were obtained in the boundary range of 10 times to 40 times. However the boundary range of 50 times was too wide, resulting in error. Therefore, 10 times boundary range was decided on for the inverse calculation of ventilation cloth parameters. The acoustic resistances of each type of ventilation cloth are shown in
Table 7.
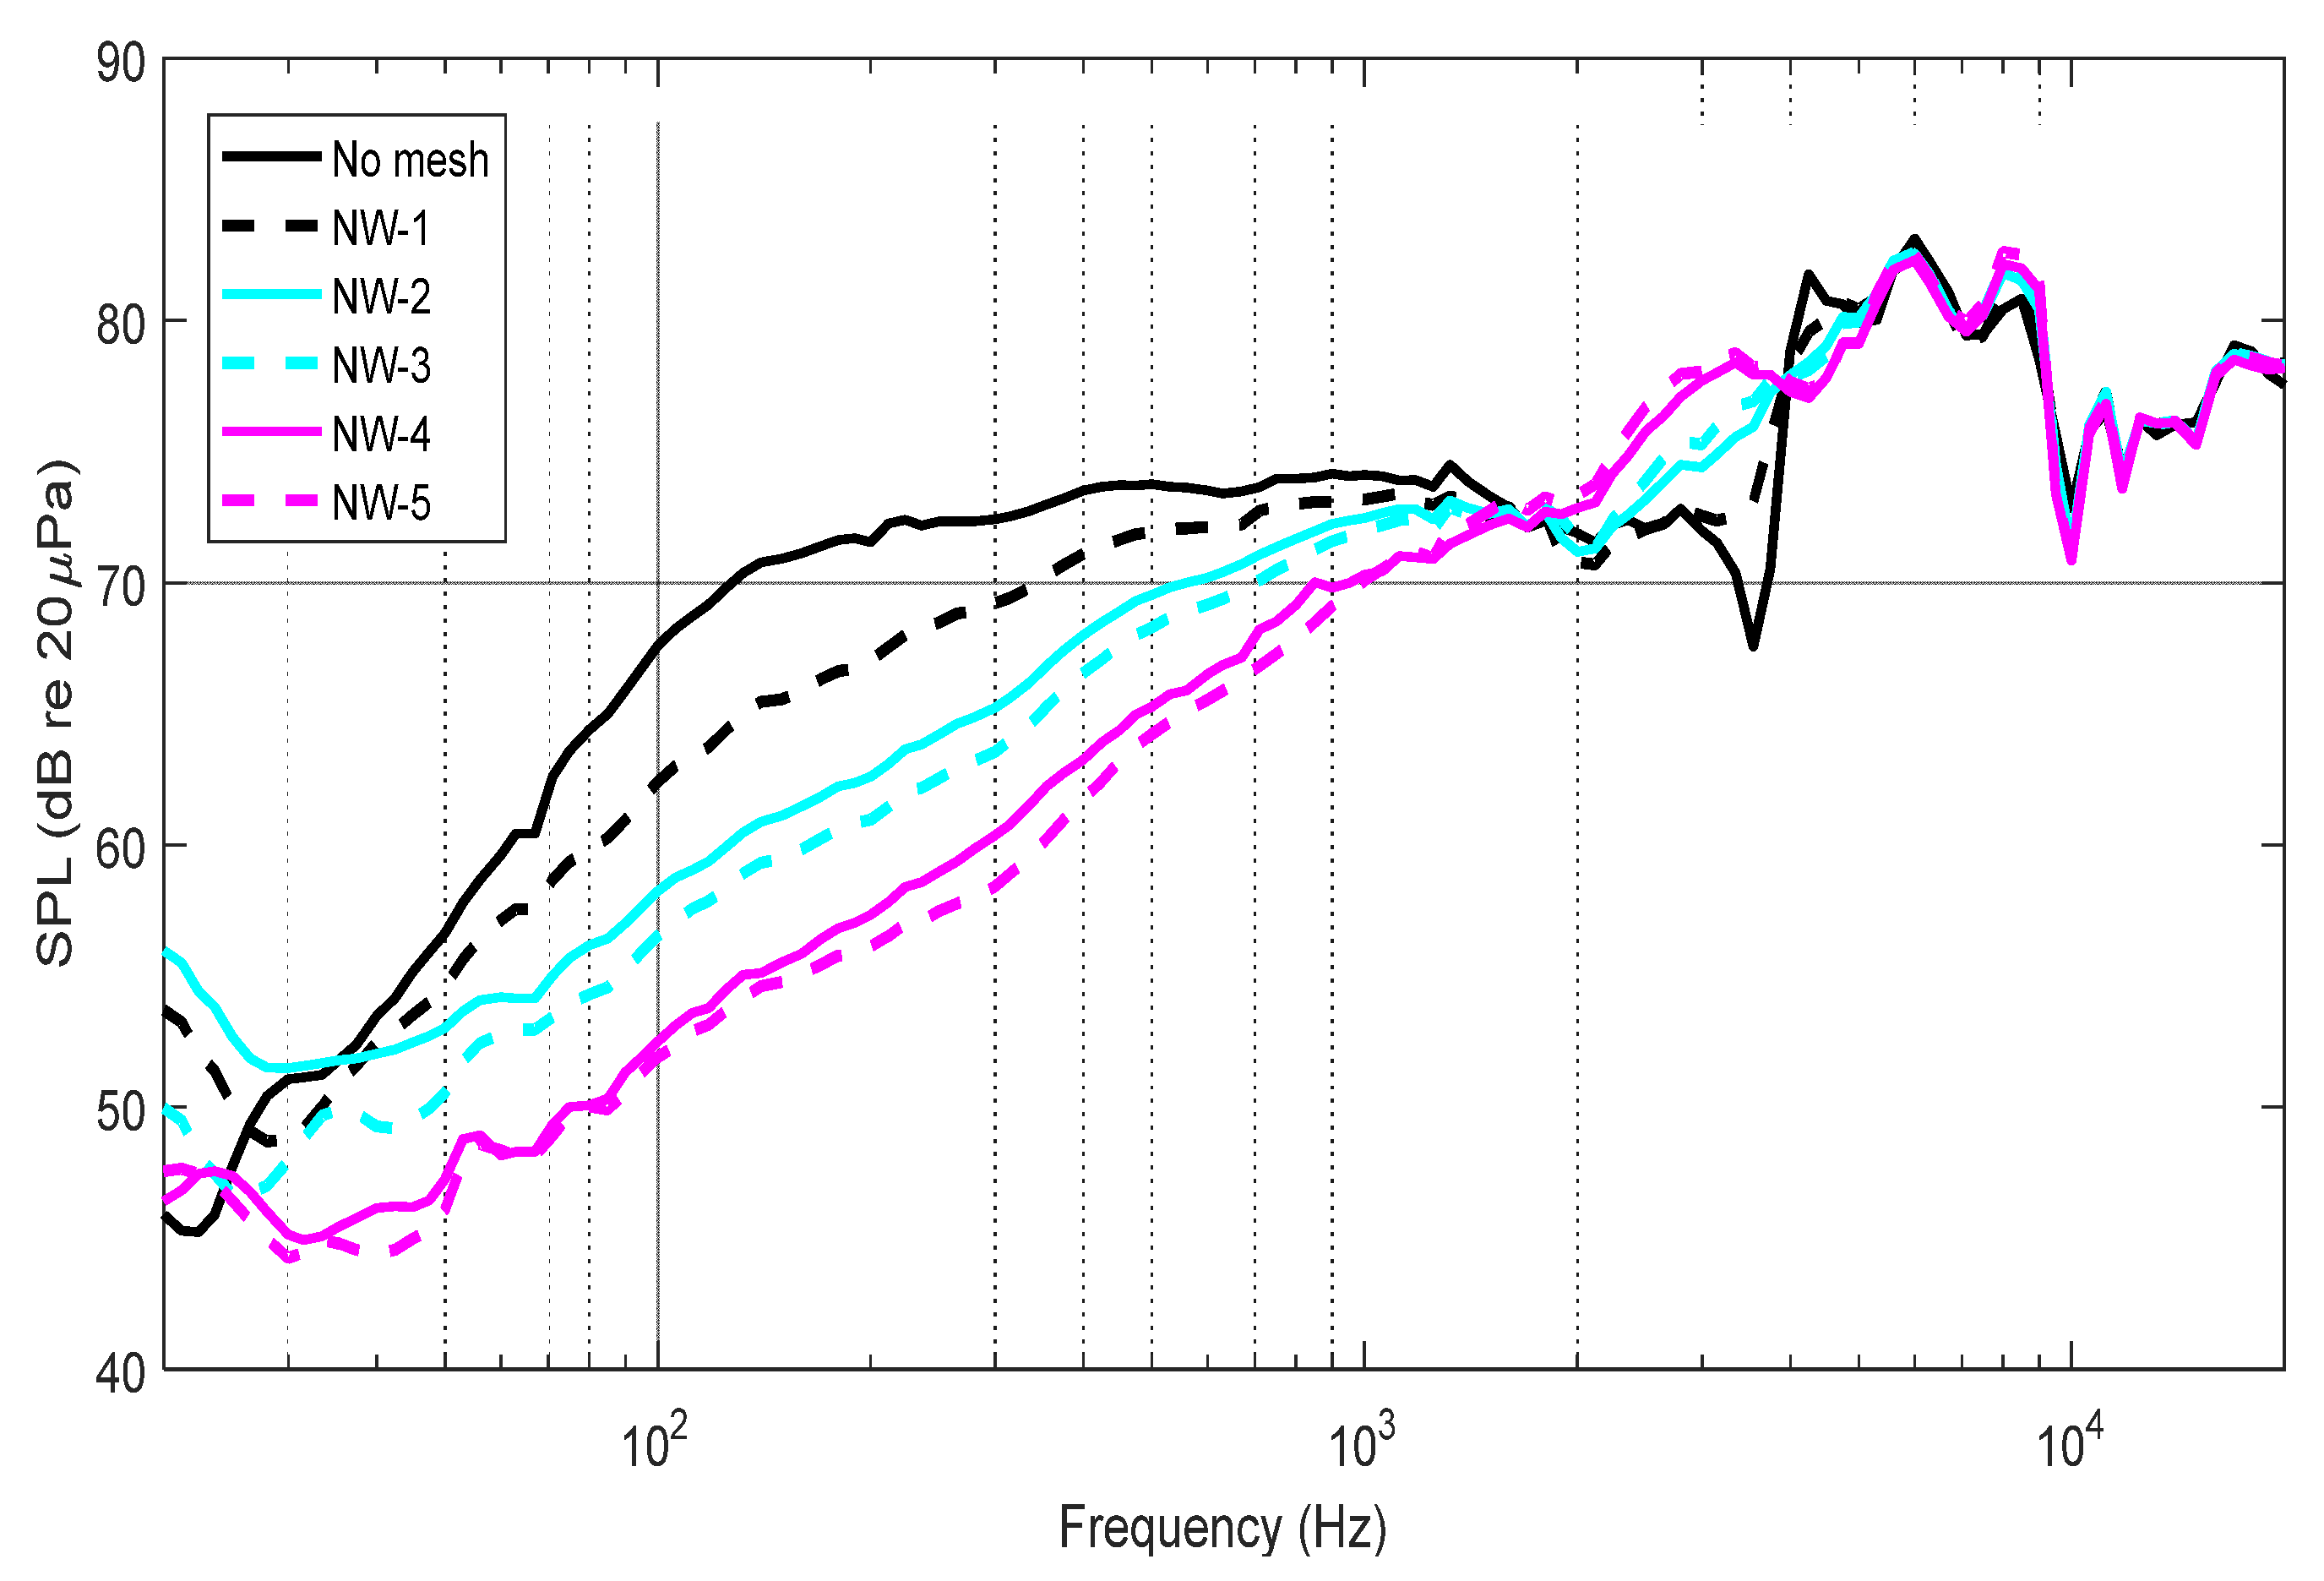
Figure 6 and
Figure 7 present the measured and simulated results of the non-woven ventilation cloths, respectively. It can be observed from the measured curves that the influence of the type of ventilation cloth is mainly below 1 kHz. For comparison, the frequency response of microspeaker without ventilation cloth is also given. Below 1 kHz, the highest curve was for microspeaker without ventilation cloth and the remaining curves were progressively lowers as thickness of non-woven cloth increased. Moreover, the remaining curves tended to became relatively straight, facilitating ease of listening. The measurement curves with non-woven ventilation cloth exhibited flat frequency response after 1 kHz until the start of furious resonances. The sharp dip in the response without ventilation cloth was not evident among the remaining responses, ensuring the extension of the audible range to the microspeaker. The simulated curves (
Figure 7) also showed similar trends to those of measured curves, thus confirming and validating the ECM model.
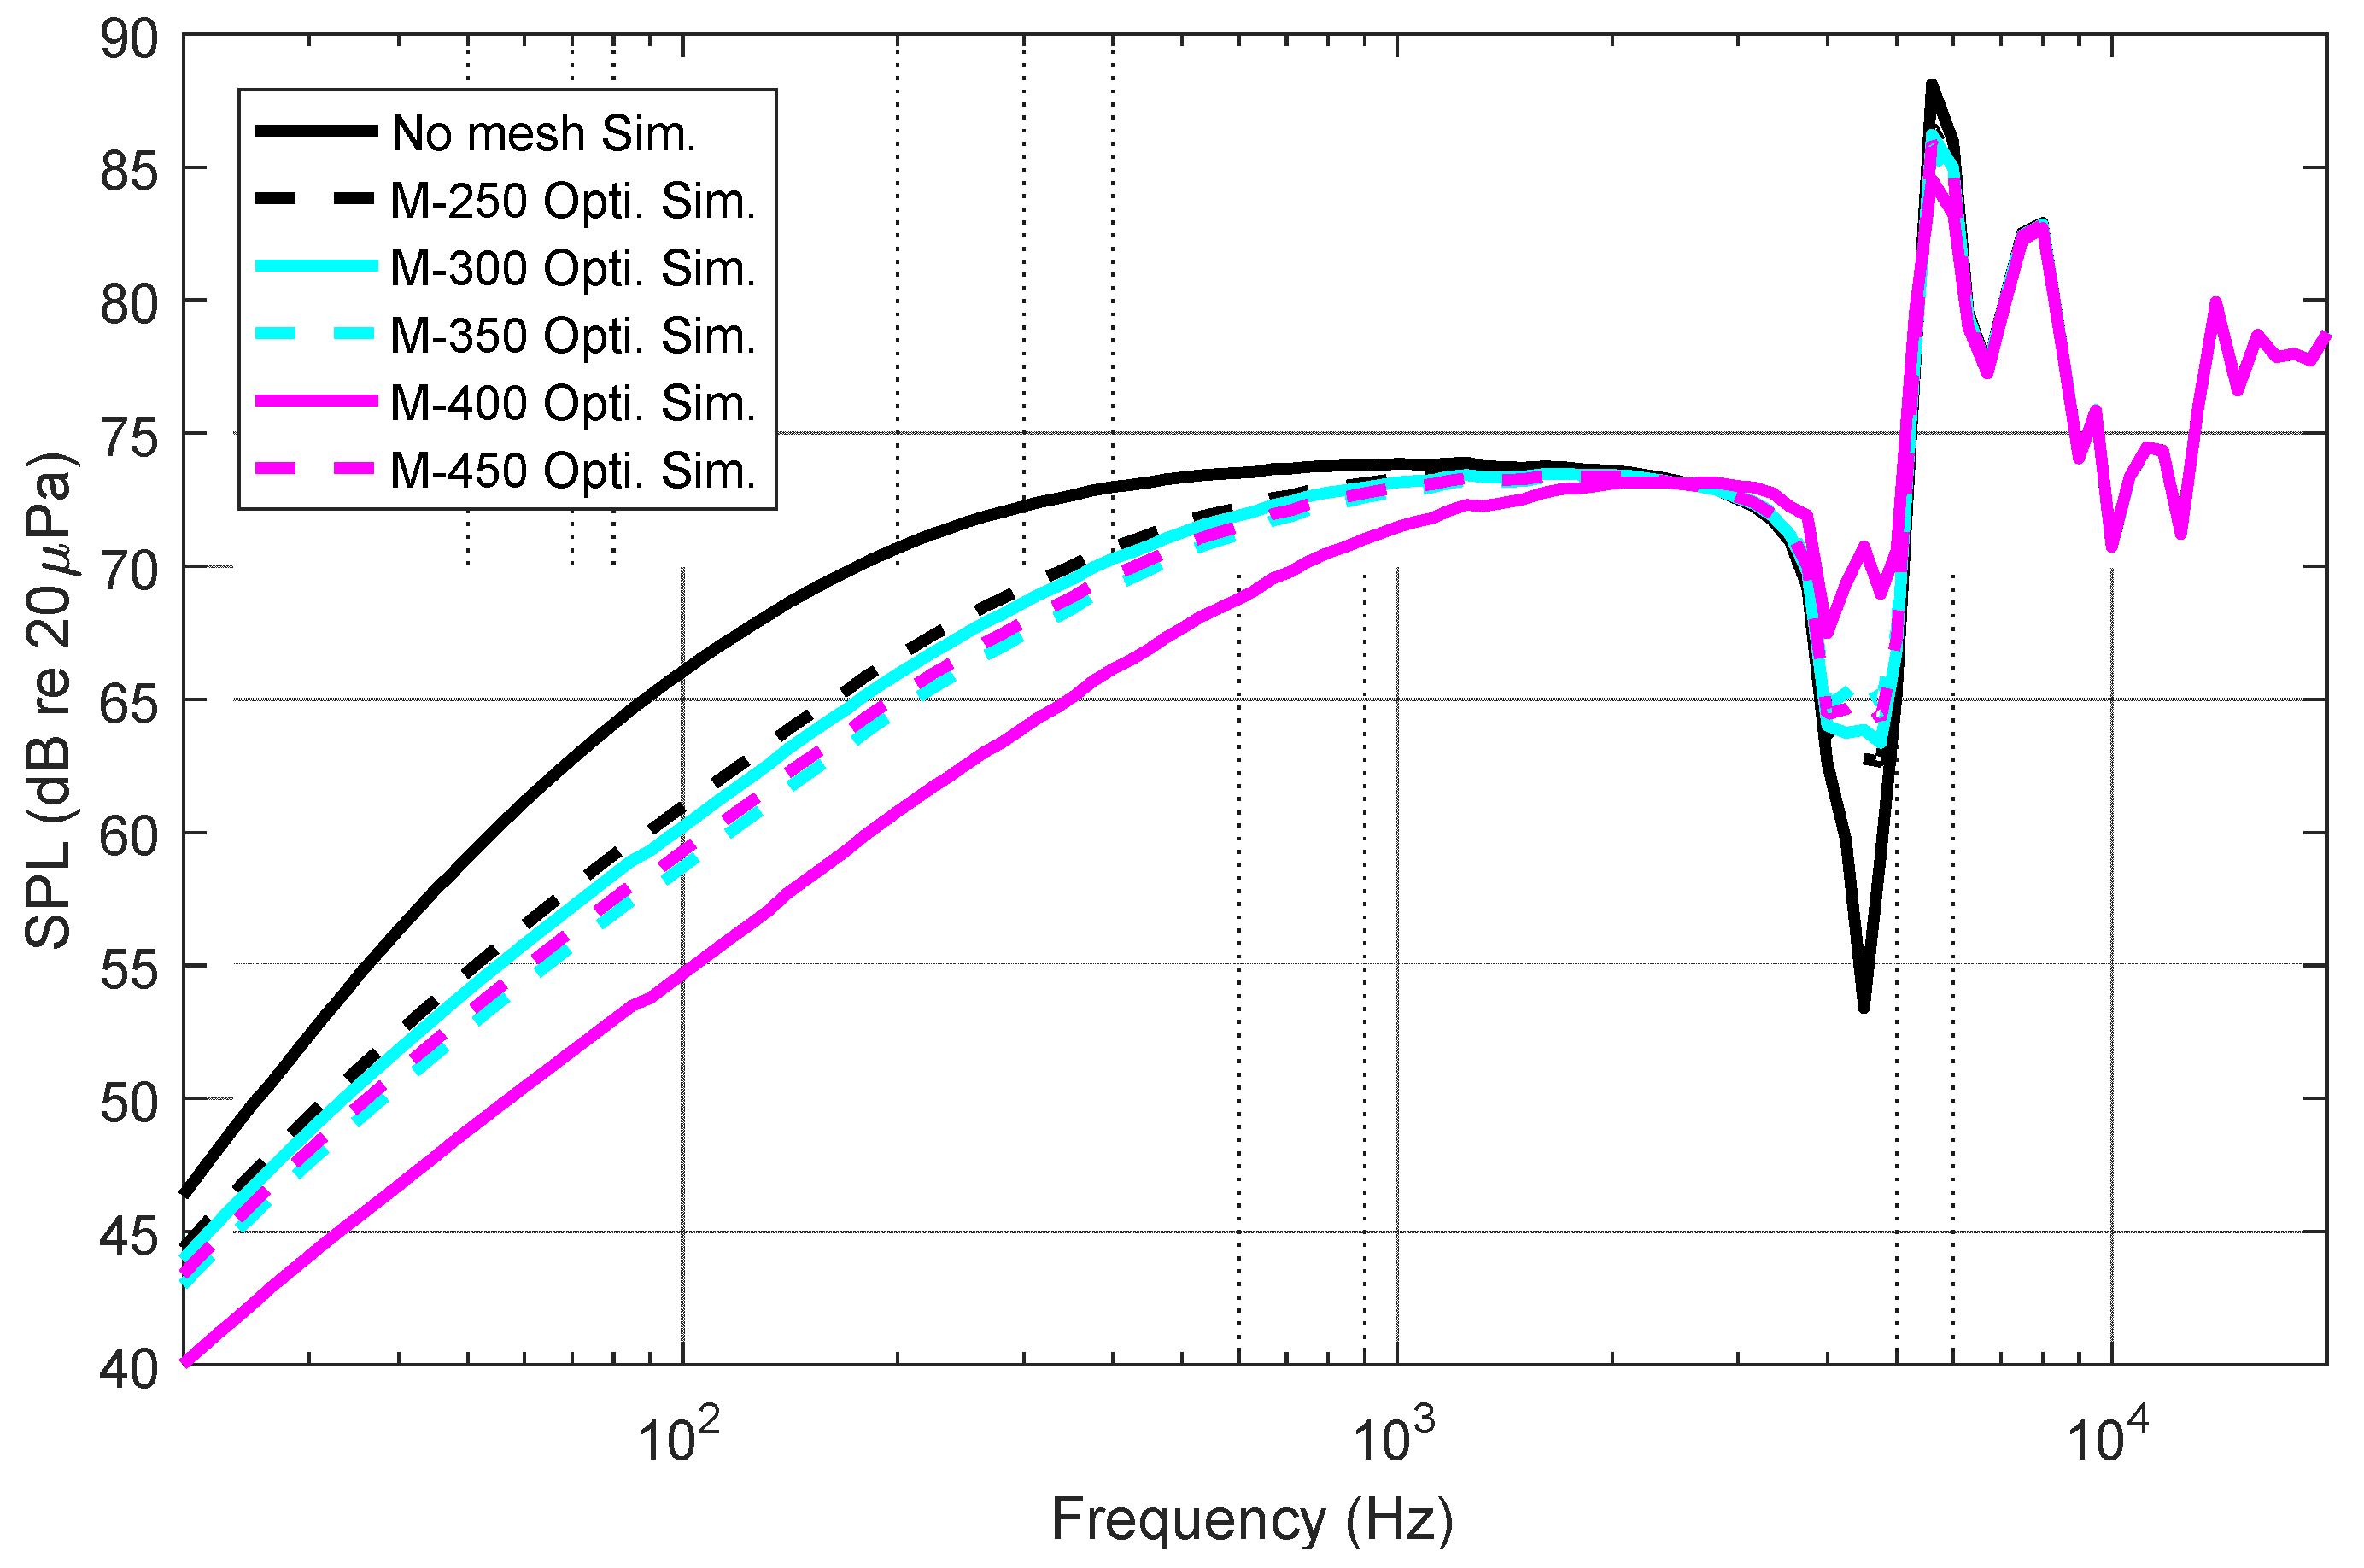
Figure 8 and
Figure 9 show the measured and simulated results of the meshed ventilation cloths, respectively. The measured responses of microspeaker with and without ventilation cloths show a definite effect. As aforementioned, the measured curves were influenced by the meshed ventilation cloths at mainly below 1 kHz. Moreover, as the number of meshes increased, the curves became lower and straighter below the fundamental resonances. The frequency range after 1 kHz was flat until the start of spurious resonance.
Figure 6 and
Figure 7 show the measured and simulated frequency responses of microspeaker without and with non-woven ventilation cloths (NW-1 to NW-5). Additionally,
Figure 10a,b illustrate the comparison of measured and simulated frequency responses of microspeaker without and with non-woven ventilation cloths (NW-1 to NW-5). The measured and simulated responses show a good match, indicating that the ECM model can accurately predict the frequency response of microspeakers.
Furthermore,
Figure 11a,b show the comparisons of the measured and simulated frequency responses of microspeaker without and with meshed ventilation cloths (M-250 to M-450). As observed in
Figure 11a,b, measured and simulated responses of microspeaker with and without meshed ventilation cloth are satisfactory. However, some variations between measured and simulated responses are seen for NW-1 to NW-5 (
Figure 10a,b) at the start of the curve that is due to low frequency (high wavelength) and microspeaker dimensions. The same types of variations were also observed for M-250 to M-450. However, the differences observed at the second resonance (NW-1 to NW-5) might be due to resonance conditions. These observations and their corresponding explanations are also applicable to
Figure 11a,b.


