
Enhanced Rolling Bearing Fault Diagnosis Combining Novel Fluctuation Entropy Guided-VMD with Neighborhood Statistical Model

Collaborative Innovation Center of High-End Manufacturing Equipment, Xi’an Jiaotong University, Xi’an 710049, China
*
Author to whom correspondence should be addressed.
Appl. Sci. 2023, 13(1), 192; https://doi.org/10.3390/app13010192
Submission received: 3 November 2022
/
Revised: 9 December 2022
/
Accepted: 14 December 2022
/
Published: 23 December 2022
(This article belongs to the Special Issue Vibration Problems in Engineering Science)
Abstract
:Variational Mode Decomposition (VMD) provides a robust and feasible scheme for the analysis of mechanical non-stationary signals based on the variational principle, but this method still has no adaptability, which greatly limits the application of this method in bearing fault diagnosis. To solve this problem effectively, this paper proposes a novel fluctuation entropy (FE) guided-VMD method based on the essential characteristics of fault impulse signals. The FE reported in this paper not only considers the order of amplitude values but also considers the variation of amplitude, and hence it can comprehensively characterize the transient and fluctuation characteristics of rolling bearing fault impulse signal. On the basis of establishing FE, the FE-based fitness functions are then conducted, after which the mode number and balance parameter can be adaptively determined. Meanwhile, an adaptive neighborhood statistical model is developed to further reduce the noise of the mode component containing fault information so as to highlight the periodic impulse component more significantly and improve the diagnostic accuracy. Simulation and case analysis show that this research is effective and quite accurate in fault mode separation and fault feature enhancement. Compared with the traditional VMD method and the current common diagnosis methods, the proposed method has obvious advantages in the comprehensive utilization of fault impulse information and enhanced diagnosis.
1. Introduction
Rolling bearings are the foundation and key components of mechanical equipment; their performance is directly related to the health status of the whole equipment, and their operation failure often leads to disasters and accidents [1,2]. Because of the operating conditions’ variability, the interference of multiple vibration sources and the weak impulse characteristics in the fault initiation stage, it is difficult to directly diagnose early faults in many situations, which requires in-depth research on modern diagnostic technology [3,4,5,6]. Machine learning is a reasoning process that simulates human thinking. By effectively obtaining, transmitting and processing diagnostic information, it can simulate human experts and make intelligent judgments and decisions on the operation status and faults of monitored objects with flexible diagnostic strategies. Intelligent diagnosis plays an important role in the field of mechanical fault diagnosis because of its learning function and the ability to automatically obtain diagnostic information for real-time fault diagnosis [7,8,9]. In addition, some potentially valuable modern signal processing technologies have been used in rolling bearing monitoring and diagnosis, and a series of practical theoretical and engineering applications have been achieved, effectively improving the service status and predictive maintenance of equipment. Variational mode decomposition (VMD), proposed by Dragomiretskiy K and Zosso D [10], is a unique, innovative mathematical tool that can characterize the input signal as an intrinsic mode component with specific equivalent filtering and sparsity characteristics according to the input settings. However, the most important limitation of the VMD is the required explicit selection of the mode number and balancing parameter in the decomposition, like in EWT but as opposed to EMD [11]. To address the aforementioned shortcomings, scholars have carried out some very valuable research. In the past few years, these studies mainly focused on the independence of mode components and the selection of optimization indicators, among which kurtosis and correlation coefficient are the most widely used in parameter optimization [12,13,14,15]. A representative study is to construct the objective function by considering the kurtosis and correlation coefficient of the envelope power spectrum [16].
The energy criterion was also widely used in parameter selection. The transient state corresponds to the state of energy distribution deviating from the system, which means that the pulse-like frequency characteristics can be measured by energy changes. The varying features of the center frequency of extracted modes are thereby investigated [17,18], with initial center frequencies, in which the converging U-shape phenomenon is found. In the same direction, an energy-driven VMD method based on spectrum division and the Gini index is proposed for the adaptive decomposition of rolling bearing fault signals [19]. Sparsity is a very useful concept that has become a research hotspot in the field of mechanical signal processing in recent years. Due to the introduction of compressed sensing, sparse diagnosis has aroused the great interest of scholars. Since it can be assumed that this corresponds to mechanical failure rather than normal behavior, the sparsity feature can also be used to find and optimize VMD parameters [20]. However, it is still difficult to characterize the fault attribute only by sparsity since the impulse behavior induced by local damage of bearing is periodic fluctuation and attenuation oscillation. In view of this, some research work has explored the strategy of multiple index fusion [21,22,23]. A permutation entropy and orthogonality-based mode number adjusting procedure was conducted by [24]. Ref. [25] presented a parameter extraction method based on the characteristics of the intrinsic mode function. This method quantifies VMD results based on the comprehensive consideration of permutation entropy, frequency domain extremum, kurtosis criterion and energy loss coefficient. Recently, scholars suggested that the initial center frequency and balancing parameter of reconstructed specific subcomponents could be determined adaptively according to the dominant frequency of the remaining signals decomposed by the previous iteration, making VMD an adaptive signal decomposition algorithm [26]. Although the above methods improve the VMD performance to some extent, they still have shortcomings in maximizing the periodic pulse information because the bearing fault impact signal consists of transient and fluctuation, and the existing research work only focuses on the transient characteristics. Another important research topic of VMD for bearing fault diagnosis is high-frequency mode noise elimination. This is different from the general idea of noise elimination because the signal is in the high-frequency band, and the waveform shows certain oscillations, while the noise component is attached to the oscillation waveform, showing overall sparsity and smoothness. Therefore, after deeply discussing the FE guided-VMD, we propose a neighborhood statistical de-noising (NSD) method based on the second-generation wavelet transform (SGWT) and FE, which not only considers the neighborhood statistical property but also makes full use of the oscillation attenuation and tight support of the SGWT.
The contributions of this paper are mainly reflected in: (1) a new measure of fault information called fluctuation entropy is constructed. This measure comprehensively considers the transient and fluctuation attributes of fault impulse signals, which can lead to a more reasonable decomposition of VMD. (2) We deduce a new NSD method based on SGWT and FE, thereby highlighting the periodic impulses. Compared with the traditional wavelet threshold method, the NSD algorithm using FE characteristics of the signal to estimate non-Gaussian components makes comprehensive use of coefficient correlation and impulse fluctuation statistics and has good universality and applicability, which can better improve the detection performance of periodic impulses. (3) An enhanced bearing fault detection approach based on FE-guided VMD and NSD is proposed and compared with related methods.
This paper is organized into the following sections: Section 2 presents the FE guided-VMD method, including theoretical background, FE establishment using phase space and fitness function construction. Section 3 describes the neighborhood statistical de-noising method based on SGWT. Next, the method is validated on simulated signals in Section 4 and experimental data of bearing fault data set in Section 5. Finally, concluding remarks are given in Section 6.
2. FE Guided-VMD
The VMD algorithm first assumes that each mode component has a different center frequency and limited bandwidth and then uses the alternating direction multiplier method to continuously update each mode and its center frequency to minimize the sum of the estimated bandwidth of each component. Finally, each mode is demodulated to the corresponding fundamental frequency band step by step so that the signal can be effectively separated from low frequency to high frequency. The construction process of the corresponding variational problem is as follows [10]:
Reconstruction constraints can be resolved in different ways. It is suggested to introduce quadratic penalty function term and Lagrange operator for constraint. The augmented Lagrange function is described as follows:
The center frequency does not appear in the reconstruction term but only in the previous bandwidth. The relevant problem thus writes in the Fourier domain:
Performing numerical calculations, the decomposition mode number , balance parameter and Lagrange multiplier are specified in advance, and other original conditions are initialized to zero. Subsequently, the mode and center frequency are updated iteratively by Equations (4) and (5), respectively.
Dual ascent for all :
Until convergence:
It can be seen from the above description that VMD needs to specify two important parameters in advance: mode number and balance parameter . In fact, these two parameters have a great influence on vibration signal decomposition. For rolling bearings, this requires that the parameters can well match the transient and fluctuating attributes of the impact signal synchronously so as to obtain the mode component containing the most fault information.
2.1. Fluctuation Entropy
Takens has proved that if is satisfied, where is the dimension of the manifold of the attractor, the phase space reconstruction can ensure that the internal geometric structure of the prime mover corresponding to the time sequence remains unchanged [27]. We know that the local attenuation fluctuation of impulse signals is different from that of harmonic signals or white noise. The greater the fault degree is, the stronger the fluctuation is. The number of data points deviating from the mean value in the phase space is the specific standard of attenuation fluctuation. In view of this, we construct FE to quantitatively evaluate the decomposed modes. The calculation process of FE is briefly introduced as follows.
For any arbitrary time series , according to the phase space reconstruction theorem, -dimensional embedding matrix setting with time delay is defined as:
Then, for each subsequence of the reconstruction matrix, the mean values are calculated corresponding to each row in the matrix .
We perform the following binary operations on the elements of each row, and the binary digits are determined as:
Thus, the original phase space is transformed into binary phase space . After binarization, we sum elements of each row in and perform histogram processing to enhance the distribution by the following expression:
Consequently, the FE of a time series can be defined according to Shannon’s entropy as follows:
Meanwhile, if , we naturally get the following results:
and
For the sake of accuracy, the average form is usually used as follows:
It can be seen from the above calculation process that and are the two parameters that need to be set for FE. According to the vibration character of rolling bearing with local fault, we suggest that the value of should be within the range of 6–9 so as to acquire better robustness. Actually, FE not only considers the number of amplitude deviations from the mean value but also incorporates the data distribution characteristics, so it can effectively evaluate the impulse fluctuation and fault information. Compared with the permutation entropy (PE), PE considers only the order of the amplitude values and hence some information regarding the amplitudes may be discarded [28]. The case proof will be provided in Section 5.1.
2.2. Fitness Function
The mean value of FE emphasizes the contribution of each mode component; the resulting maximum mean value has properties of maximizing fault information in the time and frequency domain. Therefore, the novel proposed FE is chosen as the basis of the fitness function, which can be expressed as:
It is not difficult to see from the above formula that when FE is smaller, the fault information contained in the decomposition mode is more concentrated, thus effectively avoiding the feature loss caused by the dispersion of fault information in multiple frequency bands. The standard deviation reflects the dispersion degree between individuals in the data set. The larger the standard deviation, the greater the difference between individuals, that is, the more prominent the information characteristics of each mode component and the better the decomposition effect of VMD. Therefore, we employ the standard deviation of FE to find the optimal balancing parameter, as shown in the following formula:
Furthermore, if the balance parameter is too large, the signal may lose the edge feature or produce pulse omission; if the balance parameter is too small, the noise will be too large. Using standard deviation as a measure can better juggle the impulse characteristics. After achieving the optimal decomposition, considering both FE and kurtosis would provide a more reliable mode selection process. The best mode component can then be found by:
where is the kurtosis value, and is the selected best mode. It can be seen that the mode component selected by Equation (18) contains the signal property closest to the impulse generated by the bearing fault. Therefore, this selection method can reduce the interference of noise and aliasing signals.
2.3. Method Procedure
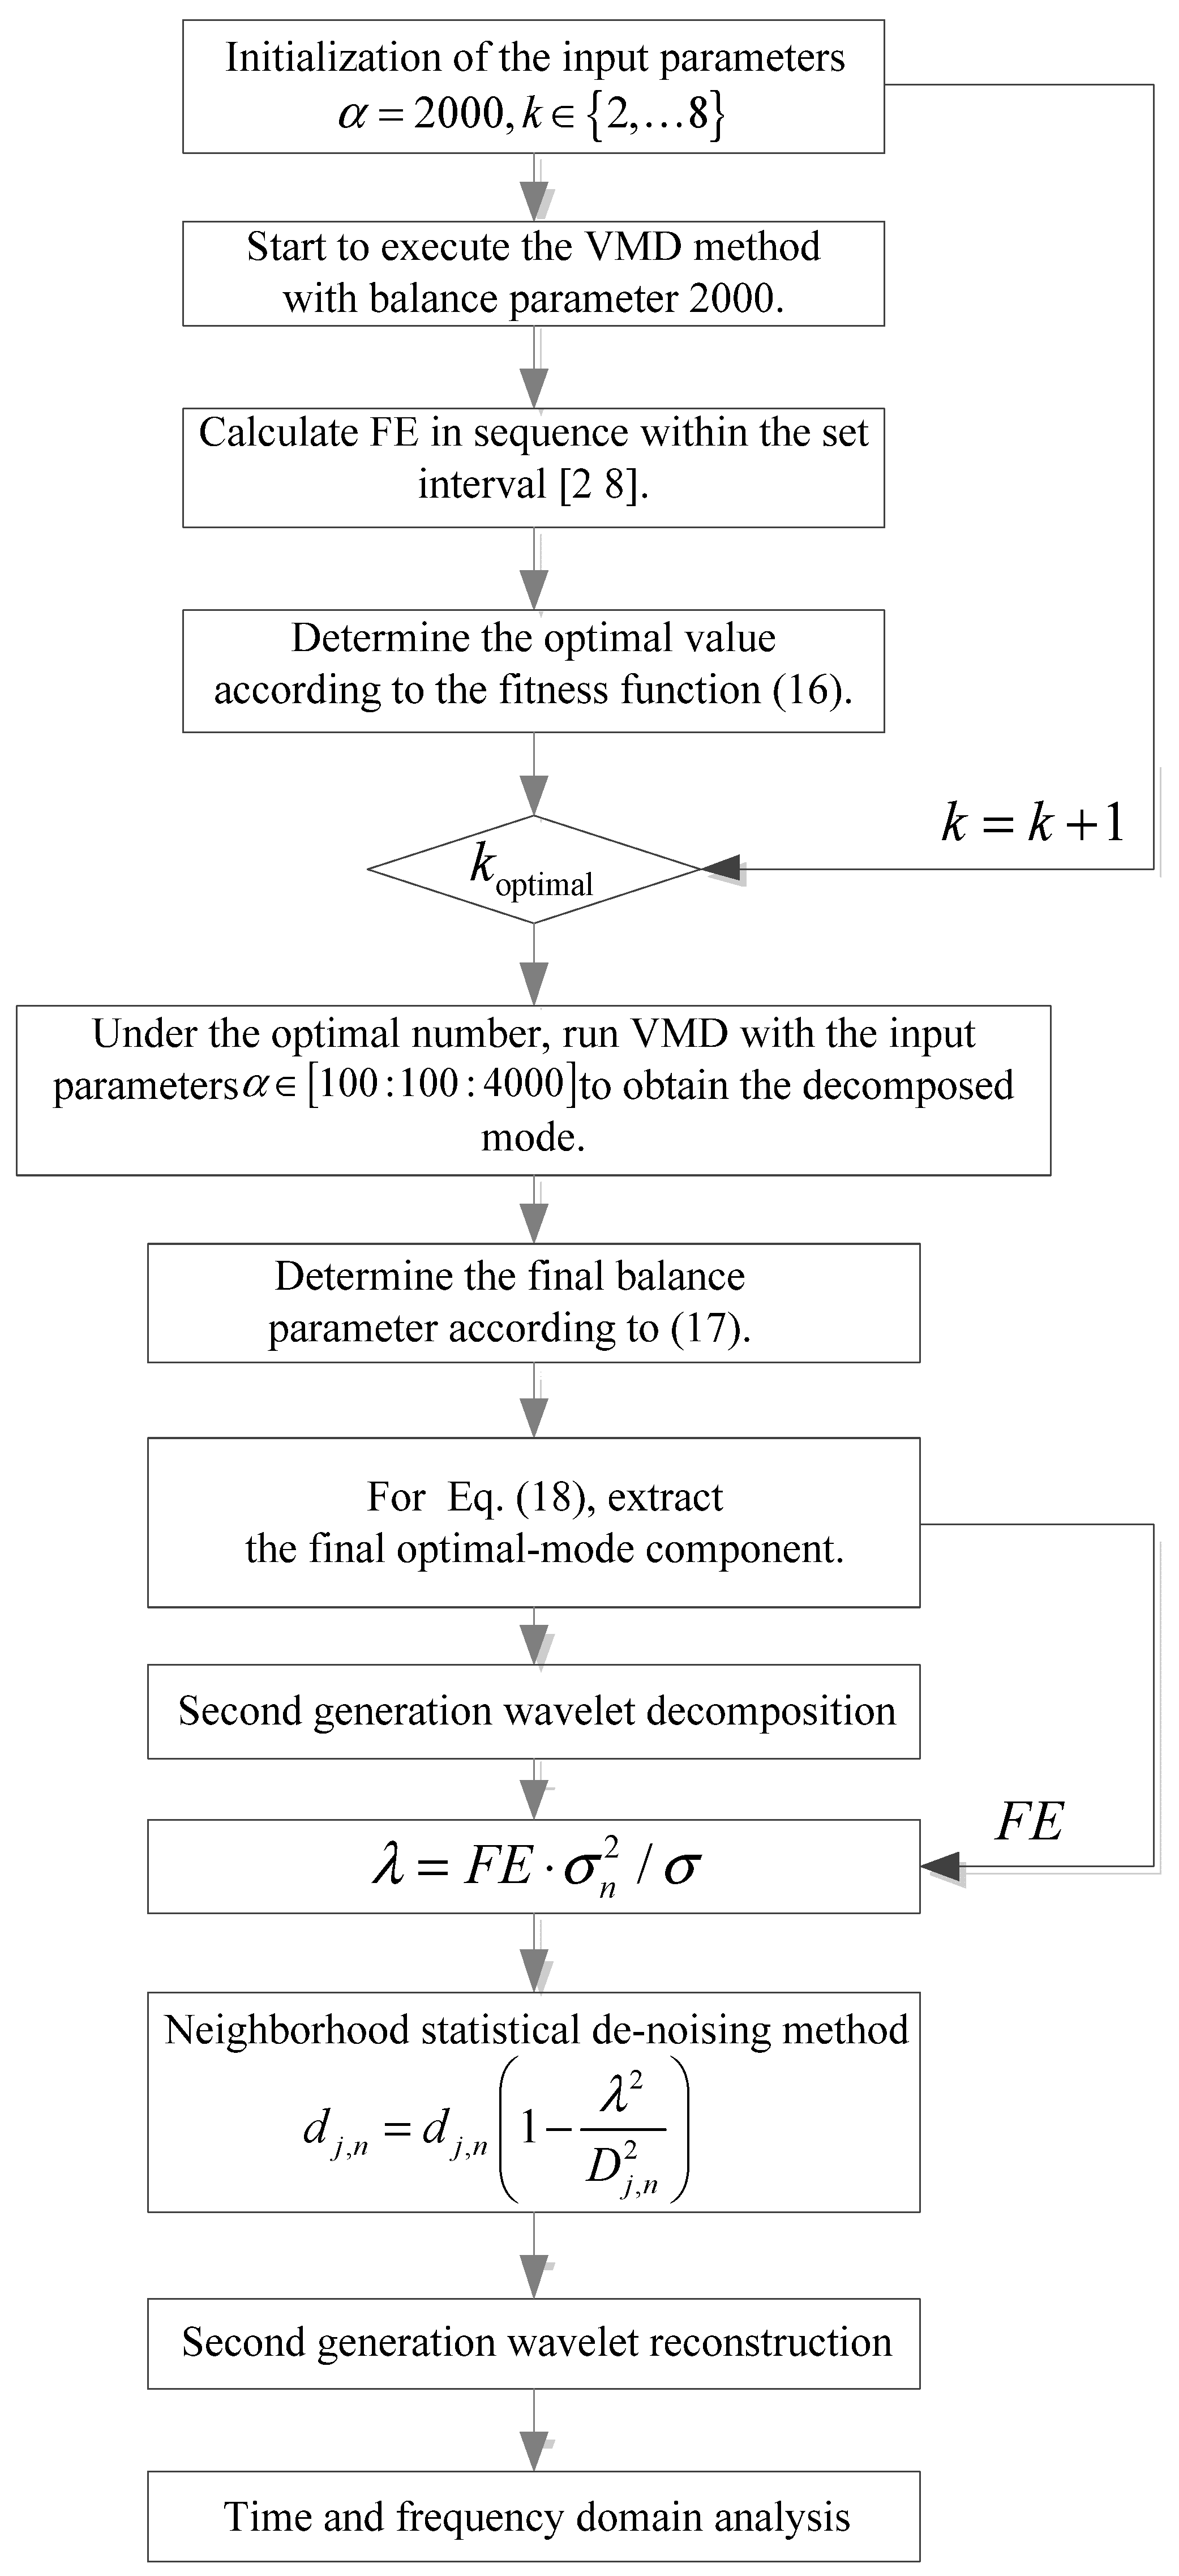
The specific implementation steps of the novel FE-guided VMD are as follows:
Step 1: Initialization of the input parameters. Without loss of generality, the balancing parameter is initialized as the mean value of 2000. The search scope of is determined as .
Step 2: Decompose the signal in sequence using the VMD method. Calculate FE corresponding to each value, respectively.
Step 3: Determine the optimal decomposition number according to Equation (16).
Step 4: Under the optimal , run VMD with the input parameters to obtain the decomposed mode.
Step 5: Search the optimal according to Equation (17). A pair will be chosen as the final optimal and . Then extract the best decomposition mode through Equation (18), and the FE guided-VMD will be used for further analysis.
3. Neighborhood Statistical De-Noising Method
Although the high-frequency modes extracted by the optimal VMD can well eliminate the deterministic interference components, the random and uncertain noises still exist and are generally sparse, oscillatory and smooth. Therefore, the subsequent de-noising strategies must be thoroughly studied to enhance the fault characteristics.
Different from the classical wavelet transform, the SGWT is implemented based on the lifting scheme according to data content [29,30], which is very suitable for mechanical fault diagnosis. Ref. [31] proposed the following threshold scheme for wavelet de-noising. If is less than or equal to , then the wavelet coefficient is set to zero. Otherwise, it is set to
Since the reconstruction of thresholded wavelet coefficients will be based on the true nature of the impulses and local fluctuation details for signals with low SNR, it is necessary to carefully determine from the perspective of statistical data modeling. In reality, many problems in engineering diagnosis can be successfully solved by mathematical statistics. The actual test signal inevitably contains noise, and we hope to recover the useful signal as accurately as possible according to some criteria. The problem can be formulated as:
where , and represent noisy data, true data and noise, respectively.
In Bayesian statistical theory, maximum a posteriori (MAP) estimation is a classical method. MAP estimation is to find the that maximizes the posterior probability density under the condition of given observation data :
When the noise is additive and independent, as in (20), the MAP estimator is given by:
Let , when the noise is Gaussian distribution, the above formula can be expressed as:
where denotes the standard deviation of the noise, which can be approximated using the mean absolute deviation of the values in . It is worth stating that should meet the joint characteristics of sparsity, oscillation and spikes so as to effectively serve the purpose of noise removal and fault-signal preservation. Next, we use the FE to write a new adaptive Laplacian PDF to describe the structure of the fault signal, which can concurrently quantify the noise morphology and extract the periodic sparse components. The PDF of the best failure mode is given by:
Here, stand for the fluctuation entropy of the input signal and denotes the standard deviation of true data. Since the data is independent of noise, the estimate of the noiseless data standard deviation is . In addition, when the square root is imaginary, is set to zero.
Consequently, and the threshold will be:
4. Simulation Experiment
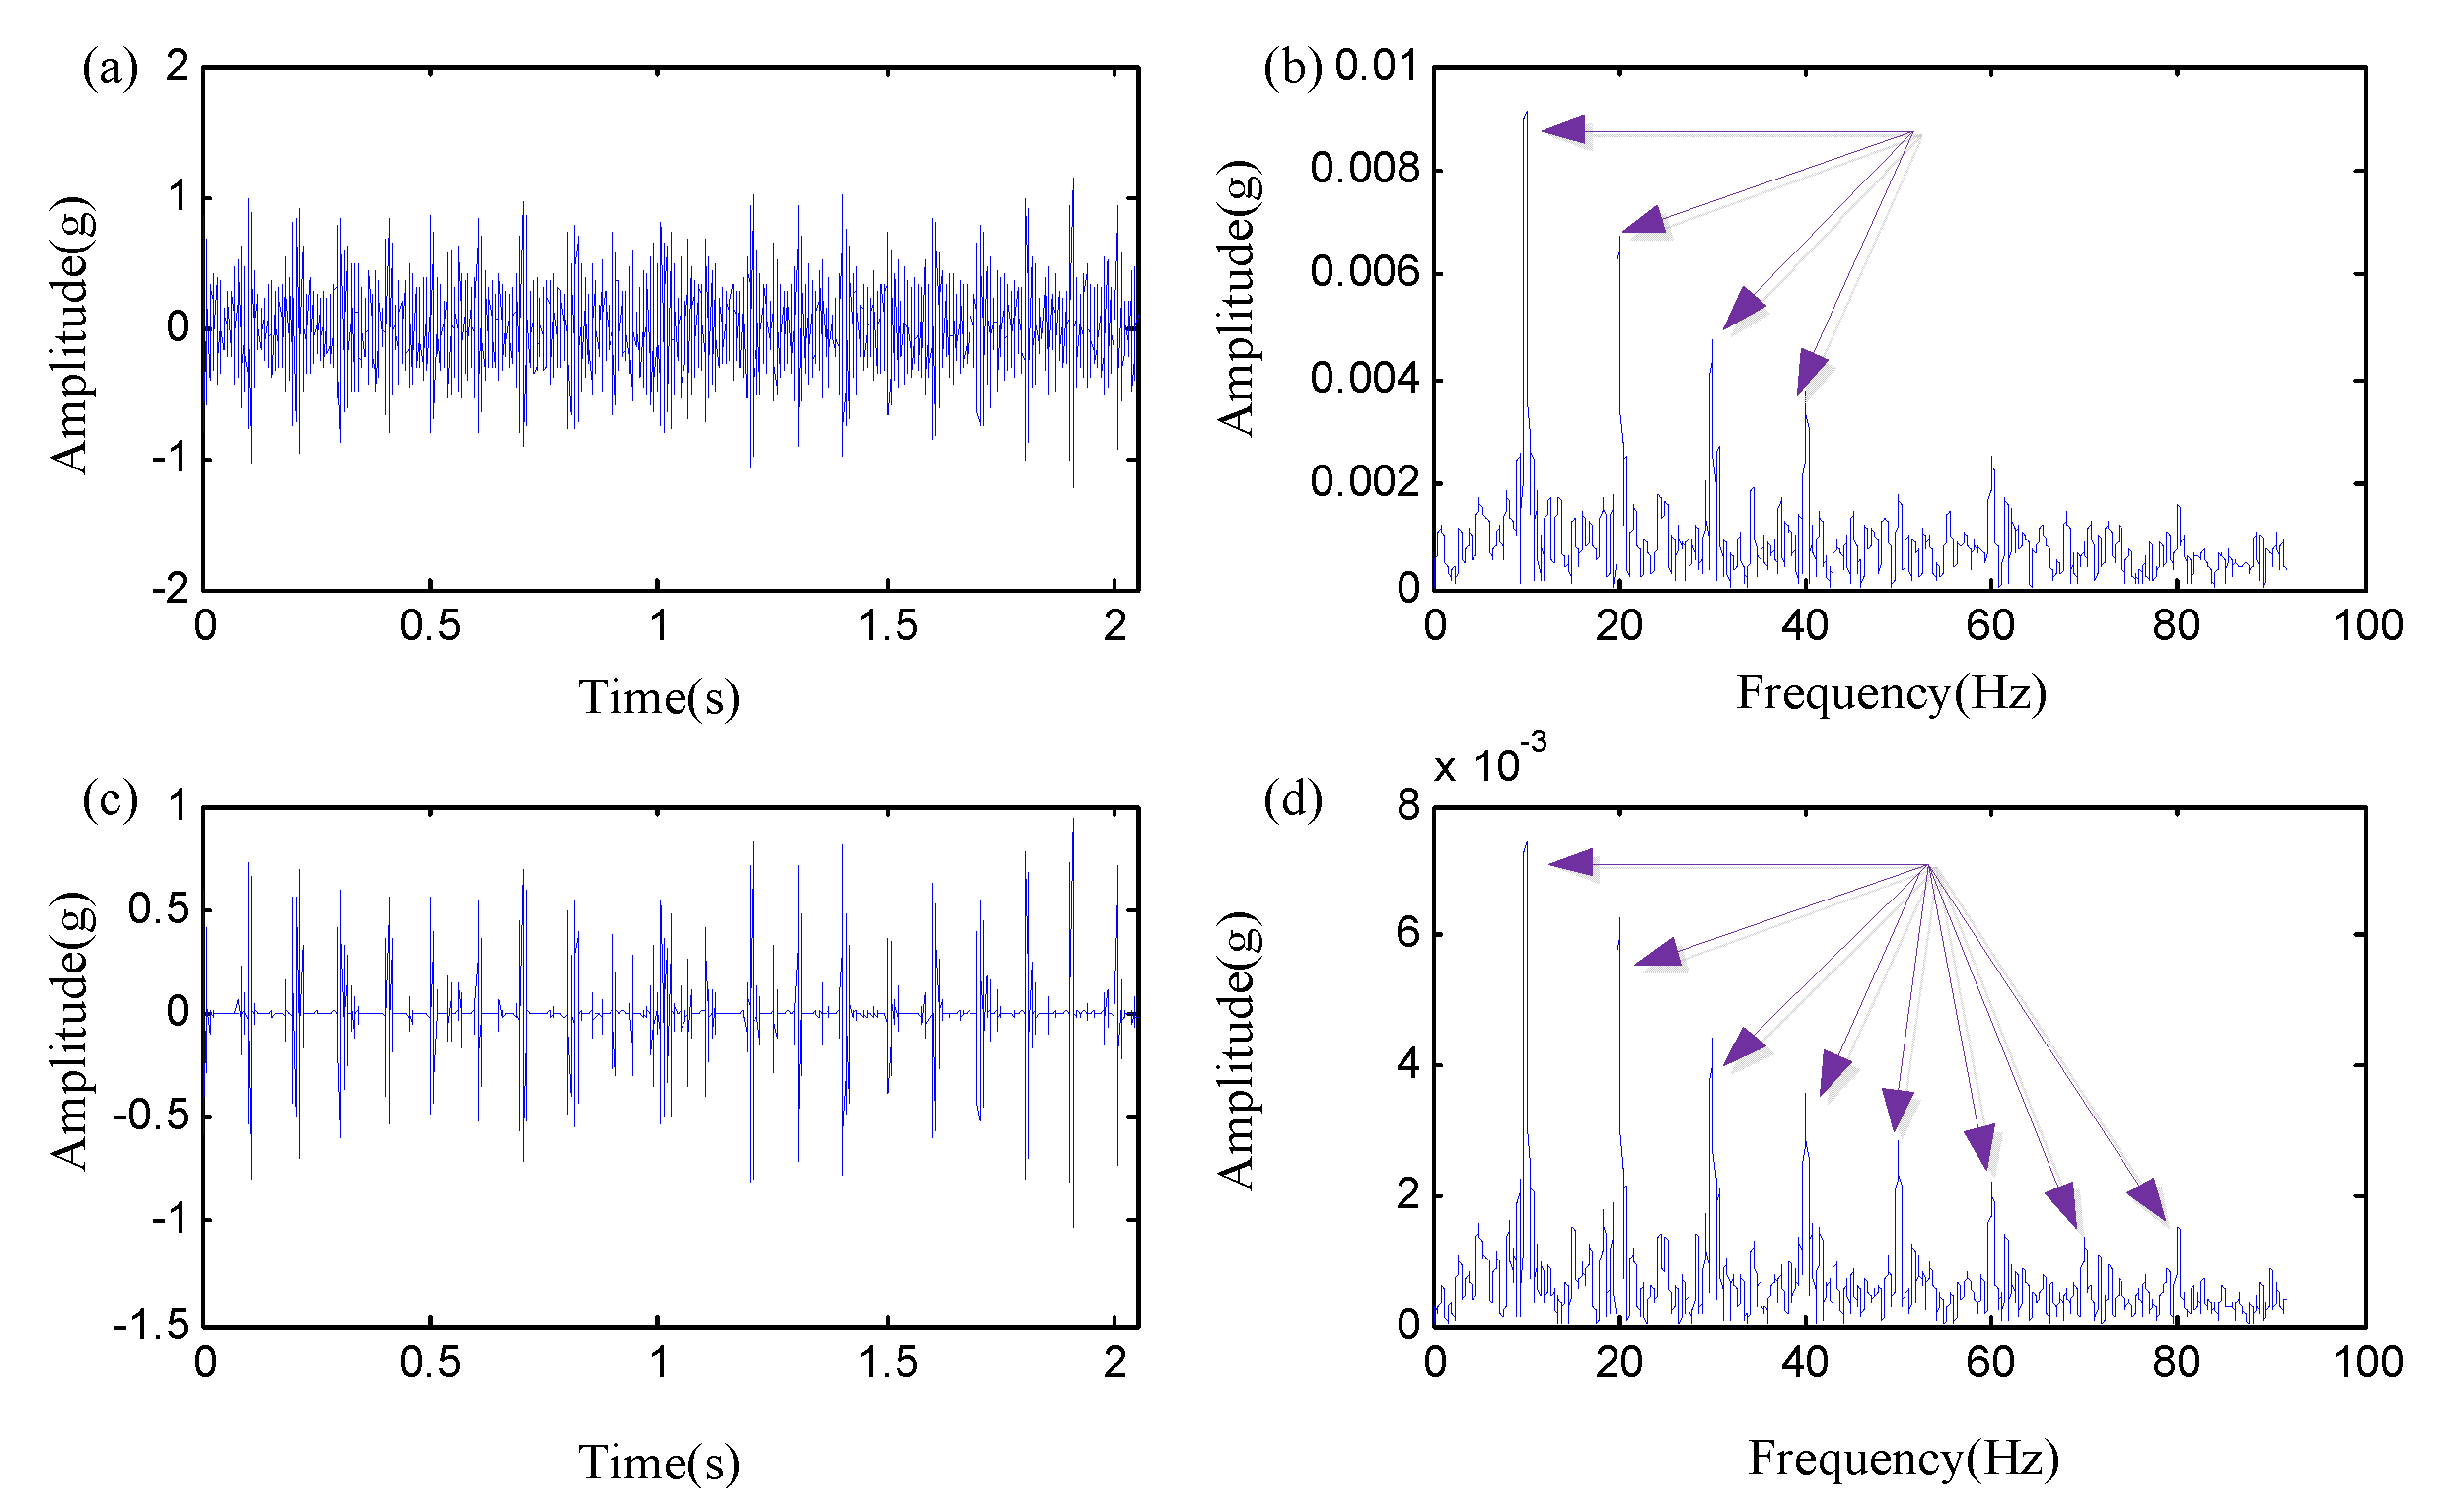
The flow chart of the proposed method is illustrated in Figure 1. In this section, the proposed method will be applied to simulation data, including periodic impulse component, mixed AM-FM component and random noise. The simulated signal can be expressed as:
where = 10 Hz is the impulse interval frequency. and , respectively, represent the amplitude and phase of the impulse signal, and the sampling frequency is set to 2000 Hz.
As the massive implantation of noise interference, the sparseness and characteristic frequency of signal impulse are gradually submerged in the noise and are becoming less observable in Figure 2. After the optimal VMD processing with = 3 and = 500, it retains a large amount of signal amplitude and highlights the periodic impulse waveform, which makes it easier to identify the real impulse in the time domain and frequency domain, as displayed in Figure 3a,b. Although the deterministic interference component is eliminated, the impulse characteristics are still ambiguous due to the serious noise pollution, and the high-order harmonic frequency of the envelope spectrum is partially lost. We further use the NSD method to extract useful signals, and the results are shown in Figure 3c,d. It can be seen that only a few distinguishable fake impulses remain in the de-noising results, and the higher harmonic frequencies of the envelope spectrum are significantly enhanced, which is very valuable for practical engineering diagnosis. For comparison, the same simulation signal is analyzed by Minimum Entropy Deconvolution (MED) methods [32]. The results of MED are shown in Figure 4. Due to the interference of AM-FM and random noise, the periodicity can hardly be observed in the MED-filtered signal, and the characteristic impulse frequencies of the envelope spectrum are also extremely weak.
The above results preliminarily prove the reliability of the proposed method, which also shows that it is feasible to measure fault information from the perspective of impulse fluctuation. From the results, the integrity of the time-domain periodic impulse and envelope spectrum is well reflected. Especially, large noise is added in the simulation experiment, and the impulse is very weak.
5. Bearing Fault Diagnosis
5.1. Case Study
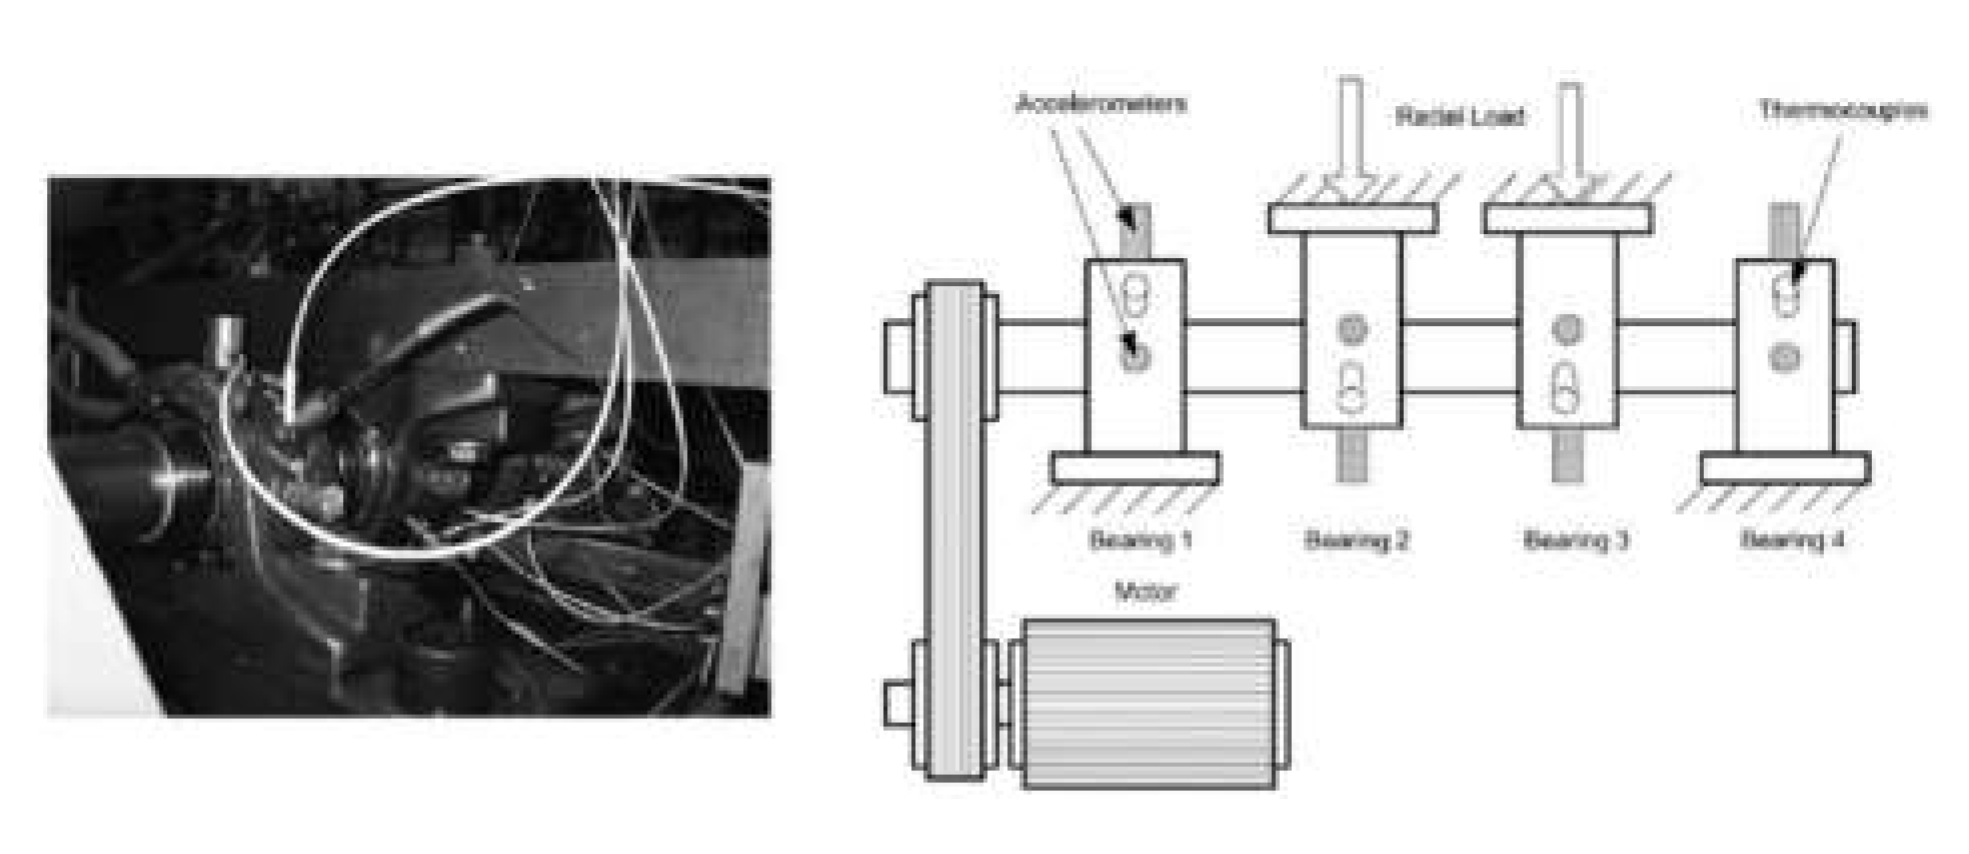
The test signal used in this case comes from the rolling bearing fault test bench (Figure 5) in the intelligent maintenance system (IMS) center [33]. The test bearings were Rexnord za-2115 double-row bearings, and the shaft speed was fixed at 2000 rpm. The radial load applied to the bearing was 26.7 kN. The sampling frequency was 20 KHZ. At the end of the experiment, local defects were found on the outer race of bearing 1, and the characteristic fault frequency of the outer race is fo = 236 Hz.
According to the research results on health monitoring and degradation assessment for the IMS bearing dataset in the literature [34,35], we give the measure values under four different fault conditions in Table 1. These four fault conditions occur at the time points around 5310 min, 6000 min, 6500 min and 7000 min, respectively, representing four increasing fault degrees. It is not difficult to see that FE increases in turn with the increase of fault degree, showing good monotonicity, while PE has poor monotonicity. This clearly proves that FE is very effective in measuring fault information.
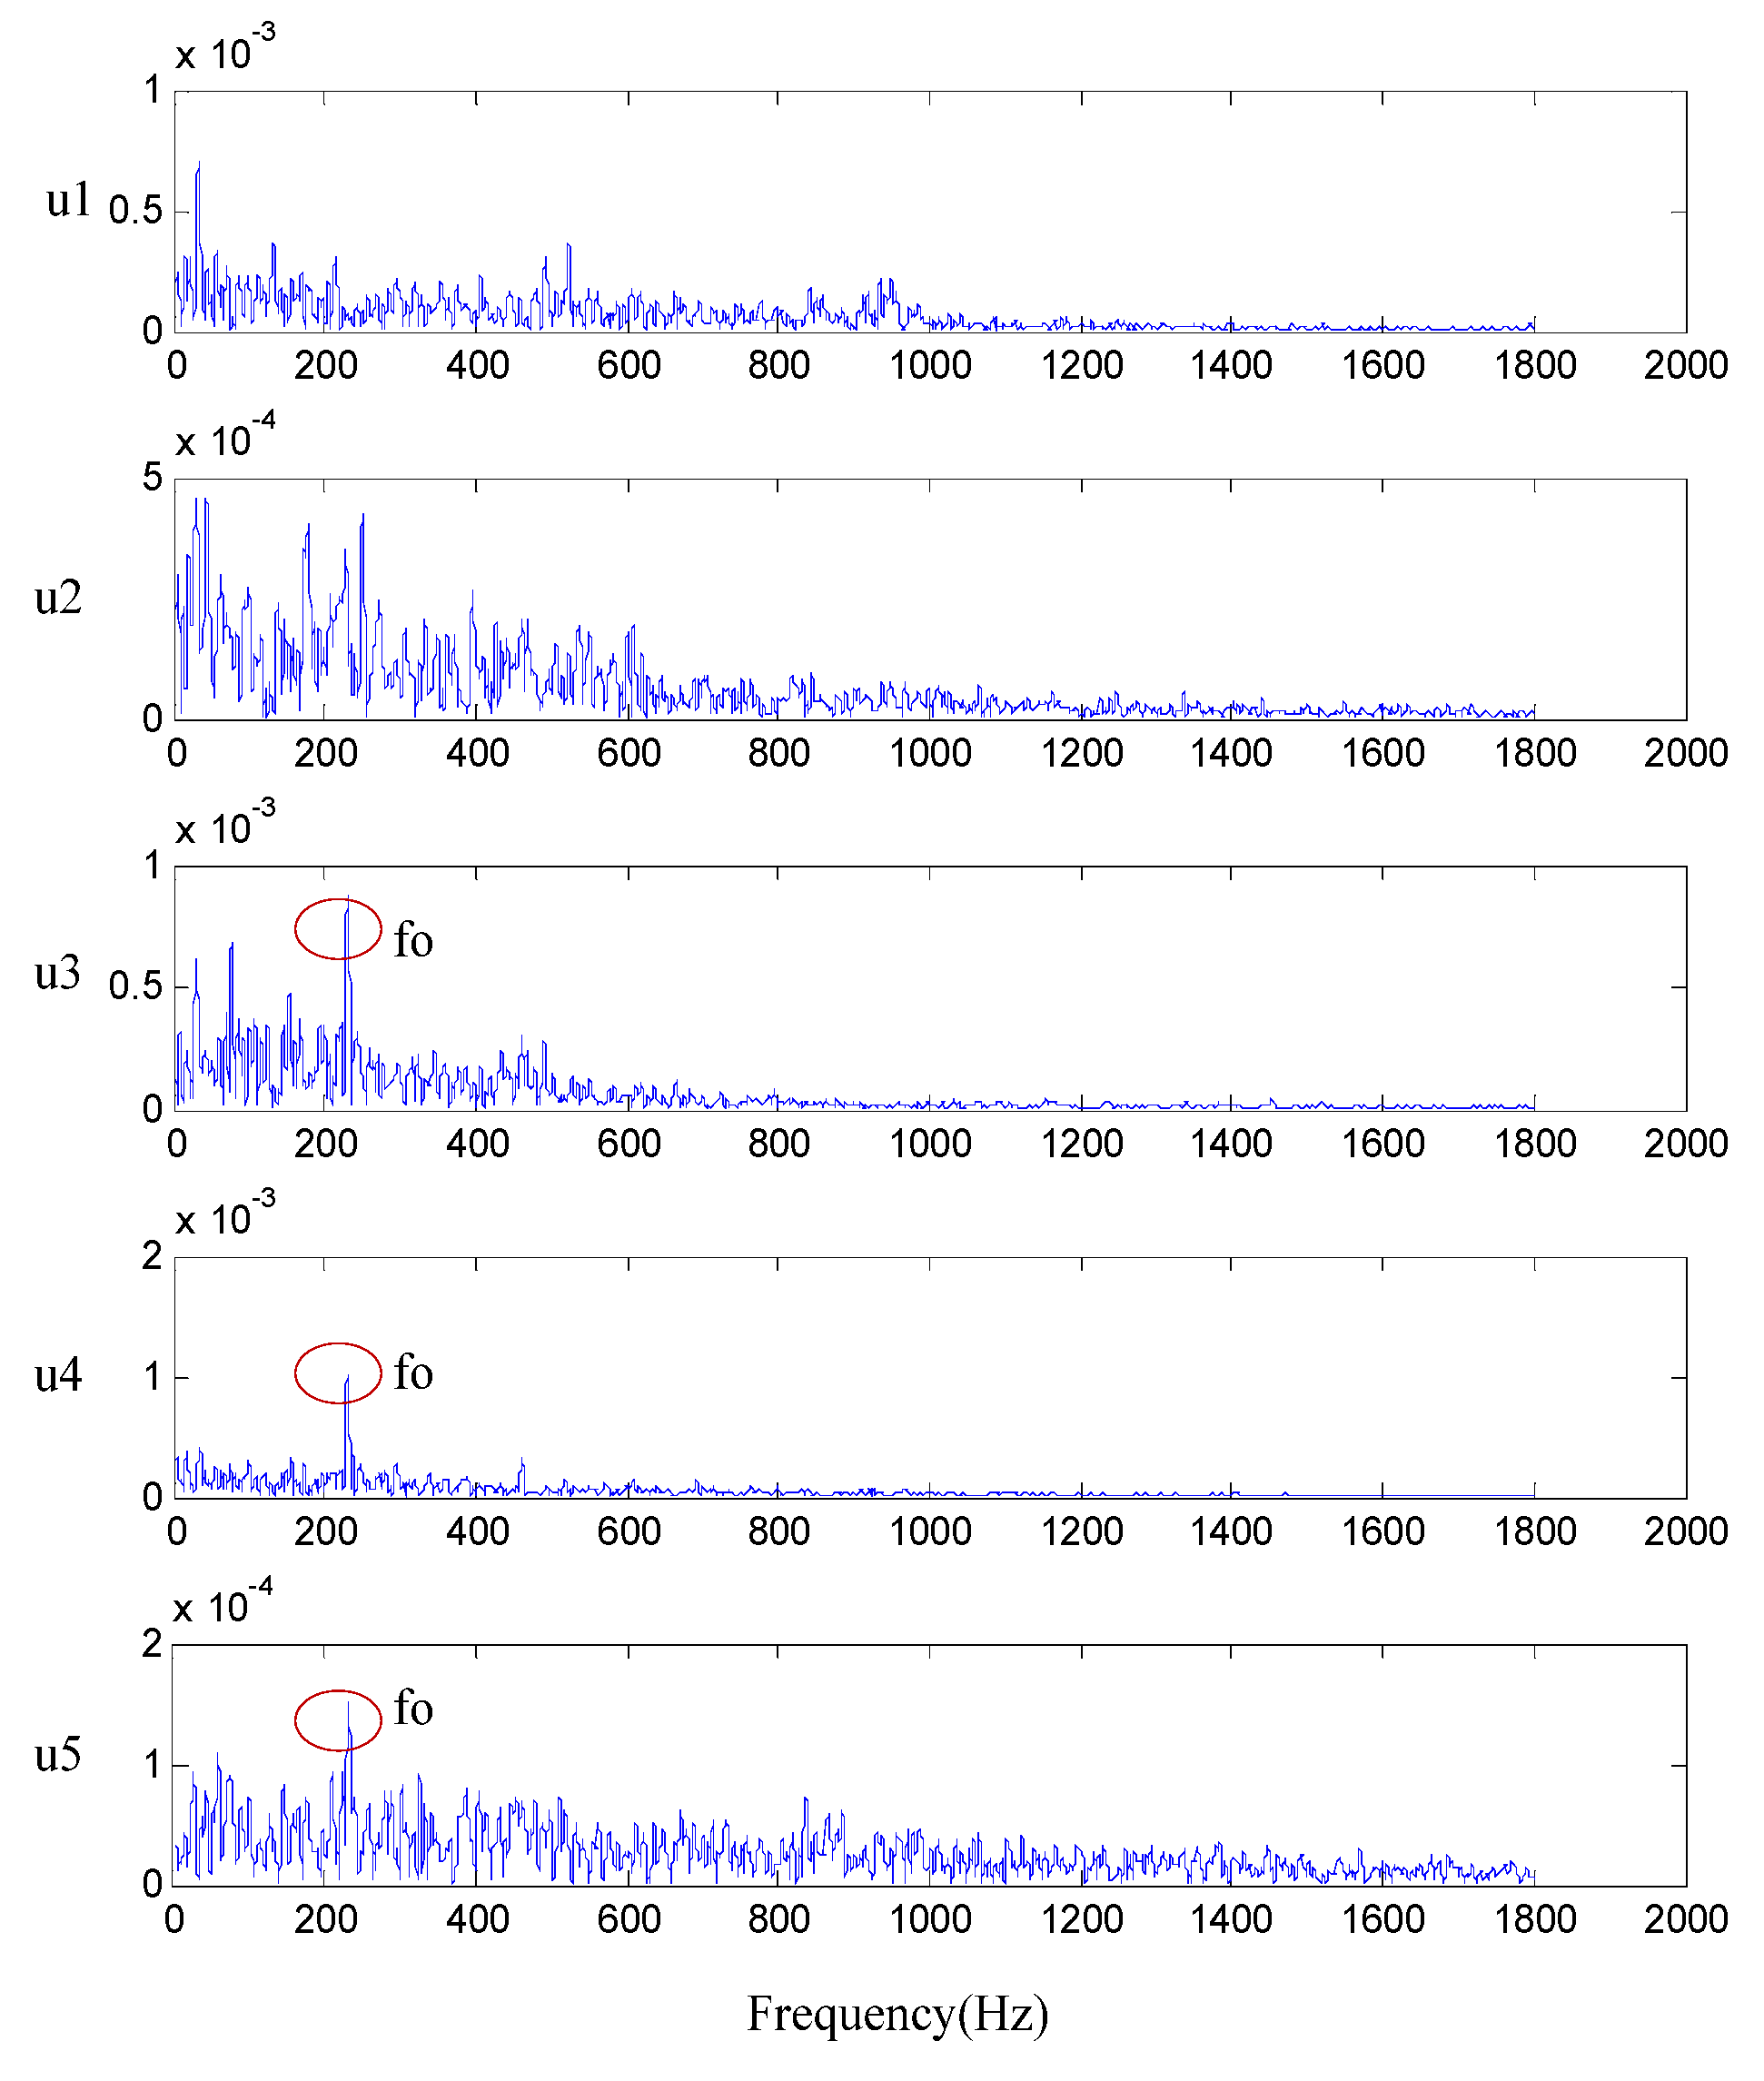
For early fault indication, Figure 6 provides the decomposition result of the original signal using the VMD method for optimal parameters with = 3, = 800. As can be seen, the proposed VMD method successfully extracts the mode components, and the high-frequency mode component (u3) reveals a certain periodic impulse. Applying the NSD-based filtering, the result shown in Figure 7a clearly lets us notice the presence of the fault period (T = 1/236 s) and the significant noise reduction. In contrast, for this kind of sparse smooth signal, the Donoho threshold is very unsatisfactory, as shown in Figure 7b. This is because the Donoho threshold [36,37,38] is often too large in engineering applications and lacks the morphology and statistical rules of bearing fault signals.
In addition, we make a comparative study to specially evaluate the advantages of the optimal VMD method. In the conventional VMD method, the determination of mode number and balance parameter is not considered to maximize the fault information. In this case, the mode number is specified as = 5, and the balance parameter adopts the arbitrary value = 800. Figure 8 shows the corresponding envelope spectrum of traditional VMD decomposition. The first-order fault frequency can be identified through the spectrum, but the amplitude of the fault frequency is smaller than that in Figure 7, and the higher harmonic frequency cannot be clearly observed. Figure 9 shows the analysis results using the fast spectral correlation (FSC) [39]. Although the first-order fault frequency can be observed through the envelope spectrum of the filtered signal, a large number of interference components around the cyclic frequency band make the peak value of the frequency spectrum and the higher harmonics frequency very fuzzy. Therefore, the proposed method exhibit promising superiority for fault information extraction and feature enhancement.
5.2. Engineering Example
The test bench is ABLT-1A bearing fatigue testing machine used by bearing enterprises to ensure product quality, as shown in Figure 10. ABLT-1B can test four bearings at a time, and all four test bearings are 6309 type. The rotating speed of the shaft is 3000 r/min. The acceleration sensor directly contacts the bearing outer race, and the sampling frequency is 48 KHZ. The main parameters of bearing 6309 are a pitch diameter of 72.5 mm, a ball diameter of 17.462 mm and a ball number of eight. According to the structural parameters, the fault frequencies of the inner and outer races can be calculated as: fi = 248.171 HZ and fo = 151.829 HZ.
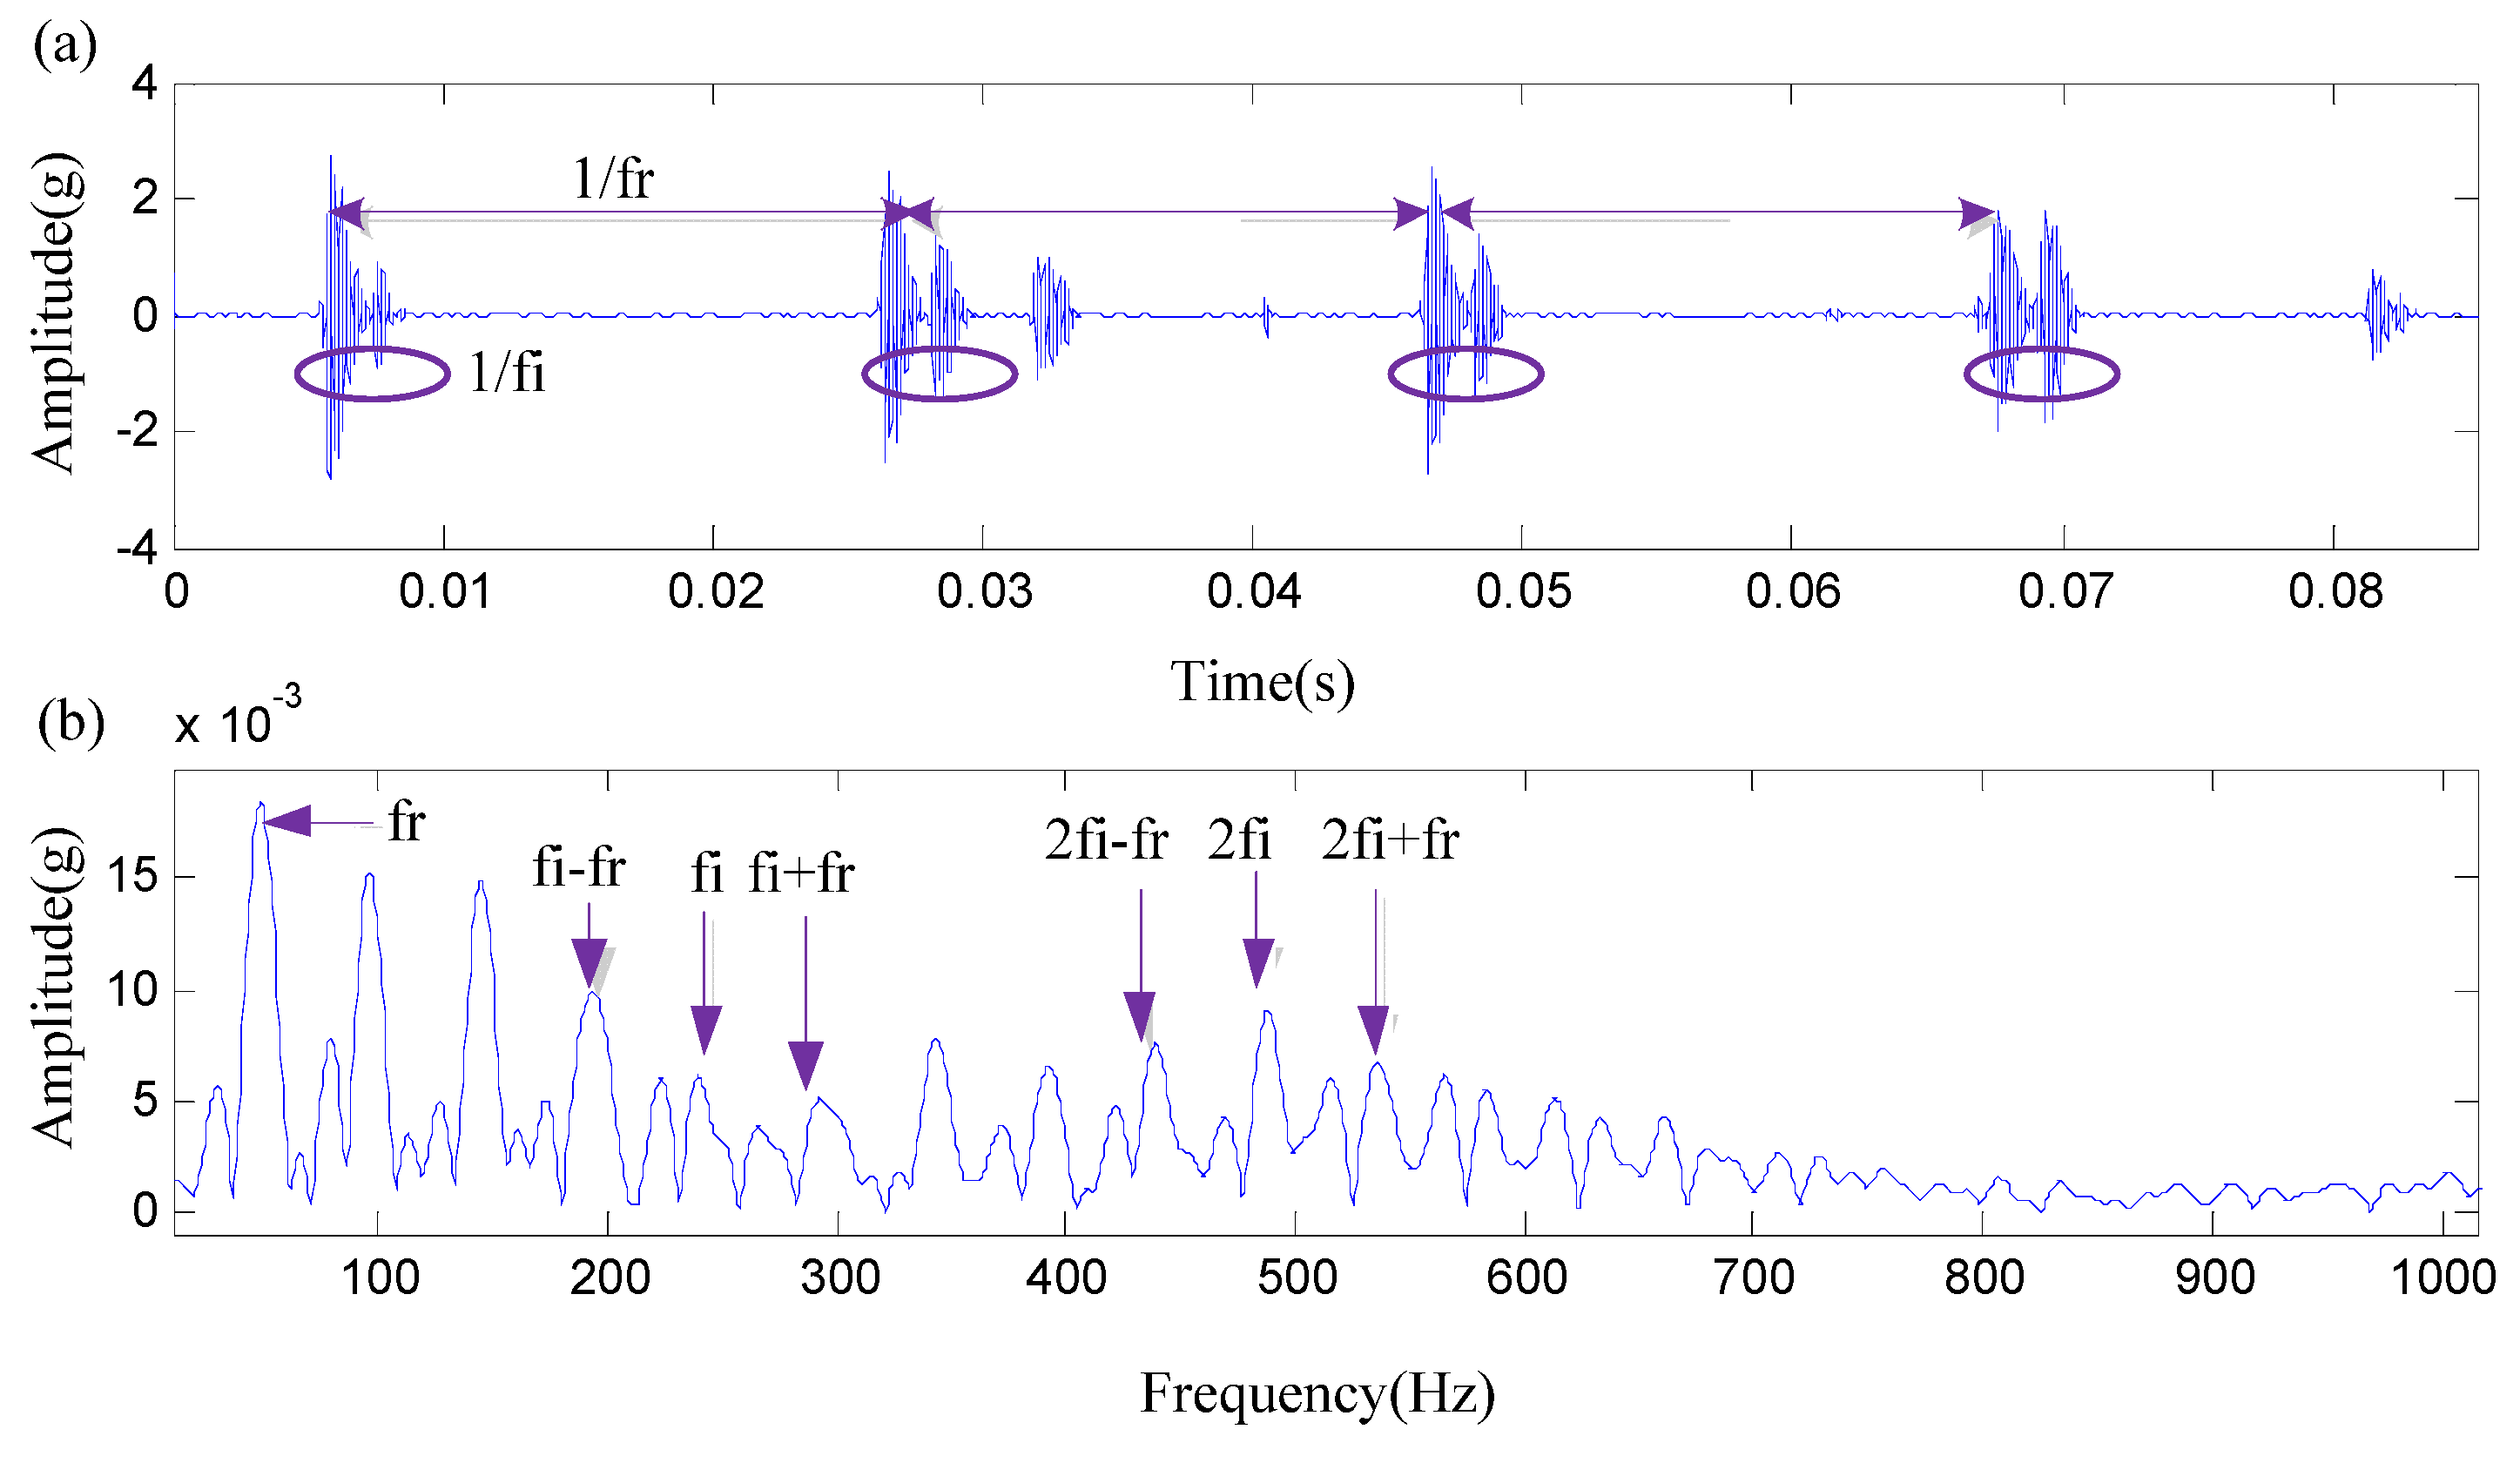
We typically analyze early fault signals during fatigue testing. Due to the vibration superposition effect of multiple bearings and the strong interference generated by a testing machine, it is basically difficult to obtain effective fault information at the early stage of the fault. Then, the proposed method is employed to better the detection result. Figure 11 shows the decomposition results using the parameters with = 6, = 200. The mode u3 calculated by Equation (18) is selected as the sensitive mode to extract fault features. The de-noising signal by NSD and local envelope spectrum is displayed in Figure 12. It can be seen that the de-noising signal is considerably sparse and has a periodic structure in which the fault cycle period of the inner race and modulation components induced by the rotation period is clearly visible on the waveform. It should be pointed out that since the bearing inner race rotates with the shaft, when the inner race fails, the fault frequency fi will be modulated by the rotation frequency fr, and obvious modulation will naturally occur in the envelope spectrum. As shown in Figure 12, this modulation phenomenon is well reflected in the time and frequency domains, thus verifying the reliability and accuracy of the diagnosis results.
Figure 13 shows the results of envelope spectrum analysis and MED processing. It is not difficult to see that the traditional envelope spectrum struggles to display the fault frequency doubling and modulation components. Similarly, MED is also difficult to enhance the fault modulation component, and the frequency amplitude at the frequency multiplication is relatively weak, which is not conducive to fault diagnosis compared with the method proposed in this paper.
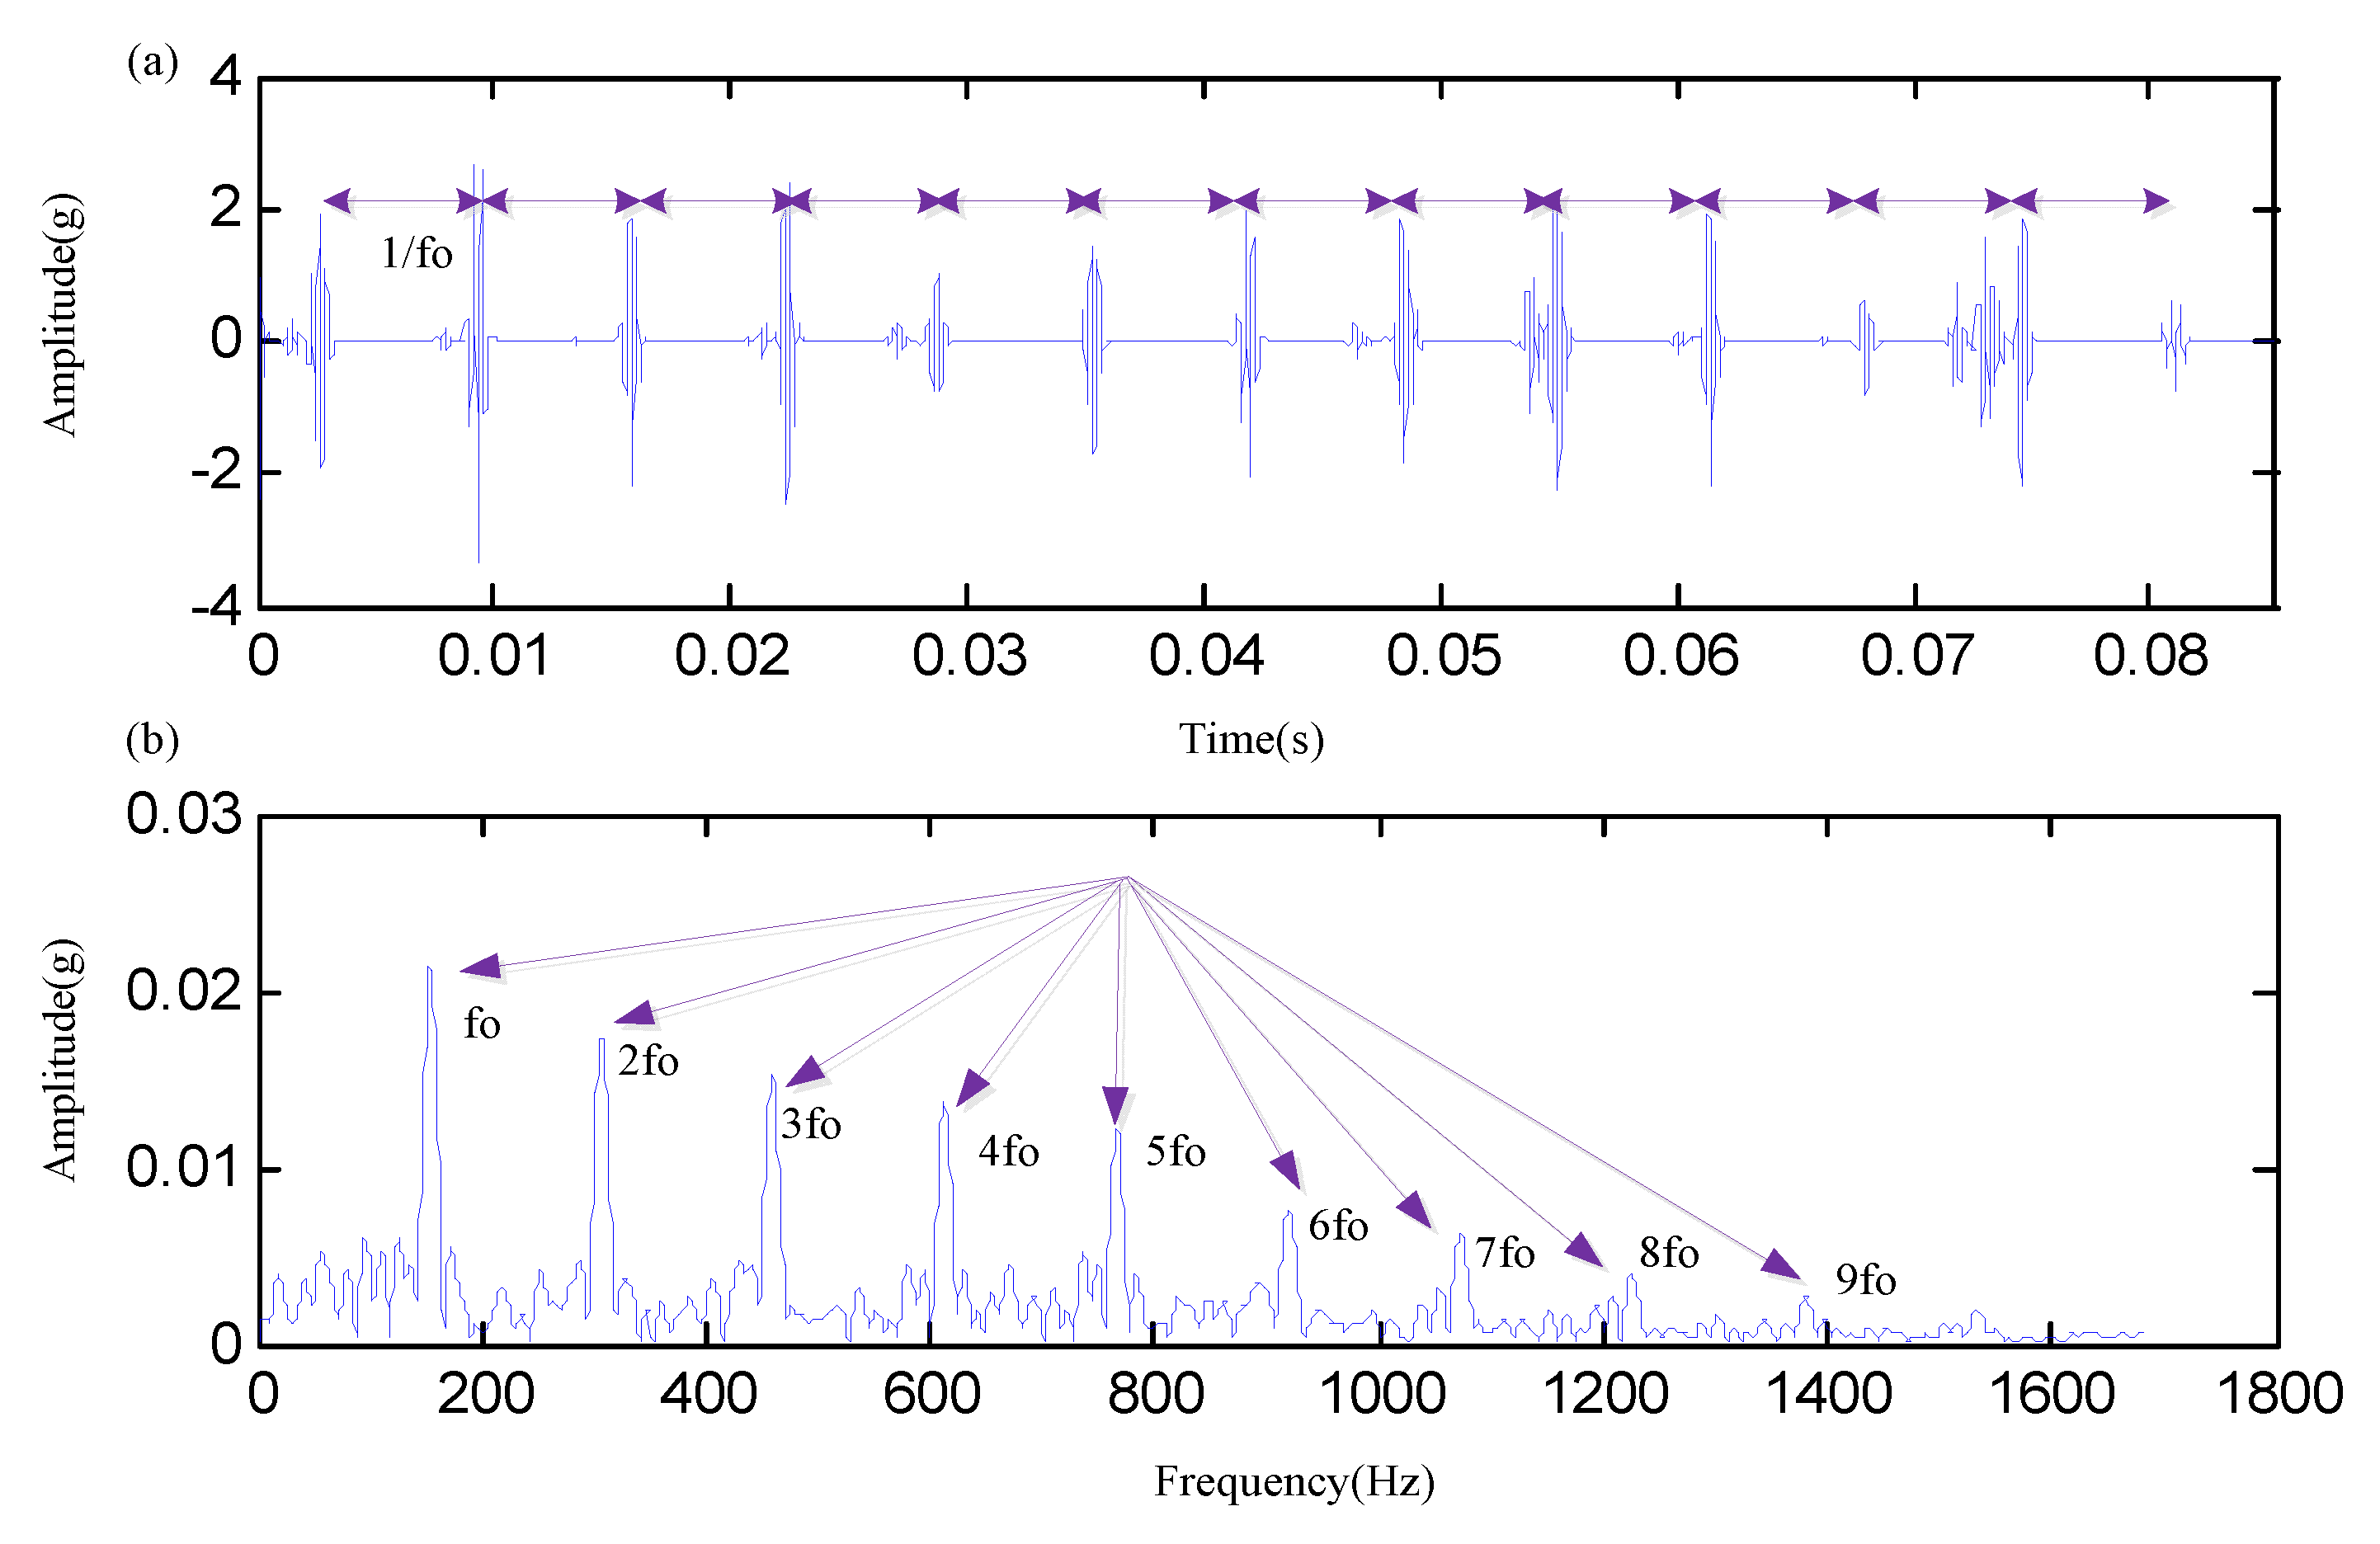
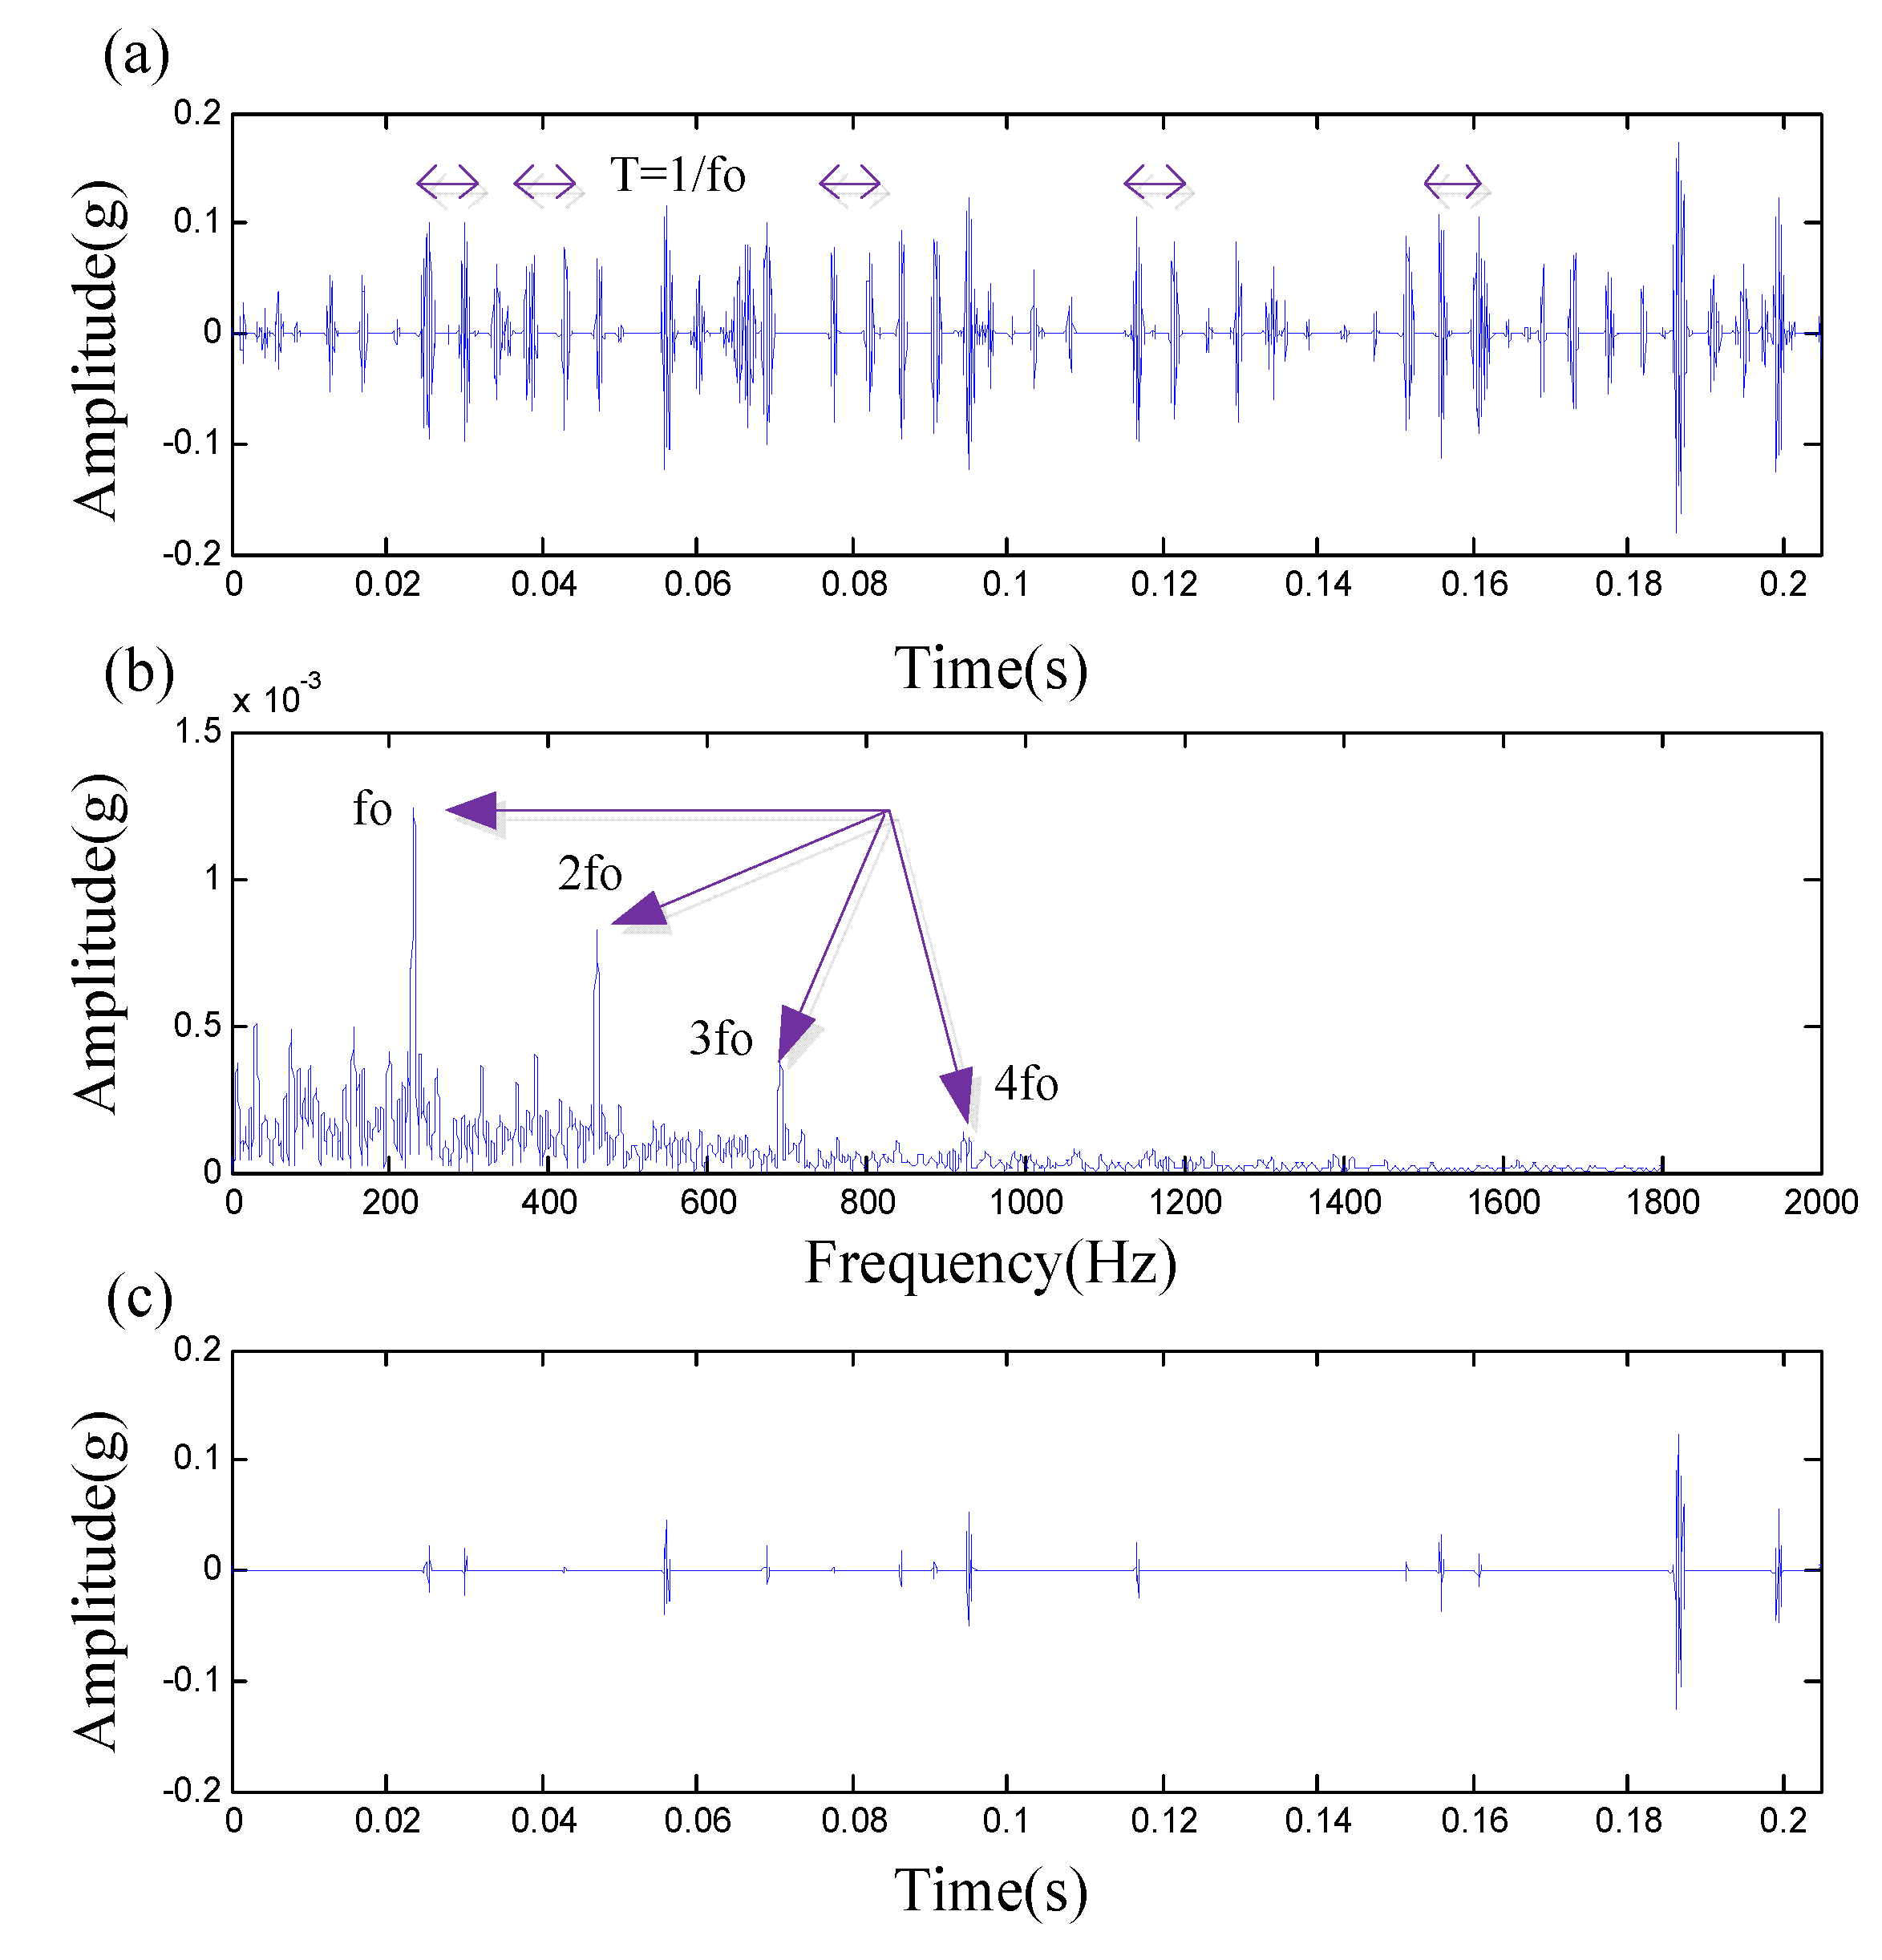
To further verify the engineering practicability, subsequently, the proposed method is applied to analyze another phase of the fatigue test. The optimal VMD decomposition results with = 5, = 300 are displayed in Figure 14. The de-noising mode by the NSD method and its local envelope spectrum is shown in Figure 15. We found the clear periodic impulse signals in Figure 15a with regular intervals, which agree with the theoretical value of the outer race fault. As expected, the fault frequency fo and its harmonic components 2fo, 3fo, 4fo, 5fo, etc., are also clearly displayed in the envelope spectrum, as shown in Figure 15b. Therefore, it can be concluded that there is a local fault in the outer race, which is very consistent with reality. In summary, the above analysis results objectively verify the effectiveness of the proposed method to analyze vibration signals for fault feature extraction and have good engineering application value.
6. Conclusions
The impulsive signal induced by bearing failure always includes transient and fluctuation features. However, the existing work on fluctuation research and application is insufficient. Therefore, this paper reports FE to represent the coexistence of transient and fluctuation inside faulty impulsive signatures and further proposes FE guided-VMD method. Compared with the traditional method, it overcomes the dependence on prior knowledge, such as frequency structure and the disadvantages of existing parameter selection methods, while maximizing the fault information more effectively. Moreover, we also study the noise elimination of the optimal mode and propose a new neighborhood statistical de-noising (NSD) method based on the SGWT. Simulation and practical verification show that this method can be well applied to this kind of sparse oscillation signal de-noising problem.
Author Contributions
Formal analysis, H.Z.; Investigation, X.Y.; Writing—review & editing, H.L. All authors have read and agreed to the published version of the manuscript.
Funding
This work was supported by the Key-Area Research and Development Program of Guangdong Province (grant number 2020B090927002) and the National Natural Science Foundation of China (grant number 51975462), and the project of National Natural Science Funds of Shaanxi Province (grant number 2021JM-017).
Conflicts of Interest
The authors declared no potential conflicts of interest with respect to the research, authorship, and/or publication of this article.
References
- Borghesani, P.; Smith, W.A.; Randall, R.B.; Antoni, J.; El Badaoui, M.; Peng, Z. Bearing signal models and their effect on bearing diagnostics. Mech. Syst. Signal Process. 2022, 174, 109077. [Google Scholar] [CrossRef]
- Abboud, D.; Elbadaoui, M.; Smith, W.A.; Randall, R.B. Advanced bearing diagnostics: A comparative study of two powerful approaches. Mech. Syst. Signal Process. 2019, 114, 604–627. [Google Scholar] [CrossRef]
- Soave, E.; D’Elia, G.; Cocconcelli, M.; Battarra, M. Blind deconvolution criterion based on Fourier–Bessel series expansion for rolling element bearing diagnostics. Mech. Syst. Signal Process. 2022, 169, 108588. [Google Scholar] [CrossRef]
- Berntsen, J.; Brandt, A.; Gryllias, K. Enhanced demodulation band selection based on Operational Modal Analysis (OMA) for bearing diagnostics. Mech. Syst. Signal Process. 2022, 181, 109300. [Google Scholar] [CrossRef]
- Berntsen, J.; Brandt, A. Periodogram ratio based automatic detection and removal of harmonics in time or angle domain. Mech. Syst. Signal Process. 2022, 165, 108310. [Google Scholar] [CrossRef]
- Feng, Z.; Zuo, M.J.; Hao, R.; Chu, F.; Lee, J. Ensemble Empirical Mode Decomposition-Based Teager Energy Spectrum for Bearing Fault Diagnosis. Trans. ASME J. Vib. Acoust. 2013, 135, 031013. [Google Scholar] [CrossRef]
- Samanta, B.; Al-Balushi, K.R. Artificial neural network based fault diagnostics of rolling element bearings using time-domain features. Mech. Syst. Signal Process. 2003, 17, 317–328. [Google Scholar] [CrossRef]
- Gunerkar, R.S.; Jalan, A.K.; Belgamwar, S.U. Fault diagnosis of Rolling Element Bearing based on Artificial Neural Network. J. Mech. Sci. Technol. 2019, 33, 505–511. [Google Scholar] [CrossRef]
- Gunerkar, R.; Jalan, A.K. Classification of Ball Bearing Faults Using Vibro-Acoustic Sensor Data Fusion. Exp. Tech. 2019, 43, 635–643. [Google Scholar] [CrossRef]
- Dragomiretskiy, K.; Zosso, D. Variational Mode Decomposition. IEEE Trans. Signal Process. 2014, 62, 531–544. [Google Scholar] [CrossRef]
- Huang, N.E. The empirical mode decomposition and the Hilbert spectrum for nonlinear and non-stationary time series analysis. Proc. Math. Phys. Eng. Sci. 1998, 454, 903–995. [Google Scholar] [CrossRef]
- Li, Z.; Chen, J.; Zi, Y.; Pan, J. Independence-oriented VMD to identify fault feature for wheel set bearing fault diagnosis of high speed locomotive. Mech. Syst. Signal Process. 2017, 85, 512–529. [Google Scholar] [CrossRef]
- Dibaj, A.; Hassannejad, R.; Ettefagh, M.M.; Ehghaghi, M.B. Incipient fault diagnosis of bearings based on parameter-optimized VMD and envelope spectrum weighted kurtosis index with a new sensitivity assessment threshold. ISA Trans. 2021, 114, 413–433. [Google Scholar] [CrossRef]
- Li, J.; Yao, X.; Wang, H.; Zhang, J. Periodic impulses extraction based on improved adaptive VMD and sparse code shrinkage denoising and its application in rotating machinery fault diagnosis. Mech. Syst. Signal Process. 2019, 126, 568–589. [Google Scholar] [CrossRef]
- Zhang, X.; Miao, Q.; Zhang, H.; Wang, L. A parameter-adaptive VMD method based on grasshopper optimization algorithm to analyze vibration signals from rotating machinery. Mech. Syst. Signal Process. 2018, 108, 58–72. [Google Scholar] [CrossRef]
- He, X.; Zhou, X.; Yu, W.; Hou, Y.; Mechefske, C.K. Adaptive variational mode decomposition and its application to multi-fault detection using mechanical vibration signals. ISA Trans. 2020, 111, 360–375. [Google Scholar] [CrossRef]
- Jiang, X.; Wang, J.; Shi, J.; Shen, C.; Huang, W.; Zhu, Z. A coarse-to-fine decomposing strategy of VMD for extraction of weak repetitive transients in fault diagnosis of rotating machines. Mech. Syst. Signal Process. 2019, 116, 668–692. [Google Scholar] [CrossRef]
- Jiang, X.; Shen, C.; Shi, J.; Zhu, Z. Initial center frequency-guided VMD for fault diagnosis of rotating machines. J. Sound Vib. 2018, 435, 36–55. [Google Scholar] [CrossRef]
- Li, J.; Cheng, X.; Li, Q.; Meng, Z. Adaptive energy-constrained variational mode decomposition based on spectrum segmentation and its application in fault detection of rolling bearing. Signal Process. 2021, 183, 108025. [Google Scholar] [CrossRef]
- Miao, Y.; Zhao, M.; Yi, Y.; Lin, J. Application of sparsity-oriented VMD for gearbox fault diagnosis based on built-in encoder information. ISA Trans. 2020, 99, 496–504. [Google Scholar] [CrossRef]
- Kumar, A.; Gandhi, C.P.; Vashishtha, G.; Kundu, P.; Tang, H.; Glowacz, A. VMD based trigonometric entropy measure: A simple and effective tool for dynamic degradation monitoring of rolling element bearing. Meas. Sci. Technol. 2022, 33, 014005. [Google Scholar] [CrossRef]
- Lu, N.; Zhou, T.X.; Wei, J.F.; Yuan, W.L.; Li, R.Q.; Li, M.L. Application of a whale optimized variational mode decomposition method based on envelope sample entropy in the fault diagnosis of rotating machinery. Meas. Sci. Technol. 2022, 33, 015014. [Google Scholar] [CrossRef]
- Ni, Q.; Ji, J.C.; Feng, K.; Halkon, B. A fault information-guided variational mode decomposition (FIVMD) method for rolling element bearings diagnosis. Mech. Syst. Signal Process. 2022, 164, 108216. [Google Scholar] [CrossRef]
- Zhao, Y.; Li, C.; Fu, W.; Liu, J.; Yu, T.; Chen, H. A modified variational mode decomposition method based on envelope nesting and multi-criteria evaluation. J. Sound Vib. 2019, 468, 115099. [Google Scholar] [CrossRef]
- Lian, J.; Liu, Z.; Wang, H.; Dong, X. Adaptive variational mode decomposition method for signal processing based on mode characteristic. Mech. Syst. Signal Process. 2018, 107, 53–77. [Google Scholar] [CrossRef]
- Pang, B.; Nazari, M.; Tang, G. Recursive variational mode extraction and its application in rolling bearing fault diagnosis. Mech. Syst. Signal Process. 2022, 165, 108321. [Google Scholar] [CrossRef]
- Takens, F. Detecting Strange Attracotrs in Turbulence. In Dynanical Systems and Turbulence, Warwick; Springer: Berlin/Heidelberg, Germany, 1981; p. 366. [Google Scholar]
- Rostaghi, M.; Azami, H. Dispersion Entropy: A Measure for Time-Series Analysis. IEEE Signal Process. Lett. 2016, 23, 610–614. [Google Scholar] [CrossRef]
- Sweldens, W. The lifting scheme: A construction of second generation wavelets. SIAM J. Math. Anal. 1998, 29, 511–546. [Google Scholar] [CrossRef] [Green Version]
- Claypoole, R.L.; Baraniuk, R.G.; Nowak, R.D. Adaptive wavelet transforms via lifting. ICASSP IEEE Int. Conf. Acoust. Speech Signal Process. Proc. 1998, 3, 1513–1516. [Google Scholar]
- Cai, T.T.; Silverman, B.W. Incorporating information on Neighbouring Coefficients into wavelet estimation. Indian J. Stat. 2011, 63, 127–148. [Google Scholar]
- Sawalhi, N.; Randall, R.B.; Endo, H. The enhancement of fault detection and diagnosis in rolling element bearings using minimum entropy deconvolution combined with spectral kurtosis. Mech. Syst. Signal Process. 2007, 21, 2616–2633. [Google Scholar] [CrossRef]
- Lee, J.; Qiu, H.; Yu, G.; Lin, J. Rexnord Technical Services: Bearing Data Set, IMS, University of Cincinnati, NASA Ames Prognostics Data Repository; NASA Ames: Moffett Field, CA, USA, 2007.
- Qiu, H.; Lee, J.; Lin, J.; Yu, G. Wavelet Filter-based Weak Signature Detection Method and its Application on Roller Bearing Prognostics. J. Sound Vib. 2006, 289, 1066–1090. [Google Scholar] [CrossRef]
- López, C.; Wang, D.; Naranjo, Á.; Moore, K.J. Box-cox-sparse-measures-based blind filtering: Understanding the difference between the maximum kurtosis deconvolution and the minimum entropy deconvolution. Mech. Syst. Signal Process. 2022, 165, 108376. [Google Scholar] [CrossRef]
- Donoho, D.L.; Johnstone, J.M. Ideal spatial adaptation by wavelet shrinkage. Biometrika 1994, 81, 425–455. [Google Scholar] [CrossRef]
- Donoho, D.L.; Johnstone, I.M. Adapting to unknown smoothness via wavelet shrinkage. J. Am. Stat. Assoc. 1995, 90, 1200–1224. [Google Scholar] [CrossRef]
- Donoho, D.L. De-Noising by Soft-Thresholding. IEEE Trans. Inf. Theory 1995, 41, 613–627. [Google Scholar] [CrossRef] [Green Version]
- Borghesani, P.; Antoni, J. A faster algorithm for the calculation of the fast spectral correlation. Mech. Syst. Signal Process. 2018, 111, 113–118. [Google Scholar] [CrossRef]
Figure 1.
Flow chart of the proposed method.

Figure 2.
Simulation signal. (a) Impulse component. (b) Envelope spectrum of impulse component. (c) Synthetic signal. (d) Envelope spectrum of the synthetic signal.
Figure 2.
Simulation signal. (a) Impulse component. (b) Envelope spectrum of impulse component. (c) Synthetic signal. (d) Envelope spectrum of the synthetic signal.
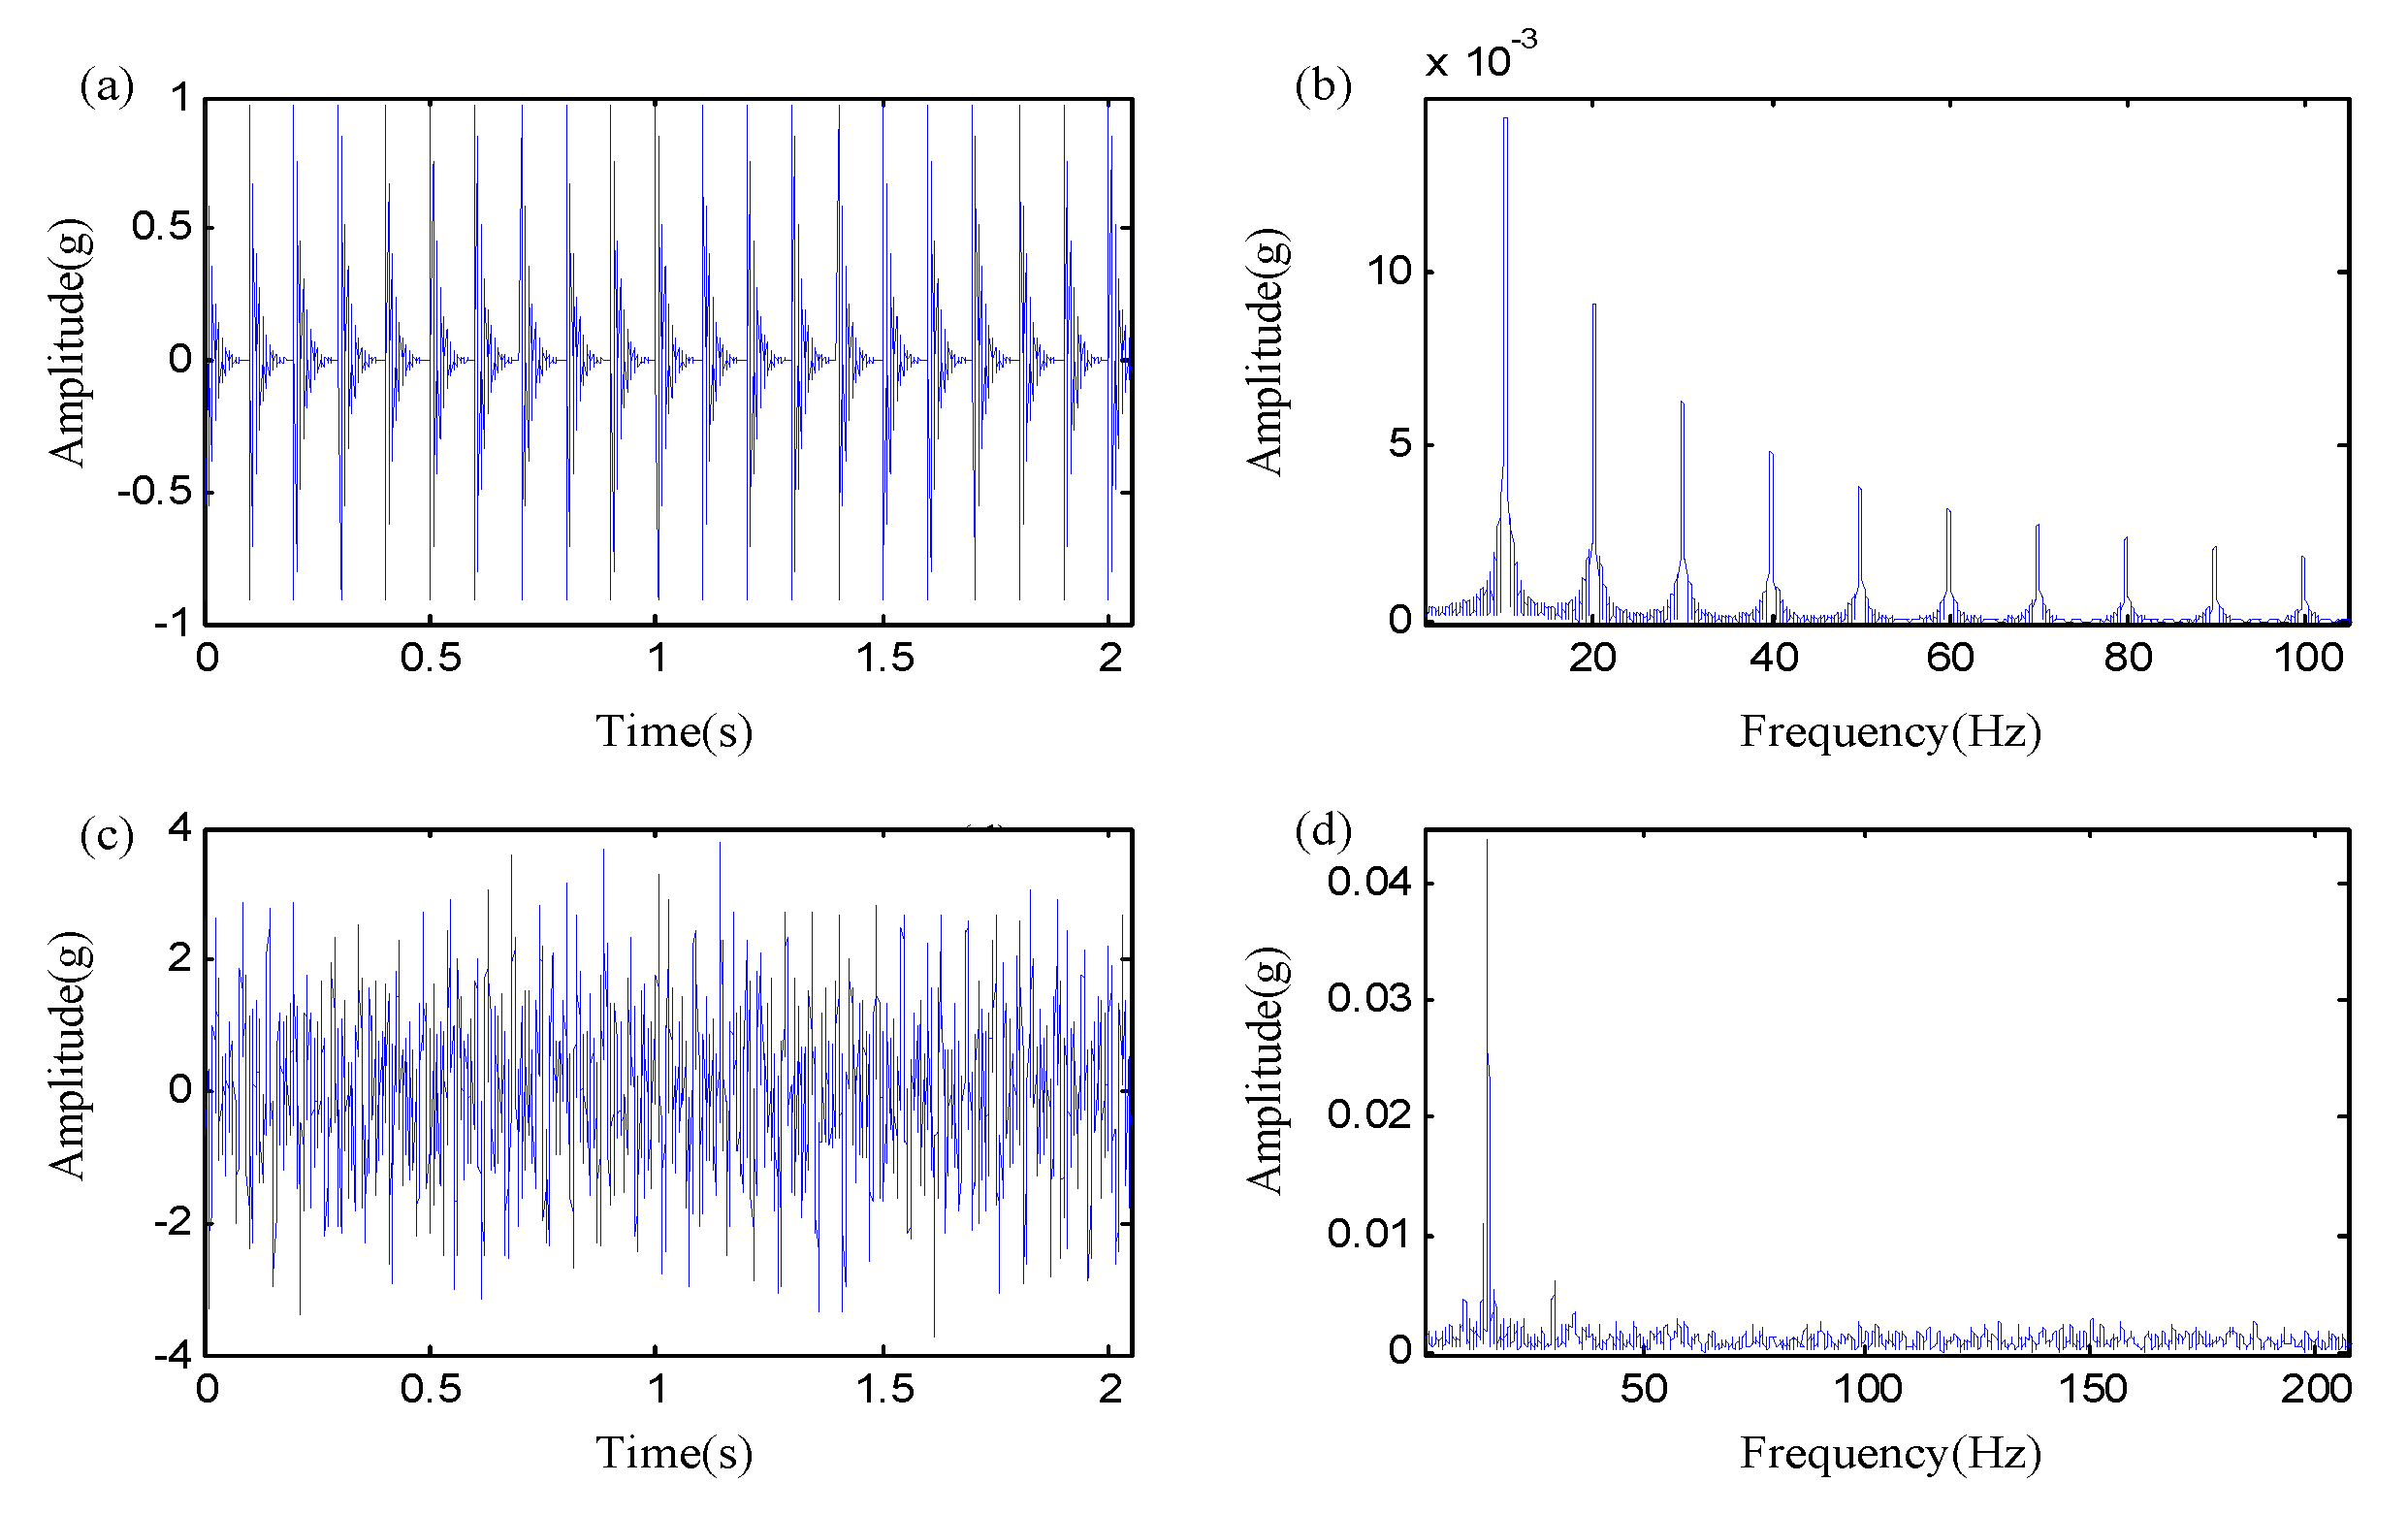
Figure 3.
(a) Extracted feature signal by optimal VMD. (b) Envelope spectrum of extracted feature signal. (c) De-noising signal. (d) Envelope spectrum of the de-noising signal.
Figure 3.
(a) Extracted feature signal by optimal VMD. (b) Envelope spectrum of extracted feature signal. (c) De-noising signal. (d) Envelope spectrum of the de-noising signal.
Figure 4.
Filtering results of MED. (a) Time domain signal. (b) Envelope spectrum.
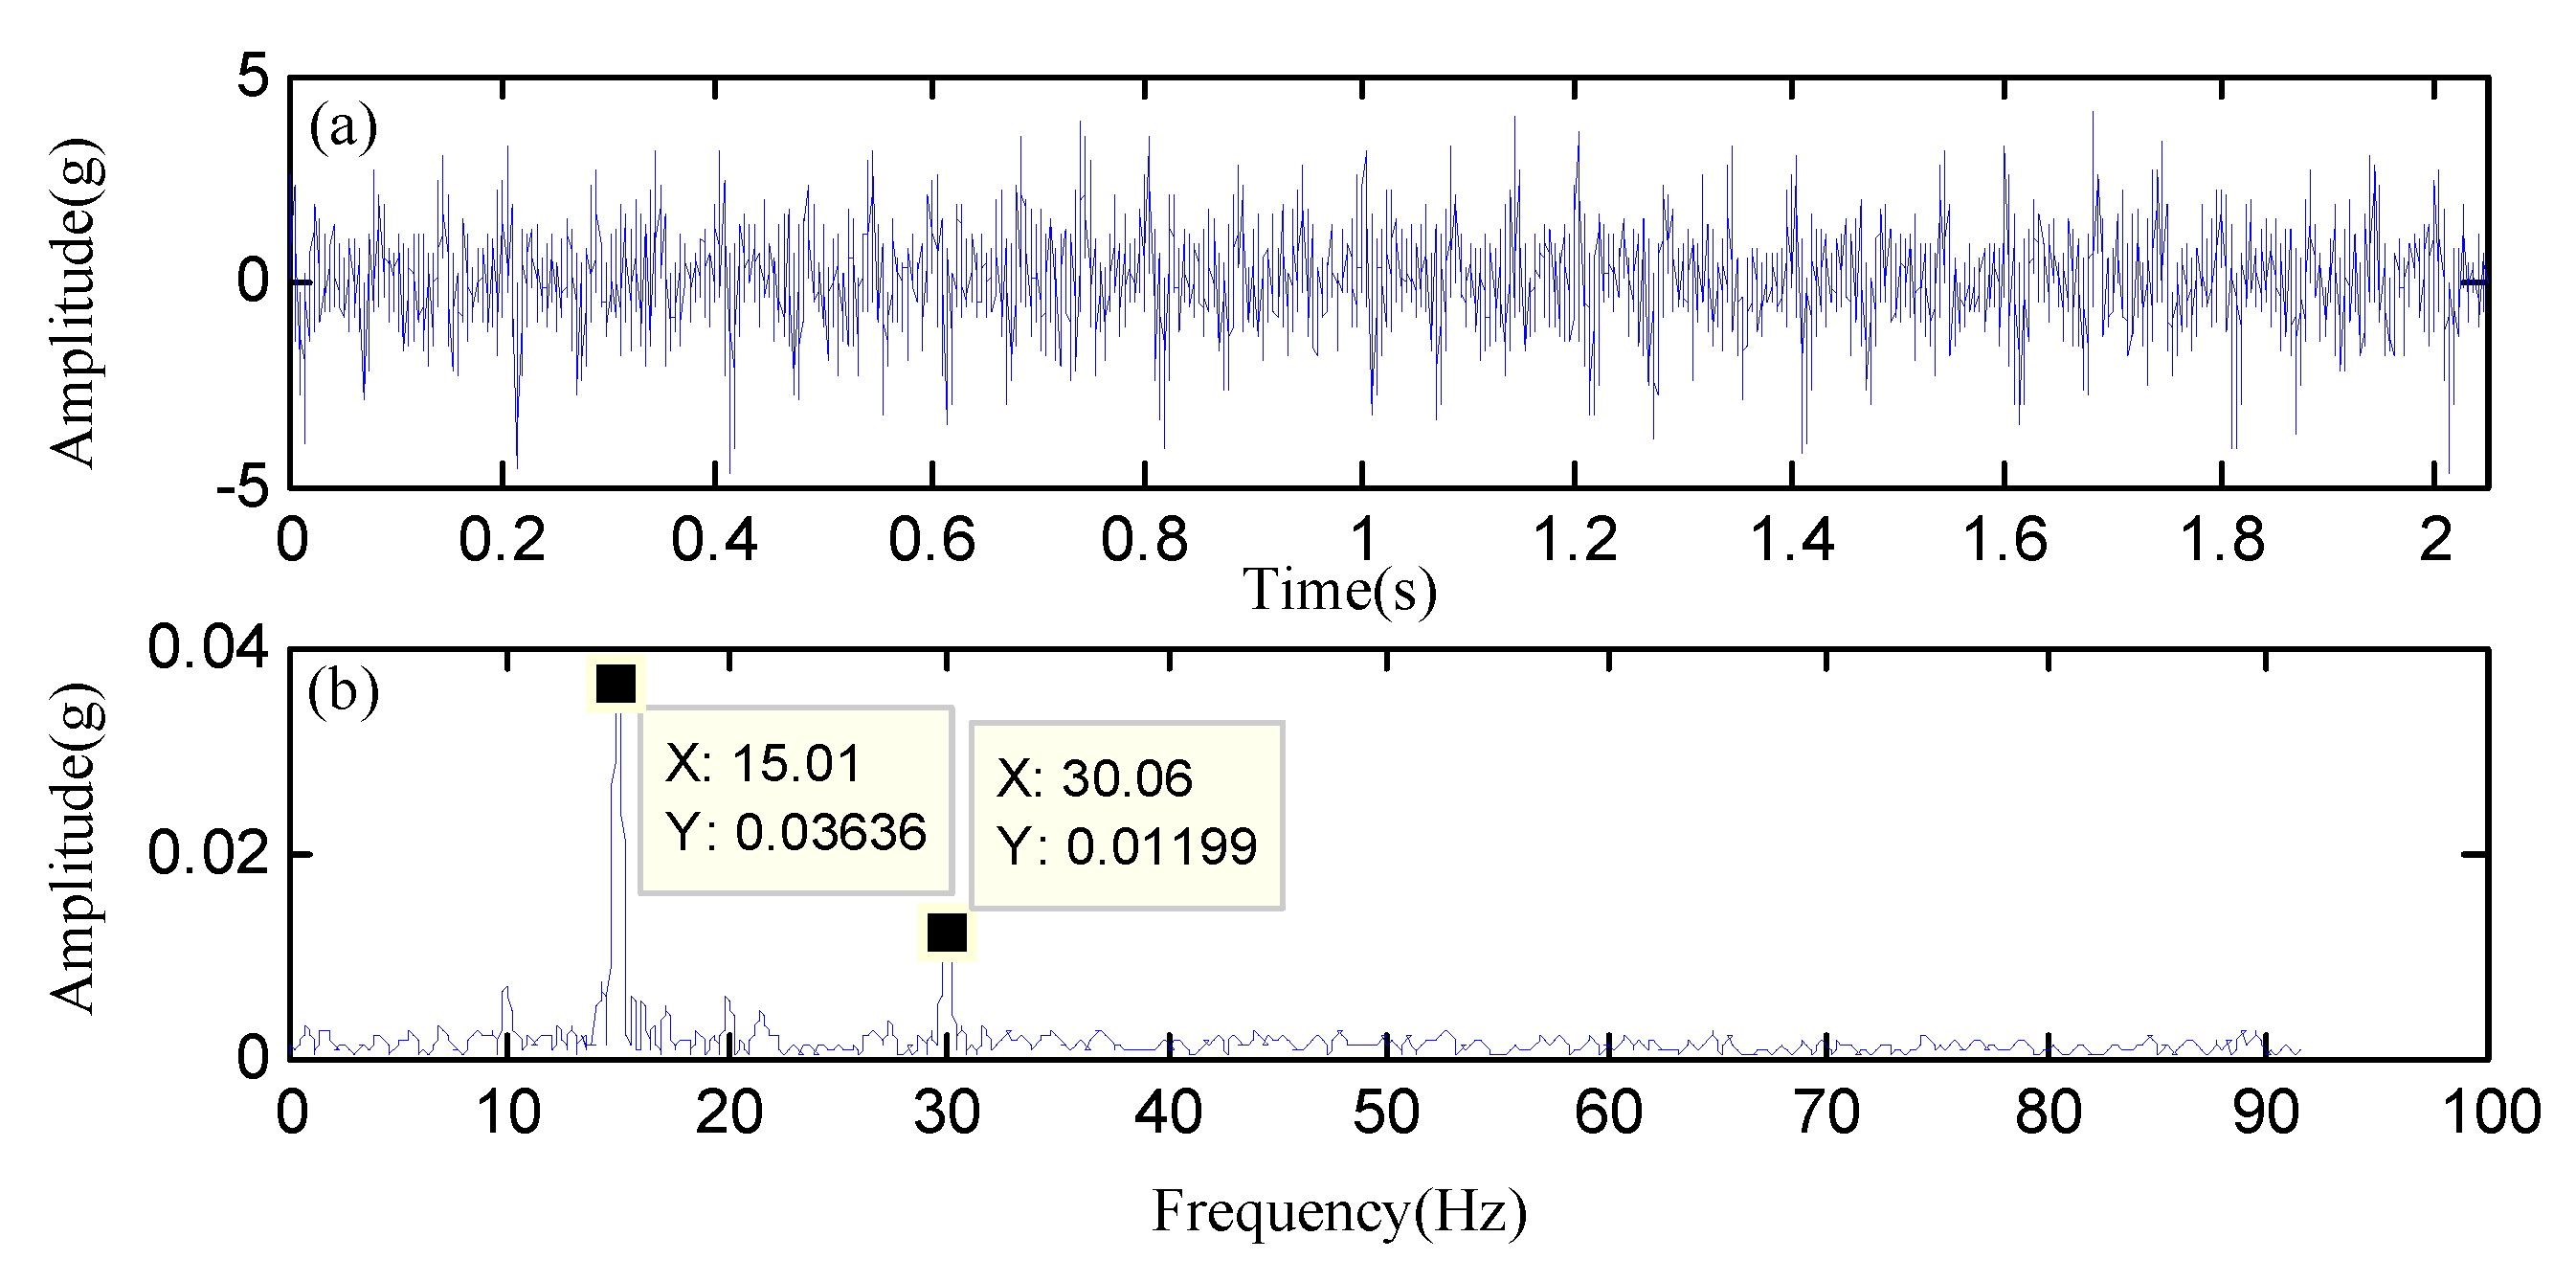
Figure 5.
Rolling bearing experimental setup at IMS.
Figure 6.
The case signal and decomposition results by FE guided-VMD.
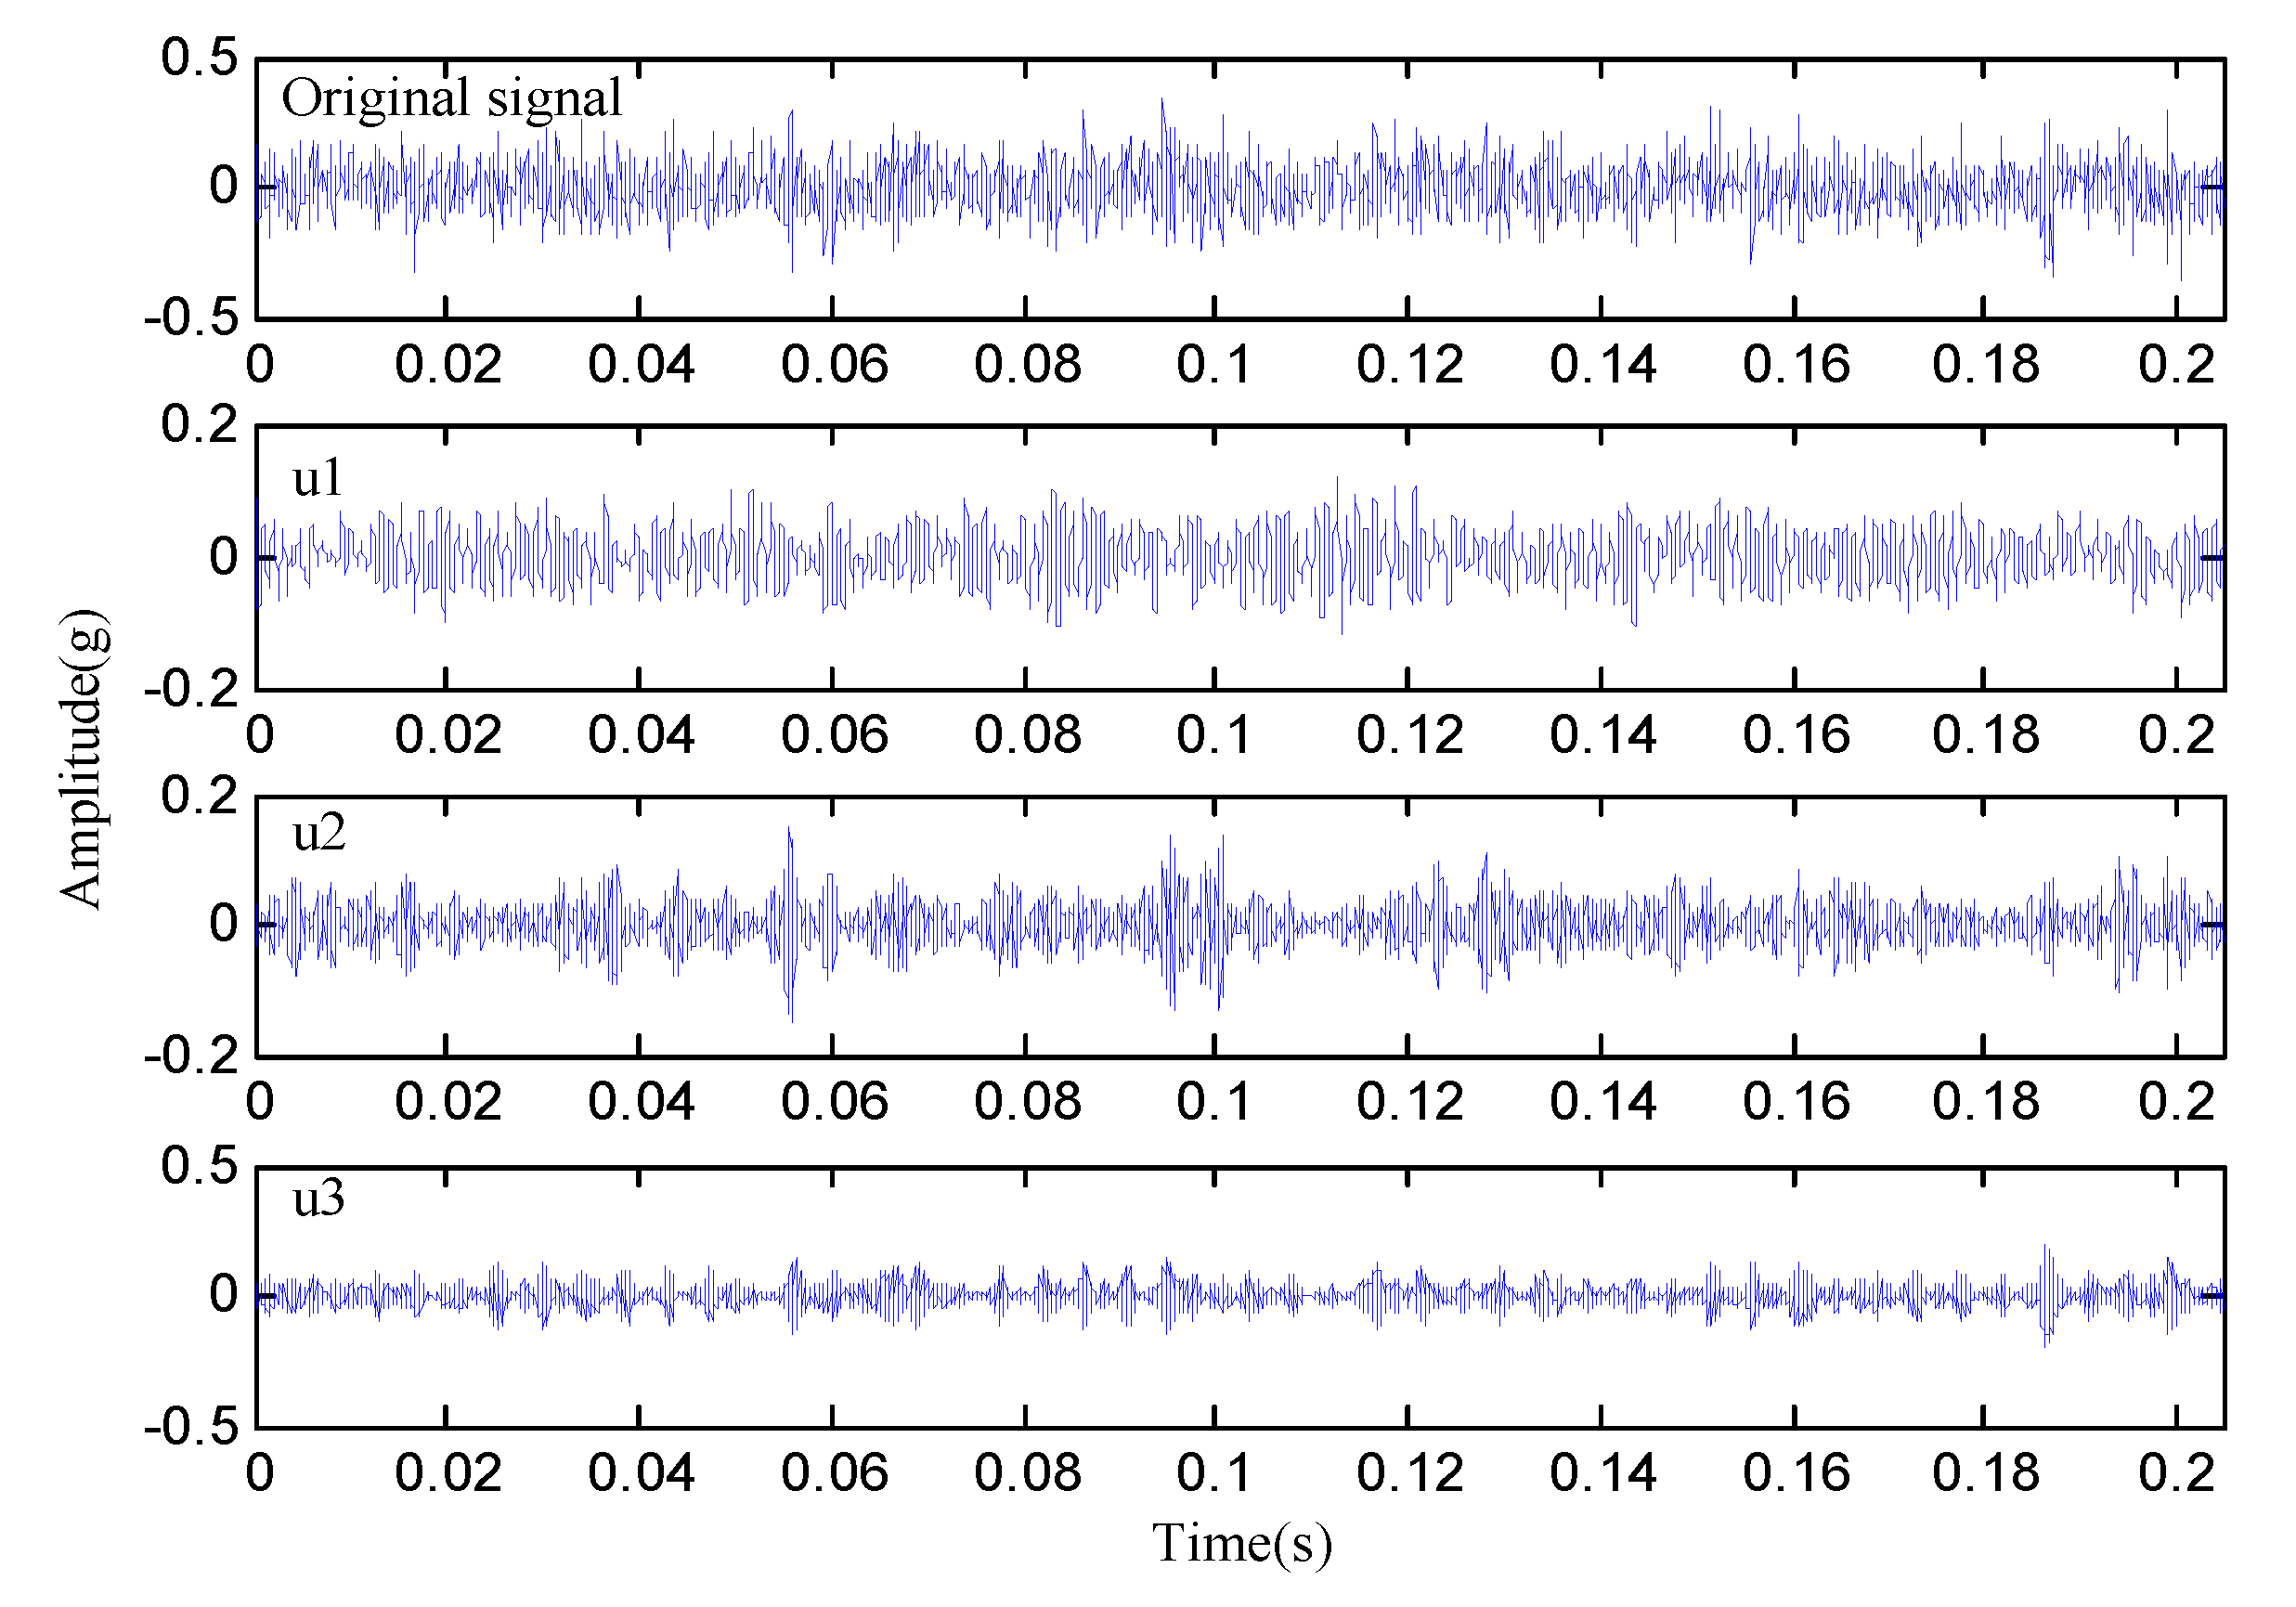
Figure 7.
(a) De-noising signal by NSD (b) Envelope spectrum of the de-noising signal (c) De-noising signal by Donoho threshold.
Figure 7.
(a) De-noising signal by NSD (b) Envelope spectrum of the de-noising signal (c) De-noising signal by Donoho threshold.
Figure 8.
Envelope spectrum of arbitrary parameters guided-VMD.
Figure 9.
Processing results by FSC.
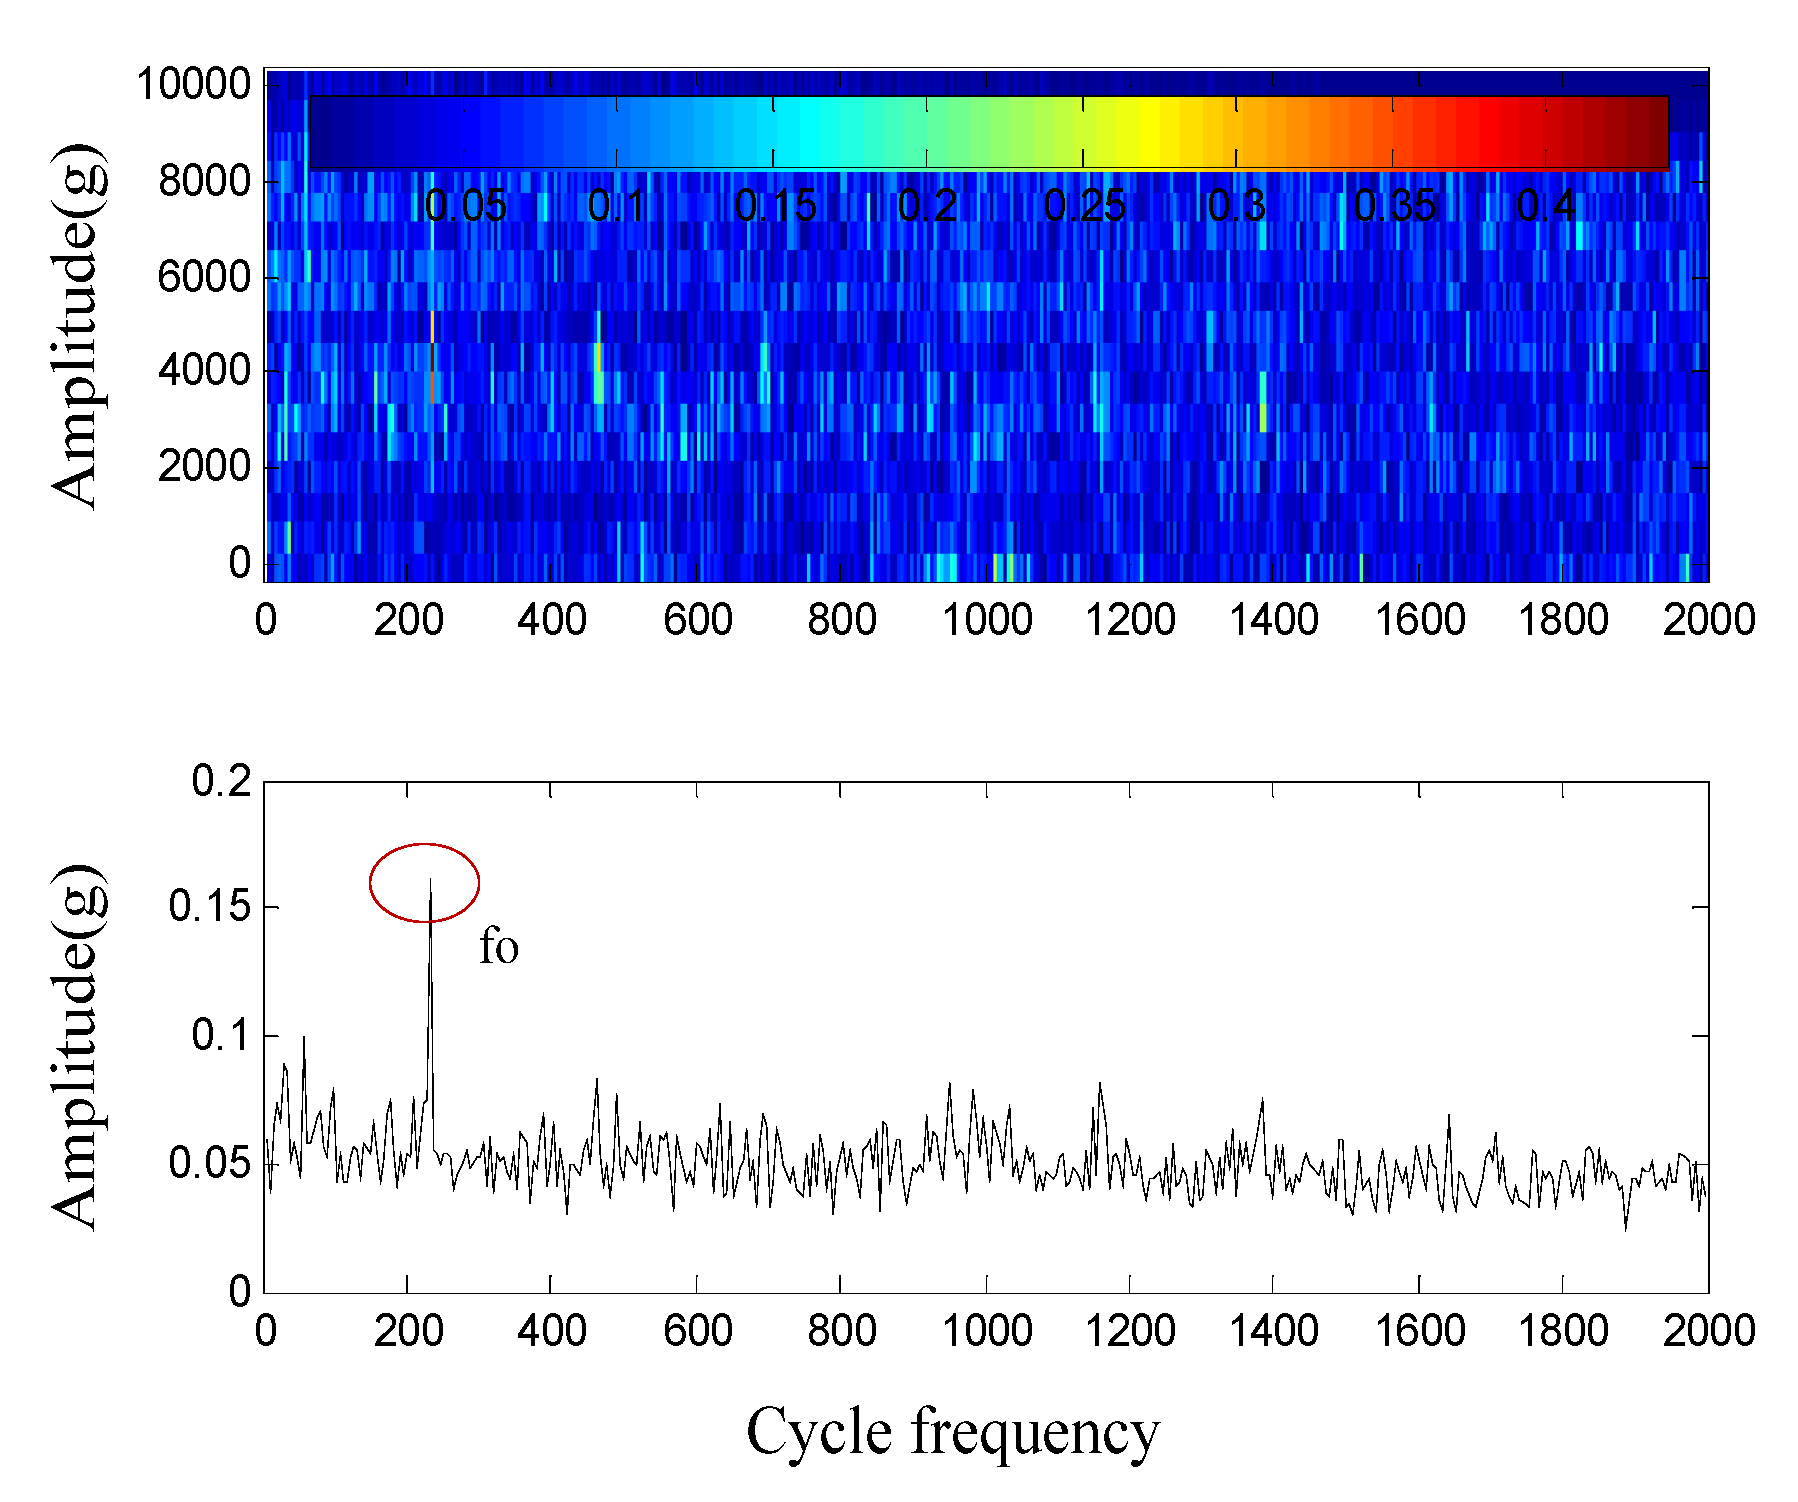
Figure 10.
ABLT-1A test rig.

Figure 11.
Test signal and decomposition results by FE-guided VMD.

Figure 12.
(a) De-noising signal by NSD. (b) Local envelope spectrum.
Figure 13.
(a) Test signal (b) Envelope spectrum (c) Filtering results of MED (d) Envelope spectrum.
Figure 13.
(a) Test signal (b) Envelope spectrum (c) Filtering results of MED (d) Envelope spectrum.
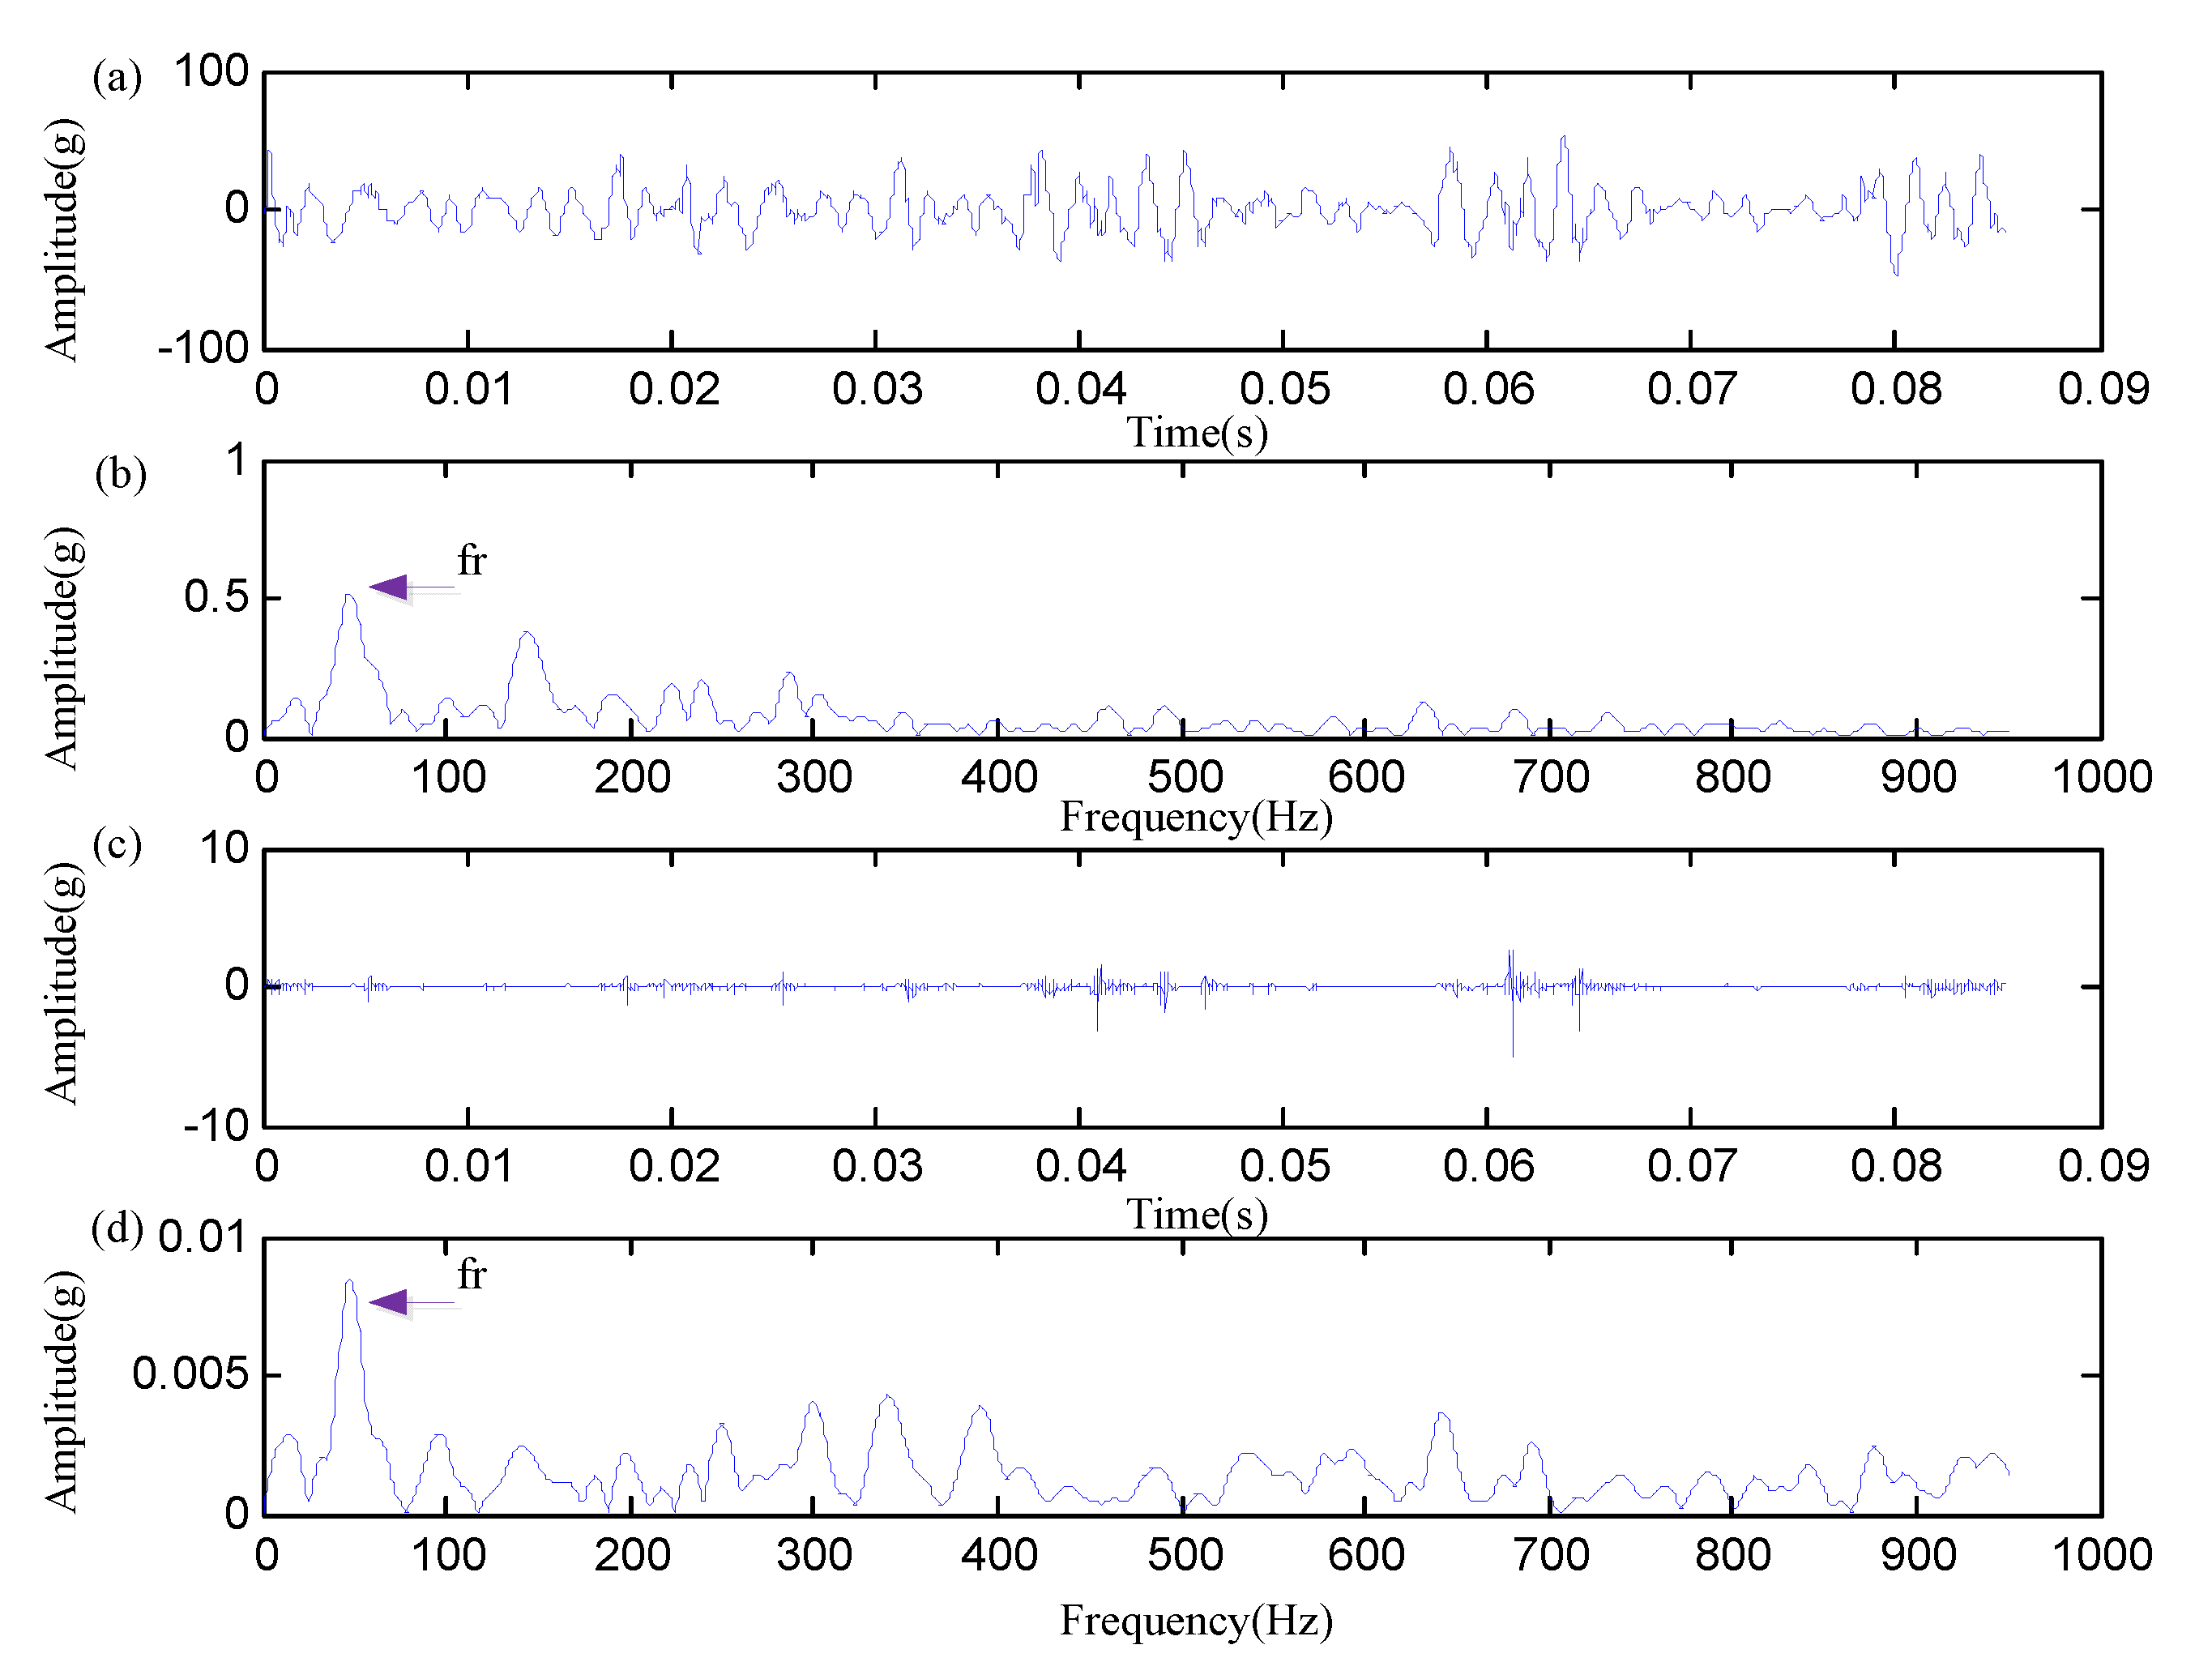
Figure 14.
Test signal and decomposition results by FE-guided VMD.
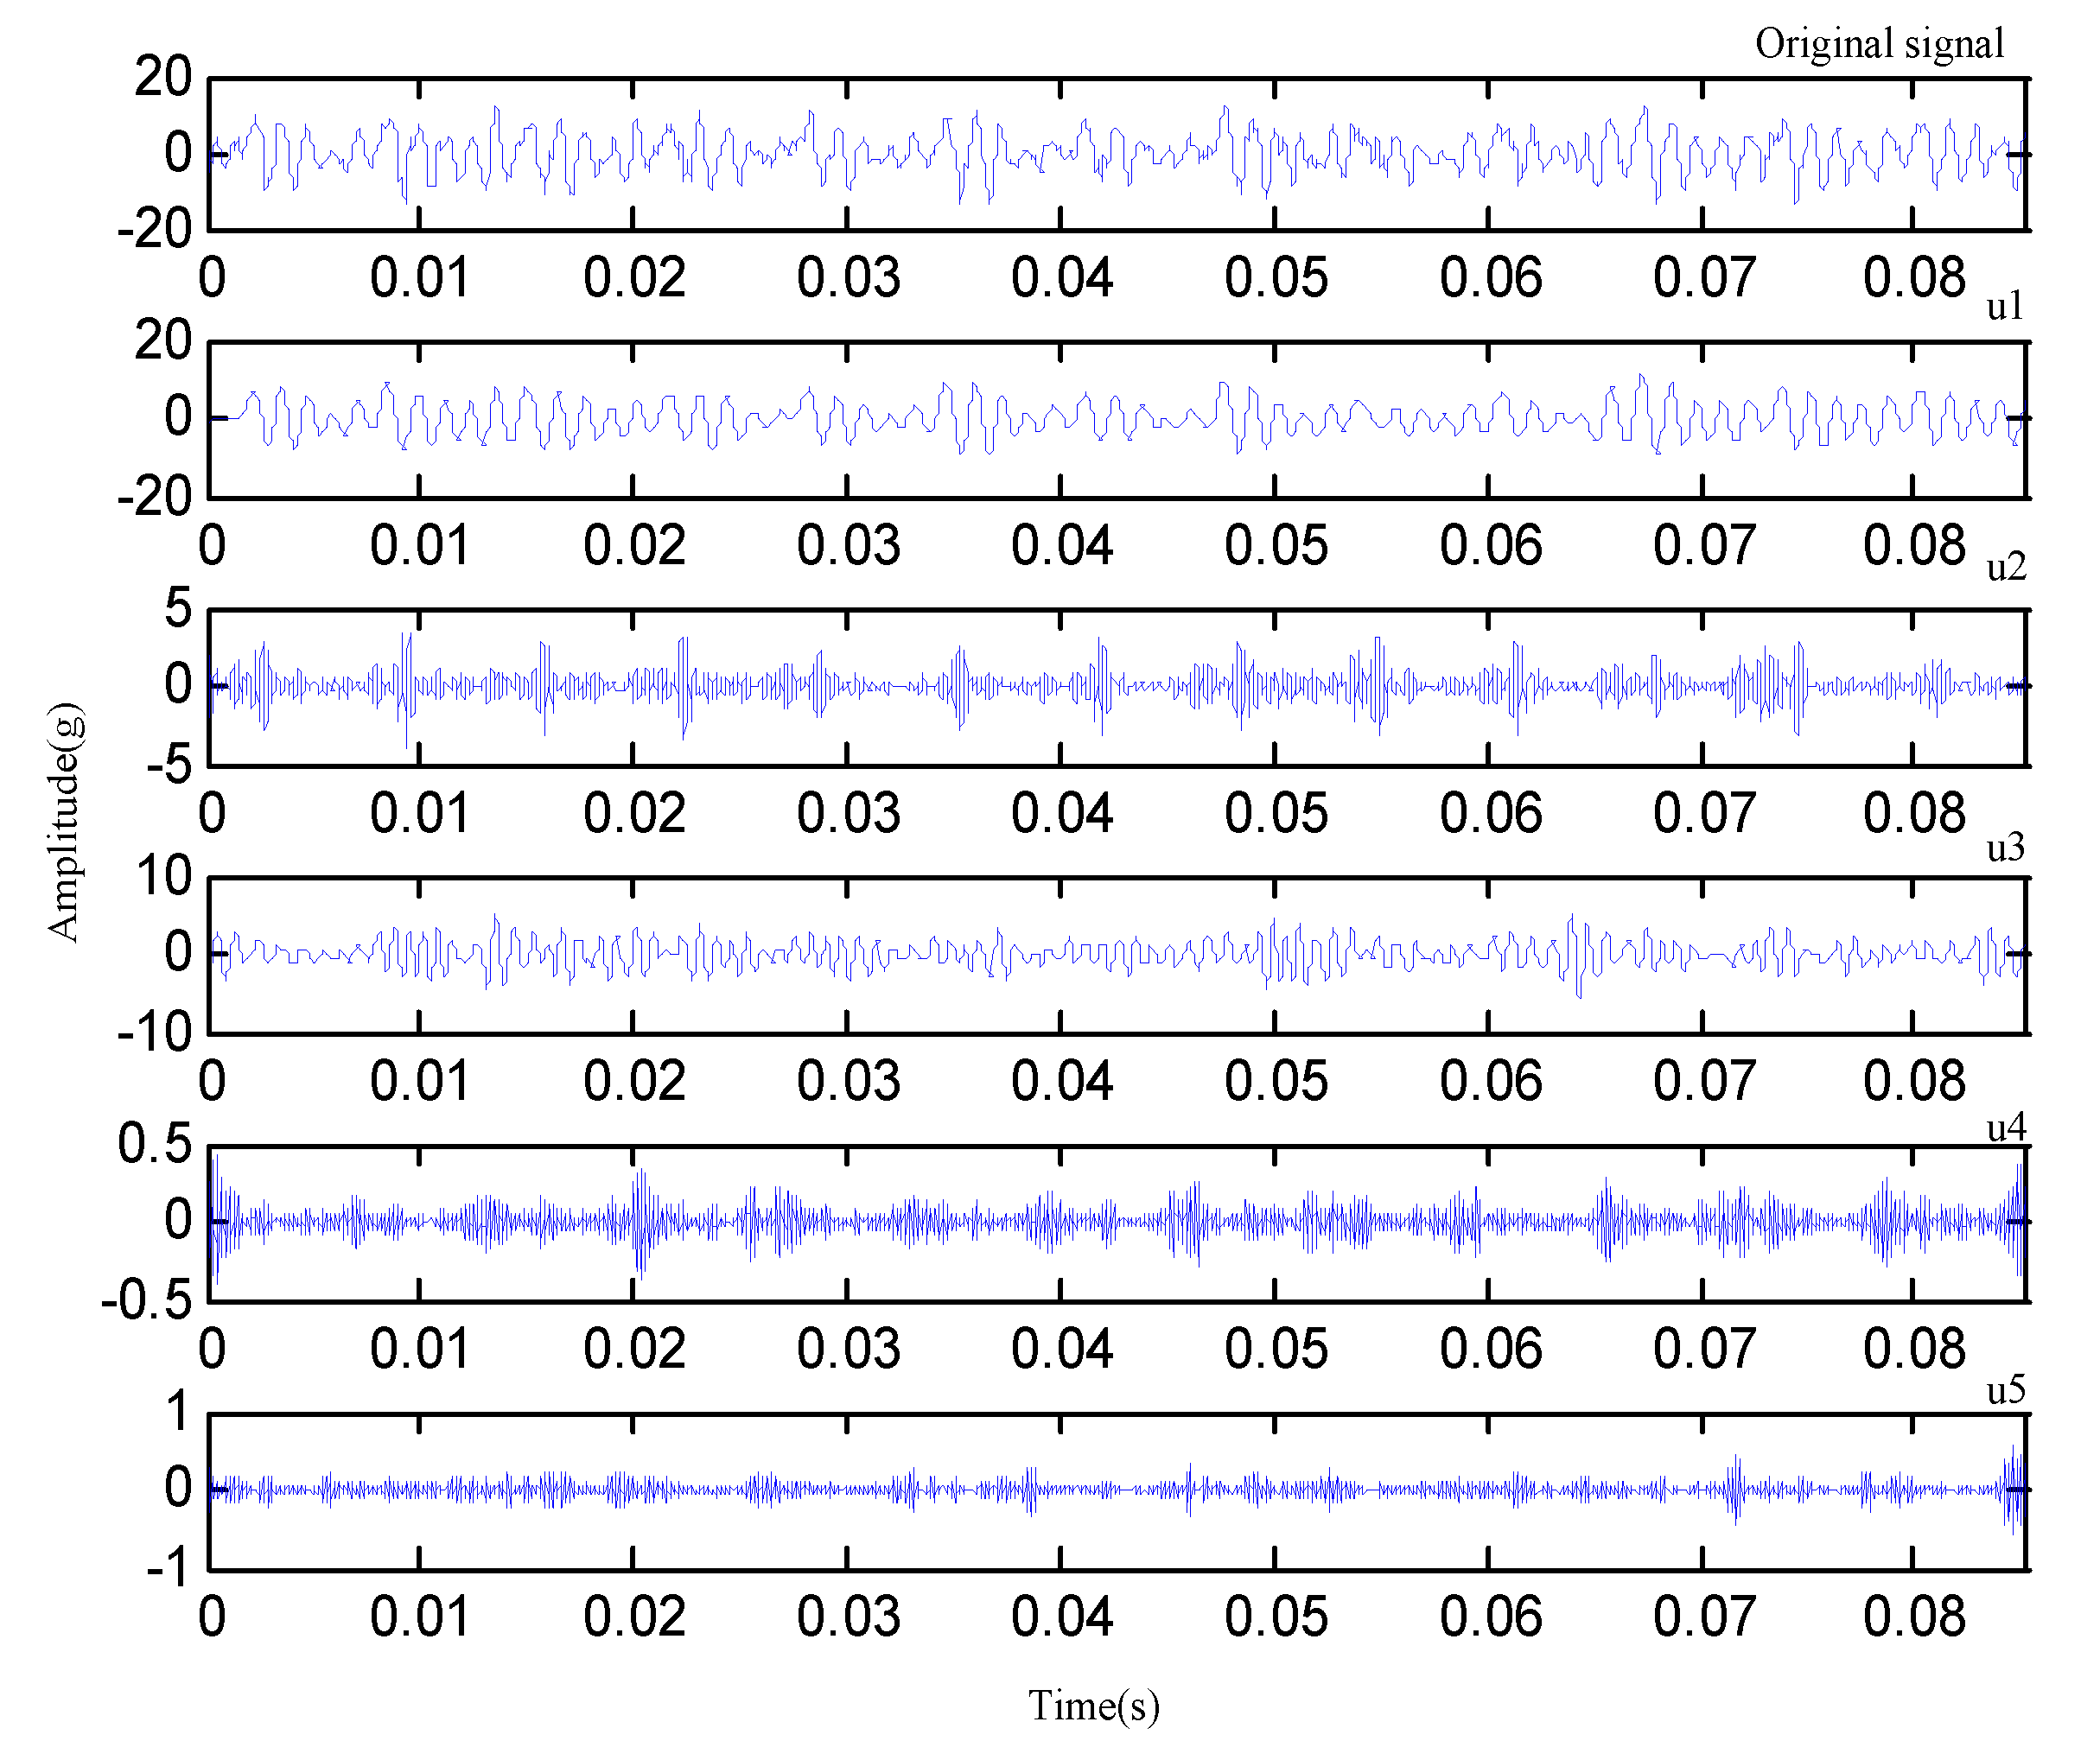
Figure 15.
(a) De-noising signal by NSD. (b) Local envelope spectrum.

Table 1.
Measures under different fault conditions.
| Condition | 1 | 2 | 3 | 4 |
|---|---|---|---|---|
| FE | 1.9049 | 1.8867 | 1.7810 | 1.6414 |
| PE | 6.2004 | 6.1112 | 6.1134 | 5.8567 |
Disclaimer/Publisher’s Note: The statements, opinions and data contained in all publications are solely those of the individual author(s) and contributor(s) and not of MDPI and/or the editor(s). MDPI and/or the editor(s) disclaim responsibility for any injury to people or property resulting from any ideas, methods, instructions or products referred to in the content. |
© 2022 by the authors. Licensee MDPI, Basel, Switzerland. This article is an open access article distributed under the terms and conditions of the Creative Commons Attribution (CC BY) license (https://creativecommons.org/licenses/by/4.0/).
Share and Cite
MDPI and ACS Style
Yuan, X.; Liu, H.; Zhang, H. Enhanced Rolling Bearing Fault Diagnosis Combining Novel Fluctuation Entropy Guided-VMD with Neighborhood Statistical Model. Appl. Sci. 2023, 13, 192. https://doi.org/10.3390/app13010192
AMA Style
Yuan X, Liu H, Zhang H. Enhanced Rolling Bearing Fault Diagnosis Combining Novel Fluctuation Entropy Guided-VMD with Neighborhood Statistical Model. Applied Sciences. 2023; 13(1):192. https://doi.org/10.3390/app13010192
Chicago/Turabian StyleYuan, Xing, Hui Liu, and Huijie Zhang. 2023. "Enhanced Rolling Bearing Fault Diagnosis Combining Novel Fluctuation Entropy Guided-VMD with Neighborhood Statistical Model" Applied Sciences 13, no. 1: 192. https://doi.org/10.3390/app13010192
Note that from the first issue of 2016, this journal uses article numbers instead of page numbers. See further details here.