

Reduction of Train-Induced Vibrations—Calculations of Different Railway Lines and Mitigation Measures in the Transmission Path
Federal Institute of Material Research and Testing, 12200 Berlin, Germany
Appl. Sci. 2023, 13(11), 6706; https://doi.org/10.3390/app13116706
Submission received: 12 April 2023
/
Revised: 22 May 2023
/
Accepted: 25 May 2023
/
Published: 31 May 2023
(This article belongs to the Special Issue Recent Advances in Vehicle-Track-Ground Coupling Dynamics and Railway-Induced Ground Vibration)
Abstract
:The reduction of train-induced ground vibrations by different railway lines and by mitigation measures in the propagation path is analysed in a unified approach by two-dimensional finite element calculations where the reduction is expressed as the amplitude ratio between a specific and the reference situation (the surface track without a mitigation measure). In general, there is no reduction at low frequencies, and the reduction becomes stronger with increasing frequency. A maximum reduction ratio of 0.1 at high frequencies is established with an open trench. Reduction ratios between 0.7 and 0.2 have been found for the other situations, filled trenches, walls, plates, and blocks, as well as for railway lines on embankment, in cuts and in a tunnel. Bridges can produce amplifications due to their resonance frequencies, but also strong reductions due to the massive bridge piers. The influence of some parameters has been analysed, the length of the bridge span, the inclination of the embankment and the cut, and the stiffness of the soil and of the tunnel structure. The dynamic track stiffnesses of a surface, bridge and tunnel track have been calculated by the 3D finite-element boundary-element method for comparison with corresponding measurements.
1. Introduction
High-speed railway lines run often through tunnels, on bridges, in cuts, and on embankments. The train-induced ground vibrations need to be predicted and—if necessary—mitigated. The aim of this contribution is to analyse the reduction effects of special track or line types and of mitigation measures in the propagation path by a unified approach.
Tunnel and bridge lines have been calculated by large finite-element models. These analyses are usually for one line type only. Continuous bridge tracks (viaduct lines), which are quite a standard in China, Japan and Taiwan, have been treated in [1,2,3,4,5,6,7]. The numerical results are sometimes compared with measured ground vibrations, but not with calculations of surface lines. Tunnel lines have also been analysed by large finite-element models, for example in [8], and many tunnel studies exist for high-speed and metro lines [9,10,11,12,13]. Simplified methods, for example in wavenumber domain [14] or with substructuring [15,16] have been developed where the tunnel is assumed as imbedded in an infinite soil medium (a full space). The original (full-space) boundary-element method can simplify the geometry of the model [17,18]. According to the geometry of the tunnel, also 2-dimensional [19,20,21] and 2.5 dimensional [22,23] finite-element and boundary-element methods have been applied. Moreover, simplified phenomenological soil-structure methods have been used in [24,25]. A few publications deal with more than one type of railway line. In [26], tunnel and bridges have been analysed as substructures where little influence on the vehicle dynamics and considerable influence on the track dynamics has been found for models on a Winkler foundation. In [27], the ground vibrations from a bridge and an embankment line have been compared indicating that the bridge generates more low-frequency and a more specific high-frequency vibration whereas the embankment results in wider low and high frequency bands. In [28], railway lines on embankments, in cuts and on the plane surface have been compared with some similar results as will be demonstrated in the present contribution.
Mitigation measures for railway induced vibrations are well known at the track (elastic elements, mass-spring systems) and at the building (base isolation). Mitigation in the propagation path (trenches, obstacles, groups of piles) have been proposed, for example in [29,30,31,32,33,34,35,36,37], and analysed in two or three dimensions. In the present contribution, the reduction effects of various measures in the propagation path are analysed in the same way as for the different types of railway lines. For the comparison of different railway situations, the 2-dimensional calculation is an advantageous approach as it reduces the number of parameters as well as the modelling and the calculation time.
The article is structured as follows. The two methods that are used here to represent the infinitely large soil, the Thin Layer Method (TLM) and the Boundary-Element Method (BEM) are shortly outlined in Section 2.1 and Section 2.2 by referring to previous publications. Both methods establish a boundary matrix which is coupled with the Finite-Element Method (FEM) for an inner soil region, a track, tunnel or building structure. The Boundary-Element Method uses the explicit full-space solution or—from integration in wavenumber domain—the half-space solution whereas the Thin Layer Method uses discrete wave modes from an eigenvalue problem. In Section 3, the results for the line load and the track load on the surface are given as the reference for the comparison of the special situations. Section 4 presents the reduction effects of different obstacles in the propagation path, open and infilled trenches, stiff walls, plates and blocks. The effects of different railway lines are discussed in the following two sections, in Section 5 for embankments and cuts with different slopes, and in Section 6 for tunnels and bridges. Corresponding measurement results will be presented in a complementary paper. The novelty of the present contribution is the unique approach (with models of similar system dimensions and on the same homogeneous medium stiff soil) for the fair comparison of the reduction effects of different railway lines and of mitigation measures in the propagation path which is rarely found in the literature.
2. Methods of Calculation
In the following sub-sections, the Thin-Layer and the Boundary-Element Method are described briefly. Both methods start with the solution for the infinite soil in frequency-wavenumber domain that is for a time-harmonic plane-wave excitation. Special solutions are obtained and a dynamic stiffness matrix for the boundary is established. This dynamic stiffness matrix for the outer soil is combined with the dynamic stiffness matrix of an inner finite-element region.
2.1. The Thin Layer Method (TLM)
The Thin Layer Method has been developed by Waas [38] and Kausel [39], and the calculations of the present article have been performed with an adaptation of Rücker [19] who added the damping elements of Lysmer [40] at the lower boundary. An example model with tunnel, soil and building can be seen in Figure 1. It is a 2-dimensional model with an interior finite element region including all details such as the tunnels, the soil with specific inclusions, and the building. The infinite soil at the left and right side of the finite-element region is represented by thin layers. The wave propagation in these layer regions is approximated by piece-wise linear function of the depth and solved by an eigenvalue problem for the wavenumbers. The dynamic stiffness matrices of the left and right boundary are established by the superposition of the discrete wave modes. In addition, the lower boundary is represented by damper elements which are adjusted to the properties of the finite element soil.
2.2. Boundary-Element Method (BEM)
The Boundary-Element Method uses special (fundamental, point-load, Greens‘ function) solutions to establish the dynamic stiffness matrix of the soil. One version uses the explicit solution for the elastic full-space which is
with
and the modified Bessel functions of the second kind Ki. This holds for the vertical (transversal) displacement component uz due to a vertical (transversal) force Fz.
Similar functions hold for the longitudinal displacement due to a longitudinal force and for the stresses (three functions), see [21]. The corresponding explicit solutions in three dimensions are given in [18].
The alternative version uses the solutions (the compliances uz/Fz) for a half-space which are calcuated by a wavenumber integral
for a line load or
for a point load. These infinite integrals for the vertical components as well as for the horizontal components are evaluated numerically, and a proper truncation of the infinite integral is necessary [41].
The dynamic stiffness matrix of the boundary (the outer soil region) is obtained by a superposition of a set of point-load or line-load solutions. This boundary matrix is added to the dynamic stiffness matrix of the inner region/the tunnel structure (Figure 2). The stress-free surface of the soil must be discretized if the full-space solution is used. In this contribution, the full-space method [21] is used to calculate the emission effect of a deep tunnel where only the tunnel must be discretised. The half-space method [42] has its advantages if a structure on the surface of the soil is analysed, such as the track structure in Figure 3 which has been calculated for a tunnel, bridge, and surface line in Appendix A.
2.3. The Benefit of 2-Dimensional Calculations
The structure of a railway line on the soil is usually homogeneous along the track. This can be easily modelled in two dimensions. The excitation, however, is 3-dimensional with local and (mostly) uncorrelated axle loads. The attenuation of the wave amplitudes with distance is not reflected by a 2-dimensional calculation, neither in plane nor in axisymmetric modelling. Therefore, the 2-dimensional analysis cannot predict the absolute values of the ground vibration induced by railway traffic. Whereas the absolute amplitudes have no meaning for the reality, the relative amplitudes, when two systems are compared, give a relevant information. In many cases (for example for trenches of relevant lengths [29,30,31]), these frequency-dependent reduction functions can be held as an approximation of the corresponding reductions in three dimensions and in reality and can be included in a correct 3-dimensional prediction of train-induced ground vibrations.
3. The Reference System: A Surface Line on a Homogeneous Soil
The reference system is a surface track on a homogeneous medium stiff soil with the material parameters shear modulus G = 8 × 10⁷ N/m2, Damping ratio D = 2%, a Poisson ratio of ν = 0.33, and a mass density of ρ = 2000 kg/m3 (resulting in shear and compressional wave velocities of vS = 200 m/s and vP = 400 m/s). The track is a rigid strip foundation of width b = 3 m, see also Table 1 for the standard parameters and the variations. All lose to firm non-cohesive soils (sands, gravels, boulders) and cohesive soils (clays) are included by the chosen range of wave velocities.
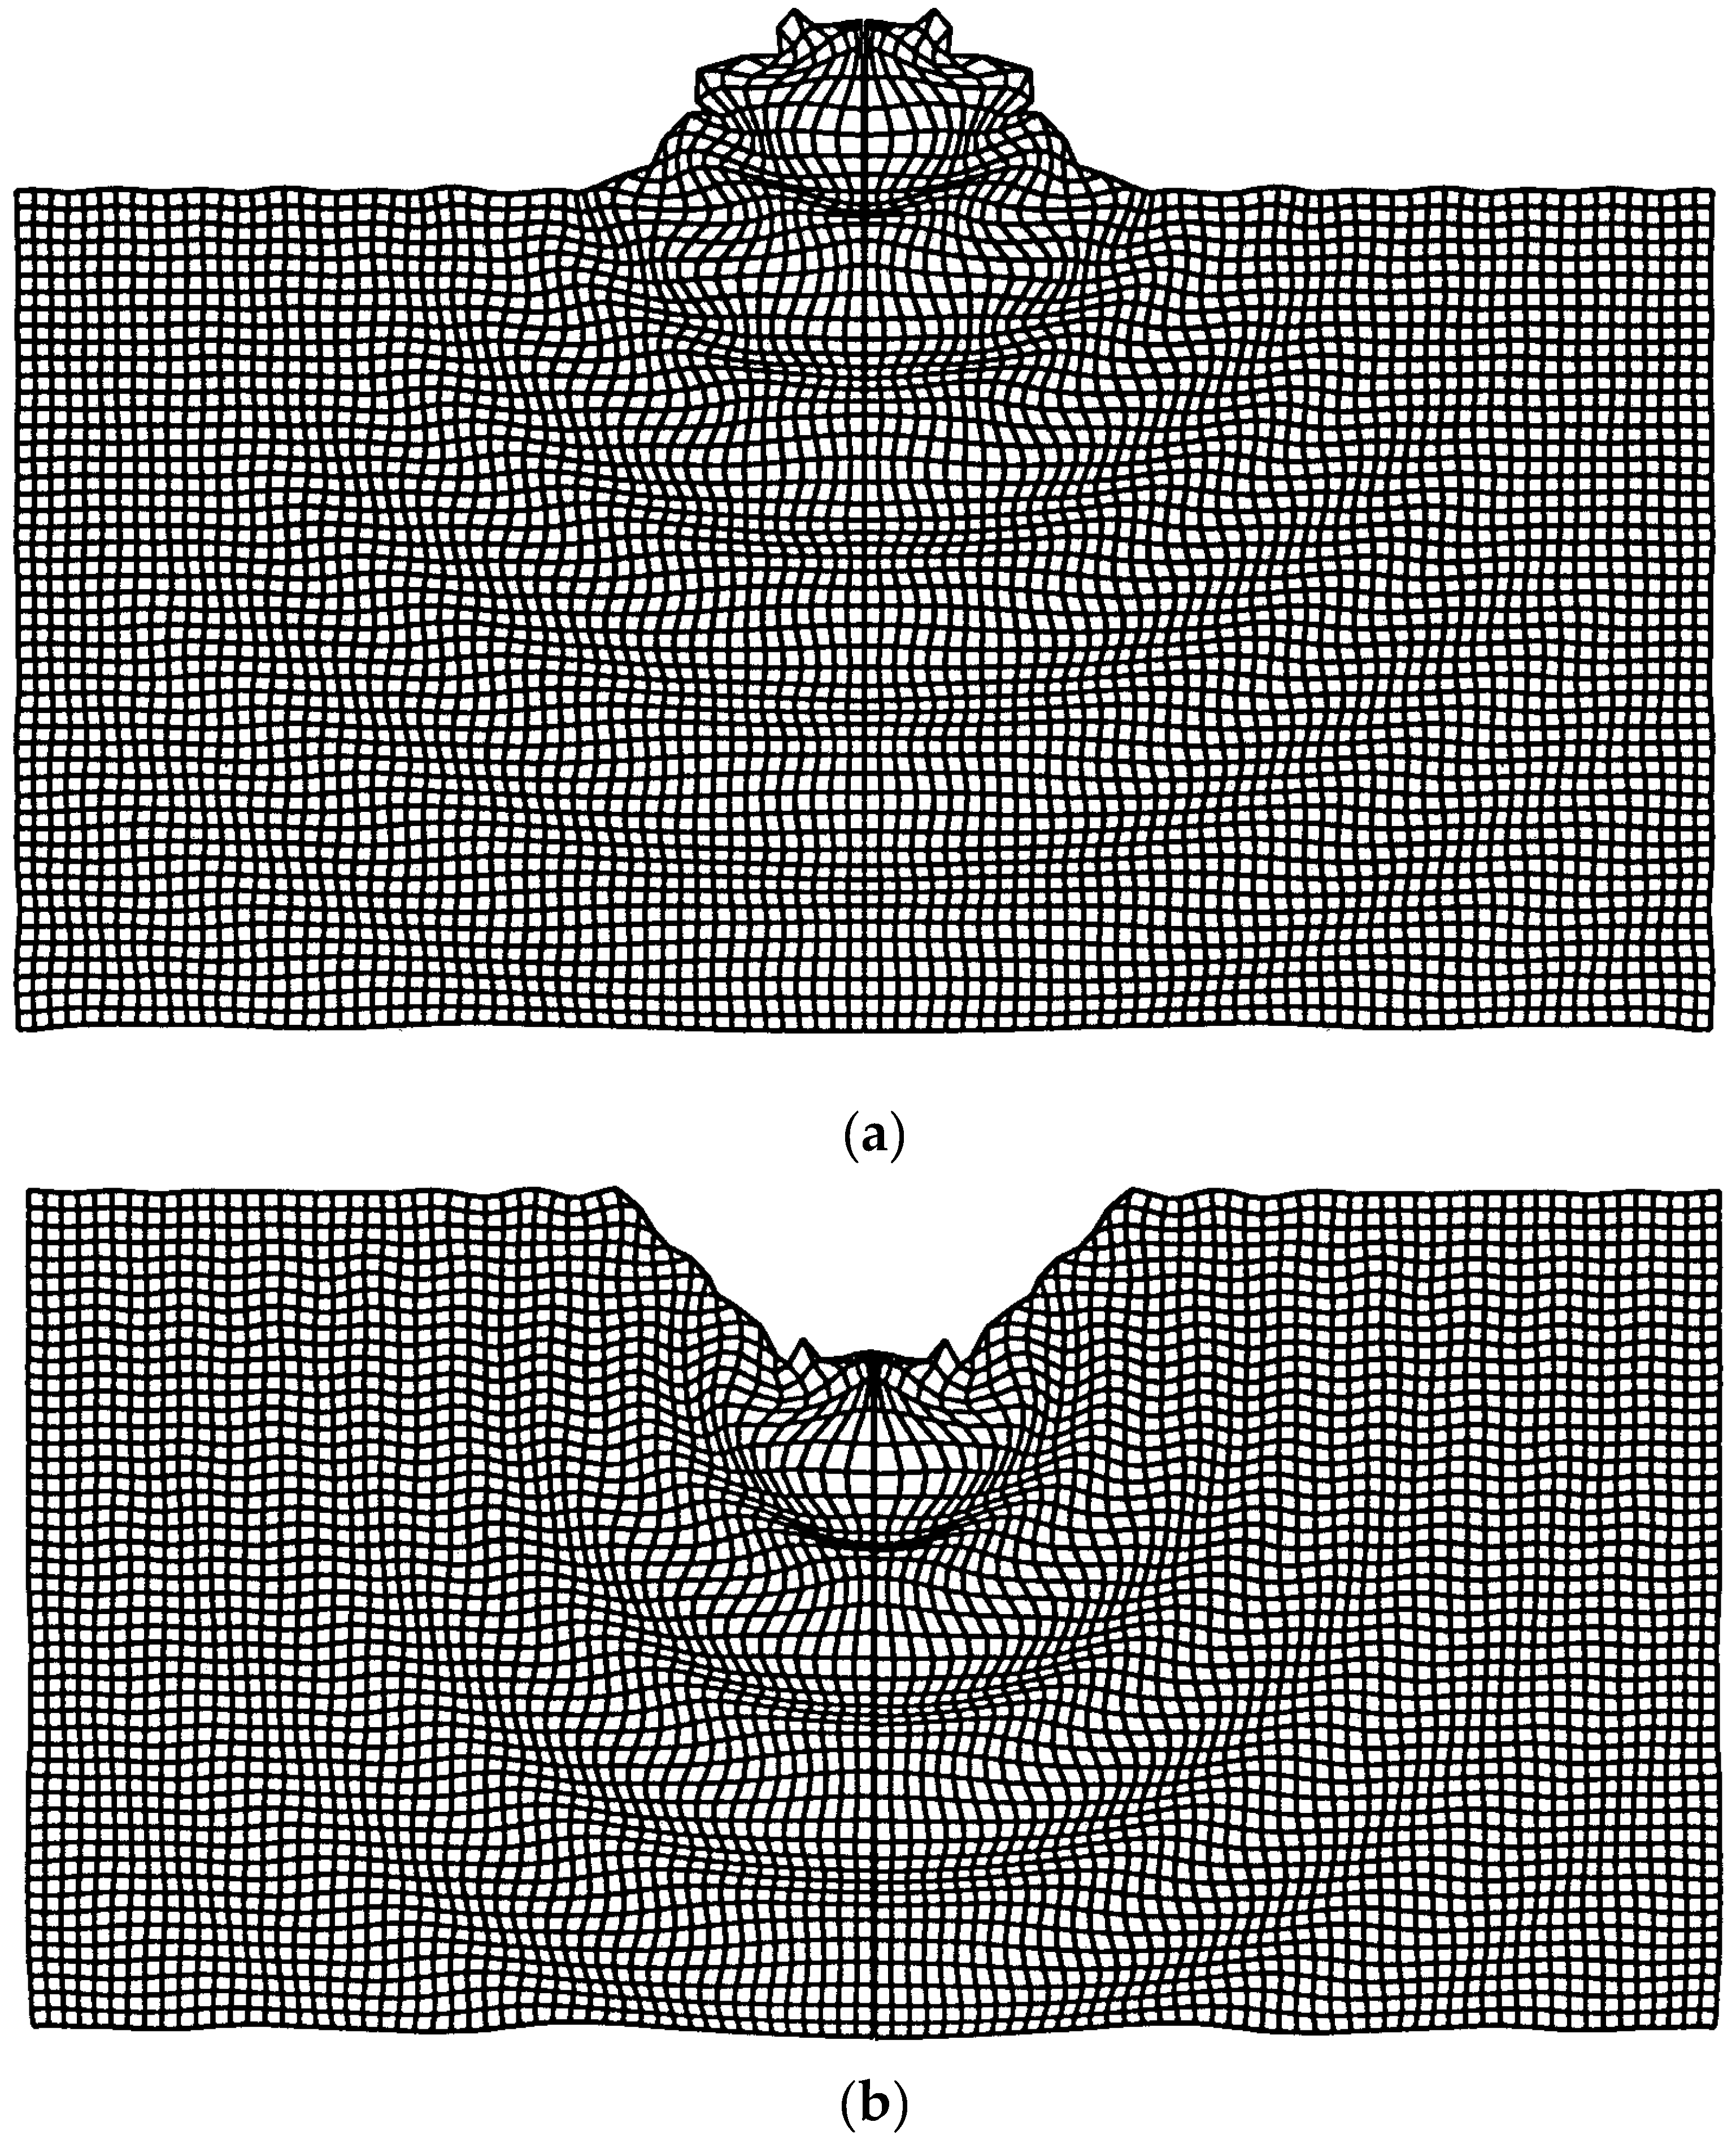
Figure 4a shows the vibration mode at 80 Hz where waves can be observed along the surface as well as down to the interior of the soil. The wavelength at the surface is λ ≈ 2.5 m which means a wave velocity of v ≈ 200 m/s = vS. According to the deformation pattern, this is the Rayleigh wave of the soil. The downward waves have twice the wavelength and are compression waves with vP = 400 m/s. (No reflections occur at the lower boundary indicating that the boundary dampers work well.) The compressional waves are a special effect of the wider excitation by the track (the strip foundation). In case of a concentratred line load (Figure 4b), no compression waves are visible, but instead slower body waves with a shorter wavelength appear, obviously shear waves. The Rayleigh waves at the surface are stronger than for the track load. The reduction of the strip load compared the line load in Figure 5 becomes stronger with frequency, approximately as uT/uL = 2vS/bω at higher frequencies [43].
The frequency-dependent reduction effect of different railway lines and mitigation measures is calculated as the ratio of the (averaged) amplitudes v of the specific situation (for example with a trench) to the (averaged) amplitudes vR of the reference system. The reference system with a surface track, which has been described in this section, will be used throughout the text. Only in Section 7, the concentrated line load solution has been used as the reference.
4. Soft and Stiff Reduction Measures in the Propagation Path
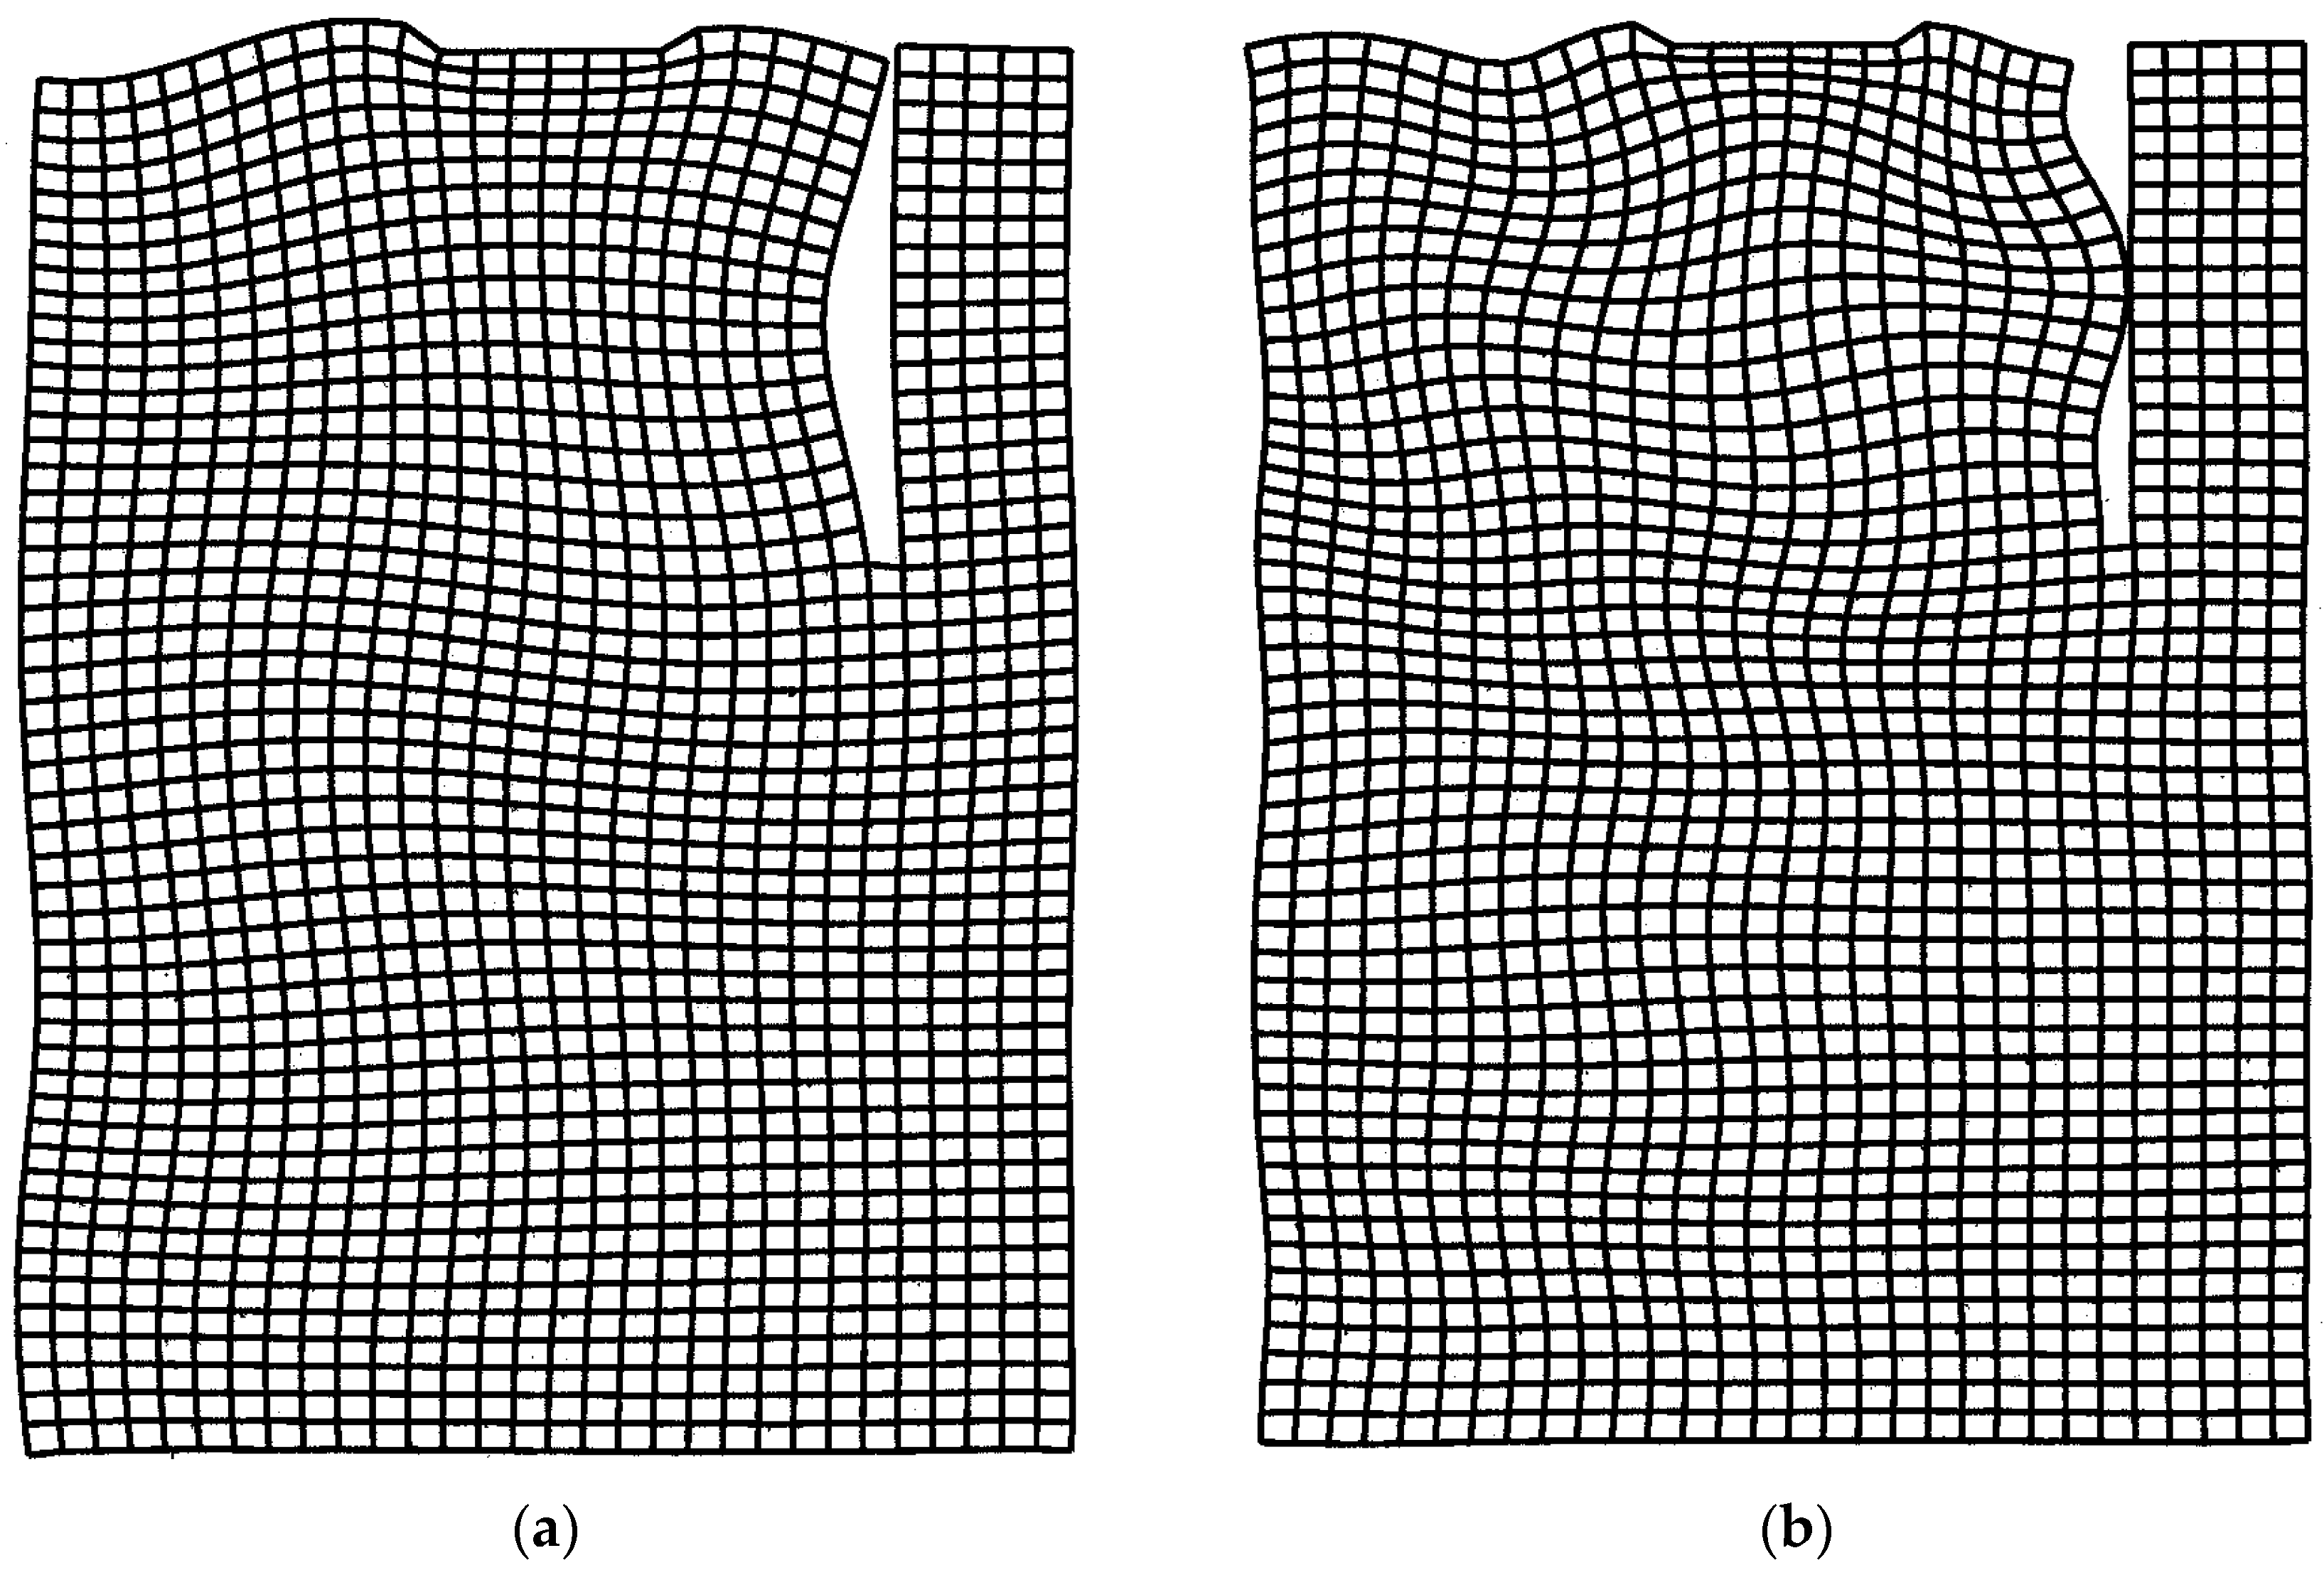
Open and filled trenches and stiff obstacles are considered in this section. The reduction effect of an open trench can be clearly seen in the vibration mode of Figure 6. Behind the trench, there is a shadow zone where the amplitudes are quite small. For an open trench, no transfer of vibrations can occur and the soil behind the trench can only be excited by the underlying soil layers. The frequency-dependent reduction ratio of the amplitudes has been evaluated at the distances between 20 to 30 m (Figure 7). Reduction ratios down to values of 0.1 are possible with an open trench (Figure 7c). This is in agreement with previously published results in [29,30,31]. Note that the shortest wavelength at 80 Hz of 2.5 m is less than a third of the trench depth. Real trenches are usually stabilised by an infill material. Softer materials provide a better reduction. The relevant parameter is the compressional stiffness k″ of the infill [44] which can be reduced by a softer material or by a thicker trench.
The wave propagation can also be impeded by a stiff material in the soil. If the „trench“ is filled with concrete, the reduction effect of a concrete wall is analysed in Figure 8. The deformations of the near field and the surface waves are averaged over the depth by the bending stiffness of the wall. The shorter wavelengths at higher frequencies are reduced more efficiently. The frequency-dependent reduction ratios of the wall shown in Figure 7d (circle markers) go down to high-frequency values of 0.3.
Similar effects are found for a plate on top of the soil in Figure 9. The horizotal wave motion is suppressed by the longitudinal stiffness and the vertical wave motion is reduced by the bending stiffness of the plate. Wheras the impedance (the wave resistance) of the soil is constant, the bending stiffness is increasing with the wave number or the frequency. The bending stiffness dominates above a certain frequency which is at 20 Hz for the present case, and the amplitudes are reduced with increasing frequency (Figure 7d triangle markers).
As a compact obstacle, a concrete block of dimension 5 m × 5 m is considered (Figure 10). The reduction effect of compact obstacles is ruled by their width compared to the wavelength [45] and it becomes stronger with increasing frequency. In a mid-frequency range around 50 Hz, the reduction of the massive block (Figure 7d plus markers) is even stronger than for a wall or plate, and almost as strong as for an open trench (Figure 7c).
To summarize, the high-frequency reduction ratio of obstacles in the propagation path is down to 0.2 for trenches (depending on the infill material), 0.2 for a concrete block, 0.4 for a concrete wall and also 0.4 for a concrete plate on the surface of the soil.
5. Railway Lines on an Embankmnet and in a Cut
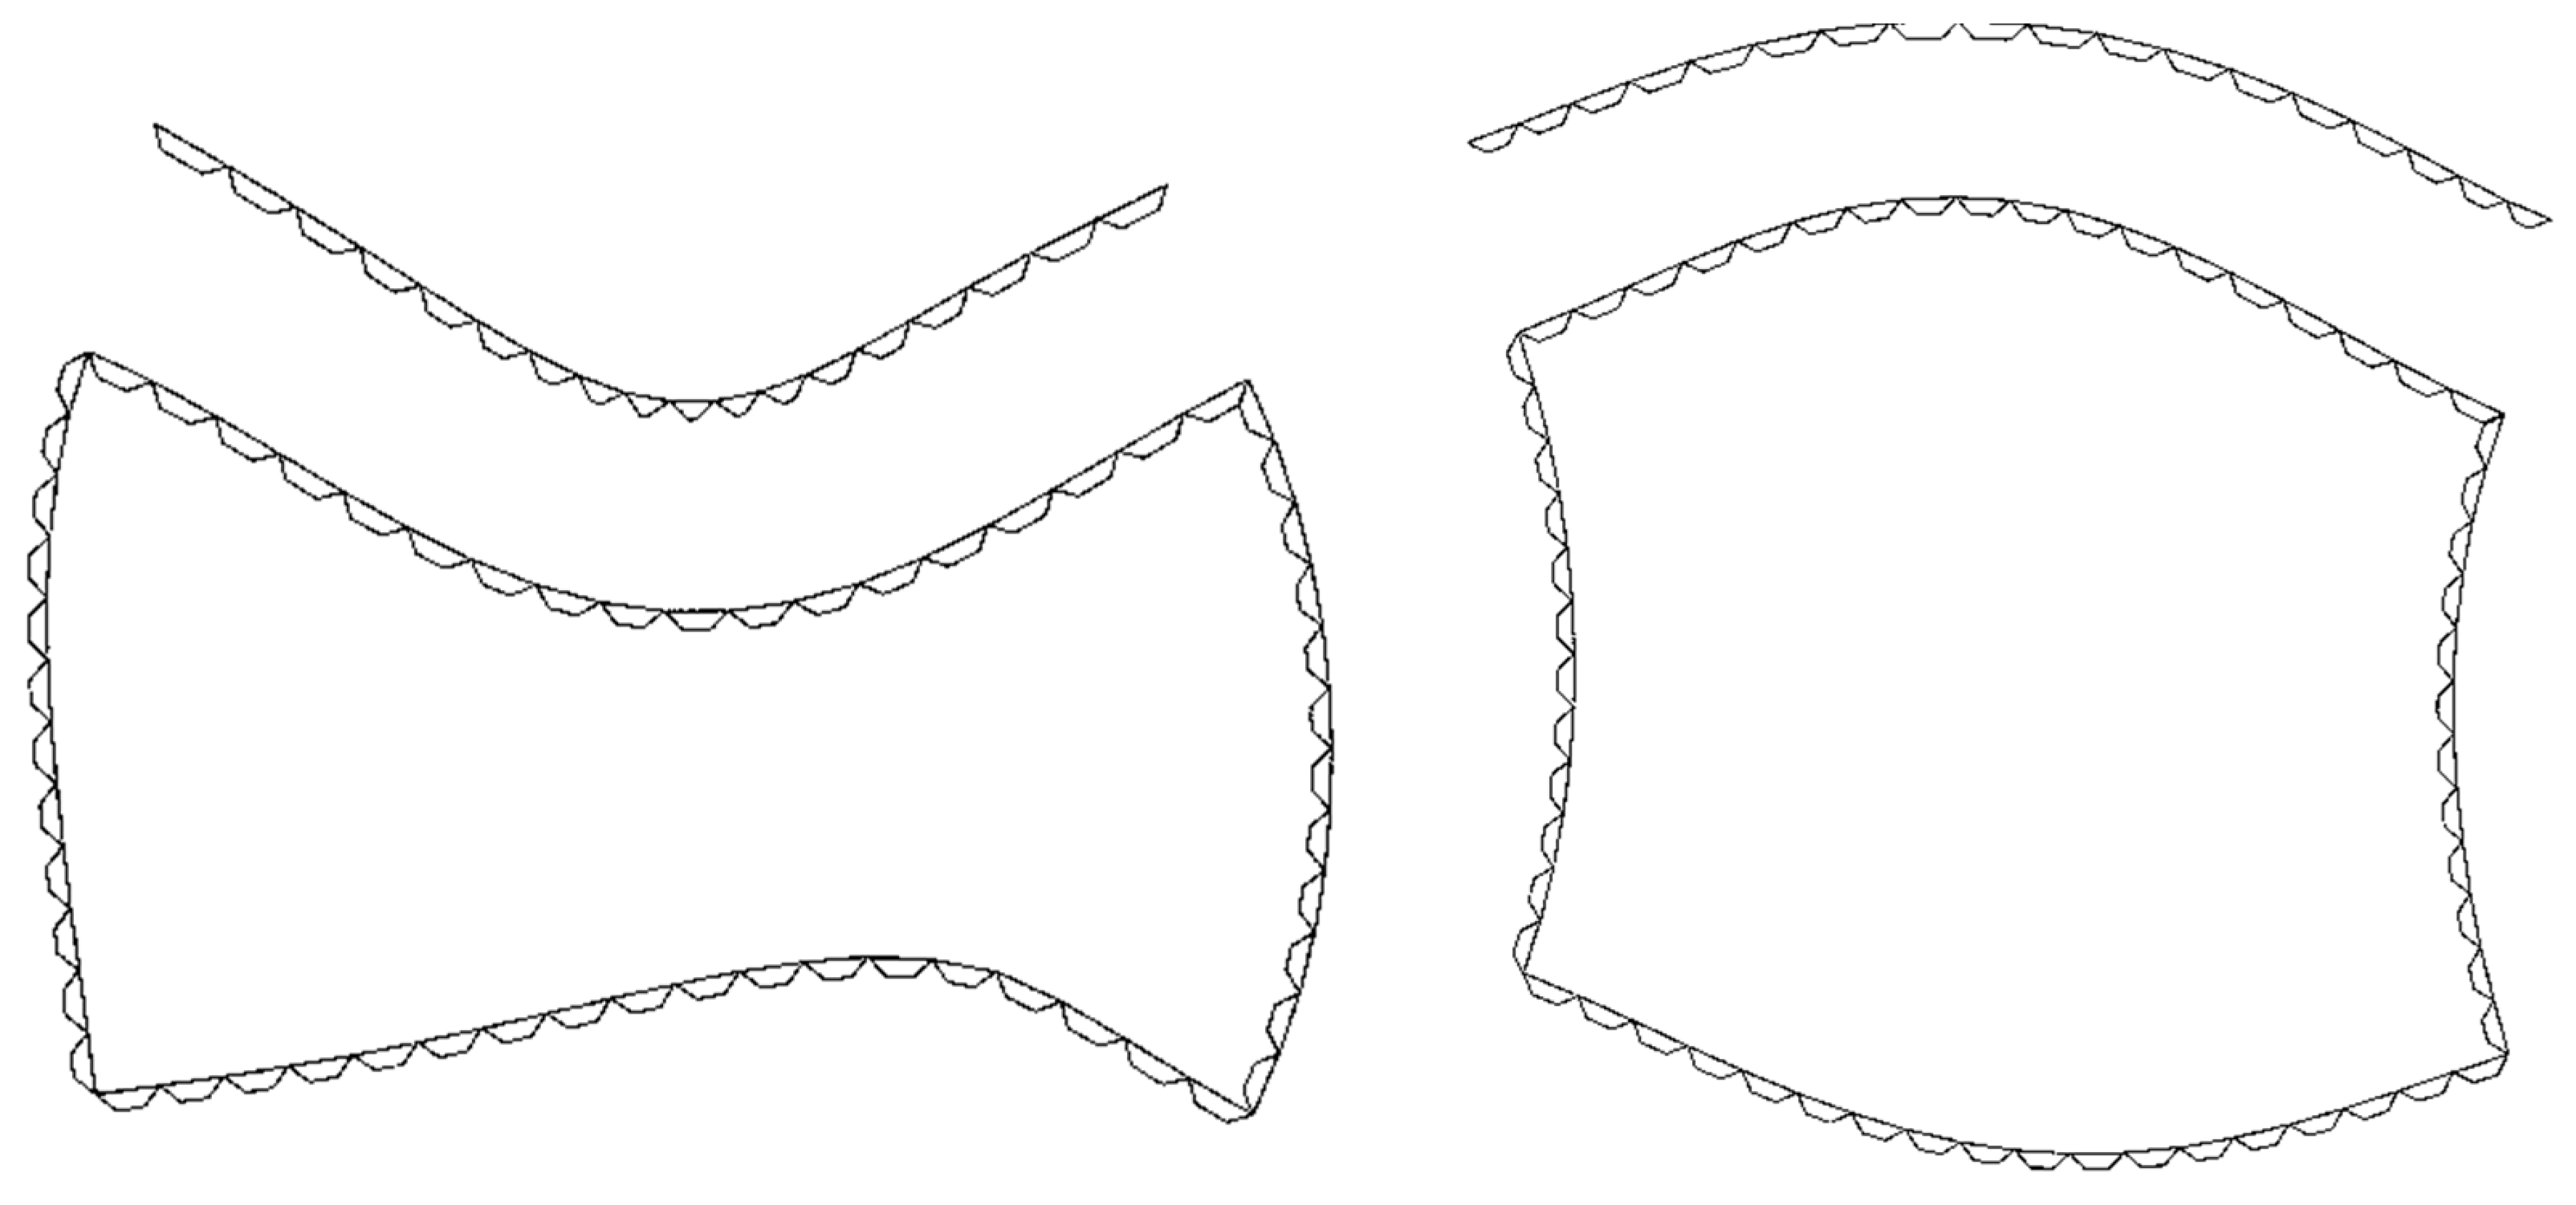
Embankments and cuts have been analysed for different inclinations. The vibration modes are shown in Figure 11 for an inclination of 45° or a height to width ratio of 1:1 respectively. It can be recognised that a considerable part of the waves are directed downwards to the interior of the soil whereas the surface waves are reduced. The frequency-dependent reduction ratios of the cuts in Figure 12a show values down to 1/4 compared to a surface line, independent of the inclination. The reduction begins at 15 Hz for all investigated cuts.
The railway lines on an embankment show a more frequency-dependent and inclination-dependent behaviour (Figure 12b). The reduction ratios start at a lower frequency and are stronger for steeper embankments. Reduction ratios of 0.5 or 0.6 are typical values for embankments, and also in [28] a cut was more effective than an embankment.
6. Railway Lines in a Tunnel and on a Bridge
The vibration mode of a tunnel in Figure 11c shows a reduction effect due to the wider tunnel invert of b = 6 m compared to the width of a surface line (b = 3 m). The excitation at depth generates less surface waves. The reduction ratio of the amplitudes is approximately at 1/3 compared to the surface line. Figure 13a shows also results for a „tunnel“ near the surface at 5 m depth (rather a concrete trough than a tunnel). The reduction is not as strong so that it may be concluded that the covering of the tunnel by a certain portion of the soil is necessary for the reduction effect.
The effects of a bridge line on the ground vibrations is demonstrated by two simple examples. The bridge span is simplified as a concrete plate of 0.5 m constant thickness and of varying span length which is clamped at both ends in a concrete frame of 6 m height on a corresponding foundation plate. The first to fourth resonance frequencies of the bridge span of Table 2 are also found as amplifications of the soil response (Figure 13b). The strong soil-structure interaction of the wide foundation plate shifts and considerably modifies the resonances of the bridge span. On the other hand, strong reductions can be observed due to a massive bridge pier (Figure 13b plus markers). The heavy mass and the compliant soil result in an eigenfrequency of 6 Hz and higher frequencies are strongly reduced.
These results are illustrative examples. The realistic bridge-pier-soil interaction needs a three-dimensional calculation [46] where the co-action of the eigenfrequencies of the span and the rigid mass (at about 10 Hz for the 2-dimensional analysis) are of importance for the frequencies and the damping of the combined eigenmodes.
7. Wave Propagation Sideway from a Tunnel Line by 2D-FEBEM Calculation
The excitation of waves by a tunnel line has been further analysed for different stiffnesses of the tunnel and the soil by the two-dimensional finite-element boundary-element method. A 9 m wide and 6 m high tunnel and the amplitudes on a horizontal propagation path in the interior of the soil are calculated for different thicknesses of the tunnel invert and walls and for different wave velocities of the soil. The Figure 14a,b shows the frequency-dependent reduction ratio of the tunnel excitation compared to a line load. As before, the reduction becomes stronger with increasing frequency, and minimum ratios of 0.1 are reached for stiff tunnels and soft soils. The reduction depends on the number of waves that are averaged over the effective width of the tunnel. This effective width can be somewhat increased by a stiffer tunnel invert. The stronger effect stems from the shorter wavelengths of the softer soil. The high-frequency reduction ratios can be 0.1 for a soft soil of 150 m/s, but almost no reduction can be found for a stiff soil of 500 m/s. (Note that the ratios greater than 1 are due to the interference pattern of the reference system. There is no soil-structure resonance effect for the tunnel.).
The wave propagation from an interior load has also been investigated by 3-dimensional calculations in wavenumber domain showing an overall reduction ratio of 0.5 compared to a surface load [47].
8. Conclusions
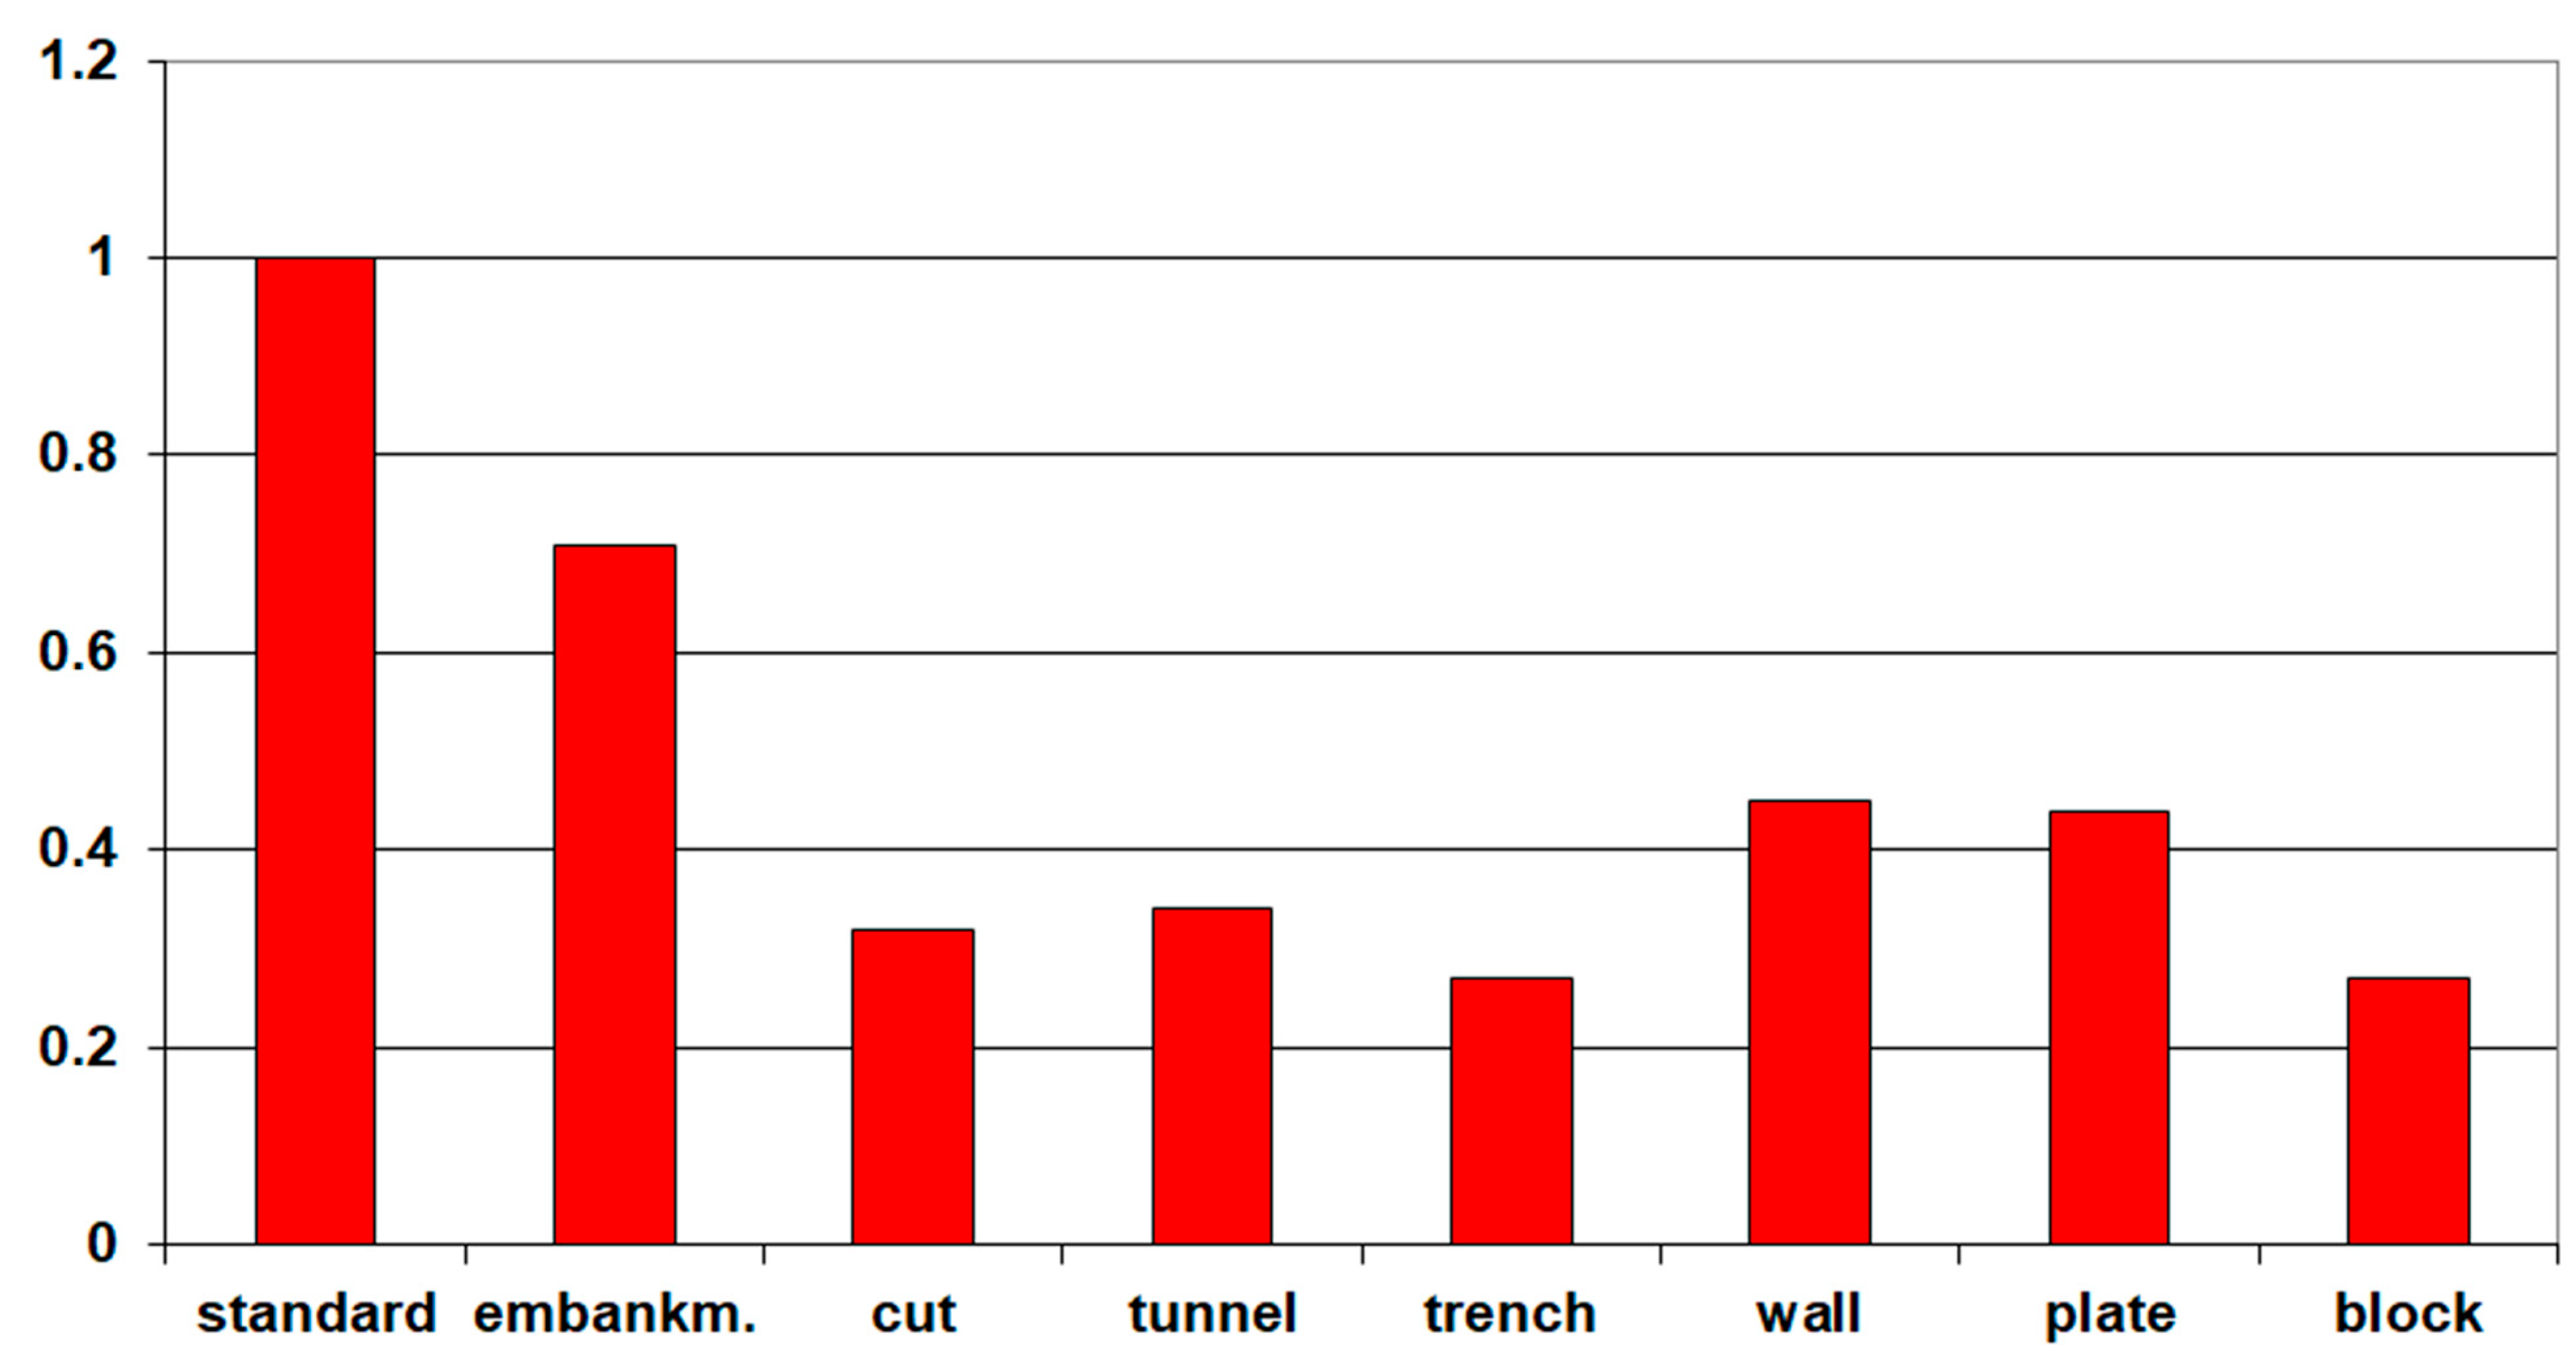
The effects of different railway lines and of different mitigation measures have been analysed by 2D thin-layer finite-element (Section 3, Section 4, Section 5 and Section 6), 2D boundary-element (Section 7), and by 3D combined finite-element boundary-element methods (Appendix A). The frequency-dependent reduction of the train-induced ground vibrations has been evaluated as an average over far-field surface points in comparison to a surface line without mitigation as the reference situations. Low frequencies are ususally not reduced, and the reduction ratio is decreasing with frequency. The strongest reductions expressed as the ratio of the amplitudes with changes to the amplitudes of the reference system go down to 0.1 at 80 Hz. A more realistic reduction is summarised in Figure 15 as an average over the high frequencies between 40 and 80 Hz. An embankment has an average reduction ratio of 0.7, wheras a cut and a tunnel have a stronger reduction ratio of 0.3 for the railway lines. Mitigation measures in the transmission path are effective with reduction ratios of 0.4 for plates and walls and 0.25 for a massive block. The reduction of a trench depends on the (compressional) stiffness of the infill and reaches 0.2 for very soft materials or for an open trench. Simultaneous measurements at a surface bridge and tunnel line have been performed and will be discussed in a companion paper together with the corresponding track stiffnesses calculated in the appendix of the present article. As pointed out by FEM and BEM calculations (and by measurements), the reduction of a tunnel line is a combination of different effects such as the depth of the excitation and the load distribution by the stiff track structure.
Funding
This research received no external funding.
Data Availability Statement
The data of this study are available on request from the author.
Acknowledgments
Thanks to S. Said who helped with some FEM calculations.
Conflicts of Interest
The author declares no conflict of interest.
Appendix A. Calculation of Dynamic Track Compliances by 3-Dimensional FEBEM
When comparing different railway lines, it must be observed that also the railway tracks are different, and the different vehicle-track interaction can also influence the excitation of the environmental vibrations. For comparison with the measurements in [48], a ballasted surface track, a ballast track on a bridge and a slab track in a tunnel are considered. All tracks have the same UIC60 rails with bending stiff-ness EIR = 6.4 × 10⁶ Nm2 and mass per length m′ = 60 kg/m, and the same concrete sleepers with EIS = 5.2 × 10⁶ Nm2 and m = 338 kg. For each track, the stiffness of the material under the track (the ballast or the subsoil of the slab) is varied.
Appendix A.1. Ballasted Track on the Surface of a Homogeneous Soil
The surface track consists of a 0.35 m ballast layer. The sub-soil has a shear wave velocity of vS = 300 m/s. The rail pads are rather stiff with kP = 300 kN/m. The ballast is varied as vS = 100, 150, 200, 300 m/s.
The dynamic compliances of the rails are given as amplitude and phase in Figure A1. Although the ballast stiffness is varied by a factor of 9, the static compliance of the rail is in the narrow range of u/F = 1.8 to 3.2 × 10⁻⁹ m/N, that means 0.2 to 0.3 mm displacement under a 100 kN axle load. The stiff ballast yields an almost constant compliance and only a small phase delay of 20°. All softer ballast materials result in a stronger phase delay and a related amplitude reduction starting at a certain frequency which is lower for the softer ballast (for example at 60 Hz for the softest ballast of vS = 100 m/s). Moreover, the softest ballast has the strongest contrast with the underlying soil of vS = 300 m/s, and this results in moderate amplifications of the track amplitudes.
Figure A1.
Compliances of different tracks: (a) ballasted track on the soil, (b) ballasted track on the bridge, (c) slab track on a sub-soil layer (compliance of the plate) variation in the ballast or subsoil vS = ☐ 100, ◯ 150, △ 200, +300 m/s in (a–c). Comparison of the rail compliances (d) for the ballasted track on the soil ☐, the ballasted track on the bridge ◯, and the slab track △.

Appendix A.2. Ballasted Track on a Bridge (Rigid Base)
The ballasted track is the same on the bridge as for the surface line. The bottom of the ballast layer is fixed, and the same variation of the ballast stiffness is analysed in Figure A1b. The rigid base reduces the static compliances of the ballasted tracks to values between u/F = 1.4 to 2.9 × 10⁻⁹ m/N. No radiation damping of the soil is present and only small phase values due to the material damping can be observed. Clear resonances occur for the softer ballast materials at f = 95 and 135 Hz for vS = 100 and 150 m/s. The phase decay at the resonance is stronger than for the surface line.
Appendix A.3. Slab Track in a Tunnel (on a Layer over Bedrock)
The slab track in the tunnel has a 0.6 m thick concrete plate which lies on a 1.5 m layer of softer soil material. The base is the tunnel invert which is assumed to be rigid. Medium soft rail pads of kP = 60 kN/m are used to compensate the stiff track plate. The compliance of the rail is ruled by these soft rail pads and is constant if the stiffness of the sub-soil is varied between vS = 100 and 300 m/s. Moreover it does not change its static value of u/F = 3.7 × 10⁻⁹ m/N with increasing frequency (see Figure A1d). The influence of the sub-soil can be clearly seen for the plate compliance under the axle load (Figure A1c). The massive plate yields low resonance frequencies of f = 20; 30; 40 and 60 Hz with the compliances of the different sub-soils. The amplitudes of the plate are much smaller than those of the rail. The amplitude ratio is 20 or 10% for the soft sub-soils and even less for the stiff sub-soils. Such strong differences between rail and sleeper displacements are only found for the tunnel track. The sleeper to rail displacement ratio of the ballasted tracks is at 33 to 67% for the bridge track line and at 50 to 77% for the surface line. The differences increase with a stiffer ballast material; but also with a softer rail pad.
Figure A1d shows the rail compliances of the three tracks, surface track with soft ballast, bridge track with soft ballast, and tunnel track with a thick plate over a stiff sub-soil. The rail compliance of the tunnel is increasing at 150 Hz, the end of the frequency range. The resonance of the rail on the soft rail pads is expected at about 200 Hz. Whereas the ballasted tracks show a phase drop below 100 Hz, the rail of the tunnel track shows almost no phase delay.
References
- Yoshioka, O. Basic characteristics of Shinkansen-induced ground vibration and its reduction measures. In Proceedings of the Wave 2000, Wave Propagation, Moving Load, Vibration Reduction, Bochum, Germany, 13–15 December 2000; pp. 219–237. [Google Scholar]
- Wu, Y.; Yang, Y. A semi-analytical approach for analyzing ground vibrations caused by trains moving over elevated bridges. Soil Dyn. Earthq. Eng. 2004, 24, 949–962. [Google Scholar] [CrossRef]
- Takemiya, H.; Bian, X. Shinkansen high-speed train induced ground vibrations in view of viaduct–ground interaction. Soil Dyn. Earthq. Eng. 2007, 27, 506–520. [Google Scholar] [CrossRef]
- Ju, S. Finite element analysis of structure borne vibration from high-speed train. Soil Dyn. Earthq. Eng. 2007, 27, 259–273. [Google Scholar]
- Chen, Y.; Ju, S.; Ni, S.; Shen, Y. Prediction methodology for ground vibration induced by passing trains on bridge structures. J. Sound Vib. 2007, 302, 806–820. [Google Scholar]
- Xing, M.; Wang, P.; Zhao, C.; Wu, X.; Kang, X. Ground-borne vibration generated by high-speed train viaduct systems in soft-upper/hard-lower rock strata. J. Cent. South Univ. 2021, 28, 2140–2157. [Google Scholar] [CrossRef]
- Duval, G. Cartographie des Champs Vibratoires à la Surface des sols en Milieu Urbain: Application Ferroviaire et Chantiers. Ph.D. Thesis, Université de Lyon, Lyon, France, 2022. [Google Scholar]
- Ma, M.; Xu, L.; Du, L.; Wu, Z.; Tan, X. Prediction of building vibration induced by metro trains running in a curved tunnel. J. Vib. Control 2021, 27, 515–528. [Google Scholar]
- Degrande, G.; Clouteau, D.; Othman, R.; Arnst, M.; Chebli, H. A numerical model for ground-borne vibrations from underground railway traffic based on a periodic finite element-boundary element formulation. J. Sound Vib. 2006, 293, 645–666. [Google Scholar] [CrossRef]
- Gupta, S.; van den Berghe, H.; Lombaert, G.; Degrande, G. Numerical modelling of vibrations from a Thalys high speed train in the Groene Hart tunnel. Soil Dyn. Earthq. Eng. 2010, 30, 82–97. [Google Scholar] [CrossRef]
- Kuo, K. Vibration from Underground Railways: Considering Piled Foundations and Twin Tunnels. Ph.D. Thesis, University of Cambridge, UK, 2010. [Google Scholar]
- Clot, A. A dynamical Model of a Double-Deck Circular Tunnel Embedded in a Full Space. Ph.D. Thesis, Universitat Politecnica de Catalunya, Barcelona, Spain, 2014. [Google Scholar]
- Villot, M.; Augis, E.; Guigou-Carter, C.; Jean, P.; Ropars, P.; Bailhache, S.; Gallais, C. Vibration emission from railway lines in tunnel—Characterization and prediction. Int. J. Rail Transp. 2016, 4, 208–228. [Google Scholar] [CrossRef]
- Hussein, M.; Hunt, H. A numerical model to calculating vibration from a railway tunnel embedded in a full-space. J. Sound Vib. 2007, 305, 401–431. [Google Scholar]
- Lopes, P.; Alves Costa, P.; Ferraz, M.; Calcada, R.; Silva Cardoso, A. Numerical modeling of vibrations induced by railway traffic in tunnels: From the source to the nearby buildings. Soil Dyn. Earthq. Eng. 2014, 61–62, 269–285. [Google Scholar] [CrossRef]
- Hussein, M.; Hunt, H.; Kuo, K.; Alves Costa, P.; Barbosa, J. The use of sub-modelling technique to calculate vibration in buildings from underground railways. J. Rail Rapid Transit 2015, 229, 303–314. [Google Scholar]
- Galvin, P.; Romero, A.; Dominguez, J. Fully three-dimensional analysis of high-speed train-track-soil-structure dynamic interaction. J. Sound Vib. 2010, 329, 5147–5163. [Google Scholar] [CrossRef]
- Auersch, L.; Schmid, G. A simple boundary element formulation and its application to wavefield excited soil-structure interaction. Earthq. Eng. Struct. Dyn. 1990, 19, 931–947. [Google Scholar]
- Rücker, W. Ermittlung der Schwingungserregung Beim Betrieb Schienengebundener Fahrzeuge in Tunneln Sowie Untersuchung des Einflusses Einzelner Parameter auf die Auswirkung von Erschütterungen im Tunnel und Dessen Umgebung. Ph.D. Thesis, TU Berlin, Berlin, Germany, 1979. [Google Scholar]
- Tahadjodi, A. Beitrag zur Optimierung von Tunnelbauwerken in Dynamischer Hinsicht—Bemessungsdiagramme. Ph.D. Thesis, Universität Hannover, Hannover, Germany, 1989. [Google Scholar]
- Auersch, L. Advanced and simple boundary-element method for the soil and its application to railway dynamics. In Proceedings of the COMPDYN 2007, Computational Methods in Structural Dynamics and Earthquake Engineering, Rethymnon, Greece, 13–15 June 2007; pp. 1–12. [Google Scholar]
- Galvin, P.; Francois, S.; Schevenels, M.; Bongini, E.; Degrande, G.; Lombaert, G. A 2.5D coupled FE-BE model for the prediction of railway induced vibrations. Soil Dyn. Earthq. Eng. 2010, 30, 1500–1512. [Google Scholar] [CrossRef]
- Romero, A.; Galvín, P.; Antonio, J.; Dominguez, J.; Tadeu, A. Modelling of acoustic and elastic wave propagation from underground structures using a 2.5D BEM-FEM approach. Eng. Anal. Bound. Elem. 2017, 76, 26–39. [Google Scholar]
- Korzeb, J.; Chudzikiewicz, A. Evaluation of the vibration impact in the transport infrastructure environment. Arch. Appl. Mech. 2015, 85, 1331–1342. [Google Scholar]
- Kuzniar, K.; Tatara, T. Full-scale long-term monitoring of mine-induced vibrations for soil-structure interaction research using dimensionless response spectra. Case Stud. Constr. Mater. 2022, 16, e00801. [Google Scholar] [CrossRef]
- Xu, L. On dynamic analysis method for large scale train-track-substructure interaction. Railw. Eng. Sci. 2022, 30, 162–182. [Google Scholar]
- Mao, K.; Wang, T.; Ru, Q.; Li, Y. Comparative feature analysis of ground surface vibration induced by high-speed train running on viaduct and embankment. Appl. Mech. Mater. 2014, 638–640, 1229–1232. [Google Scholar] [CrossRef]
- Tamborek, A. Erschütterungsausbreitung vom Rad/Schiene-System bei Damm, Einschnitt und Ebene. Ph.D. Thesis, Universität Karlsruhe, Karlsruhe, Germany, 1992. [Google Scholar]
- Woods, R. Screening of Elastic Surface Waves by Trenches. Ph.D. Thesis, University of Michigan, Ann Arbor, MI, USA, 1967. [Google Scholar]
- Dolling, H. Die Abschirmung von Erschütterungen durch Bodenschlitze. Ph.D. Thesis, TU Berlin, Berlin, Germany, 1969. [Google Scholar]
- Beskos, D.; Dasgupta, G.; Vardoulakis, I. Vibration isolation using open or filled trenches, Part 1: 2-D homogeneous soil. Comput. Mech. 1986, 1, 43–63. [Google Scholar]
- Takemiya, H.; Fujiwara, A. Wave propagation/impediment in a stratum and wave impeding block (WIB) measured for SSI response reduction. Soil Dyn. Earthq. Eng. 1994, 13, 49–61. [Google Scholar] [CrossRef]
- Yang, Y.; Hung, H. A parametric study of wave barriers for reduction of train-induced vibrations. Int. J. Numer. Methods Eng. 1997, 40, 3729–3747. [Google Scholar]
- Thompson, D.; Jiang, J.; Toward, M.; Hussein, M.; Ntotsios, E.; Dijckman, A.; Coulier, P.; Lombaert, G.; Degrande, G. Reducing railway-induced ground-borne vibration by using open trenches and soft-filled barriers. Soil Dyn. Earthq. Eng. 2016, 88, 45–59. [Google Scholar]
- Guo, W.; Bai, Z.; Wang, X.; Liu, H.; Bu, D.; Guo, Z.; Hou, W.; Yu, Z. A combination strategy of hollow-closed-wall in-filled trench and elastic bearing for reducing environmental vibration induced by high-speed train. Soil Dyn. Earthq. Eng. 2020, 133, 106136. [Google Scholar] [CrossRef]
- Ouakka, S.; Verlinden, O.; Kouroussis, G. Railway ground vibration and mitigation measures—Benchmarking of best practices. Railw. Eng. Sci. 2022, 30, 1–22. [Google Scholar]
- Efthymiou, G.; Vrettos, C. Numerische Untersuchung zur Abschirmwirkung von Einzelpfählen und Pfahlgruppen im Wellenfeld einer stationären oder bewegten harmonischen Last (Numerical investigations on the shielding efficiency of single piles and pile groups in the wave field of a stationary or moving harmonic load). Bautechnik 2022, 99, 249–261. [Google Scholar]
- Waas, G. Linear Two-Dimensional Analysis of Soil Dynamic Problems in Semi-Infinite Media. Ph.D. Thesis, University of California, Berkeley, CA, USA, 1972. [Google Scholar]
- Kausel, E. Forced Vibrations of Circular Foundations on Layered Media. Ph.D. Thesis, Massachusetts Institute of Technology, Cambridge, MA, USA, 1974. [Google Scholar]
- Lysmer, J.; Kuhlemeyer, R. Finite Dynamic Model for Infinite Media. J. Eng. Mech. Div. ASCE 1969, 95, 859–877. [Google Scholar]
- Auersch, L. Wave propagation in layered soil: Theoretical solution in wavenumber domain and experimental results of hammer and railway traffic excitation. J. Sound Vib. 1994, 173, 233–264. [Google Scholar] [CrossRef]
- Auersch, L. Dynamics of the railway track and the underlying soil: The boundary-element solution, theoretical results and their experimental verification. Veh. Syst. Dyn. 2005, 43, 671–695. [Google Scholar] [CrossRef]
- Auersch, L. The excitation of ground vibration by rail traffic: Theory of vehicle-track-soil interaction and measurements on high-speed lines. J. Sound Vib. 2005, 284, 103–132. [Google Scholar] [CrossRef]
- Auersch, L. Mitigation of railway induced vibration at the track, in the transmission path through the soil and at the building. Procedia Eng. 2017, 199, 2312–2317. [Google Scholar] [CrossRef]
- Haupt, W. Verhalten von Oberflächenwellen im Inhomogenen Halbraum mit Besonderer Berücksichtigung der Wellenabschirmung. Ph.D. Thesis, Universität Karlsruhe, Karlsruhe, Germany, 1978. [Google Scholar]
- Heiland, T.; Aji, H.; Wuttke, F.; Stempniewski, L.; Stark, A. Influence of soil-structure interaction on the dynamic characteristics of railroad frame bridges. Soil Dyn. Earthq. Eng. 2023, 167, 107800. [Google Scholar] [CrossRef]
- Auersch, L. Railway-induced ground and building vibrations—Analysis in frequency-wavenumber domain and fast prediction with approximate models. In Proceedings of the ISMA 2022, KU Leuven, Leuven, Belgium, 12–14 September 2022; pp. 3234–3246. [Google Scholar]
- Auersch, L. The dynamic train-track interaction on a bridge and in a tunnel compared with the simultaneous vehicle, track, and soil measurements at a surface line. Appl. Sci. 2023; in preparation. [Google Scholar]
Figure 1.
Finite-element model of a tunnel, the interior soil and a building; (the thin layers at the left and right boundary and the viscous dampers at the bottom are not shown).
Figure 1.
Finite-element model of a tunnel, the interior soil and a building; (the thin layers at the left and right boundary and the viscous dampers at the bottom are not shown).
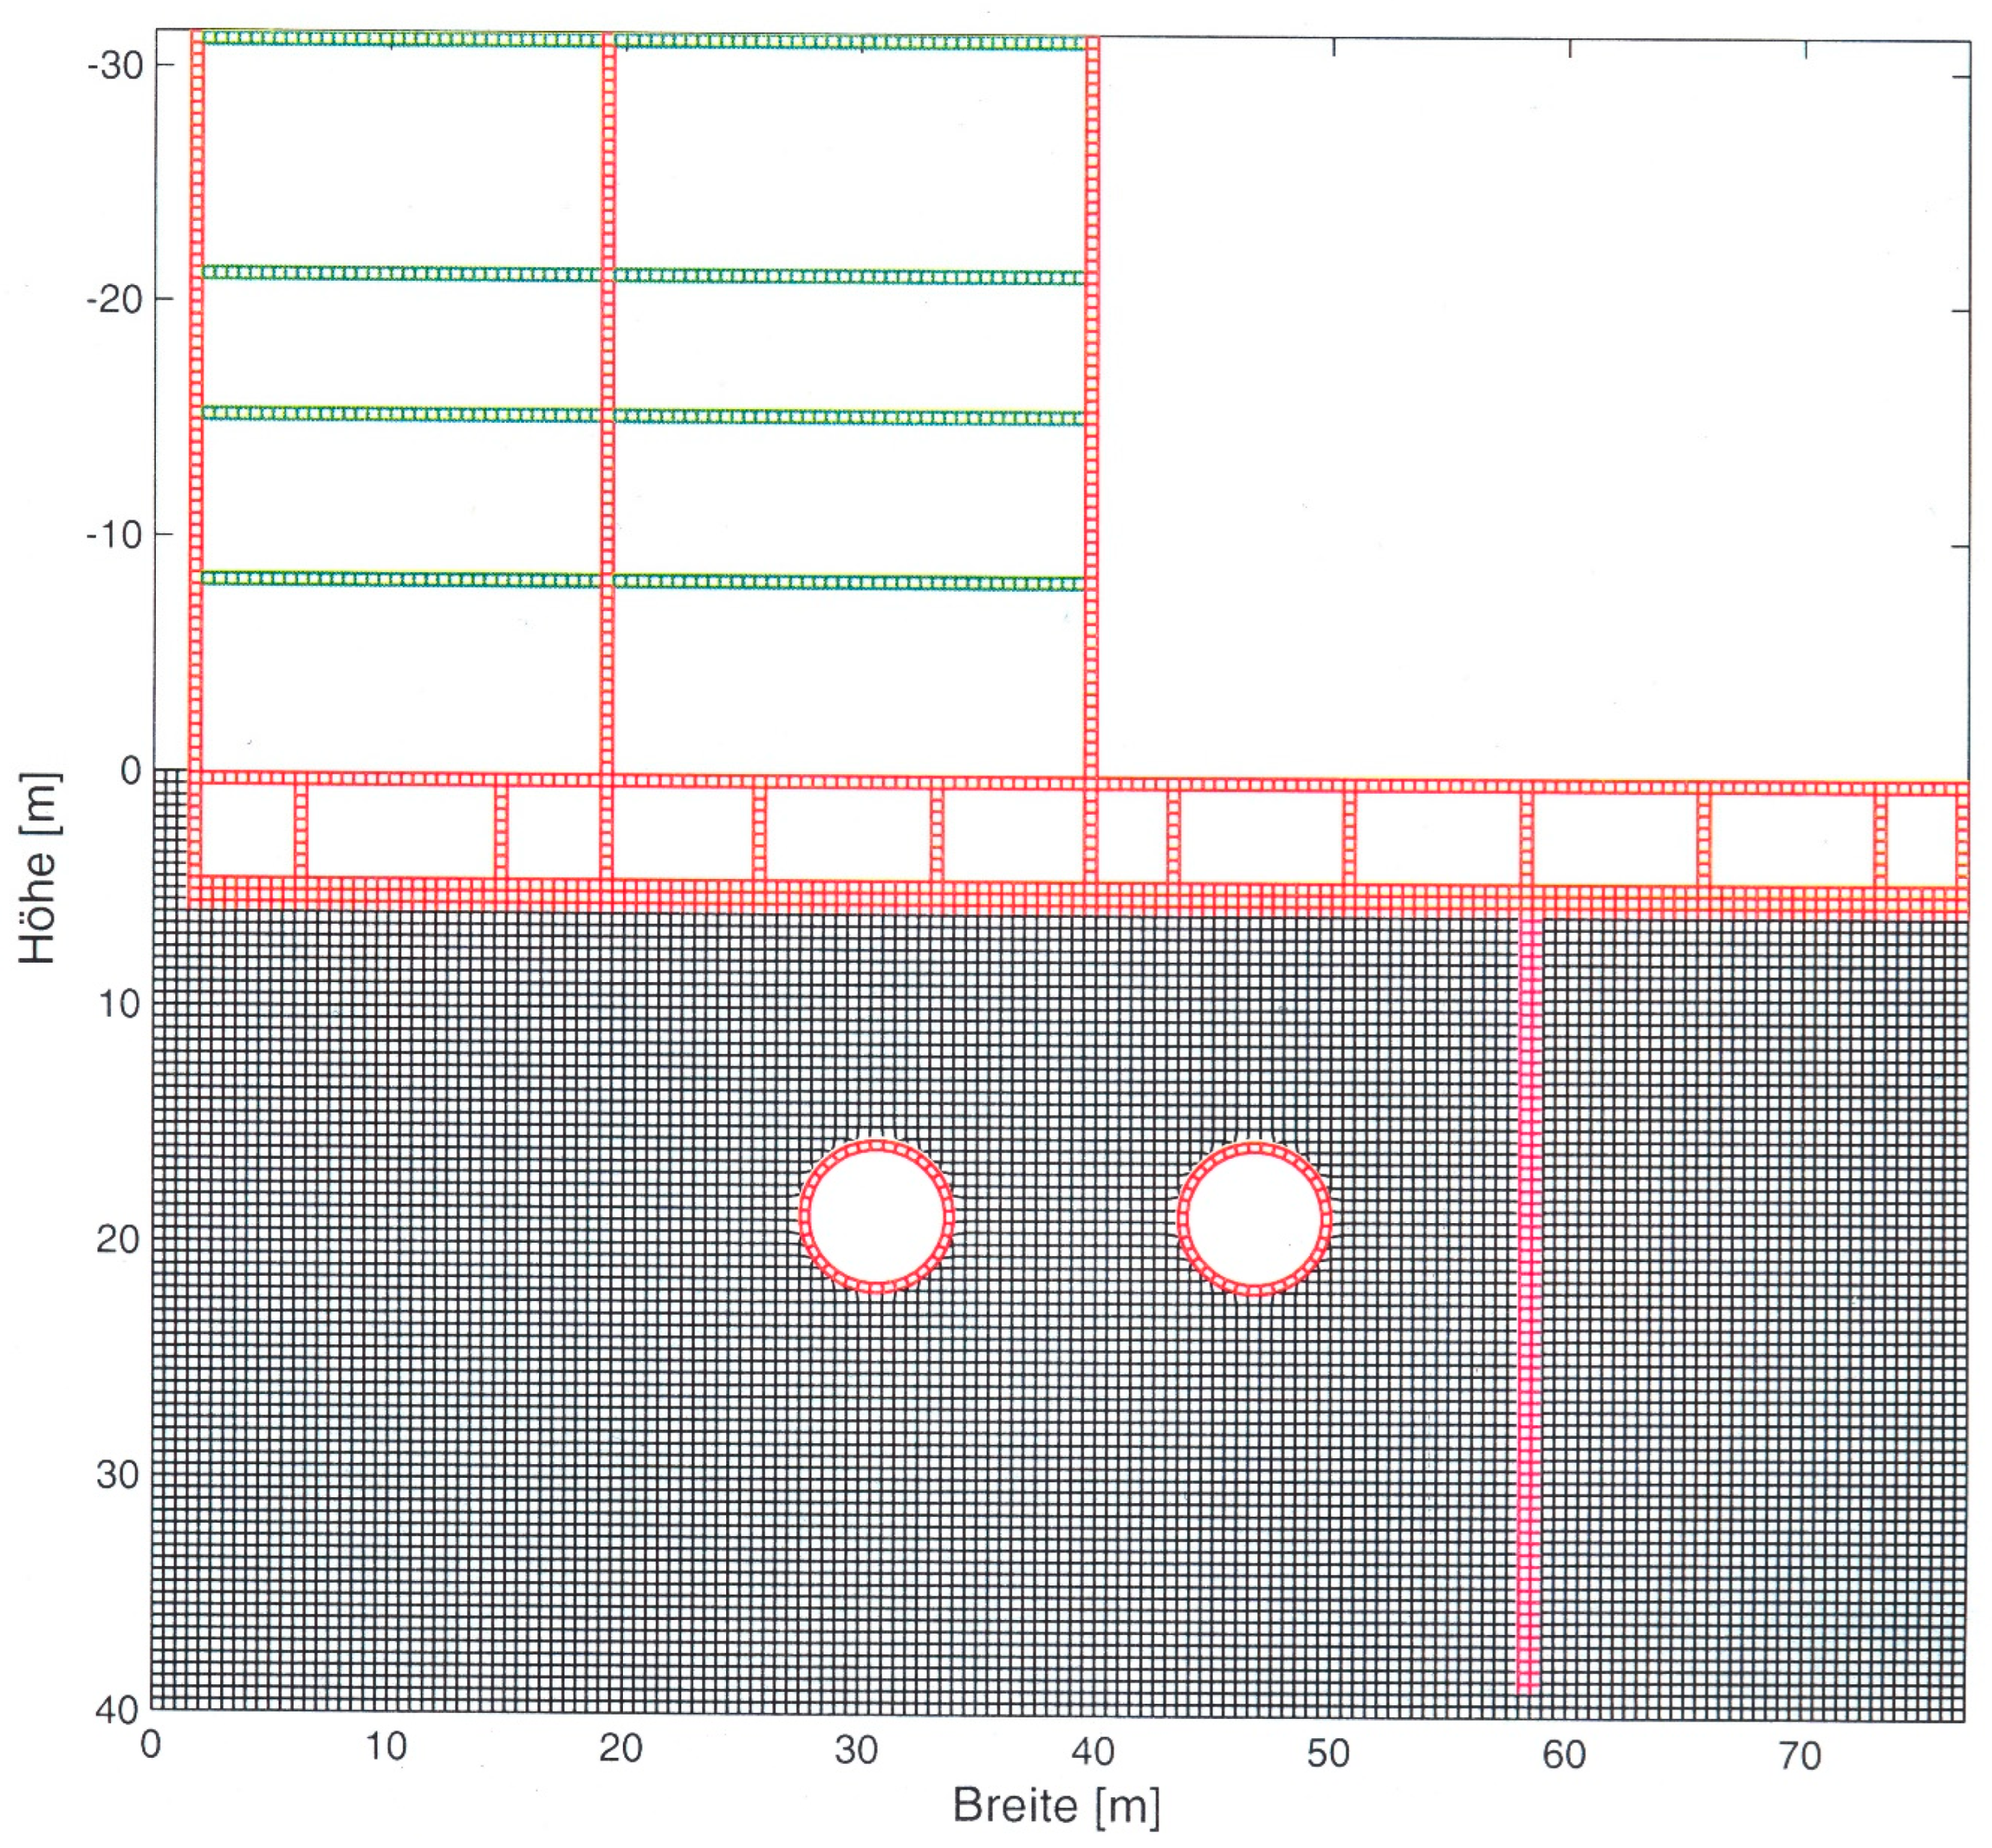
Figure 2.
Boundary-element model of a tunnel, the soil is represented by the full-space solution and the stress-free surface above the tunnel has to be modelled.
Figure 2.
Boundary-element model of a tunnel, the soil is represented by the full-space solution and the stress-free surface above the tunnel has to be modelled.

Figure 3.
Finite-element model of a railway track including 2 rails, 11 sleepers with 22 rail pads, under sleeper pads, ballast, under-ballast mat, the soil is represented by the boundary-element method and the Greens’ functions of the half-space.
Figure 3.
Finite-element model of a railway track including 2 rails, 11 sleepers with 22 rail pads, under sleeper pads, ballast, under-ballast mat, the soil is represented by the boundary-element method and the Greens’ functions of the half-space.
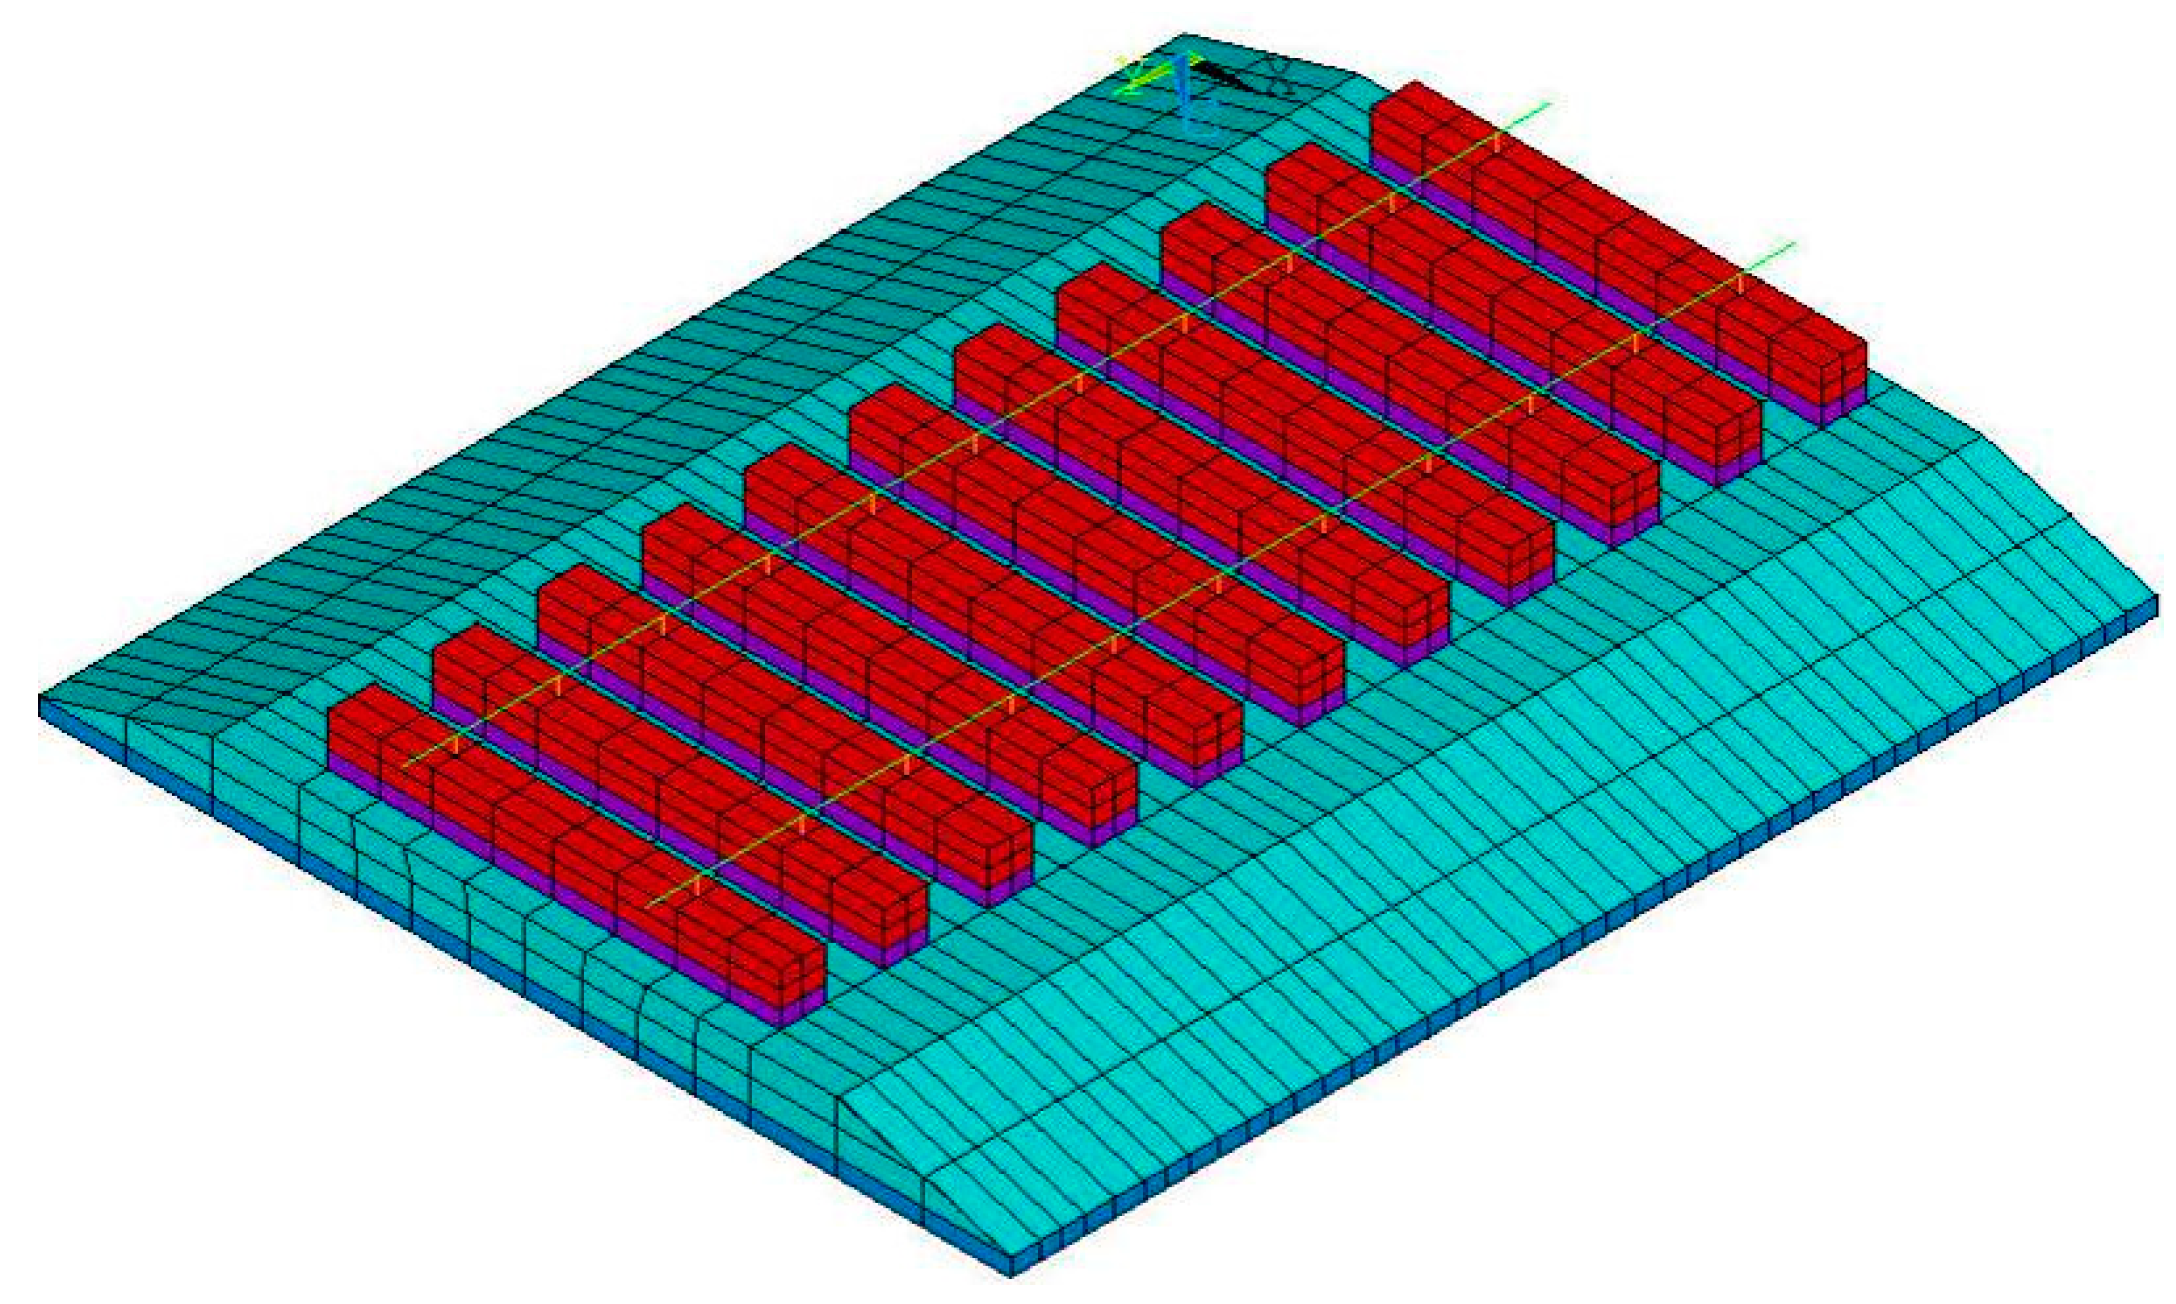
Figure 4.
The vibration mode at 80 Hz for (a) a rigid strip foundation (representing the track) and (b) a concentrated line load.
Figure 4.
The vibration mode at 80 Hz for (a) a rigid strip foundation (representing the track) and (b) a concentrated line load.
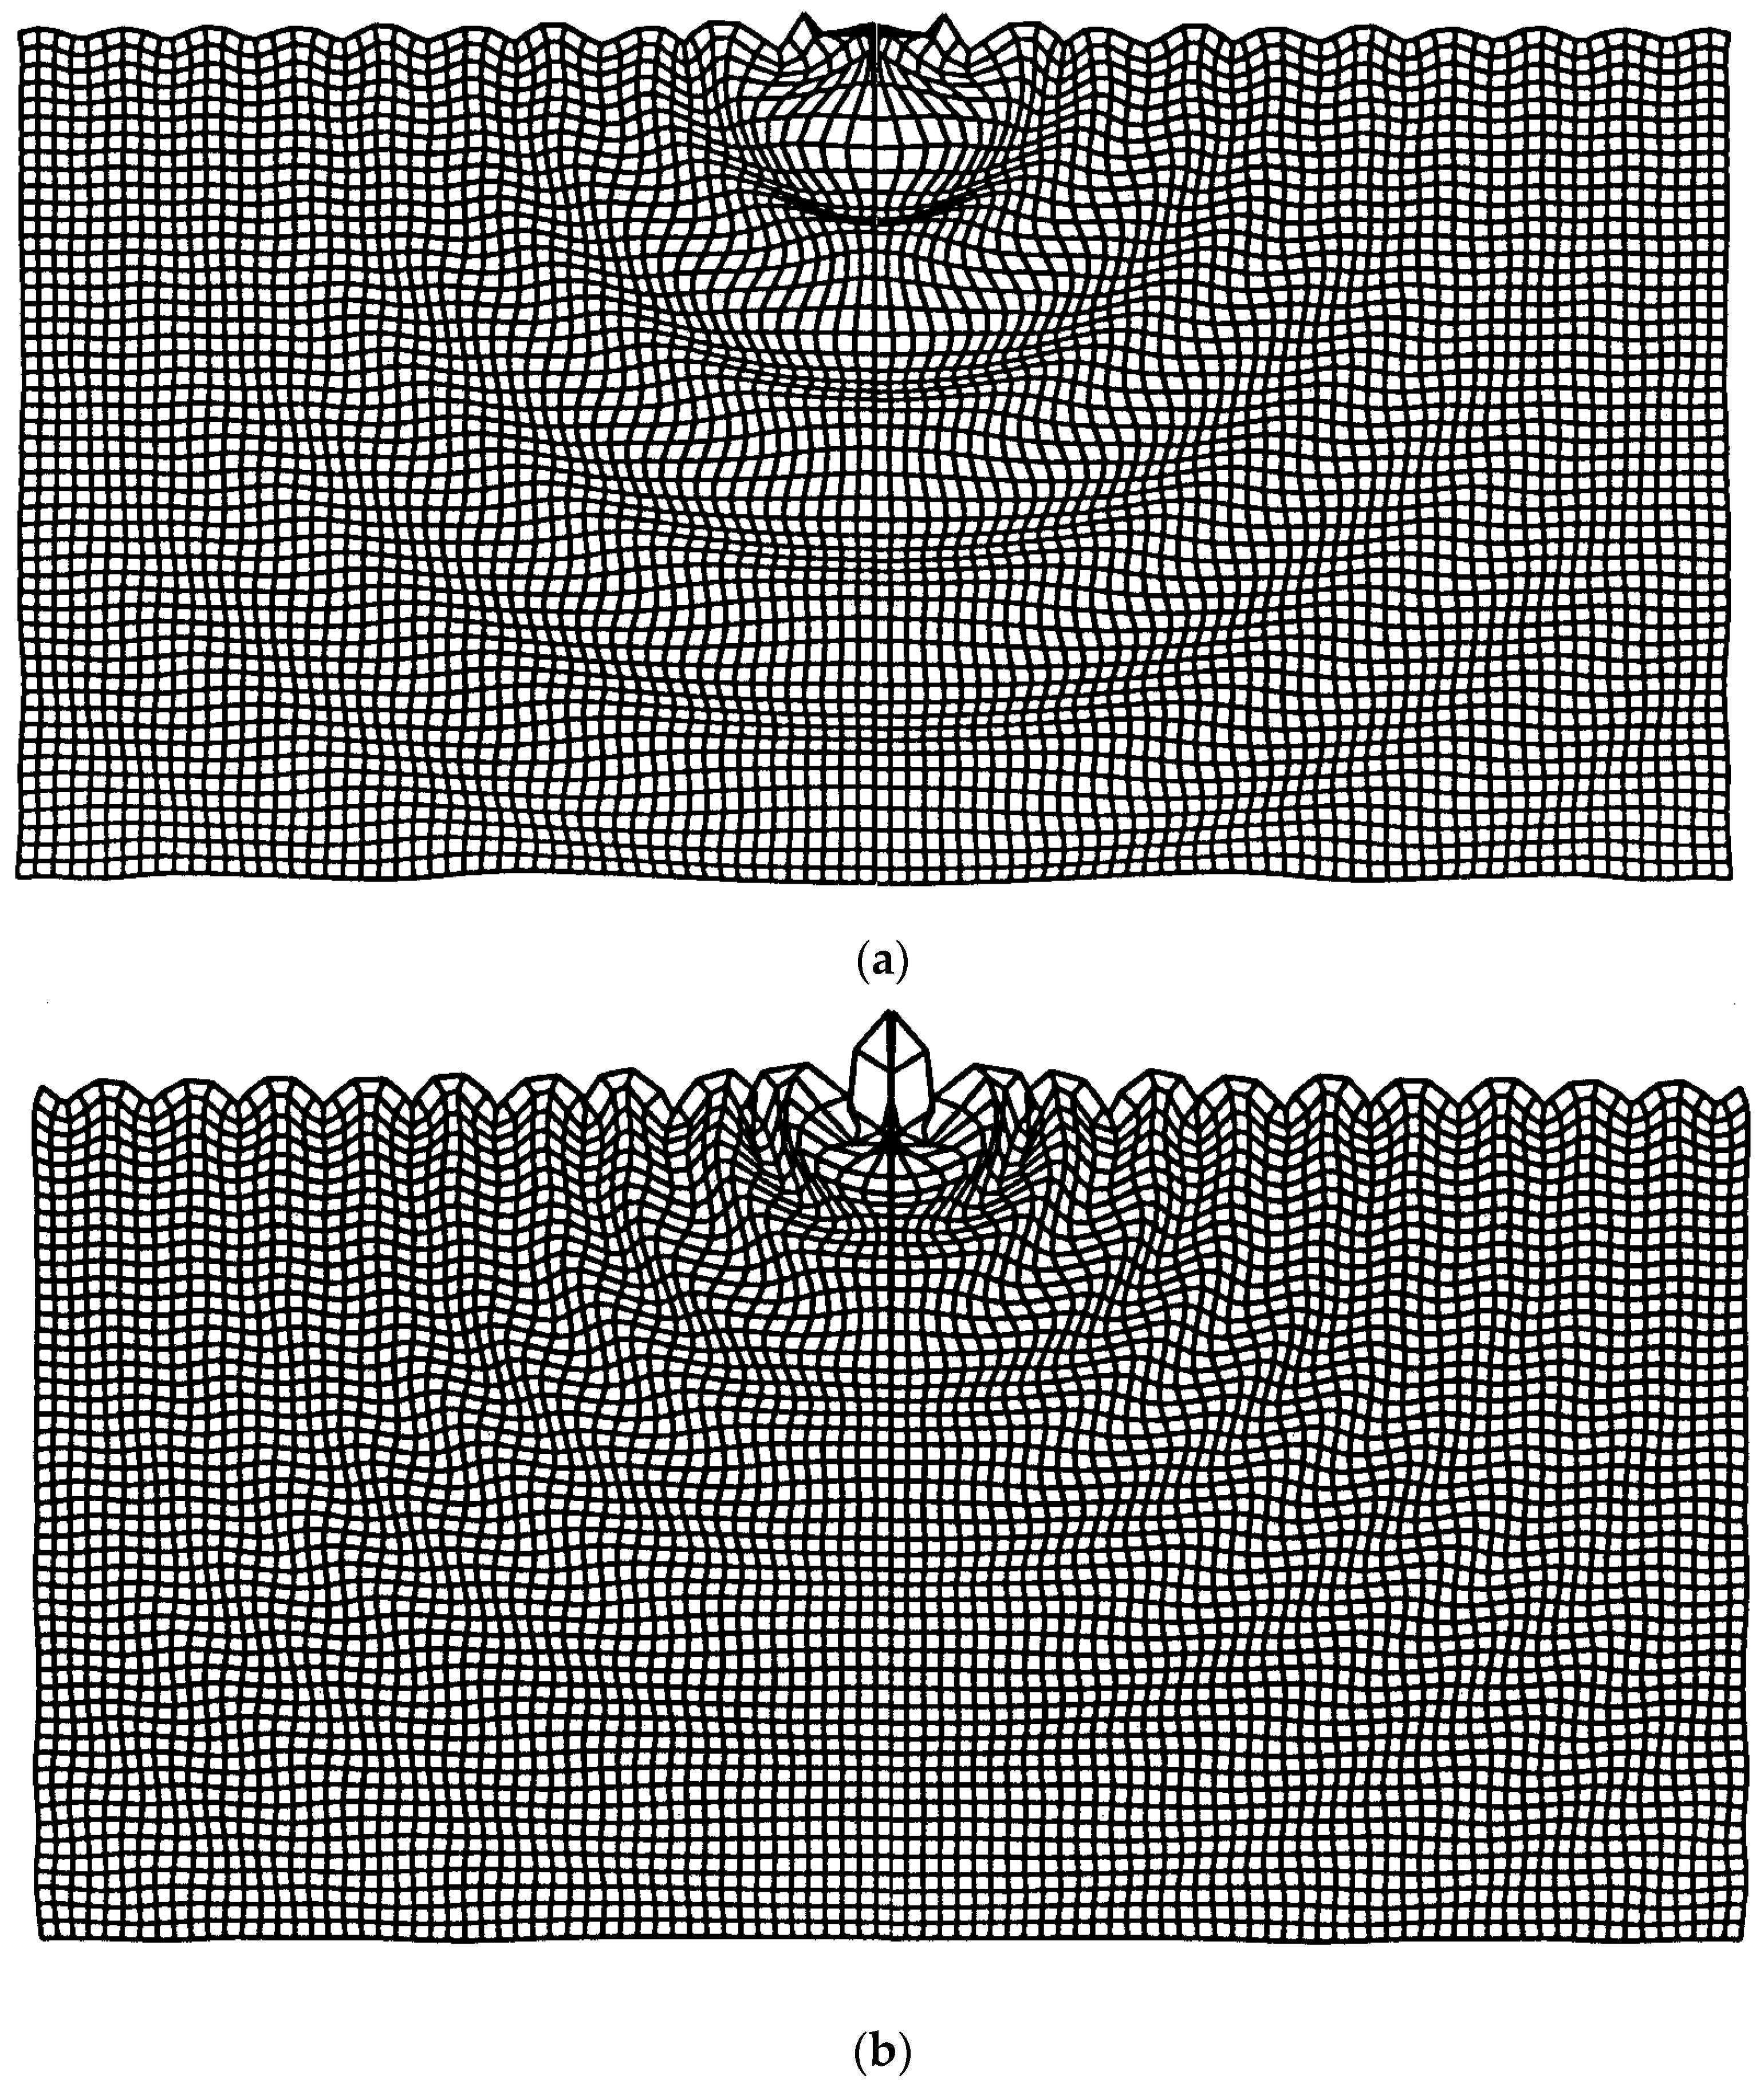
Figure 5.
The soil amplitudes v averaged at 20 to 30 m distance for ☐ a strip load of b = 3 m, ◯ a strip load of b = 5 m, and △ a load on a rigid strip foundation (b = 3 m), compared to the averaged reference amplitudes vR of a line load (the frequency-dependent reduction effect v/vR).
Figure 5.
The soil amplitudes v averaged at 20 to 30 m distance for ☐ a strip load of b = 3 m, ◯ a strip load of b = 5 m, and △ a load on a rigid strip foundation (b = 3 m), compared to the averaged reference amplitudes vR of a line load (the frequency-dependent reduction effect v/vR).

Figure 6.
The vibration mode of an open trench at (a) 20, (b) 40, (c) 60, and (d) 80 Hz.


Figure 7.
The frequency-dependent reduction effect of a 9 m deep and 0.5 m thick trench with different infill materials: (a) variation in the mass density + ρ = 0, and the Poisson ratio △ ν = 0 (k″ constant), ◯ standard values ρ = 2000 kg/m3, ν = 0.33; (b) simultaneous variation in the thickness, t, and the elasticity modulus E ~ t, t = ◯ 0.5 △ 0.25, + 0.05 m, keeping the stiffness per area k″ = 16 MN/m3 constant; (c) variation in the stiffness per area k″ = ◯ 160, △ 64, + 32, × 16, ◇ 1.6, ☐ 0 MN/m3; (d) different concrete obstacles ◯ wall (9 m × 0.5 m), △ plate (0.5 m × 9 m), + block (5 m × 5 m).
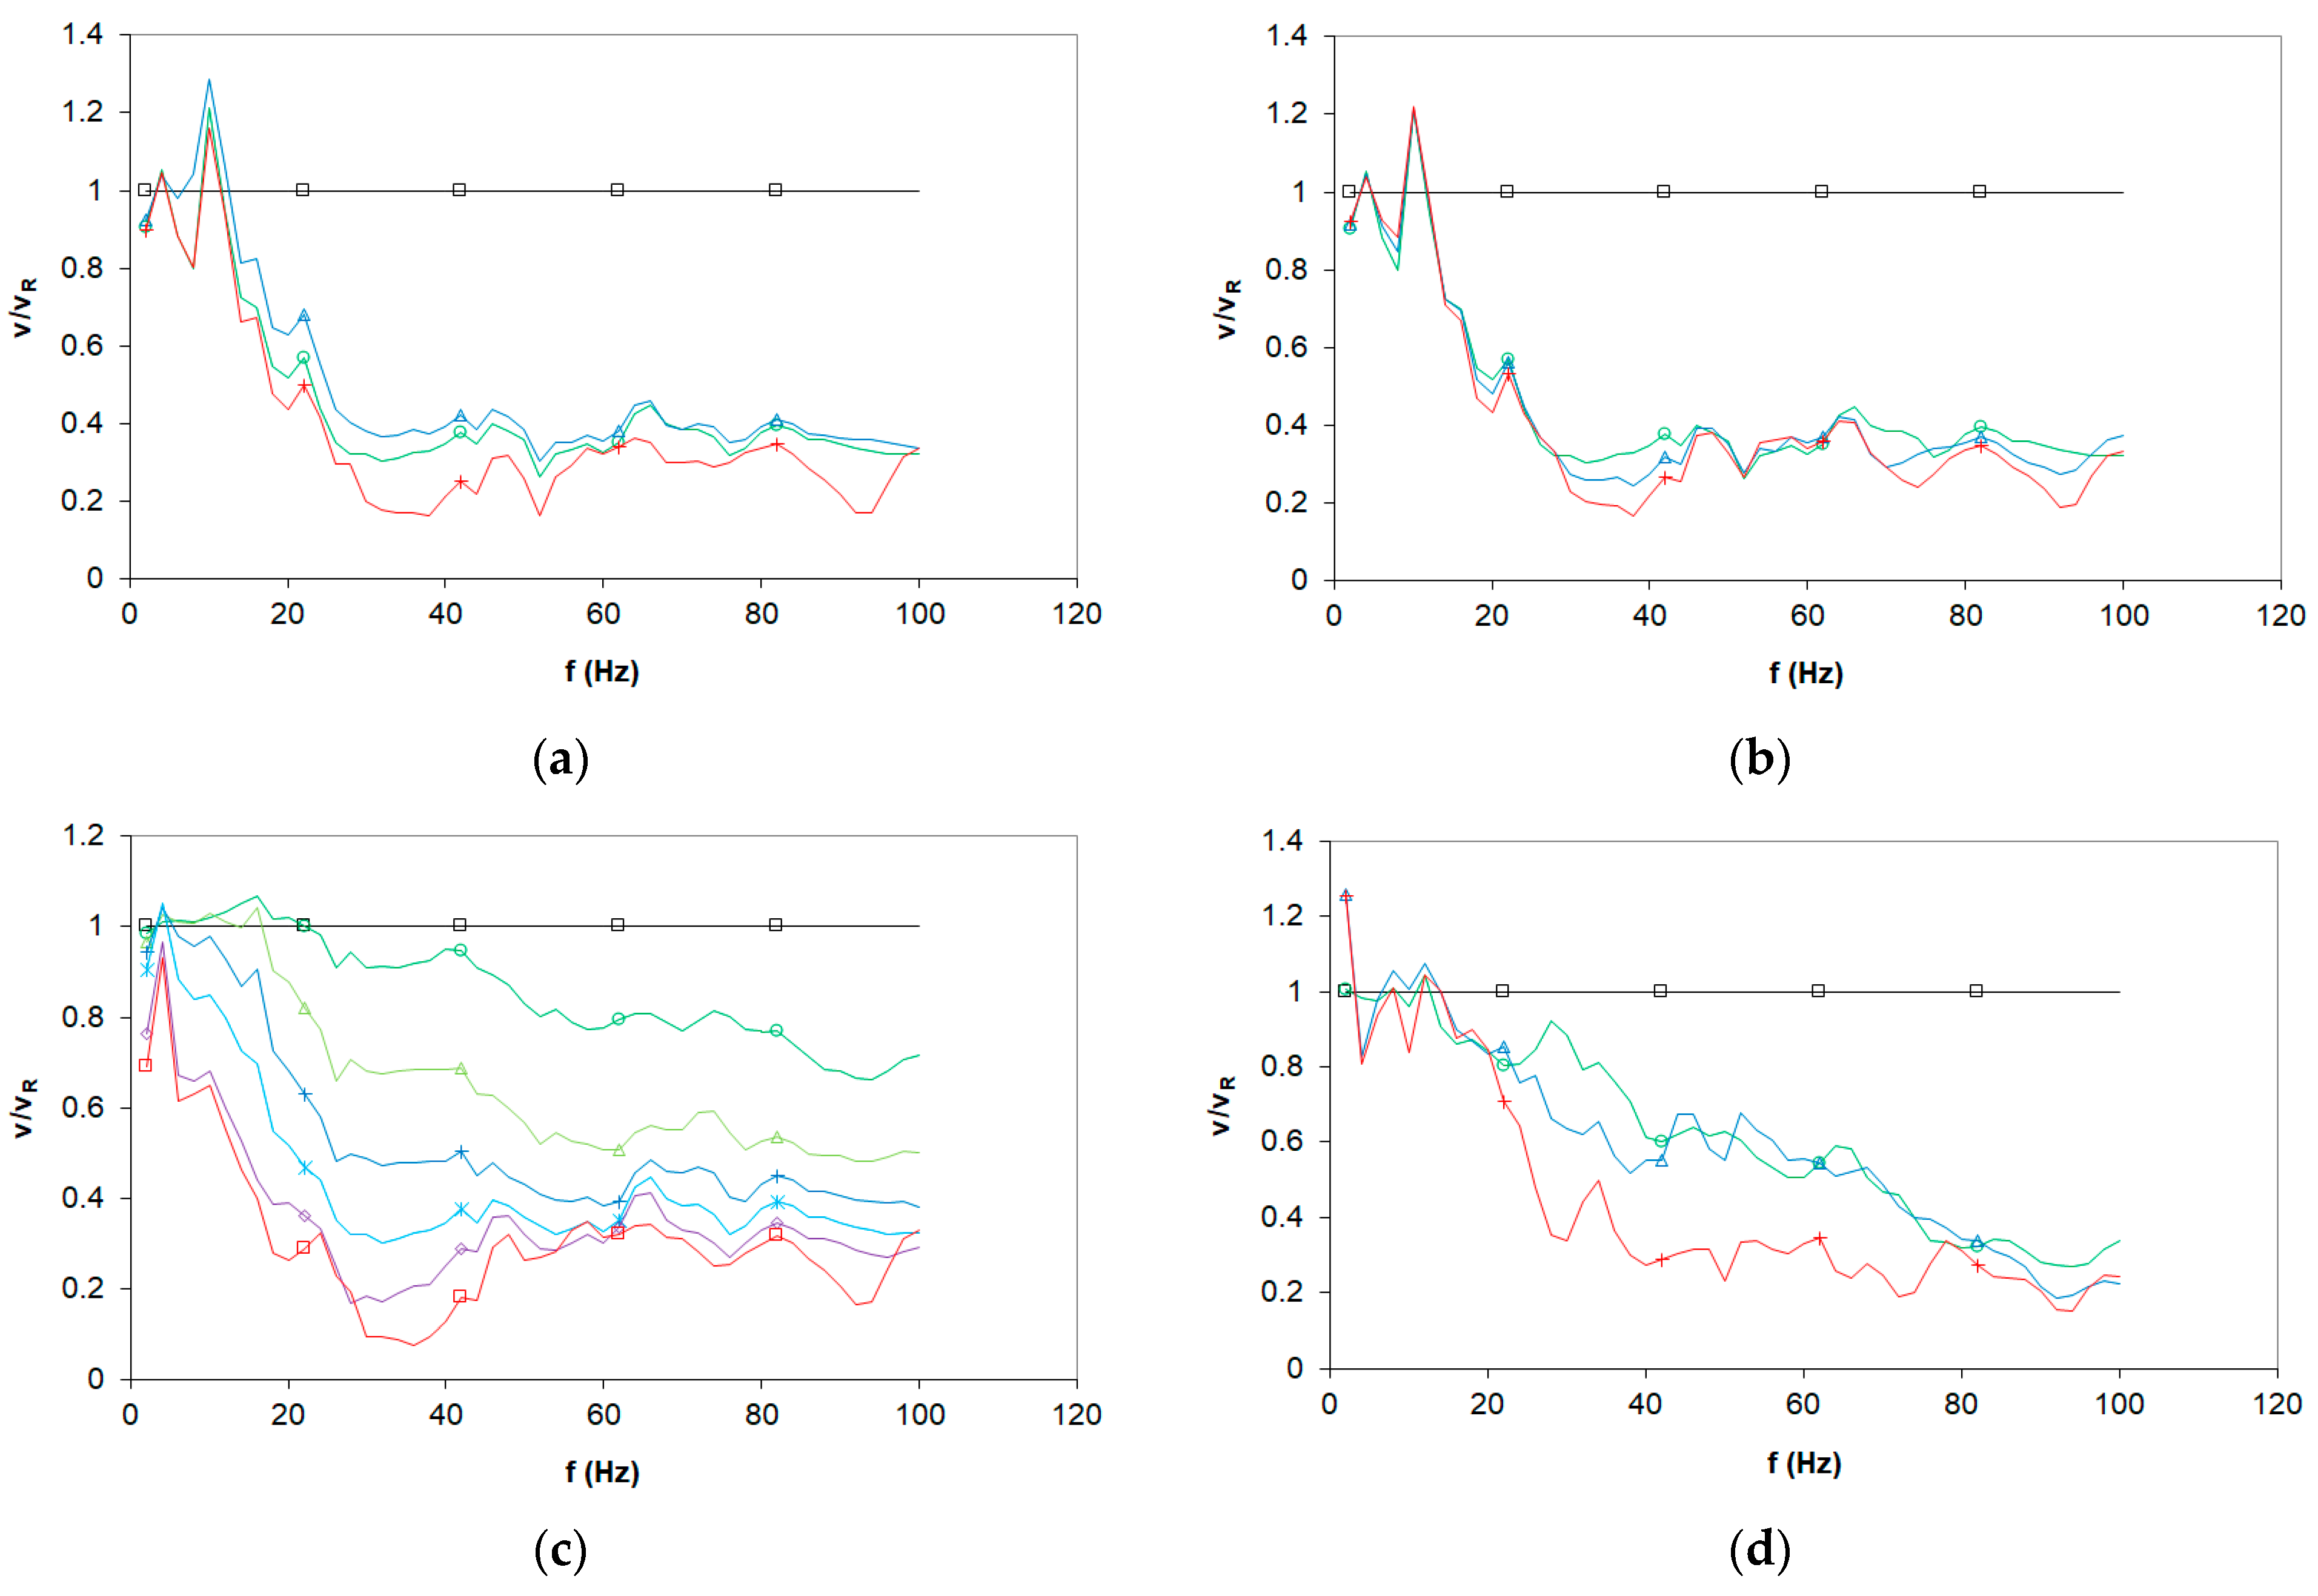
Figure 8.
The vibration mode of a concrete wall at (a) 20, (b) 40, (c) 60, and (d) 80 Hz.
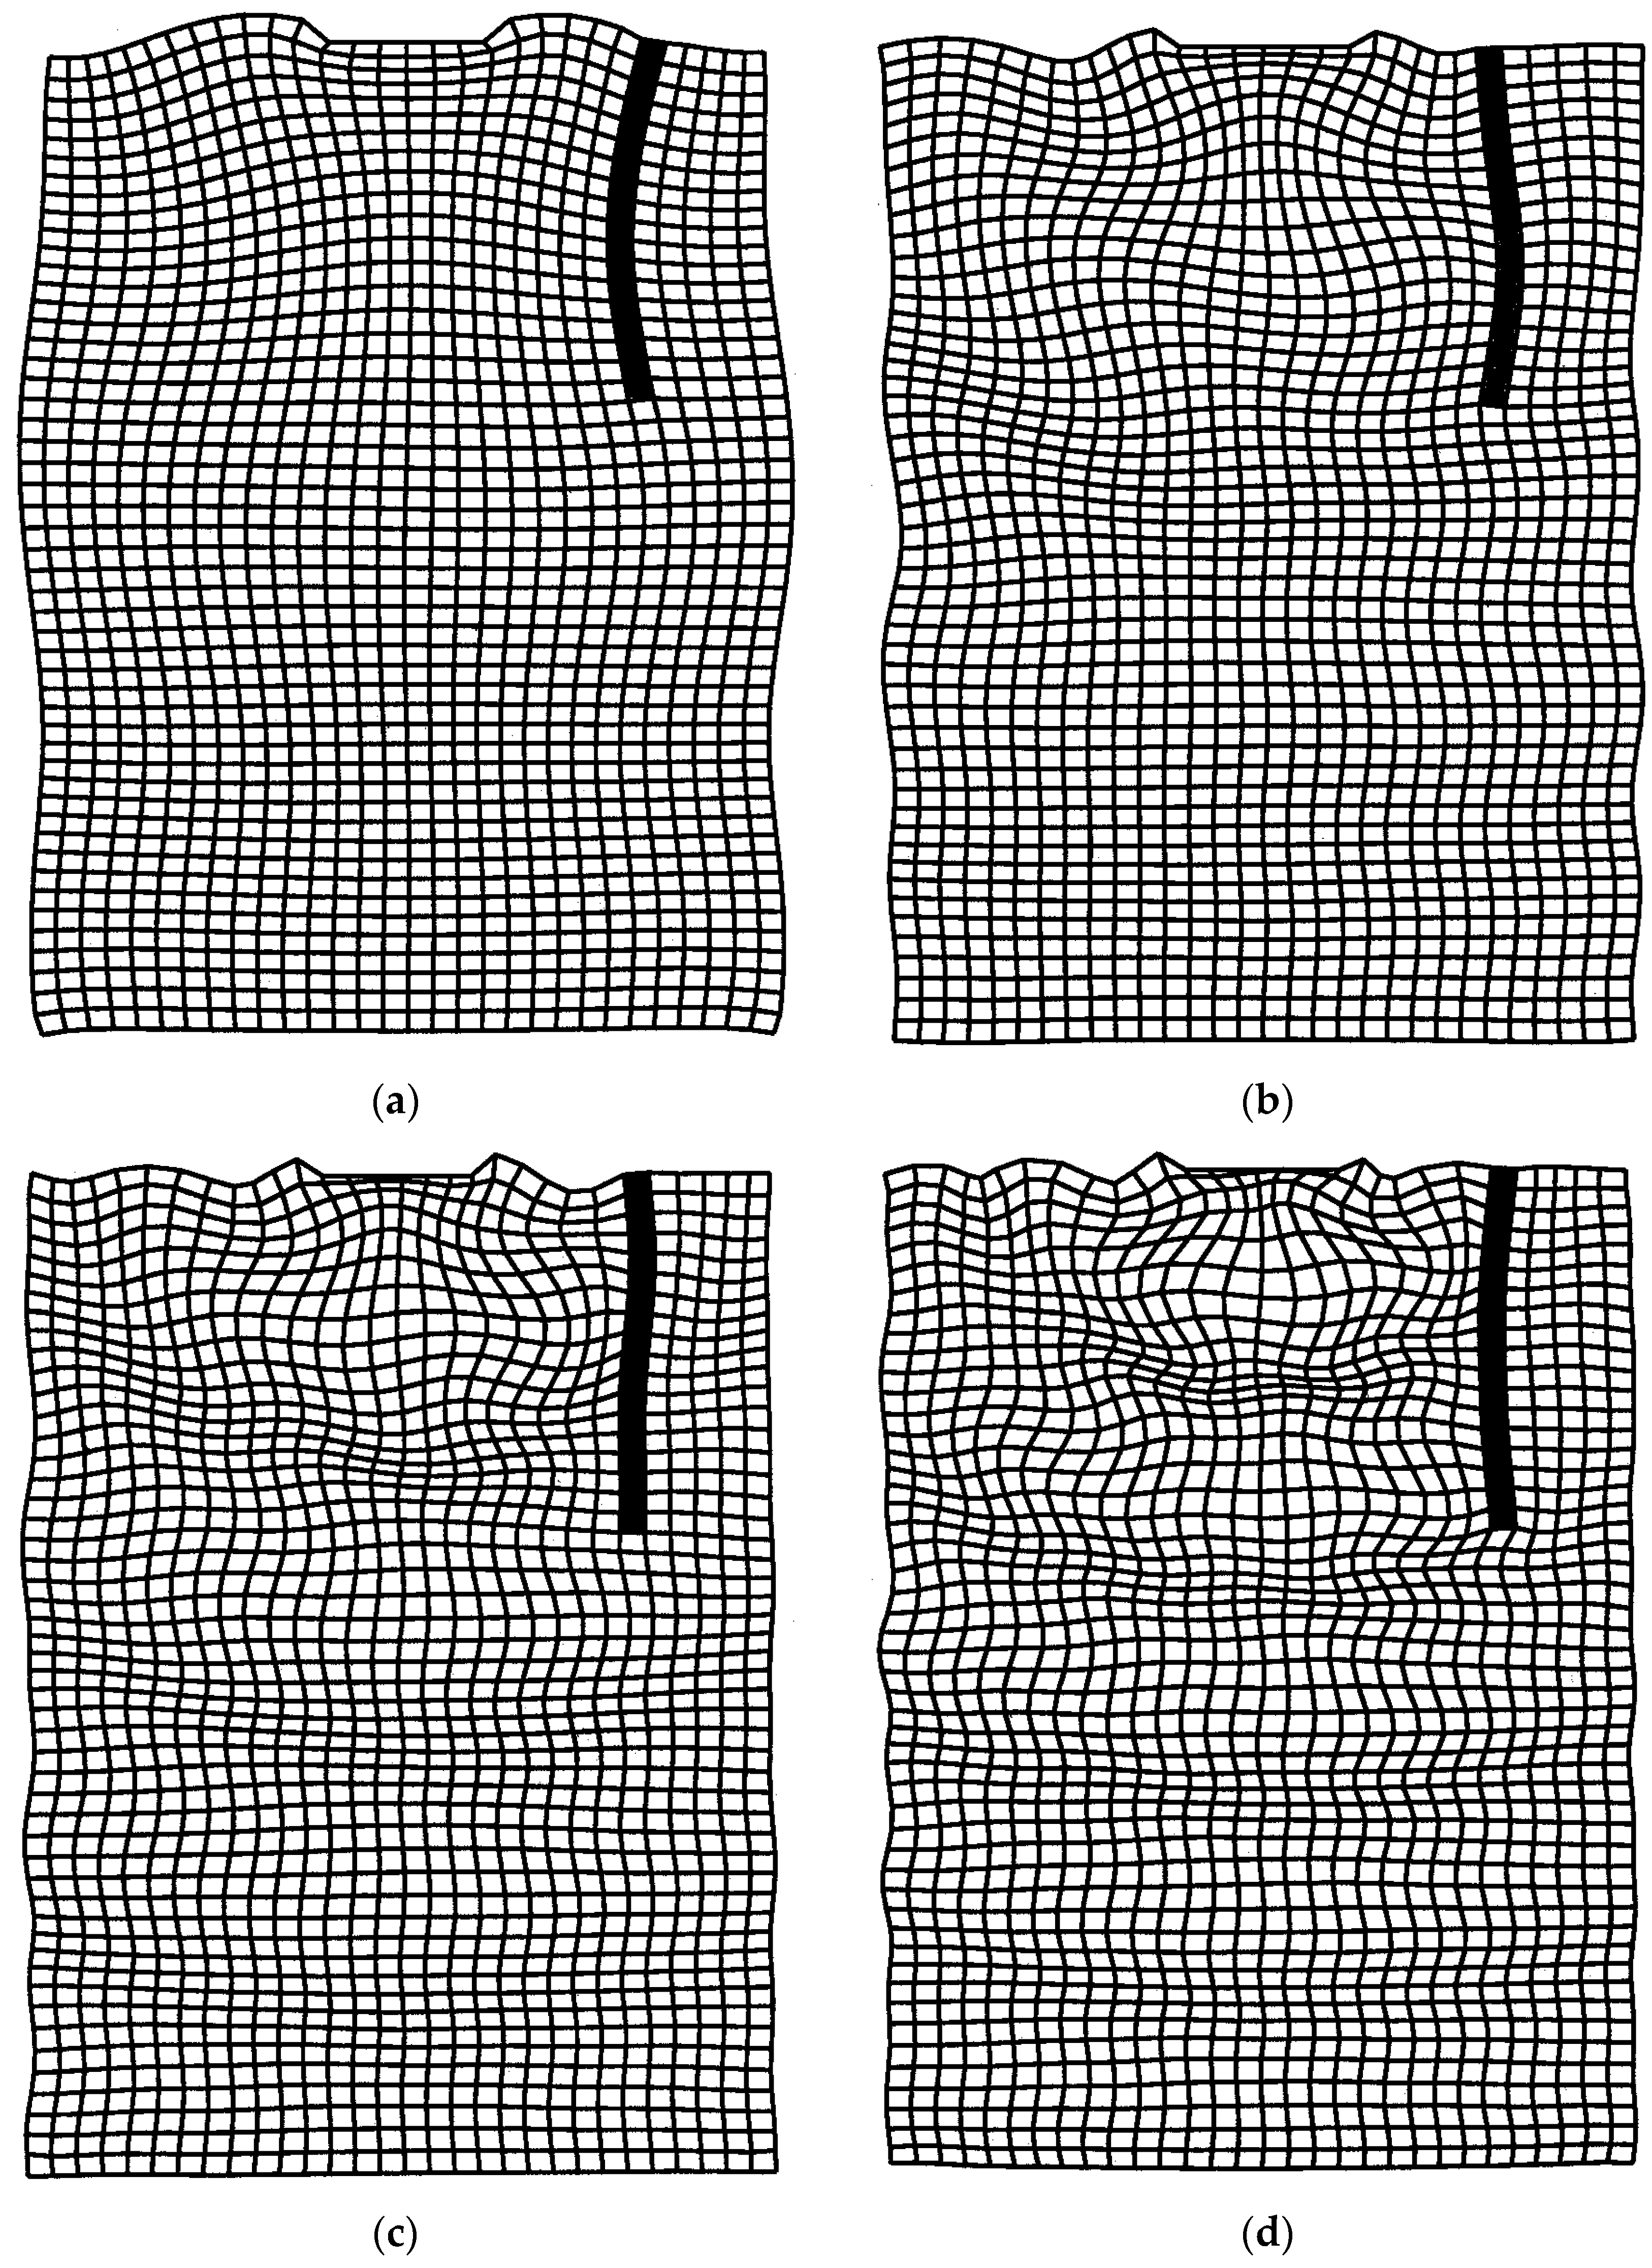
Figure 9.
The vibration mode of a concrete plate at (a) 20, (b) 40, (c) 60, and (d) 80 Hz.

Figure 10.
The vibration mode of a concrete block at (a) 20, (b) 40, (c) 60, and (d) 80 Hz.
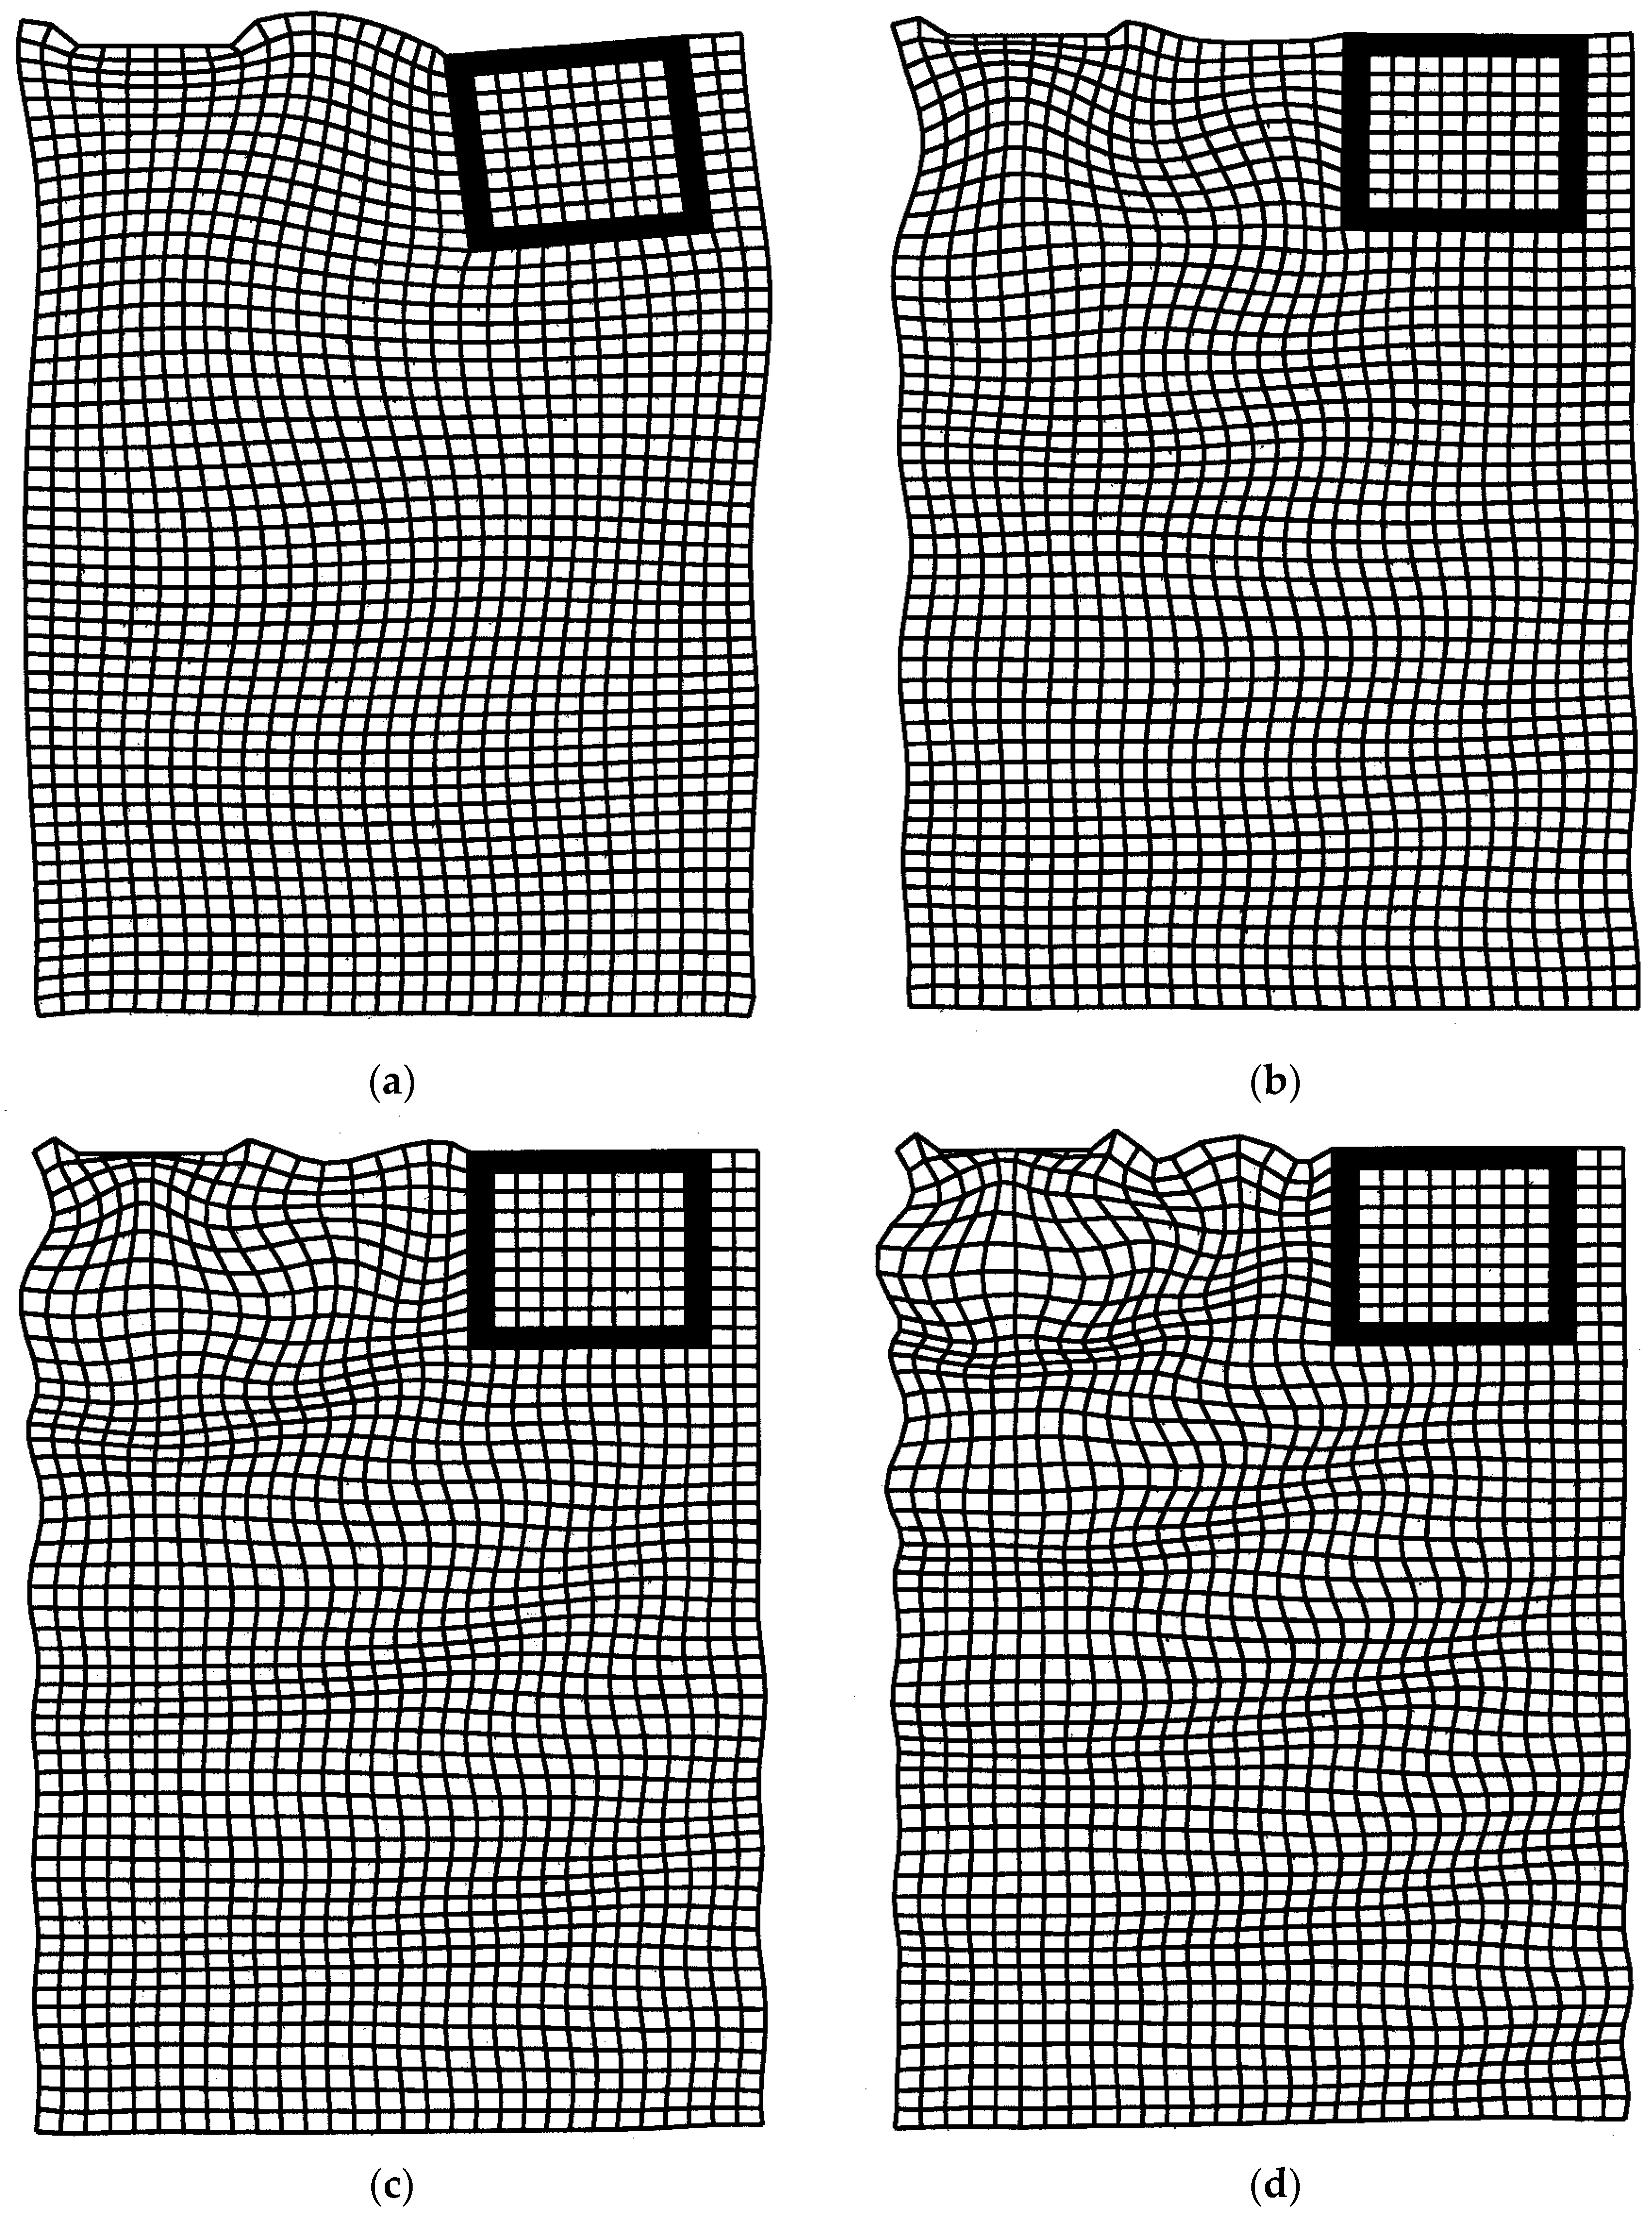
Figure 11.
The vibration mode at 80 Hz of (a) a dam, (b) a cut, and (c) a tunnel.

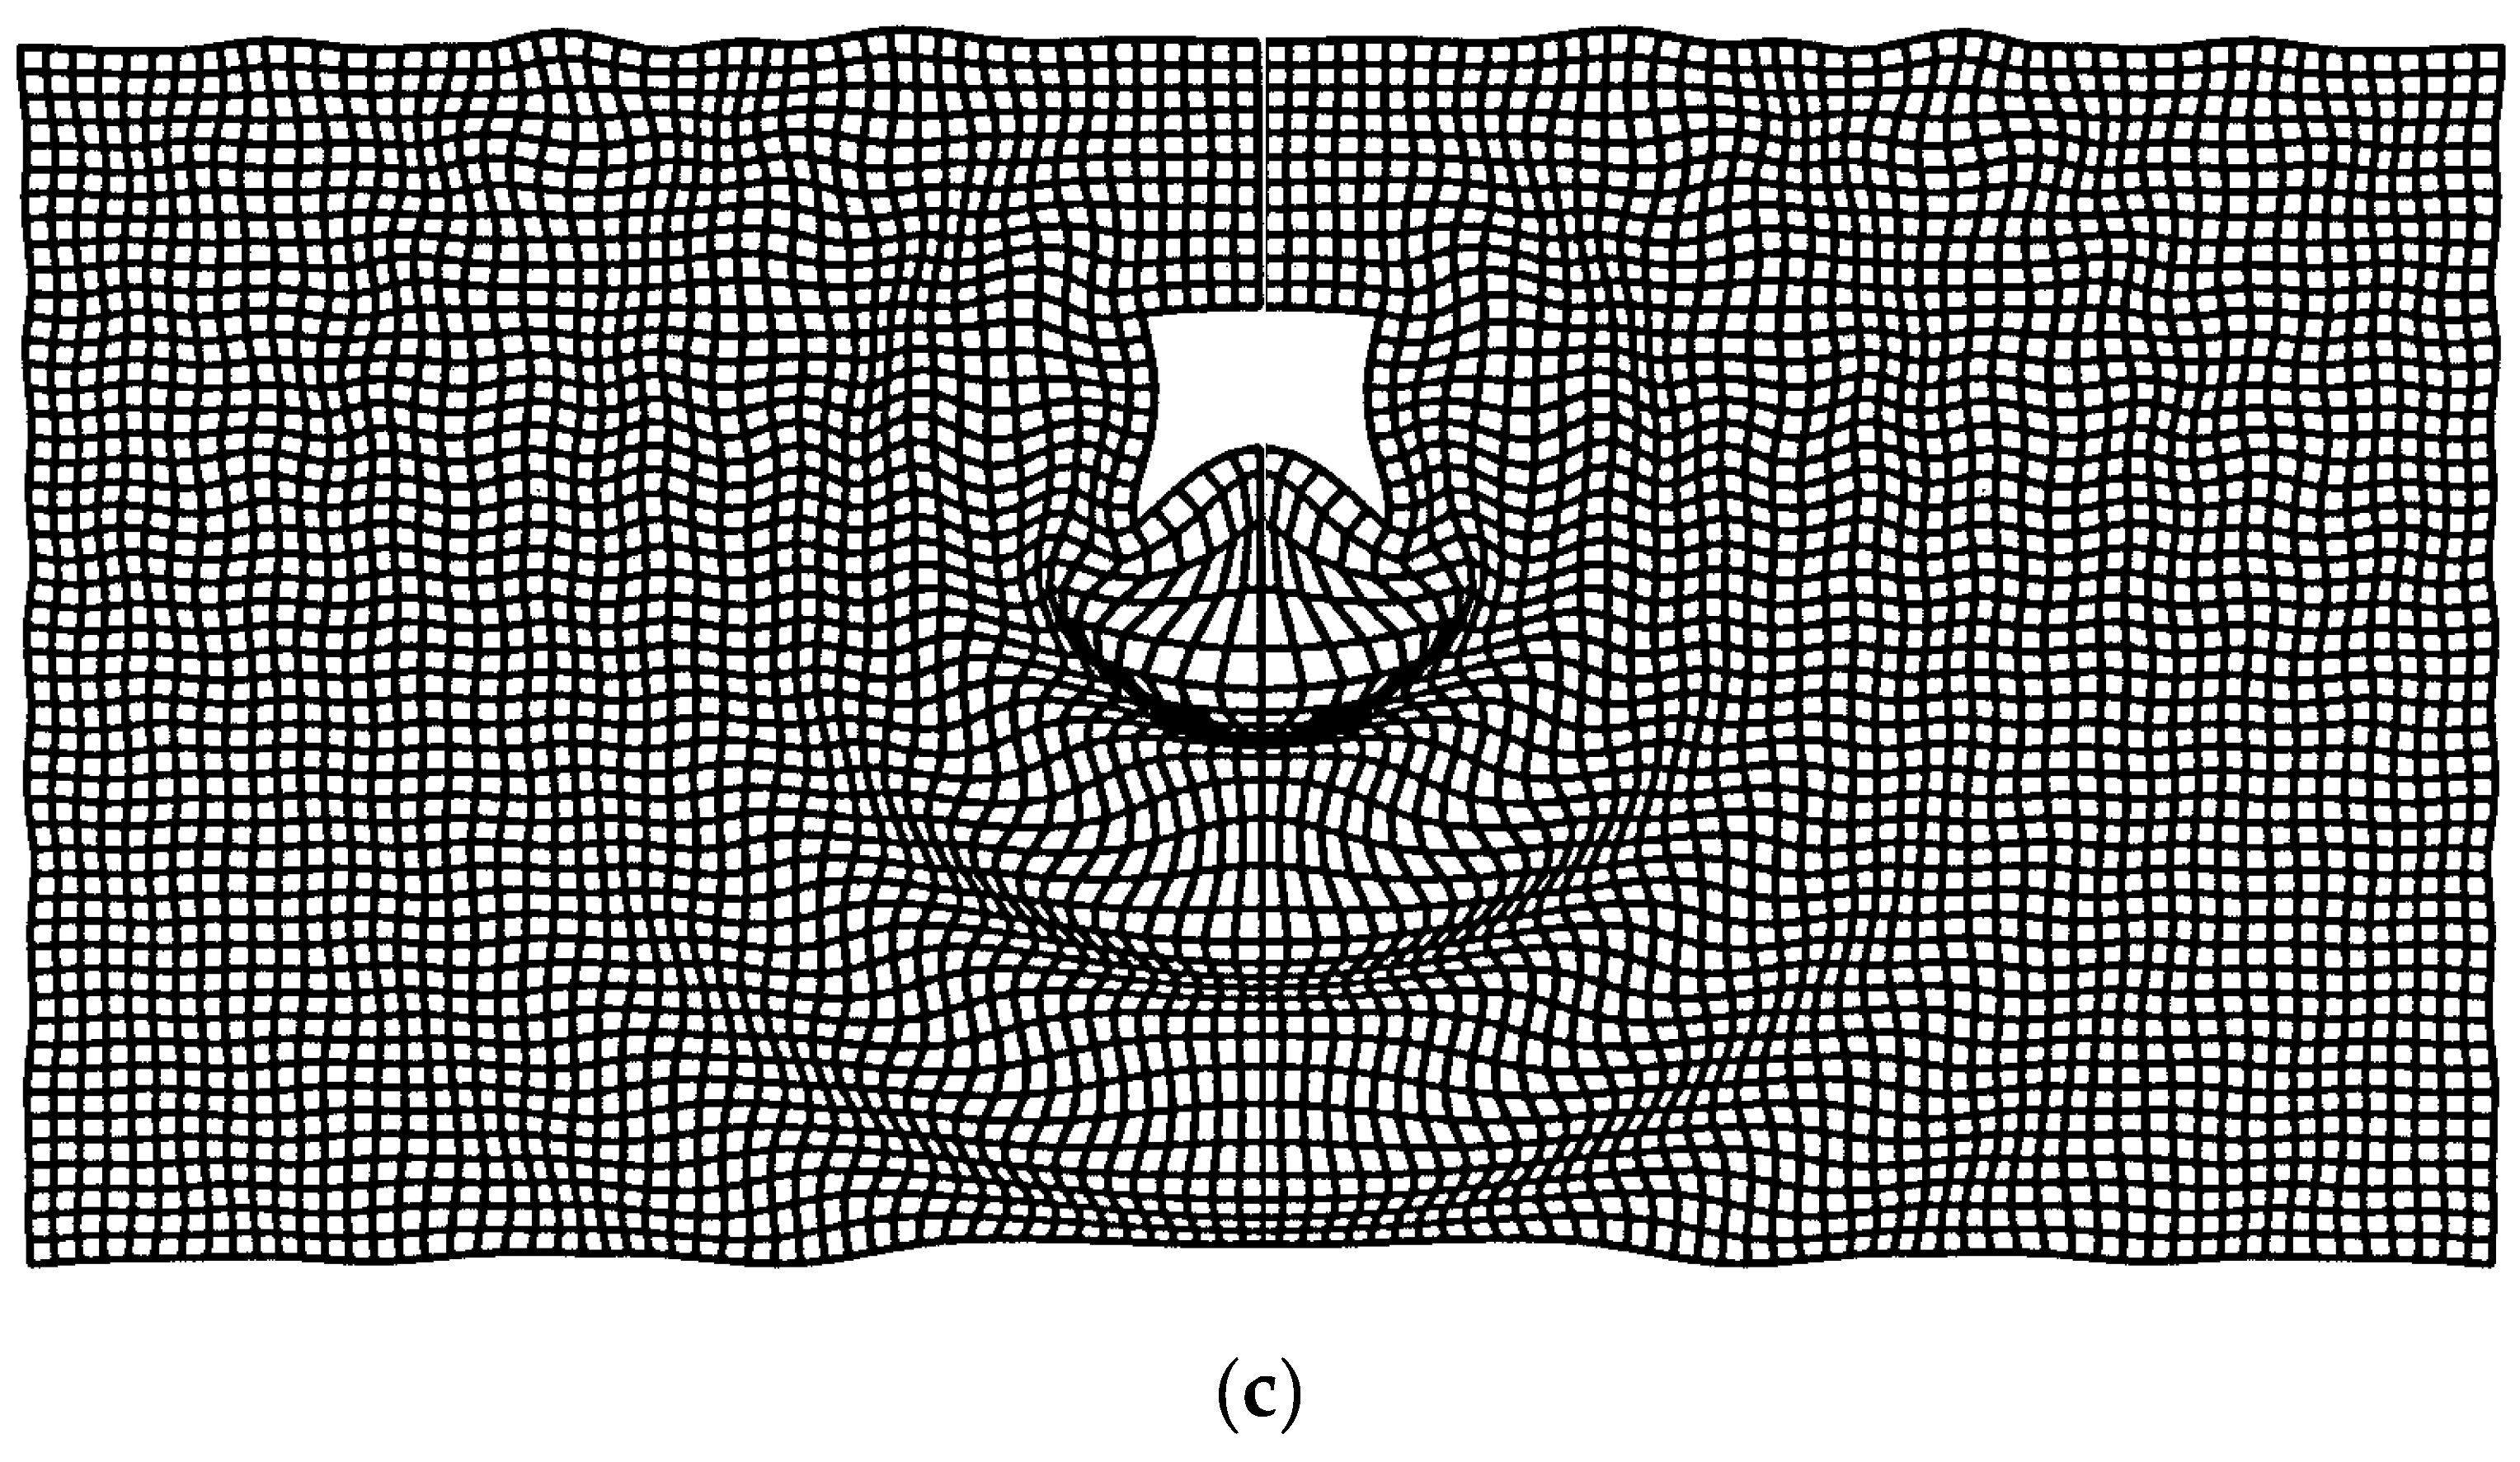
Figure 12.
The frequency-dependent reduction effect of (a) cuts with different inclinations of ☐ 0 (reference), ◯ 1:2, △ 1:1, + 2:1, × ∞ (vertical) and (b) embankments with different inclinations of ☐ 0 (reference), ◯ 1:2, △ 1:1, and + 2:1, compared to the reference case of a surface line.
Figure 12.
The frequency-dependent reduction effect of (a) cuts with different inclinations of ☐ 0 (reference), ◯ 1:2, △ 1:1, + 2:1, × ∞ (vertical) and (b) embankments with different inclinations of ☐ 0 (reference), ◯ 1:2, △ 1:1, and + 2:1, compared to the reference case of a surface line.
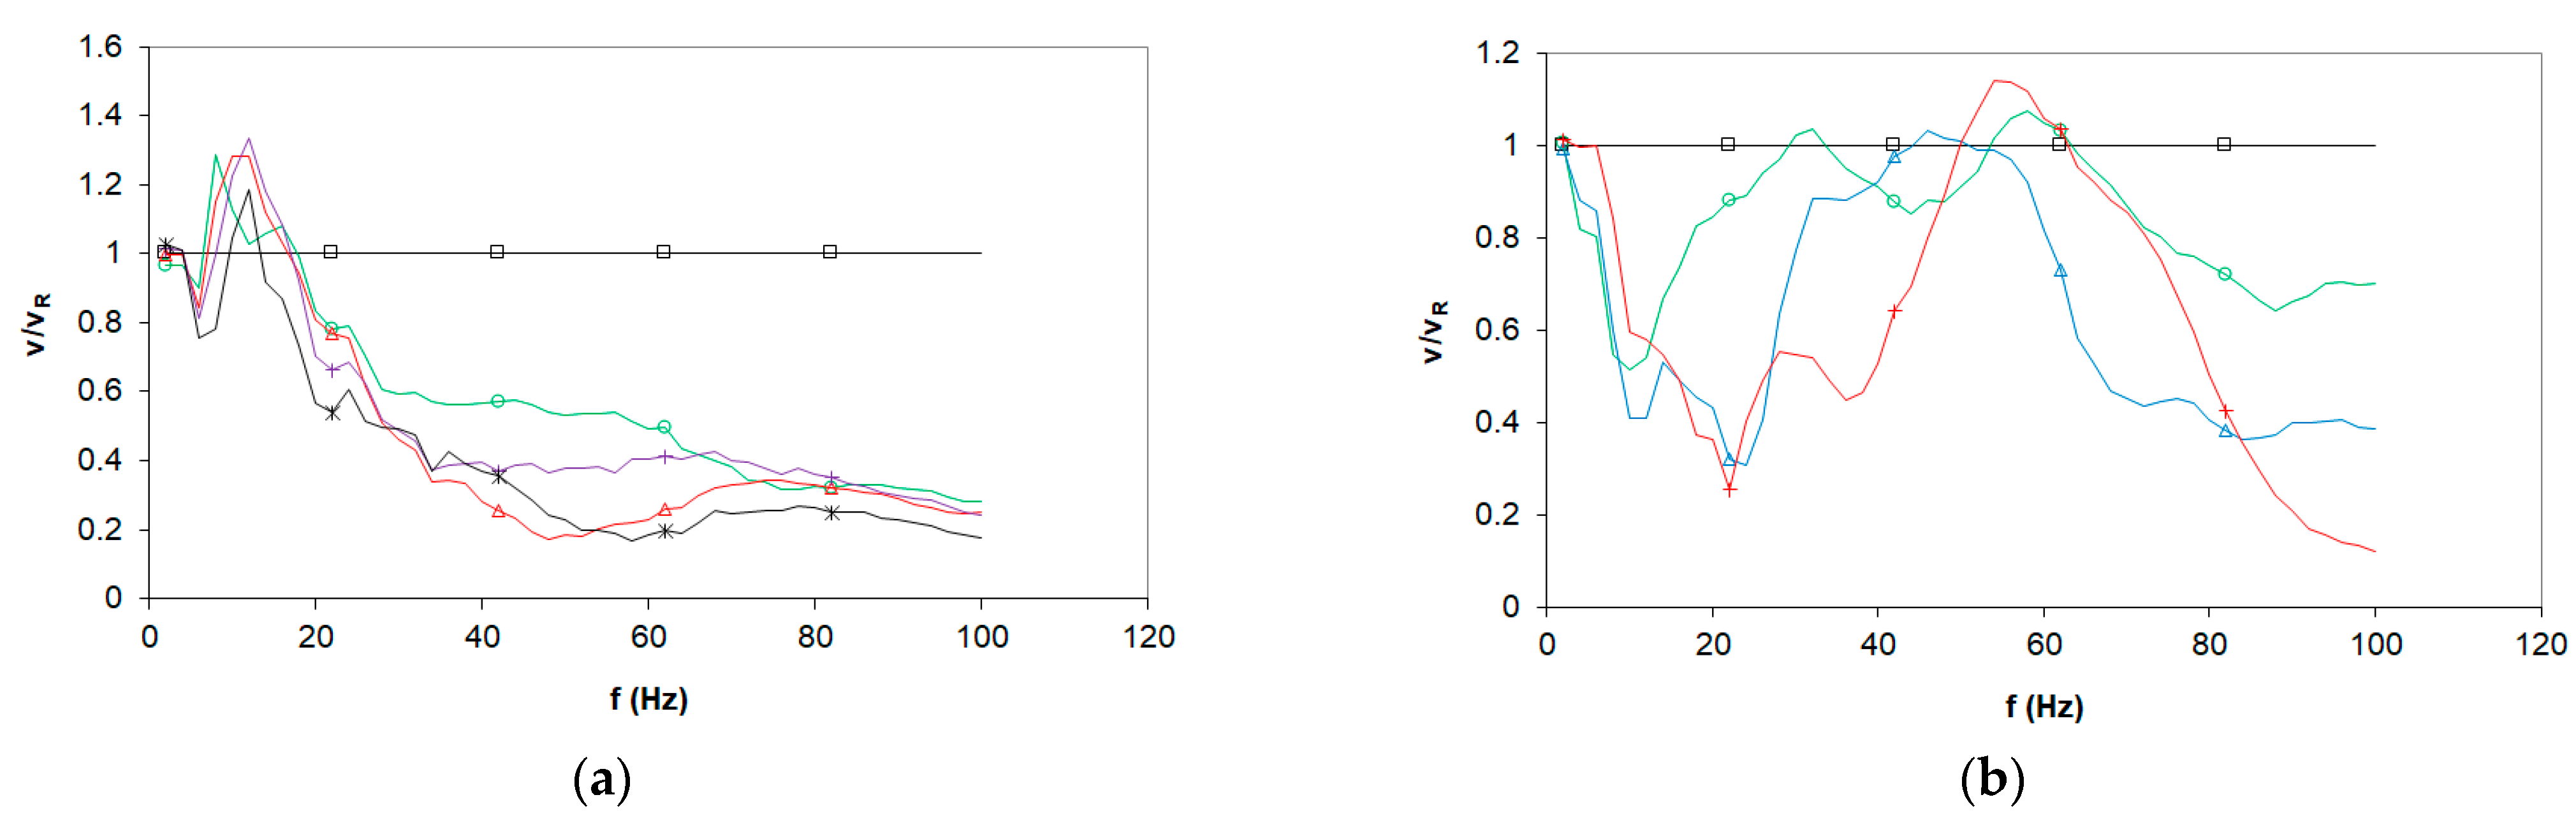
Figure 13.
The frequency-dependent reduction and amplification effect (a) of tunnels at depths of △ 10 m and ◯ 5 m (concrete cut); (b) of bridges with span lengths ☐ 15, ◯ 10, △ 5 m, and + a concrete bridge pier of 5 m × 5 m.
Figure 13.
The frequency-dependent reduction and amplification effect (a) of tunnels at depths of △ 10 m and ◯ 5 m (concrete cut); (b) of bridges with span lengths ☐ 15, ◯ 10, △ 5 m, and + a concrete bridge pier of 5 m × 5 m.
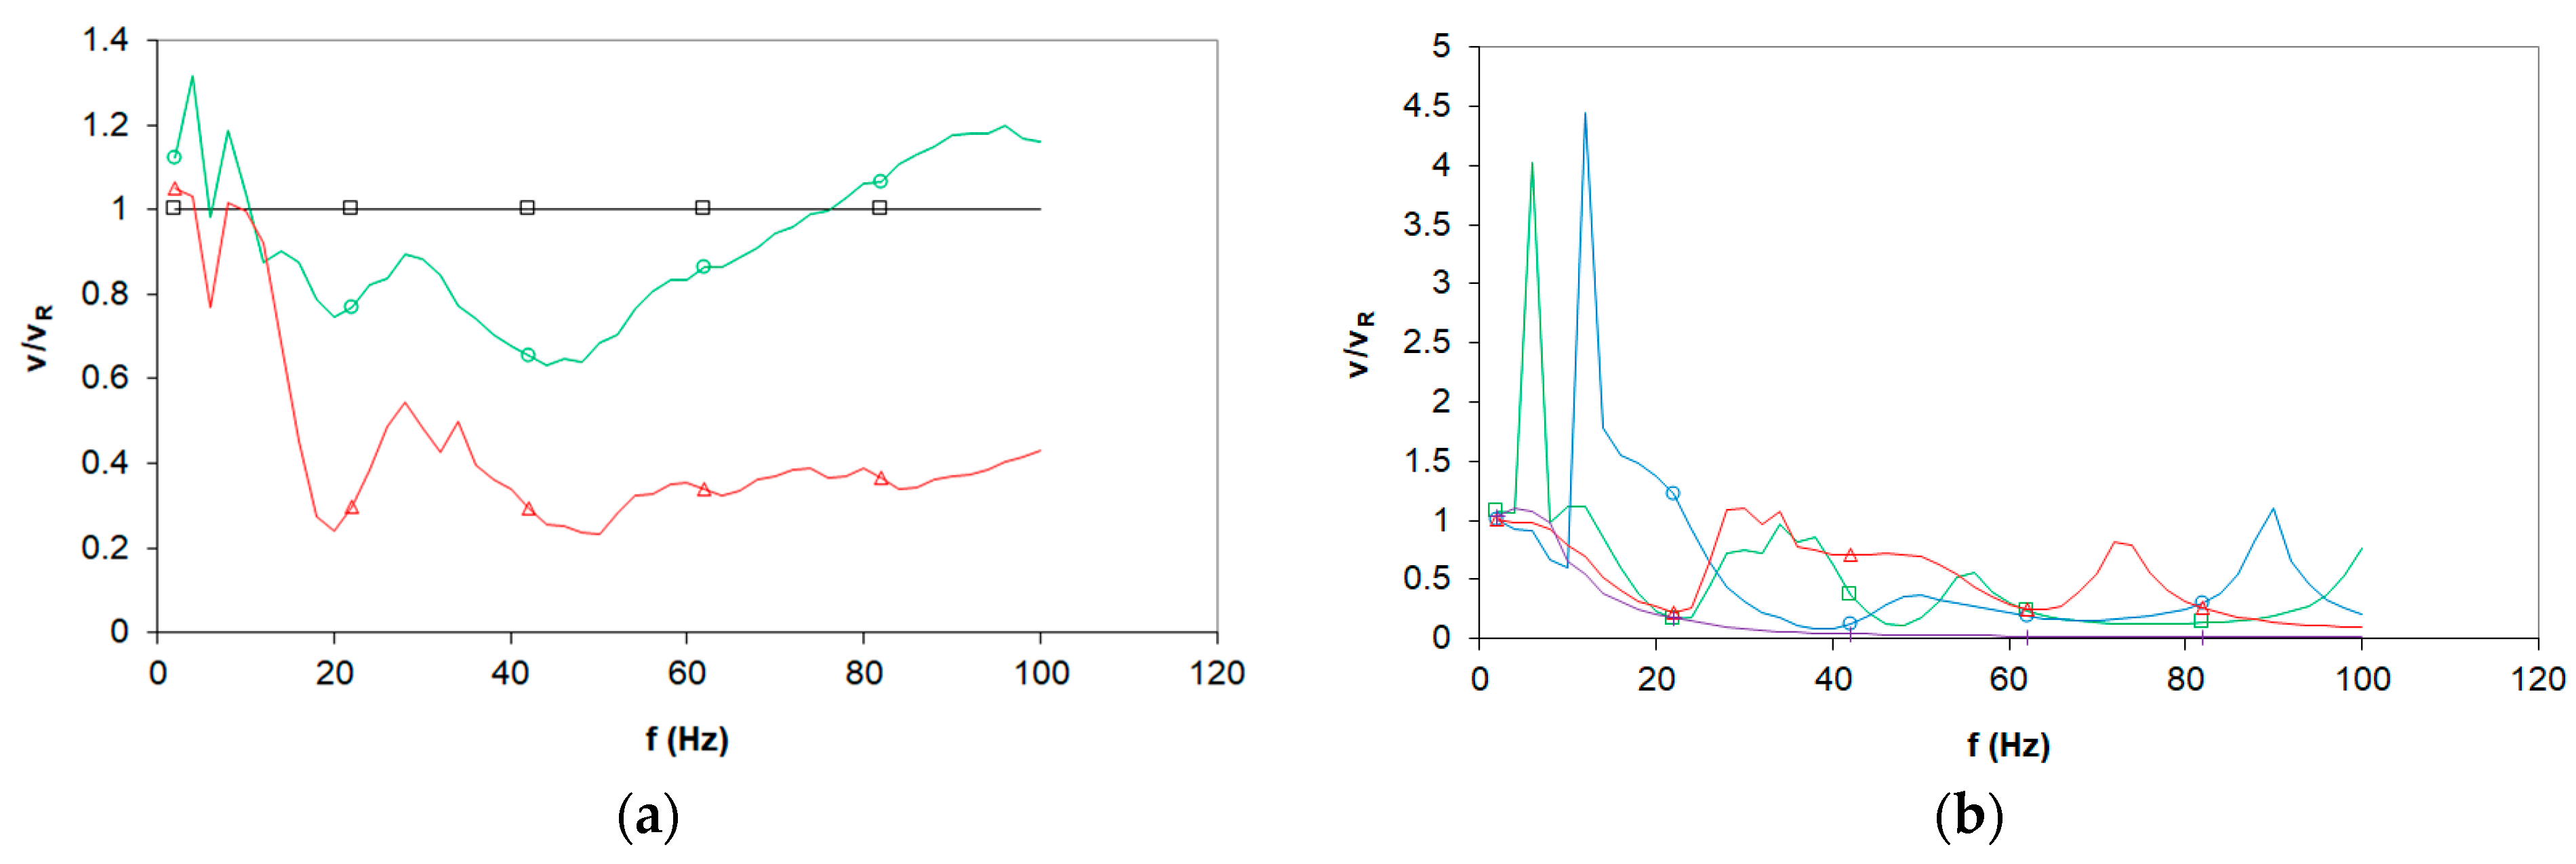
Figure 14.
The frequency-dependent reduction effect of the tunnel excitation compared with a line load: (a) with variation in the thickness of the tunnel wall ☐ 0.3, ◯ 0.5, △ 0.7, + 1.0 m; (b) and variation in the wave velocity of the soil vS = ☐ 150, ◯ 200, △ 300, + 500 m/s.
Figure 14.
The frequency-dependent reduction effect of the tunnel excitation compared with a line load: (a) with variation in the thickness of the tunnel wall ☐ 0.3, ◯ 0.5, △ 0.7, + 1.0 m; (b) and variation in the wave velocity of the soil vS = ☐ 150, ◯ 200, △ 300, + 500 m/s.
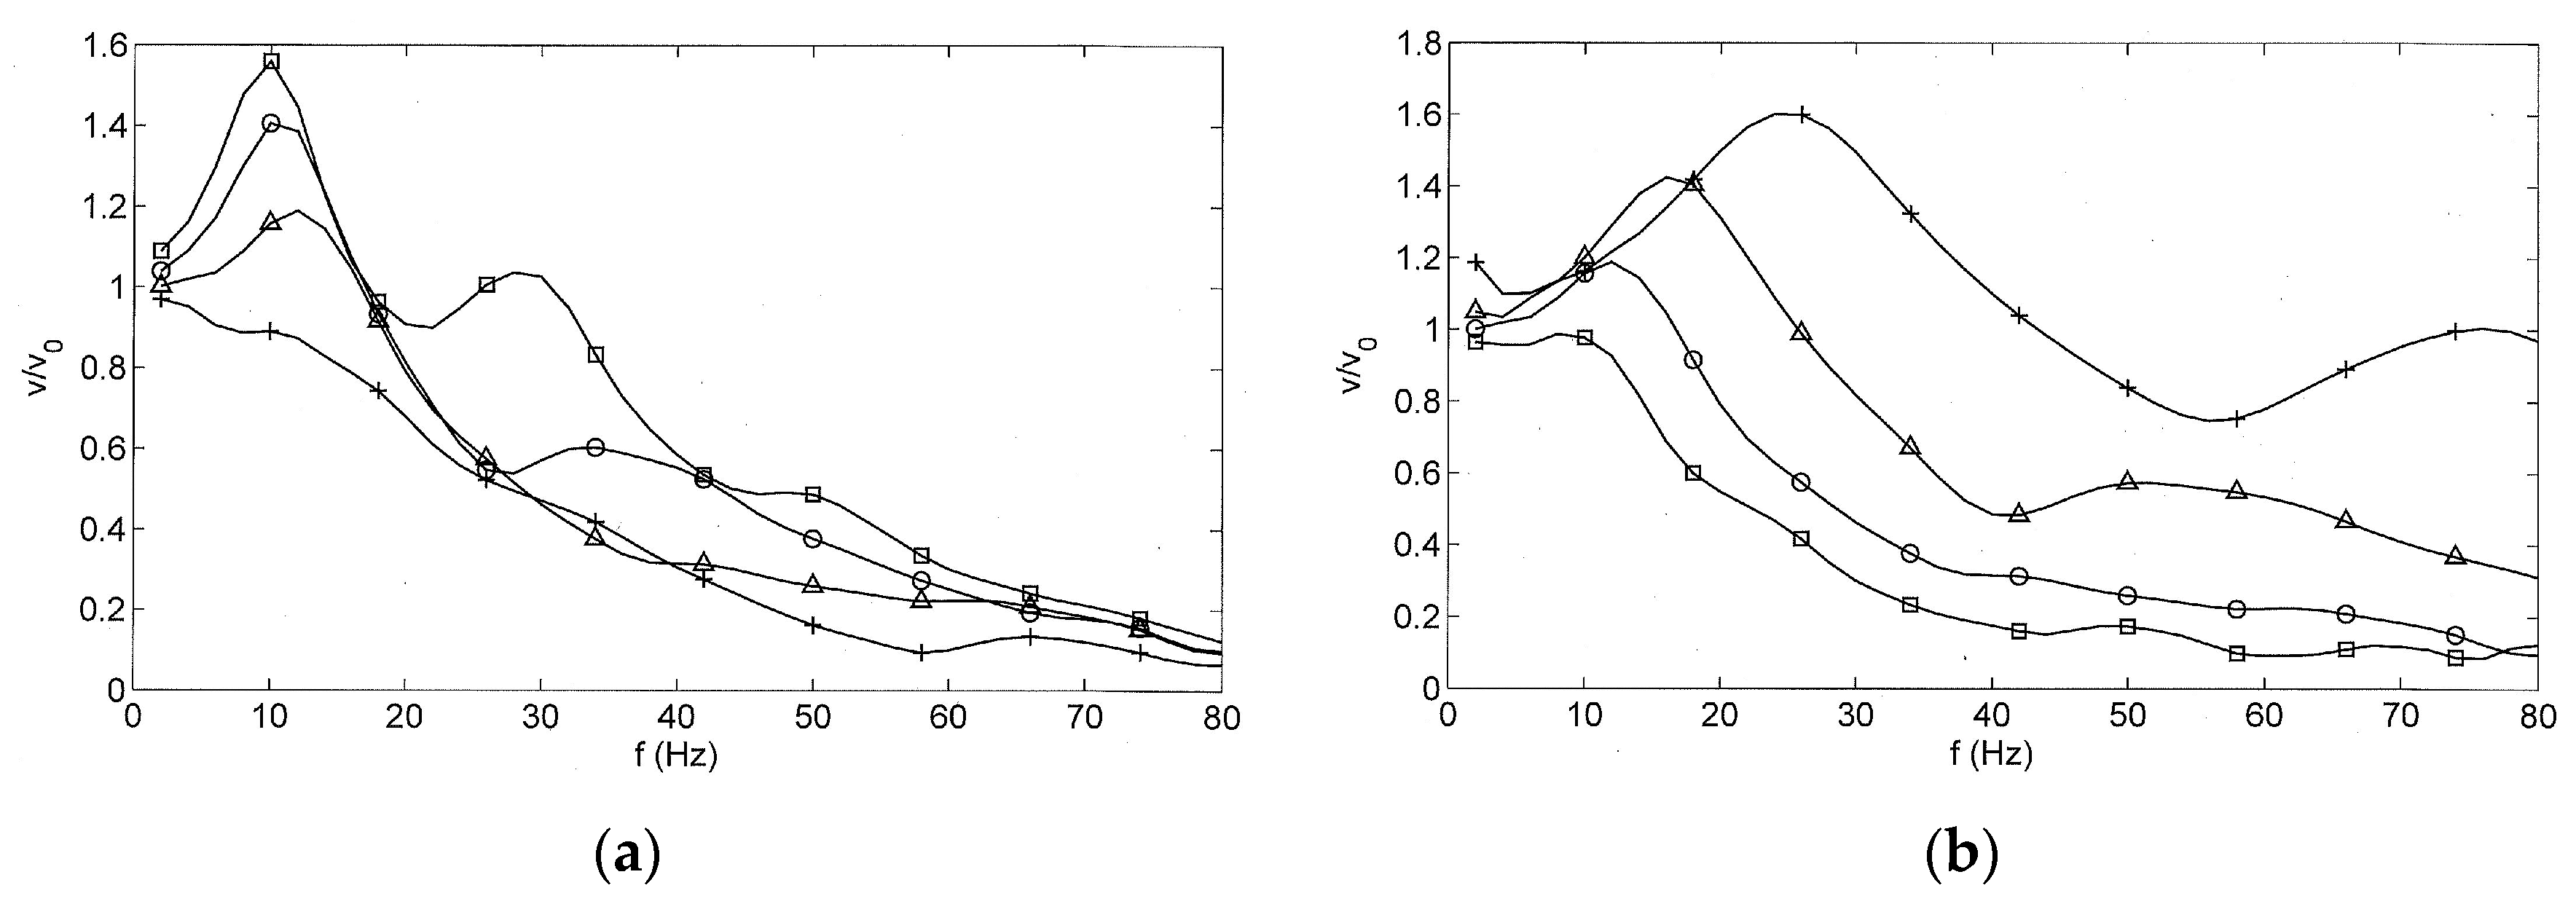
Figure 15.
The reduction effect of different railway lines and different obstacles for frequencies between 40 and 80 Hz (average).
Figure 15.
The reduction effect of different railway lines and different obstacles for frequencies between 40 and 80 Hz (average).

Table 1.
Standard parameters and variations.
| Parameter | Symbol | Value | Variation |
|---|---|---|---|
| Soil | |||
| Shear modulus | G | 8 × 10⁷ N/m2 | |
| Damping ratio | D | 2% | |
| Poisson ratio | ν | 0.33 | |
| Mass density | ρ | 2000 kg/m3 | |
| Shear wave velocities | vS | 200 m/s | 100, 150, 300, 500 m/s |
| Compressional wave velocities | vP | 400 m/s | |
| Concrete | |||
| Young’s Modulus | E | 3 × 10¹⁰ N/m2 | |
| Mass density | ρ | 2500 kg/m3 | |
| Railway line | |||
| Track width | b | 3 m | |
| Embankment height | 5 m | ||
| Embankment width | 5 m | ||
| Embankment inclination | 1:1 | 1:2, 2:1 | |
| Cut depth | 5 m | ||
| Cut width | 5 m | ||
| Cut inclination | 1:1 | 1:2, 2:1, ∞ | |
| Tunnel | |||
| Width | 6 m | 9 m | |
| Height | 6 m | ||
| Wall thickness | 0.5 m | 0.3, 0.7, 1.0 m | |
| Bridge | |||
| Width | 16 m | 6, 11 m | |
| Span | 15 m | 5, 10 m | |
| Height | 6 m | ||
| Wall thickness | 0.5 m | ||
| Pier dimension | 5 m × 5 m | ||
| Reduction measures | |||
| Trench depth | 9 m | ||
| Trench thickness | 0.5 m | ||
| Wall depth | 9 m | ||
| Wall thickness | 0.5 m | ||
| Plate length | 9 m | ||
| Plate thickness | 0.5 m | ||
| Box dimension | 5 m × 5 m |
Table 2.
Observed resonance frequencies of the bridge-soil system.
| Span Length | f1 | f2 | f3 | f4 |
|---|---|---|---|---|
| 15 m | 6 Hz | 38 Hz | 56 Hz | 100 Hz |
| 10 m | 12 Hz | 50 Hz | 90 Hz | |
| 5 m | 28 Hz | 72 Hz |
Disclaimer/Publisher’s Note: The statements, opinions and data contained in all publications are solely those of the individual author(s) and contributor(s) and not of MDPI and/or the editor(s). MDPI and/or the editor(s) disclaim responsibility for any injury to people or property resulting from any ideas, methods, instructions or products referred to in the content. |
© 2023 by the author. Licensee MDPI, Basel, Switzerland. This article is an open access article distributed under the terms and conditions of the Creative Commons Attribution (CC BY) license (https://creativecommons.org/licenses/by/4.0/).
Share and Cite
MDPI and ACS Style
Auersch, L. Reduction of Train-Induced Vibrations—Calculations of Different Railway Lines and Mitigation Measures in the Transmission Path. Appl. Sci. 2023, 13, 6706. https://doi.org/10.3390/app13116706
AMA Style
Auersch L. Reduction of Train-Induced Vibrations—Calculations of Different Railway Lines and Mitigation Measures in the Transmission Path. Applied Sciences. 2023; 13(11):6706. https://doi.org/10.3390/app13116706
Chicago/Turabian StyleAuersch, Lutz. 2023. "Reduction of Train-Induced Vibrations—Calculations of Different Railway Lines and Mitigation Measures in the Transmission Path" Applied Sciences 13, no. 11: 6706. https://doi.org/10.3390/app13116706
Note that from the first issue of 2016, this journal uses article numbers instead of page numbers. See further details here.