


A Wasserstein Generative Adversarial Network–Gradient Penalty-Based Model with Imbalanced Data Enhancement for Network Intrusion Detection
1
Department of Computer Science and Information Engineering, National United University, Miaoli 360302, Taiwan
2
Department of Computer Science and Engineering, National Taiwan Ocean University, Keelung 202301, Taiwan
*
Author to whom correspondence should be addressed.
Appl. Sci. 2023, 13(14), 8132; https://doi.org/10.3390/app13148132
Submission received: 28 April 2023
/
Revised: 2 July 2023
/
Accepted: 11 July 2023
/
Published: 12 July 2023
(This article belongs to the Topic Electronic Communications, IOT and Big Data)
Abstract
:In today’s network intrusion detection systems (NIDS), certain types of network attack packets are sparse compared to regular network packets, making them challenging to collect, and resulting in significant data imbalances in public NIDS datasets. With respect to attack types with rare data, it is difficult to classify them, even by using various algorithms such as machine learning and deep learning. To address this issue, this study proposes a data augmentation technique based on the WGAN-GP model to enhance the recognition accuracy of sparse attacks in network intrusion detection. The enhanced performance of the WGAN-GP model on sparse attack classes is validated by evaluating three sparse data generation methods, namely Gaussian noise, WGAN-GP, and SMOTE, using the NSL-KDD dataset. Additionally, machine learning algorithms, including KNN, SVM, random forest, and XGBoost, as well as neural network models such as multilayer perceptual neural networks (MLP) and convolutional neural networks (CNN), are applied to classify the enhanced NSL-KDD dataset. Experimental results revealed that the WGAN-GP generation model is the most effective for detecting sparse data probes. Furthermore, a two-stage fine-tuning algorithm based on the WGAN-GP model is developed, fine-tuning the classification algorithms and model parameters to optimize the recognition accuracy of the sparse data probes. The final experimental results demonstrate that the MLP classifier significantly increases the accuracy rate from 74% to 80% after fine tuning, surpassing all other classifiers. The proposed method exhibits a 10%, 7%, and 13% improvement over untuned Gaussian noise enhancement, untuned SMOTE enhancement, and no enhancement.
1. Introduction
Because of the rapid development of wireless technology and semiconductor manufacturing, the application of the Internet of Things (IoT) and mobile networks is becoming increasingly widespread. The application of the IoT is not only limited to computer and communication applications, but has been extended to e-commerce, industrial manufacturing, and other services. Because of the widespread application of the IoT and mobile networks to all walks of life, cyber-attacks are becoming increasingly frequent, and the harm to the government and enterprises is now more severe than ever. Therefore, cyber security is becoming an important issue that cannot be ignored.
Network intrusion detection systems (NIDS) are defense systems for cyber security. Traditional NIDSs can be divided into two categories: signature-based and anomaly-based. The detection principle of the signature-based NIDS is to compare the traffic data to be detected with the attack signature database in the system. Therefore, the attack signature database needs to be maintained and updated regularly so that the system can support effective detection. The anomaly-based NIDS system mainly uses statistical analysis to detect and identify anomalous traffic data such as an attack. Irrespective of the method adopted, both detection approaches can no longer adapt to ever-changing cyber-attacks. The use of artificial intelligence to improve NIDSs has been a significant trend in recent years. However, many of the NIDS datasets currently used by scholars suffer from severe data imbalances. It is challenging to identify these types of sparse attack data using traditional machine learning and deep learning algorithms. While certain types of attacks are rare, we believe that by improving the accuracy of identifying these attacks with sparse data, we can prevent more severe attacks in the future. This study mainly used the WGAN-GP generation model to augment the sparse data in the NSL-KDD dataset to improve the identification accuracy of sparse attacks in network intrusion detection. To evaluate the effectiveness of WGAN-GP data enhancement for attacks with sparse data, this study focused on the performance analysis of three data enhancement methods to increase the percentage distribution of sparse attack classes through data augmentation, thereby improving the recognition accuracy of sparse data classes. We then analyzed the sparse class recognition accuracy to find the best data generation model. Based on this generation model, a two-stage fine-tuning algorithm was further designed to fine-tune the parameters of the best data-enhanced model and classification algorithms, thereby optimizing the recognition accuracy of the sparse attack data.
This paper is structured as follows. Section 1 presents the background and motivation of the research. Section 2 introduces related research in the field of AI-based network intrusion detection, research on data imbalance problems, and research on GAN-based data enhancement. Section 3 concerns data enhancement methods, including Gaussian noise, WGAN-GP, and the synthetic minority oversampling technique (SMOTE). Section 4 is the data enhancement experimental methodology, mainly introducing the two-stage fine-tuning algorithm, the data enhancement for rare data in the NSL-KDD dataset, and the classification algorithms for the enhanced NSL-KDD. Section 5 discusses the experimental results, including the first-stage results for the three rare data enhancement methods and the improved results of the second-stage fine-tuning experiments. Section 6 is the conclusion.
2. Related Research
2.1. AI-Based Network Intrusion Detection System
Much of the recent research on NIDS has focused on deploying machine learning algorithms and artificial intelligence techniques to improve traditional NIDS systems. Reddy et al. [1] used the NSL-KDD dataset and applied machine learning algorithms, including KNN and SVM, to enhance traditional NIDS systems. Chopra et al. [2] used the BoT-IoT dataset and principal component analysis (PCA) techniques to obtain the best features and then leveraged machine learning algorithms, including Bayesian classifiers (naive Bayesian), J48 decision trees, and random forests, to detect DDoS attacks on IoT devices. Dipon et al. [3] proposed a set of data preprocessing frameworks, using PCA technology to screen features and applying the density-based clustering analysis algorithm (DBSCAN) to eliminate anomalous data. Using the DARPA99 dataset, the study showed that the proposed architecture could effectively improve the accuracy of detecting cyber-attacks. Sadioura et al. [4] used both the KDD99 and the NSL-KDD datasets, applied information gain technology for feature selection and data preprocessing, and then utilized machine learning algorithms and deep learning algorithms, including the SVM, MLP, and CNN algorithms. The study’s experiments revealed that the MLP classifier is the classifier with the highest accuracy rate.
Our study found few studies discussing the problem of data imbalance in NIDS systems. None of the aforementioned related studies have taken into account that the amount of data is too scarce for some attack types in a network intrusion system, resulting in a significant imbalance in the data distribution of datasets. We found that for some attack types with rare data, if we only focus on applying different classification algorithms and feature selection methods, it is difficult to improve the identification accuracy of Probe, U2R, R2L, and other rare attack types.
2.2. Data Imbalance Problem
Relevant studies have been reported on classification problems with imbalanced data. Synthetic minority oversampling technology (SMOTE) [5] is a classical method to address the class imbalance problem. Oversampling is carried out to expand data for classes with a small amount of data. Yan et al. [6] proposed a new variant of SMOTE, region-adaptive SMOTE (RA-SMOTE), and used machine learning algorithms to evaluate its effectiveness. Bunkhumpornpat et al. [7] used different weights to analyze the data and defined security levels to identify specific classes of artificially generated data. Gad et al. [8] used the ToN-IoT dataset for network traffic data and proposed the chi2 technology for feature screening and SMOTE to improve the class imbalance problem. Lee et al. [9] used the CICIDS2017 dataset to study the problem of data imbalance. This research used several data sampling techniques, including oversampling, undersampling, and mixed sampling techniques, to improve the data imbalance problem. The study concluded that the best results were obtained using the OSS-BSMOTE hybrid sampling technique.
The abovementioned related studies mainly used data augmentation to solve the data imbalance problem. Many new approaches for data generation technologies have been proposed recently, such as autoencoders and generative adversarial networks (GANs). Developing an effective data augmentation technique to improve the detection of rare attack data for network intrusions is a worthy research problem.
2.3. GAN-Based Data Enhancement
Generative adversarial networks (GAN) [10] are a new data generation method that mainly utilizes discriminators and generators similar to convolutional neural network models to learn the data distribution of real data. This method is commonly used to generate image data. Figure 1 shows the architecture of GAN, which mainly consists of a discriminator and a generator. The primary role of the discriminator is to distinguish whether the real data are similar to the fake data generated by the generator and feed the judgment result to the generator, thereby optimizing the training of the generator model to generate data. The primary role of the generator is to learn the data distribution of the real data, generate the fake data using the random input noise, and then input the generated fake data into the discriminator for the discrimination process. Therefore, when the discriminator cannot correctly distinguish the generated fake data from the real data, it implies that the generator has learned the data distribution of the original real data. Therefore, the final generated fake data will be very close to the real data distribution.
Ring et al. [11] were the first group to report using the GAN model to generate network traffic data. They used two GAN variants, WGAN [12] and WGAN-GP [13], to generate network traffic data. Their results demonstrated that GAN techniques could efficiently generate network traffic data. Shahid et al. [14] used an autoencoder combined with WGAN and WGAN-GP to generate traffic data for the IoTs. The results of this study revealed that the generated data have very similar data distribution characteristics to those of the real data.
Although the abovementioned related research used new data generation technologies such as an autoencoder and GAN to expand the overall network intrusion detection dataset, it improved the recognition rate of the comprehensive dataset. However, because of the severe data imbalance problem in the network intrusion dataset, the improvement of the recognition rate for rare attack data is still not significant.
3. Data Enhancement Methods
In this study, we applied three data enhancement methods to the rare attack data in the NSL-KDD dataset, including Gaussian noise data enhancement in Section 3.1, WGAN-GP data enhancement in Section 3.2, and SMOTE data enhancement in Section 3.3. These generation methods are described in the following subsections.
3.1. Gaussian Noise Data Enhancement
Gaussian noise is a noise with a normally distributed probability density function, and is often used to enhance the number of image datasets. When an image dataset is too small to train a deep learning model, Gaussian noise can be added to each pixel of the original images to generate more data and reduce the overfitting phenomenon during training, thereby improving the effect of model training. The experiments in this study adopted the same concept by adding Gaussian noise to each feature of the NSL-KDD dataset to increase the amount of data for rare data categories. In addition, some data features of the original dataset were not continuous attributes like the graphical data, but were classified as discrete attributes. However, this study dealt with these data by directly assuming they were continuous, without any additional data transformation processing.
3.2. WGAN-GP Data Enhancement
Another data enhancement method used in this study was WGAN-GP. WGAN-GP is a variant of a generative adversarial network (GAN), an improved version of WGAN. In GAN, the core objective is to make the generated data distribution close to the real data distribution, that is, to make the generated data more like the real data. To compare the real data distribution with the generated data distribution, traditional generative adversarial networks use a metric called Jensen–Shannon divergence (JS divergence) [15], which is based on Kullback–Leibler divergence (KL divergence) [16], as shown in Equation (1), where Pr(x) represents the real data distribution and Pg(x) represents the generated data distribution. The KL divergence calculates the asymmetric distance between the two probability distributions Pr(x) and Pg(x). In contrast, the JS divergence mainly solves the asymmetric problem of the KL divergence, as shown in Equation (2).
However, there is a drawback to this measurement method. When there is no overlap between the real data distribution Pr(x) and the generated data distribution Pg(x), or when the overlap is too small, this phenomenon will cause a gradient of zero or a very small value when the generated adversarial network updates the weights. That is, the weights cannot be updated. This problem occurs when the discriminator is considerably more robust than the generator.
For this purpose, WGAN proposes Wasserstein’s distance, also known as the EM (earth mover) distance, to improve the data distribution measure of the JS divergence in traditional generative adversarial networks (GANs). The Wasserstein distance formula is shown in Equation (3), where the E function denotes the expectation value function.
The advantage of the Wasserstein distance over the JS divergence is that it can still reflect the proximity of the two data distributions Pr(x) and Pg(x) when the two distributions do not overlap. The objective of the WGAN discriminator is to maximize the EM distance between the real data and the generated data, while the objective of the generator is to minimize the EM distance between the real data and the generated data.
In addition, WGAN uses a weight clipping method to constrain the gradient of the weight updating when the weight is updated. This is used to limit the weights of the discriminator to conform to the 1-Lipschitz continuity [17], that is, Equation (4), where K denotes a constant. It is conceptualized as imposing a restriction on the continuous function f by requiring that the elements x1 and x2 in the domain of definition satisfy this condition when K ≥ 0.
However, the weight clipping method may lead to the problem of gradient explosion or gradient disappearance. Therefore, WGAN-GP [13] uses the gradient penalty method to improve these problems caused by the weight clipping method. Equation (5) shows the loss function LWGAN of the original WGAN. Equation (6) illustrates the weight penalty term GP introduced by the WGAN-GP. Equation (7) expresses the main improvement of the WGAN-GP; that is, a new penalty term GP is added to the original loss function of WGAN to replace the original weight clipping method used by the WGAN. This leads to the derivation of the new loss function LWGAN-GP for WGAN-GP in Equation (7). It is found that the use of the gradient penalty makes the network model training more stable and easier to converge. Therefore, our study used WGAN-GP to augment the sparse attack classes in the NSL-KDD dataset.
With respect to the WGAN-GP data enhancement experiments, the network model and the related hyperparameters of the WGAN discriminator are presented in Table 1, and the network model and the related hyperparameters of the WGAN generator are listed in Table 2. The activation functions of both the discriminator and the generator are Leaky ReLU functions, the same as in the original GAN model. The main purpose of using this function was to prevent the output of the activation function from generating zeros. The sigmoid function was used in the last layer of the generator model because the generated feature values had to be normalized to have the same value range as the real data, which were distributed in the interval [0, 1].
3.3. SMOTE Data Enhancement
The third data enhancement technique was the synthetic minority oversampling technique (SMOTE) [5]. In other words, the data of the minority samples were repeatedly sampled or synthesized to generate new sample data. For example, Figure 2 shows some two-dimensional sample data of known human heights and weights. The main idea of SMOTE is to select one data item from a small number of samples, such as the red data point A in Figure 2. The distance between all of the data points and the selected red data point A is calculated according to the k value (Figure 2, assuming k is equal to 3), and then the nearest k data points in its vicinity are found. As shown in Figure 2, the data points in the circle include the selected red data point A, and the three blue data points closest to the red data point are B, C, and D. Then, a random data point is selected from the three closest data points. As shown in Figure 2, data point B is the randomly selected data point among the three data points. Then, n synthetic data are randomly generated between the originally selected data point A and the randomly selected data point B. As shown in Figure 2, suppose n is equal to 2; that is, two new data points, S1 and S2, are synthesized between the red data point A and the blue data point B.
4. Data Enhancement Experimental Methodology
In this section, we present the steps of how to enhance sparse data classes by using three data augmentation methods and how to use machine learning algorithms and neural network models for classification and recognition. There are no definite steps to determine the optimal parameters used in data augmentation models and classification algorithms for different datasets. In this study, we designed a two-stage fine-tuning algorithm, which could be used to analyze the optimal data enhancement models, optimal classifier algorithms, and the related parameters for rare attack data in the NSL-KDD dataset. The two-stage fine-tuning calculation process can be described as follows.
4.1. Two-Stage Fine-Tuning Algorithm
In this subsection, we describe how to use the two-stage fine-tuning algorithm to enhance the detection of sparse attack classes in the NSL-KDD dataset.
The first stage of the two-stage fine-tuning algorithm was to determine which data enhancement models could obtain the best scaling model for sparse data class detection in the NSL-KDD dataset. The detailed flowchart of the first stage is shown in Figure 3. We used three data enhancement models, namely Gaussian noise, WGAN-GP, and SMOTE, to generate 5000 data for each of the sparse data attack classes: Probe, U2R, and R2L. Then, the augmented datasets were fed into different machine learning algorithms and neural network models for training. Finally, we compared the performance of these three data augmentation approaches for classification algorithms to identify sparse data. In this way, the best data augmentation model was found for the data detection of sparse attack classes.
The second stage of the two-stage fine-tuning algorithm is shown in Figure 4. In the first stage of Figure 3, the best data enhancement model and the rare attack class with the best effect were found. Then, the second stage was to find the optimized parameters for this data augmentation model and various classification algorithms that could enhance rare attack detection. First, we used the best enhancement model and the related experimental parameters obtained from the analysis of the first stage as the initial parameter assumptions for the second stage. Then, we proceeded to the second stage of fine-tuning the parameters.
In the first step of Figure 4, all of the feature values of the NSL-KDD dataset were ranked by evaluating their information gain. The second step was to obtain the best number of feature values for each classification algorithm by filtering the feature values and then selecting the appropriate number of feature values to classify the sparse attack classes. In the third step, the best number of features found for each classification algorithm was used to analyze the optimal data-enhanced quantity of the best data enhancement model for each classification algorithm. The final step was to fine-tune the parameters of each classification algorithm. In this study, we focused on designing the number of dense layers of the MLP model and the number of convolution layers of the CNN model. We investigated the correlation between the accuracy rate of the sparse attack classification and the number of model layers. Through this analysis, we identified the best MLP and CNN model designs. Finally, by using the two-stage fine-tuning procedure, we obtained the best accuracy rate for rare attack classes and the best parameters for the best data-enhanced model and classification algorithms.
4.2. Data Enhancement for Rare Data in NSL-KDD
In this study, we applied three data enhancement methods, namely Gaussian noise, WGAN-GP, and SOMTE, to enhance the number of rare data types in the NSL-KDD dataset. As shown in Table 3, the original training dataset in NSL-KDD contained a total of 125,973 data items, including 67,343 normal traffic data items, 11,656 Probe attack data items, 45,927 DoS attack data items, 52 U2R attack data items, and 995 R2L attack data items. In our data augmentation experiments, data augmentation was performed for each of the three types of rare data attacks, namely Probe, U2R, and R2L, respectively, adding an additional 5000 data items for each type. The percentage distribution of the Probe-enhanced training data only is illustrated in Table 4, which clearly shows that the percentage of Probe rare data increased from 9.25% before the enhancement to 12.72% after the enhancement. When only U2R was enhanced for the training data, the obtained percentage distribution of the category for the enhanced U2R is illustrated in Table 5, which clearly shows that the percentage of U2R rare data increased from 0.04% before enhancement to 3.59% after enhancement. Similarly, if the training data were enhanced for R2L only, the category distribution is illustrated in Table 6, which clearly shows that the percentage of R2L rare data increased from 0.79% before enhancement to 4.58% after enhancement.
In the first stage of the two-stage fine-tuning algorithm, we used three data augmentation methods to enhance the rare data classes according to the data quantities of classes in Table 4, Table 5, and Table 6, respectively. Then, we utilized four machine learning algorithms and two neural network models for training and classifying these augmented datasets. The obtained experimental results were used to analyze the performance of three data augmentation methods for recognizing these rare data types.
4.3. Classification Algorithms for Enhanced NSL-KDD
For the classification training on the enhanced NSL-KDD dataset, various classification algorithms were used in this study, including machine learning algorithms KNN [18], SVM [19], random forest [20], and XGBoost [21]; and neural network models MLP [22] and CNN [23]. As there were 41 features in the NSL-KDD dataset, and the CNN algorithm mainly dealt with the image recognition of two-dimensional data, the CNN model could not be directly used to train the feature data of NSL-KDD. In order to convert the NSL-KDD feature data into a two-dimensional matrix form, this experiment removed one feature and turned it into 40 features, which were converted into a 5 × 8 two-dimensional matrix form. In data preprocessing, we also had to convert the non-numerical features into numerical data and used regularization methods to uniformly scale all the features to the interval [0, 1].
5. Discussion of Experimental Results
5.1. First-Stage Experimental Results
This section presents the experimental results of the first stage of the proposed two-stage fine-tuning algorithm. In this stage, we applied the Gaussian noise, WGAN-GP, and SMOTE data augmentation techniques to enhance the sparse data classes Probe, U2R, and R2L in the NSL-KDD dataset, respectively. The augmented data were then combined with the original dataset for retraining and classification. As shown in the following six tables, the generated sparse data classes such as Probe, U2R, and R2L included the enhanced data of each attack class and were merged into the original training dataset. Table 7 and Table 8 show the results of our experiments conducted using machine learning algorithms and neural network models to identify the Gaussian noise data enhancement, respectively. Table 9 and Table 10 show the experimental results of identifying WGAN-GP data enhancement by using machine learning algorithms and neural network models, respectively. Table 11 and Table 12 show the results of our experiments conducted using machine learning algorithms and neural network models to identify the SMOTE data enhancement, respectively.
Table 7, Table 8, Table 9, Table 10, Table 11 and Table 12 revealed that the data enhancement experiments of the Probe attack class achieved good results on the NSL-KDD dataset, irrespective of whether the Gaussian noise, WGAN-GP, or SMOTE methods were used to enhance the data. Most of the classifiers could effectively improve the recognition accuracy of the Probe class. For the other two rare attack classes, U2R and R2L, although most of the data enhancement techniques could also improve the recognition accuracy of these two attack classes, the accuracy rate was still very low. Observing these two types of experimental data revealed that for all algorithmic classifiers, even when data augmentation was used to improve the sparse data problem, these two types of attacks were difficult to identify effectively. In our opinion, the possible reason was that the percentage of this enhanced class was still very low as compared to the percentages of other classes. When the percentage of a certain type of data distribution was very low, it could easily be considered noise and could not be identified by machine learning and neural network models. In fact, for the U2R or R2U class, the augmented 5000 data items might be distorted, and the percentages of these two data distributions were still very low as compared to the other classes to improve the recognition accuracies of these two data types. Due to the extreme paucity of information on these two types of attacks, U2R and R2L, it is difficult to make significant improvements using different data enhancement techniques. Priority should be given to increasing the collection of real data on this type of data. When the amount of data or the accuracy of recognition reaches a certain level, data enhancement technology can be used to improve it. Therefore, in the second stage of the experiments, we only fine-tuned the parameters of the experiments related to the Probe data enhancement.
Further looking at the data, for Probe attack detection, using the Gaussian noise enhancement could improve the SVM classification accuracy to 71%, both the MLP classification accuracy and KNN classification accuracy to 70%, and the CNN classification accuracy to 64%. Among them, SVM had the highest accuracy rate of 71%, and CNN had the highest improvement rate of 7%. When WGAN-GP was used to enhance the Probe data, the accuracy of both the SVM classification and the MLP classification could be improved to 74%, and the accuracy of the CNN classification could be improved to 72%. Among them, the SVM and MLP classifiers had the highest accuracy, both at 74%. CNN had the highest improvement rate of 15%, followed by MLP at 7%. If SMOTE was used to enhance the Probe data, the accuracy rate of the MLP classification could be improved to 73% as the highest, and the accuracy rate of the SVM classification could be improved to 72%. The accuracy rate of the CNN classification was only 60% for the Probe data identification.
Overall, for most of the classifiers, the WGAN-GP enhancement had a higher accuracy rate and improvement rate than the Gaussian noise enhancement and the SMOTE enhancement in the case of sparse data detection, particularly for Probe attack detection. From the experimental results, we concluded that using WGAN-GP to enhance the rare data of the Probe attack could enhance the classification of MLP with the best results, and the accuracy rate could be significantly improved to 74%, which was 4% higher than that in the case of the Gaussian noise enhancement, 1% higher than that in the case of the SMOTE enhancement, and 7% higher than that in the unenhanced case.
5.2. Second-Stage Experimental Results
This section describes the experimental process and results of the second stage of the two-stage fine-tuning algorithm. The first step of the second stage was to rank all of the feature values of the NSL-KDD dataset in descending order by evaluating the information gain (I.G.) values [24]. Table 13 shows the ranking list values for the top 15 I.G. values.
Information gain is calculated by entropy. Entropy is mainly used in machine learning to measure the amount of information obtained after the classification of each feature. The smaller the entropy, the larger the amount of information obtained. For classification, the greater the amount of information, the better the classification, that is, the higher the priority for decision making.
Equation (8) represents the definition of entropy. For classification, when the entropy was larger, that is, the uncertainty of a certain classification feature X = xi was greater, more information was needed to specify the classification status, that is, the classification was less effective. Equation (9) expresses the conditional entropy of a random variable Y conditional on a random variable X. Y is often used as a classification label. X = xi is often used to indicate the selection of a feature xi. Finally, Equation (10) defines information gain as the information entropy of set Y to be classified, minus the conditional information entropy of Y for a feature X. Information gain is usually used as an indicator for feature selection in decision trees. For classification, a larger information gain means a better selection of feature X over label Y, that is, a better classification effect.
In the second stage of the fine-tuning process, we first calculated the information gain values of all the NSL-KDD features and then arranged them in descending order to form Table 13. The higher the information gain of the features in this table was, the better the classification effect was. Therefore, in the next step of studying the optimal number of feature values, we followed the priority of deleting the feature with the smallest information gain in Table 13.
Gain(Y|X) = Entropy(Y) − Entropy(Y|X)
5.2.1. Analysis of Optimal Number of Features
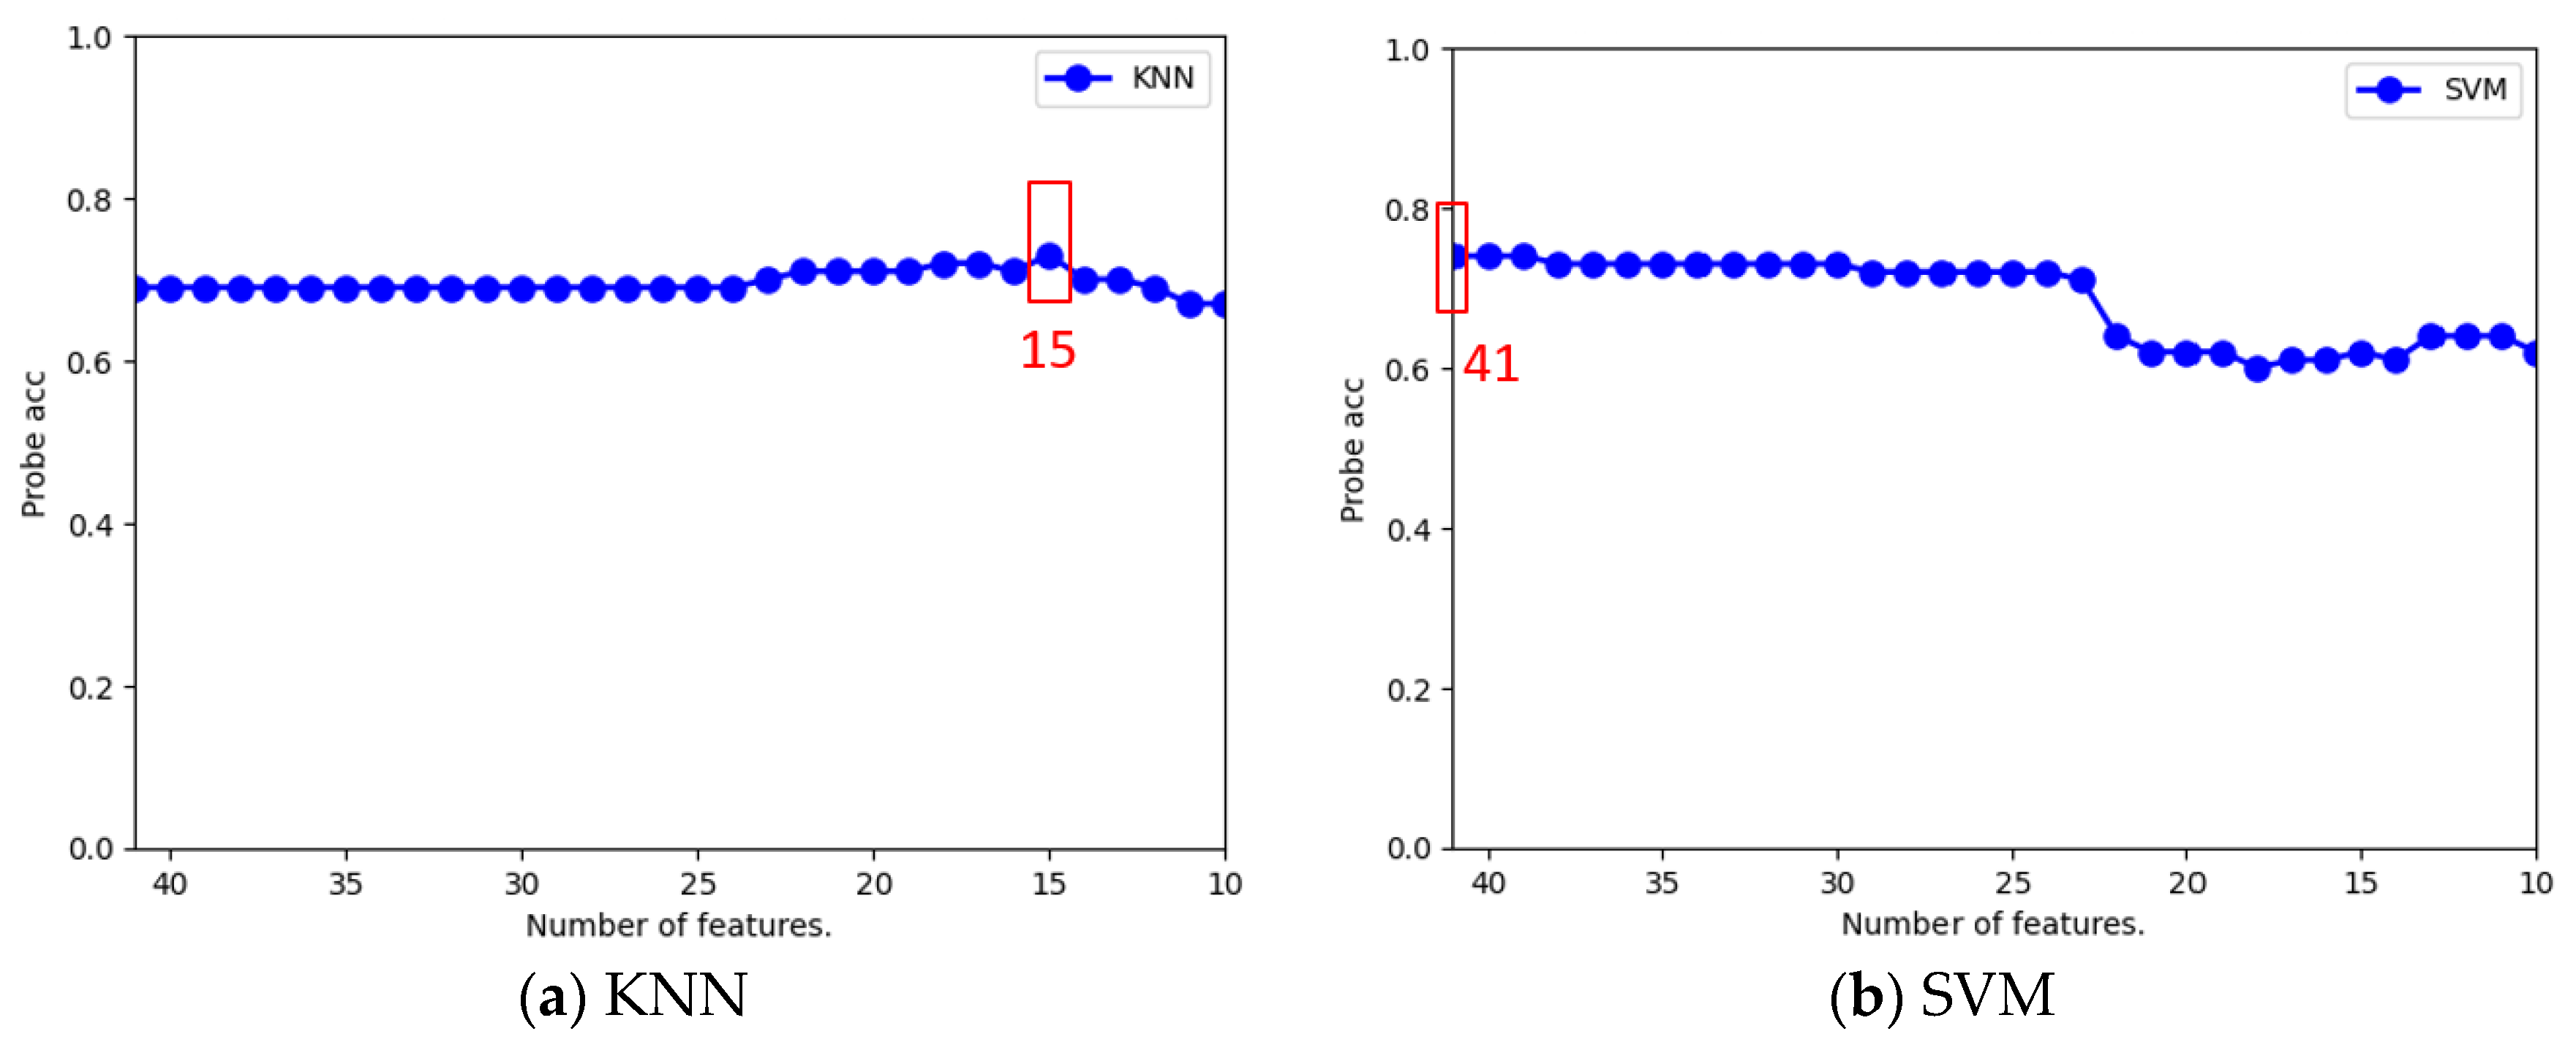
According to the experimental results analyzed in the first phase of the previous section, WGAN-GP served as the best data generation model for the rare attack type Probe. Therefore, on the basis of WGAN-GP, the second stage of the fine-tuning algorithm was conducted to find the optimal parameters of the WGAN-GP generation model and classification algorithms. We first applied the experimental parameters of the initial WGAN-GP model and the classification algorithms in the first stage. Then, we carried out the performance study of the classification experiments by using the number of feature values filtered according to the I.G. ranking in Table 13. From these experiments, we observed whether the accuracy of the Probe recognition could be further improved by reducing the number of ranking features. Figure 5, Figure 6 and Figure 7 show the accuracies of six classifiers for the Probe detection in terms of the number of filtered features, respectively.
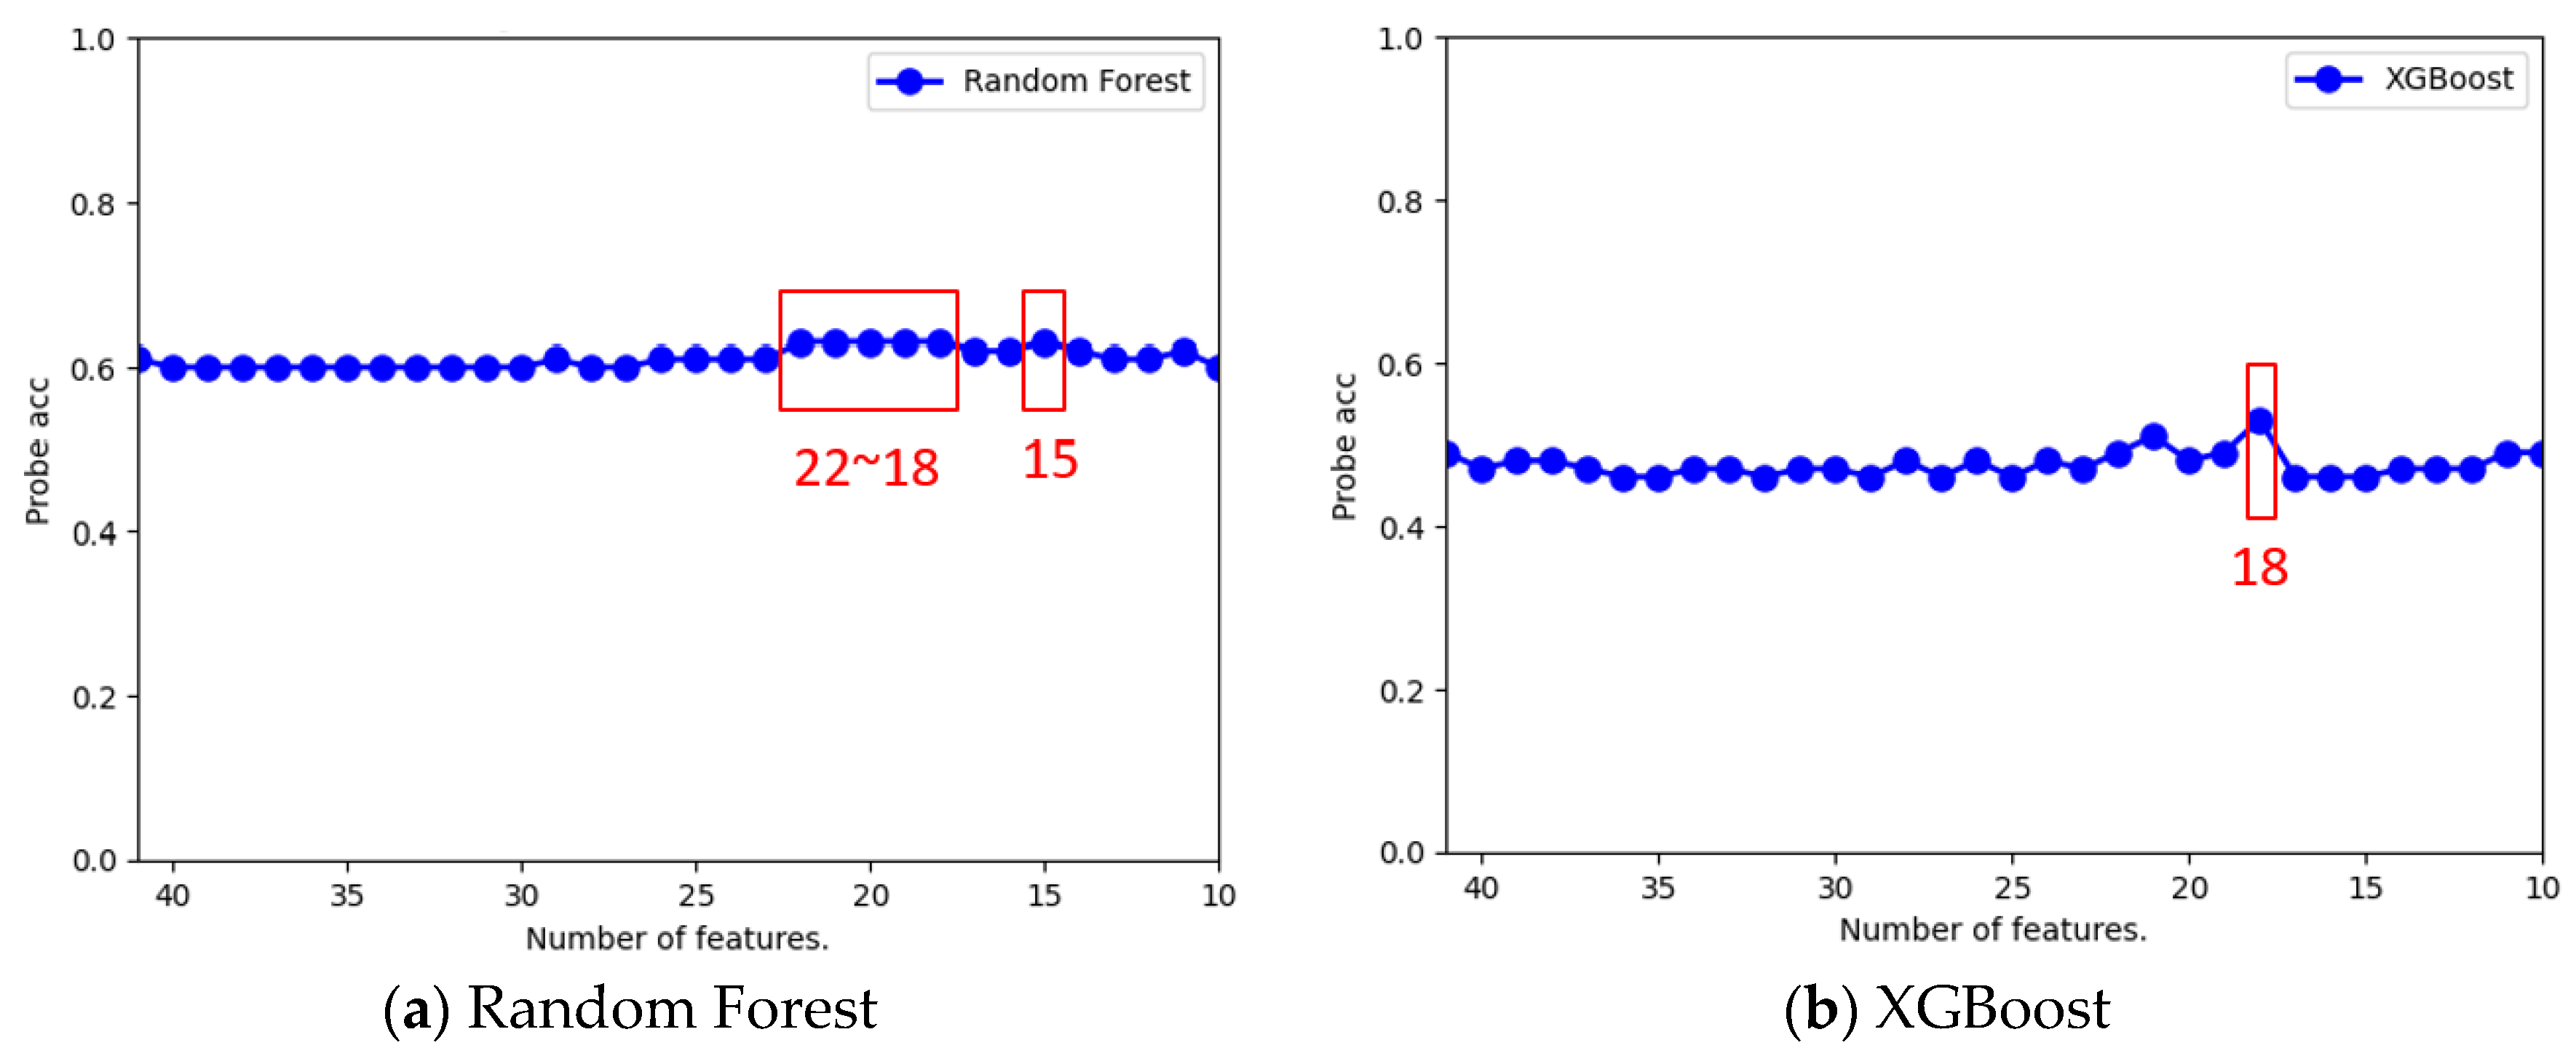
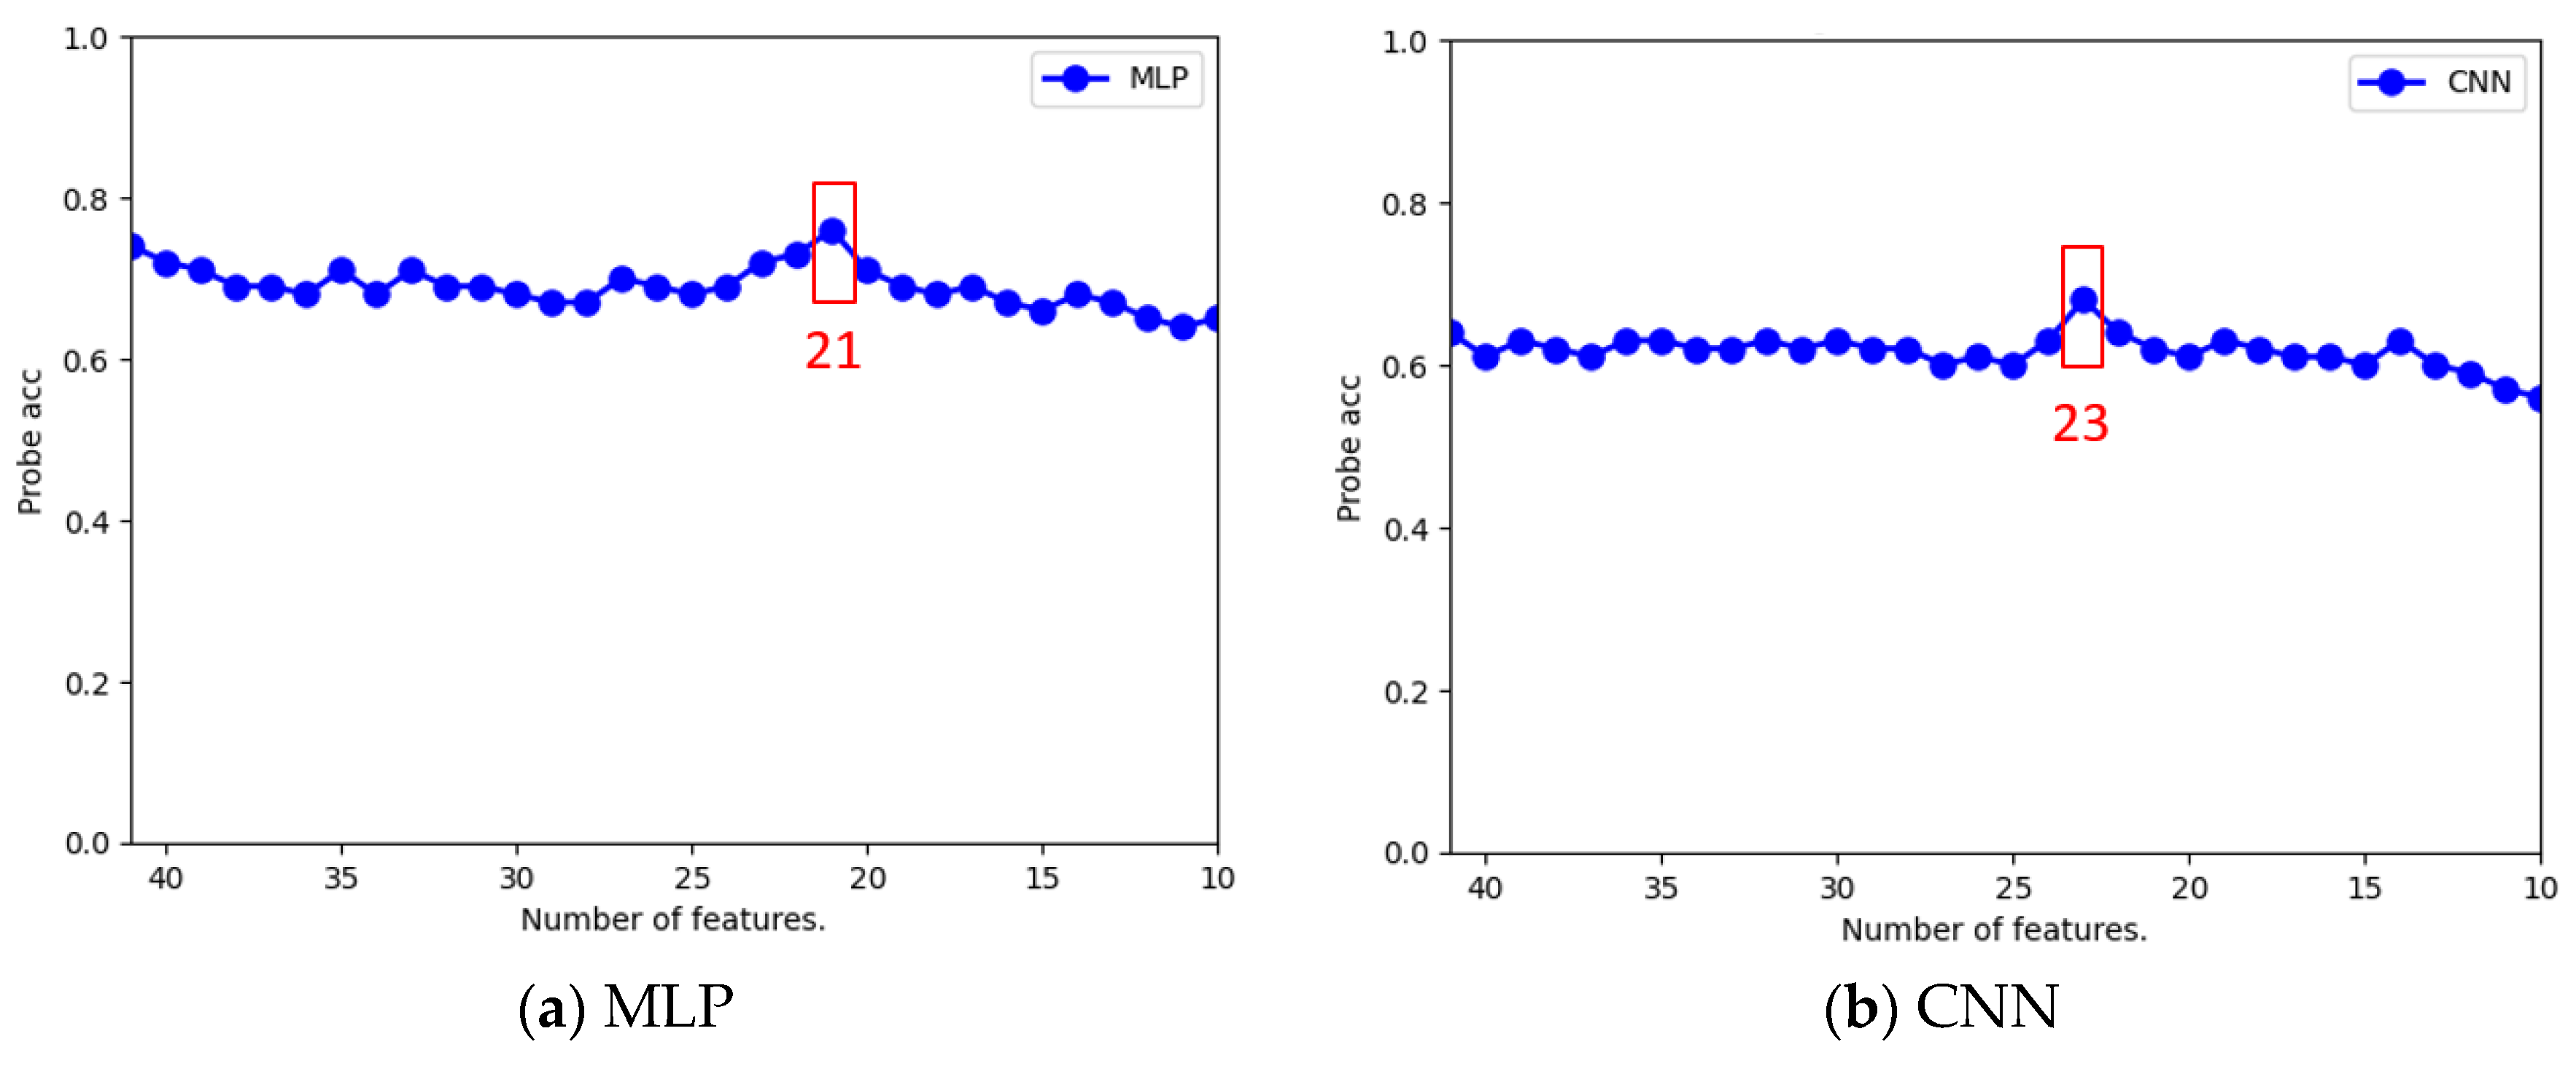
Figure 5a shows that when the feature number was changed to 15, the Probe recognition accuracy of the KNN classifier increased to 73% as the maximum. In Figure 5b, the data diagram of the SVM classifier shows that when the number of features was reduced, there was no significant improvement in the Probe recognition accuracy, but there was a decrease in the accuracy. As shown in Figure 6a, in the case of the random forest classifier, when the number of features was reduced to 22, 21, 20, 19, 18, and 15, the Probe recognition accuracy rate increased to a maximum of 63%. For the XGBoost classifier in Figure 6b, a maximum of 53% improvement in the Probe recognition accuracy rate was observed when the number of features decreased to 18. The MLP classifier in Figure 7a revealed that when the number of features decreased to 21, the Probe recognition accuracy rate increased to a maximum of 76%. Similarly, the CNN classifier in Figure 7b shows that when the number of features dropped to 23, the Probe recognition accuracy increased again, rising to a maximum of 68%.
Table 14 summarizes the analysis results of the optimal number of features for each classification. As can be seen from this table, feature selection could effectively improve the accuracy of the Probe attack recognition. Moreover, when the number of features decreased, the time required for model training and recognition could be reduced. For the MLP classifier in this table, we found that the Probe recognition accuracy increased to a maximum of 76% when fine-tuning the feature number, which was higher than 74% without fine tuning in Table 10 of the first-stage experimental results.
5.2.2. Analysis of Optimal Number of Data Items Enhanced
On the basis of the results of the abovementioned feature number analysis, we selected the number of features with the highest accuracy for each classification according to the I.G. ranking table. Next, we analyzed the number of Probe data augmentations for the WGAN-GP data enhancement model. The number of augmented data items ranged from 1000 to 10,000. The datasets with different numbers of Probe data items augmented by WGAN-GP were fed to all of the classifiers with the best number of features. The effect of different numbers of Probe data augmentations was examined as follows.
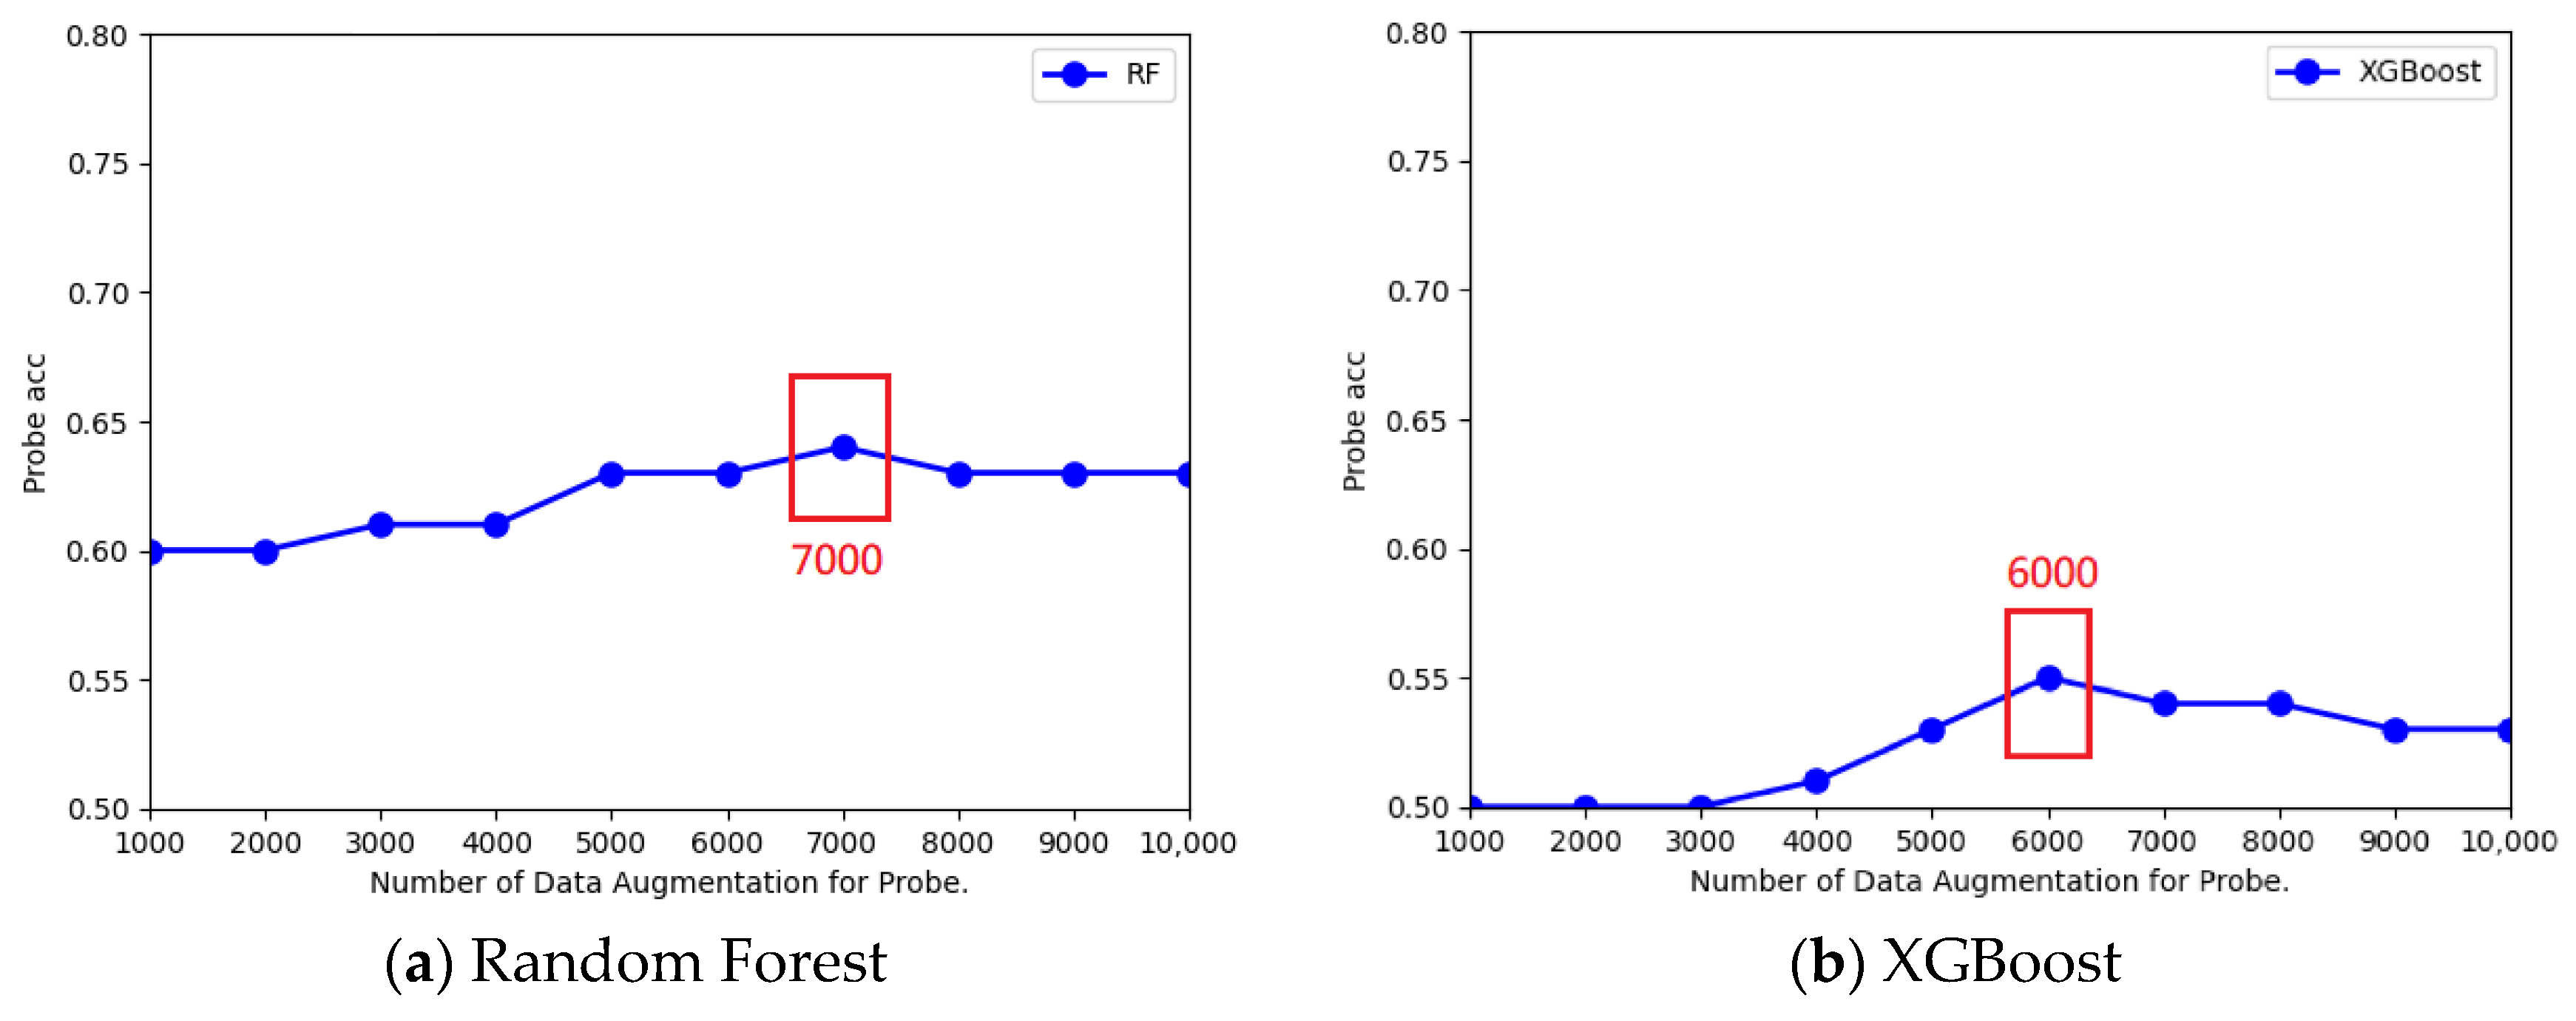
Figure 8a shows that when the number of augmentations was changed to 8000, the Probe recognition accuracy of the KNN classifier increased to 76% as the maximum. As for the SVM classifier in Figure 8b, we found that the accuracy of the Probe recognition increased to a maximum value of 75% when the augmentation number became 8000. For the random forest classifier in Figure 9a, when the augmentation number became 7000, the Probe recognition accuracy increased to 64% of the maximum value. For the XGBoost classifier in Figure 9b, a maximum of 55% improvement in the Probe recognition accuracy rate was found when the augmentation number became 6000. As for the MLP classifier in Figure 10a, the Probe recognition accuracy increased to 78% of the maximum value when the augmentation number became 6000. For the CNN classifier in Figure 10b, the Probe recognition accuracy increased to 72% as the maximum when the number of data augmentations became 8000.
The results of the best recognition accuracy for different classifiers based on the optimal Probe enhancement number of WGAN-GP are shown in Table 15. We found that when using WGAN-GP, the optimal number of data augmentations to achieve the best Probe recognition accuracy was not necessarily the same for different classifiers, basically exceeding the 5000 augmentations assumed in the first stage. Table 15 shows that the accuracy of the Probe attack recognition was improved again by the two-stage fine-tuning approach when using different augmentation numbers generated by WGAN-GP for different classifiers. For the MLP classifier in Table 15, further fine tuning of the augmentation number improved the Probe recognition accuracy by 78%, which was the highest among all of the classifiers, and was higher than the 76% in Table 14 for only fine-tuning the feature number.
5.2.3. Analysis of Optimal Number of Model Layers
Based on the above results of fine-tuning the numbers of feature values and data augmentations, we further discuss the effect of fine-tuning the layer design of the MLP and CNN classifiers on the Probe recognition accuracy. Because of the different structures of the MLP and CNN models, the experiments at this stage were mainly aimed at the design of changing the dense depth of MLP and the convolutional depth of CNN. The experimental results are presented in Figure 11a, which shows the effect of changing the number of dense layers of the MLP classifier on the Probe recognition accuracy. In contrast, the experiment shown in Figure 11b analyzed the effect of the convolutional layers of the CNN classifier on the probe recognition accuracy.
The experimental results of Figure 11 show that the model design with different depths of the neural network models MLP and CNN had a significant impact on the accuracy of Probe recognition. As shown in Figure 11a, when the number of dense layers used in MLP was four, the accuracy of Probe recognition could be improved up to the maximum of 80%. As shown in Figure 11b, when the CNN algorithm was designed with six convolution layers, the Probe recognition accuracy was improved to a maximum of 73%. Moreover, we found that the accuracy of Probe recognition decreased when the number of layers in both of the models became very large. This indicated that both of the classification models could easily cause the overfitting phenomenon if the design was too complicated for the NSL-KDD dataset.
The results of the optimal model depth and the Probe recognition accuracy analysis for the neural network models MLP and CNN are shown in Table 16. This table shows that the accuracy of the Probe attack recognition could be further improved by fine-tuning the depth of the model for different neural network models by means of two-stage fine-tuning. For the MLP classifier in Table 16, when the number of dense layers was fine-tuned further, the Probe recognition accuracy improved up to 80%, which was higher than the 78% in Table 15 for only fine-tuning both the feature number and the data-enhanced number.
After the two-stage fine-tuning process, we fine-tuned the parameters of the numbers of feature values, the numbers of Probe data augmentations, and the depths of the neural network models, and finally obtained the hyperparameter table for the best Probe recognition accuracy, as shown in Table 17. From the results of the first-stage experiments in Table 9 and Table 10, compared with the results of the second-stage experiments of fine-tuning the parameters in Table 17, we found that the Probe recognition accuracy for all of the classifiers improved significantly after the fine tuning of the parameters in the second stage. In particular, the MLP classifier could significantly improve the Probe recognition accuracy from 74% to 80% after fine tuning, which was the highest among all of the classifiers. Furthermore, the proposed WGAN-GP data enhancement with two stage fine tuning improved by 10%, 7%, and 13% over the untuned Gaussian noise enhancement, untuned SMOTE enhancement, and no enhancement, respectively.
6. Conclusions
In today’s era of ubiquitous Internet of Things and mobile network applications, it is obvious that network attacks have become more frequent. Therefore, the study of network security and defense is becoming increasingly important. Traditional network intrusion detection systems (NIDS) are no longer effective in detecting ever-changing network attacks. The use of artificial intelligence to improve NIDS has been an important trend in recent years. However, many of the NIDS datasets currently used by scholars suffer from a serious data imbalance. That is, it is particularly difficult to identify the classes of these sparse attack data by using machine learning and deep learning algorithms. Therefore, this research studied three data augmentation methods to increase the distribution percentage of the sparse attack class. Upon increasing the distribution percentage, the recognition accuracy rate of the sparse data classes could be improved. We also proposed a two-stage fine-tuning algorithm to optimize the data-enhanced model and all of the important parameters of the classification algorithms, which could further improve the recognition accuracy rate of the sparse attack data. The experimental results revealed that the MLP classification accuracy of the Probe attack sparse data could be significantly improved by using WGAN-GP data augmentation and the fine-tuning algorithm. However, for attack data with extremely sparse information, such as U2R and R2L in NSLKDD, we should prioritize increasing the collection of real data instead of using data augmentation. For attack data with a certain amount of data, such as Probe attack data in NSLKDD, the method provided in this paper can be used to improve the attack identification accuracy.
Author Contributions
Conceptualization, G.-C.L.; methodology, G.-C.L. and J.-H.L.; software, J.-H.L.; validation, G.-C.L., J.-H.L. and Z.-Y.L.; formal analysis, G.-C.L. and J.-H.L.; investigation, G.-C.L. and J.-H.L.; resources, G.-C.L.; data curation, G.-C.L., J.-H.L. and Z.-Y.L.; writing—original draft preparation, G.-C.L. and Z.-Y.L.; writing—review and editing, G.-C.L. and Z.-Y.L.; visualization, G.-C.L. and Z.-Y.L.; supervision, G.-C.L.; project administration, G.-C.L.; funding acquisition, G.-C.L. All authors have read and agreed to the published version of the manuscript.
Funding
This research received no external funding.
Institutional Review Board Statement
Not applicable.
Informed Consent Statement
Not applicable.
Data Availability Statement
Not applicable.
Conflicts of Interest
The authors declare no conflict of interest.
References
- Reddy, L.N.; Butakov, S.; Zavarsky, P. Applying ML algorithms to improve traffic classification in intrusion detection systems. In Proceedings of the 2020 IEEE 19th International Conference on Cognitive Informatics & Cognitive Computing (ICCI* CC), Beijing, China, 26–28 September 2020; pp. 1–6. [Google Scholar]
- Chopra, A.; Behal, S.; Sharma, V. Evaluating machine learning algorithms to detect and classify DDoS attacks in IoT. In Proceedings of the 2021 8th International Conference on Computing for Sustainable Global Development (INDIACom), New Delhi, India, 17–19 March 2021; pp. 517–521. [Google Scholar]
- Dipon, T.M.; Hossain, M.S.; Narman, H.S. Detecting network intrusion through anomalous packet identification. In Proceedings of the 2020 30th International Telecommunication Networks and Applications Conference (ITNAC), Melbourne, Australia, 25–27 November 2020; pp. 1–6. [Google Scholar]
- Sadioura, J.S.; Singh, S.; Das, A. Selection of sub-optimal feature set of network data to implement machine learning models to develop an efficient NIDS. In Proceedings of the 2019 International Conference on Data Science and Engineering (ICDSE), Patna, India, 26–28 September 2019; pp. 120–125. [Google Scholar]
- Chawla, N.V.; Bowyer, K.W.; Hall, L.O.; Kegelmeyer, W.P. SMOTE: Synthetic minority over-sampling technique. J. Artif. Intell. Res. 2002, 16, 321–357. [Google Scholar] [CrossRef]
- Yan, B.; Han, G.; Sun, M.; Ye, S. A novel region adaptive SMOTE algorithm for intrusion detection on imbalanced problem. In Proceedings of the 2017 3rd IEEE International Conference on Computer and Communications (ICCC), Chengdu, China, 13–16 December 2017; pp. 1281–1286. [Google Scholar]
- Bunkhumpornpat, C.; Sinapiromsaran, K.; Lursinsap, C. Safe-level-SMOTE: Safe-level-synthetic minority over-sampling technique for handling the class imbalanced problem. In Proceedings of the Pacific-Asia conference on knowledge discovery and data mining, Bangkok, Thailand, 27–30 April 2009; pp. 475–482. [Google Scholar]
- Gad, A.R.; Nashat, A.A.; Barkat, T.M. Intrusion detection system using machine learning for vehicular ad hoc networks based on ToN-IoT dataset. IEEE Access 2021, 9, 142206–142217. [Google Scholar] [CrossRef]
- Lee, B.-S.; Kim, J.-W.; Choi, M.-J. Experimental Comparison of Hybrid Sampling Methods for an Efficient NIDS. In Proceedings of the 2022 23rd Asia-Pacific Network Operations and Management Symposium (APNOMS), Takamatsu, Japan, 28–30 September 2022; pp. 1–4. [Google Scholar]
- Goodfellow, I.; Pouget-Abadie, J.; Mirza, M.; Xu, B.; Warde-Farley, D.; Ozair, S.; Courville, A.; Bengio, Y. Generative adversarial networks. Commun. ACM 2020, 63, 139–144. [Google Scholar] [CrossRef]
- Ring, M.; Schlör, D.; Landes, D.; Hotho, A. Flow-based network traffic generation using generative adversarial networks. Comput. Secur. 2019, 82, 156–172. [Google Scholar] [CrossRef] [Green Version]
- Arjovsky, M.; Chintala, S.; Bottou, L. Wasserstein generative adversarial networks. In Proceedings of the International Conference on Machine Learning, Sydney, Australia, 7–9 August 2017; pp. 214–223. [Google Scholar]
- Gulrajani, I.; Ahmed, F.; Arjovsky, M.; Dumoulin, V.; Courville, A. Improved training of wasserstein GANs. In Proceedings of the 31st International Conference on Neural Information Processing Systems, Long Beach, CA, USA, 4–9 December 2017; pp. 5769–5779. [Google Scholar]
- MShahid, R.; Blanc, G.; Jmila, H.; Zhang, Z.; Debar, H. Generative deep learning for internet of things network traffic generation. In Proceedings of the 2020 IEEE 25th Pacific Rim International Symposium on Dependable Computing (PRDC), Perth, Australia, 1–4 December 2020; pp. 70–79. [Google Scholar]
- Endres, D.M.; Schindelin, J.E. A new metric for probability distributions. IEEE Trans. Inf. Theory 2003, 49, 1858–1860. [Google Scholar] [CrossRef] [Green Version]
- Kullback, S.; Leibler, R.A. On information and sufficiency. Ann. Math. Stat. 1951, 22, 79–86. [Google Scholar] [CrossRef]
- Heinonen, J. Lectures on Lipschitz Analysis, No. 100; University of Jyväskylä: Jyväskylä, Finland, 2005. [Google Scholar]
- Altman, N.S. An introduction to kernel and nearest-neighbor nonparametric regression. Am. Stat. 1992, 46, 175–185. [Google Scholar] [CrossRef] [Green Version]
- Cortes, C.; Vapnik, V. Support-vector networks. Mach. Learn. 1995, 20, 273–297. [Google Scholar] [CrossRef]
- Breiman, L. Random forests. Mach. Learn. 2001, 45, 5–32. [Google Scholar] [CrossRef] [Green Version]
- Chen, T.; Guestrin, C. XGBoost: A scalable tree boosting system. In Proceedings of the 22nd ACM SIGKDD International Conference on Knowledge Discovery and Data Mining, San Francisco, CA, USA, 13–17 August 2016; pp. 785–794. [Google Scholar]
- Rumelhart, D.E.; Hinton, G.E.; Williams, R.J. Learning Internal Representations by Error Propagation; California University San Diego La Jolla Institute for Cognitive Science: San Diego, CA, USA, 1985. [Google Scholar]
- Krizhevsky, A.; Sutskever, I.; Hinton, G.E. ImageNet classification with deep convolutional neural networks. Commun. ACM 2017, 60, 84–90. [Google Scholar] [CrossRef] [Green Version]
- Raileanu, L.E.; Stoffel, K. Theoretical comparison between the gini index and information gain criteria. Ann. Math. Artif. Intell. 2004, 41, 77–93. [Google Scholar] [CrossRef]
Figure 1.
Generative adversarial network (GAN) architecture.

Figure 2.
Two synthesized data points for SMOTE-enhanced data.

Figure 3.
First stage of two-stage fine tuning: analysis of data generating models for rare attack class.
Figure 3.
First stage of two-stage fine tuning: analysis of data generating models for rare attack class.

Figure 4.
Second stage of two-stage fine tuning: parameter fine-tuning procedure.

Figure 5.
Accuracy of probe attack detection for various feature numbers of KNN and SVM.

Figure 6.
Accuracy of probe attack detection for various feature numbers of random forest and XGBoost.
Figure 6.
Accuracy of probe attack detection for various feature numbers of random forest and XGBoost.

Figure 7.
Accuracy of probe attack detection for various feature numbers of MLP and CNN.

Figure 8.
Accuracy of probe attack detection for various numbers of probe data items enhanced for KNN and SVM.
Figure 8.
Accuracy of probe attack detection for various numbers of probe data items enhanced for KNN and SVM.

Figure 9.
Accuracy of probe attack detection for various numbers of probe data items enhanced for random forest and XGBoost.
Figure 9.
Accuracy of probe attack detection for various numbers of probe data items enhanced for random forest and XGBoost.

Figure 10.
Accuracy of probe attack detection for various numbers of probe data items enhanced for MLP and CNN.
Figure 10.
Accuracy of probe attack detection for various numbers of probe data items enhanced for MLP and CNN.

Figure 11.
Accuracy of probe attack detection for various layer numbers of model design for MLP and CNN.
Figure 11.
Accuracy of probe attack detection for various layer numbers of model design for MLP and CNN.


Table 1.
WGA-GP discriminator model.
| Discriminator Model | |
|---|---|
| Layer | Hyperparameter Values |
| Input Layer | Shape: 6, 7, 1 |
| Conv2D | Kernels: 64 Kernel size: 3, 3 Strides: 2, 2 Padding: same Use bias: true |
| Conv2D | Kernels: 128 Kernel size: 3, 3 Strides: 2, 2 Padding: same Use bias: true |
| Leaky ReLU | Alpha: 0.2 |
| Dropout | Rate: 0.3 |
| Flatten | Output shape: 512 |
| Dropout | Rate: 0.2 |
| Dense | Output shape: 1 |
Table 2.
WGAN-GP generator model.
| Generator Model | |
|---|---|
| Layer | Hyperparameter Values |
| Input Layer | Shape: 1024 |
| Dense | Shape: 2, 2, 256 |
| Batch Normalization | Default |
| Leaky ReLU | Alpha: 0.2 |
| Reshape | Shape: 2, 2, 256 |
| UpSampling2D | Up size: 2, 2 |
| Conv2D | Kernels: 128 Kernel size: 3, 3 Strides: 1, 1 Padding: same |
| Batch Normalization | Default |
| Leaky ReLU | Alpha: 0.2 |
| UpSampling2D | Up size: 2, 2 |
| Conv2D | Kernels: 1 Kernel size: 3, 3 Strides: 1, 1 Padding: same |
| Batch Normalization | Default |
| Sigmoid | Default |
| Cropping2D | Cropping: 1, 1, 0, 1 |
Table 3.
Class distribution of the original NSL-KDD training dataset.
| Label | Class | Quantity | Percentage |
|---|---|---|---|
| 0 | Normal | 67,343 | 53.46% |
| 1 | Probe | 11,656 | 9.25% |
| 2 | DoS | 45,927 | 36.46% |
| 3 | U2R | 52 | 0.04% |
| 4 | R2L | 995 | 0.79% |
| All | 125,973 | 100.00% |
Table 4.
Class distribution of NSL-KDD after Probe data enhancement.
| Label | Class | Quantity | Percentage |
|---|---|---|---|
| 0 | Normal | 67,343 | 51.42% |
| 1 | Probe | 16,656 | 12.72% |
| 2 | DoS | 45,927 | 35.06% |
| 3 | U2R | 52 | 0.04% |
| 4 | R2L | 995 | 0.76% |
| All | 130,973 | 100.00% |
Table 5.
Class distribution of NSL-KDD after U2R data enhancement.
| Label | Class | Quantity | Percentage |
|---|---|---|---|
| 0 | Normal | 67,343 | 51.42% |
| 1 | Probe | 11,656 | 8.90% |
| 2 | DoS | 45,927 | 35.06% |
| 3 | U2R | 5052 | 3.59% |
| 4 | R2L | 995 | 0.76% |
| All | 130,973 | 100.00% |
Table 6.
Class distribution of NSL-KDD after R2L data enhancement.
| Label | Class | Quantity | Percentage |
|---|---|---|---|
| 0 | Normal | 67,343 | 51.42% |
| 1 | Probe | 10,656 | 8.90% |
| 2 | DoS | 45,927 | 35.06% |
| 3 | U2R | 52 | 0.04% |
| 4 | R2L | 5995 | 4.58% |
| All | 130,973 | 100.00% |
Table 7.
Accuracy of machine learning algorithms with Gaussian noise rare data enhancement (%).
| KNN | SVM | Random Forest | XGBoost | |||||||||
|---|---|---|---|---|---|---|---|---|---|---|---|---|
| Attack Class | Original Data | Enhanced Data | Improved Rate | Original Data | Enhanced Data | Improved Rate | Original Data | Enhanced Data | Improved Rate | Original Data | Enhanced Data | Improved Rate |
| Probe | 68% | 70% | 2% | 70% | 71% | 1% | 60% | 62% | 2% | 45% | 47% | 2% |
| U2R | 0% | 0% | 0% | 7% | 11% | 4% | 1% | 7% | 6% | 2% | 6% | 4% |
| R2L | 1% | 5% | 4% | 0% | 6% | 6% | 1% | 3% | 2% | 4% | 7% | 3% |
Table 8.
Accuracy of neural network models with Gaussian noise rare data enhancement (%).
| MLP | CNN | |||||
|---|---|---|---|---|---|---|
| Attack Class | Original Data | Enhanced Data | Improved Rate | Original Data | Enhanced Data | Improved Rate |
| Probe | 67% | 70% | 3% | 57% | 64% | 7% |
| U2R | 7% | 9% | 2% | 1% | 4% | 3% |
| R2L | 0% | 4% | 4% | 0% | 4% | 4% |
Table 9.
Accuracy of machine learning algorithms with WGAN-GP rare data enhancement (%).
| KNN | SVM | Random Forest | XGBoost | |||||||||
|---|---|---|---|---|---|---|---|---|---|---|---|---|
| Attack Class | Original Data | Enhanced Data | Improved Rate | Original Data | Enhanced Data | Improved Rate | Original Data | Enhanced Data | Improved Rate | Original Data | Enhanced Data | Improved Rate |
| Probe | 68% | 68% | 0% | 70% | 74% | 4% | 60% | 61% | 1% | 45% | 49% | 4% |
| U2R | 0% | 6% | 6% | 7% | 10% | 3% | 1% | 1% | 0% | 2% | 4% | 2% |
| R2L | 1% | 4% | 3% | 0% | 1% | 1% | 1% | 1% | 0% | 4% | 6% | 2% |
Table 10.
Accuracy of neural network models with WGAN-GP rare data enhancement (%).
| MLP | CNN | |||||
|---|---|---|---|---|---|---|
| Attack Class | Original Data | Enhanced Data | Improved Rate | Original Data | Enhanced Data | Improved Rate |
| Probe | 67% | 74% | 7% | 57% | 72% | 15% |
| U2R | 7% | 11% | 4% | 1% | 5% | 4% |
| R2L | 0% | 3% | 3% | 0% | 5% | 5% |
Table 11.
Accuracy of machine learning algorithms with SMOTE rare data enhancement (%).
| KNN | SVM | Random Forest | XGBoost | |||||||||
|---|---|---|---|---|---|---|---|---|---|---|---|---|
| Attack Class | Original Data | Enhanced Data | Improved Rate | Original Data | Enhanced Data | Improved Rate | Original Data | Enhanced Data | Improved Rate | Original Data | Enhanced Data | Improved Rate |
| Probe | 68% | 68% | 0% | 70% | 72% | 2% | 60% | 59% | −1% | 45% | 48% | 3% |
| U2R | 0% | 14% | 14% | 7% | 10% | 3% | 1% | 1% | 0% | 2% | 3% | 1% |
| R2L | 1% | 8% | 7% | 0% | 15% | 15% | 2% | 4% | 2% | 4% | 11% | 7% |
Table 12.
Accuracy of neural network models with SMOTE rare data enhancement (%).
| MLP | CNN | |||||
|---|---|---|---|---|---|---|
| Attack Class | Original Data | Enhanced Data | Improved Rate | Original Data | Enhanced Data | Improved Rate |
| Probe | 67% | 73% | 6% | 54% | 60% | 6% |
| U2R | 7% | 13% | 6% | 1% | 8% | 7% |
| R2L | 0% | 7% | 7% | 0% | 15% | 15% |
Table 13.
Ranked list of top 15 information gain values.
| Ranking | Features No. | Features Values | I.G. Values |
|---|---|---|---|
| 1 | 5 | src_bytes | 2.01736 |
| 2 | 3 | service | 1.73376 |
| 3 | 6 | dst_bytes | 1.58831 |
| 4 | 35 | dst_host_diff_srv_rate | 1.21264 |
| 5 | 33 | dst_host_srv_count | 1.18367 |
| 6 | 34 | dst_host_same_srv_rate | 1.17743 |
| 7 | 23 | count | 1.16354 |
| 8 | 4 | flag | 1.02447 |
| 9 | 40 | dst_host_rerror_rate | 0.99752 |
| 10 | 30 | diff_srv_rate | 0.96746 |
| 11 | 29 | same_srv_rate | 0.93054 |
| 12 | 41 | dst_host_srv_rerror_rate | 0.85818 |
| 13 | 24 | srv_count | 0.78858 |
| 14 | 1 | duration | 0.67224 |
| 15 | 27 | rerror_rate | 0.62959 |
Table 14.
Best feature numbers for all classifiers.
| KNN | SVM | RF | XGBoost | MLP | CNN | |
|---|---|---|---|---|---|---|
| Best Feature Number | 15 | 41 | 15 | 18 | 21 | 23 |
| Probe Accuracy | 73% | 74% | 63% | 53% | 76% | 68% |
Table 15.
Best data-enhanced numbers for all classifiers.
| KNN | SVM | RF | XGB | MLP | CNN | |
|---|---|---|---|---|---|---|
| Best Feature Number | 15 | 41 | 15 | 18 | 21 | 23 |
| Best Data-Enhanced Number | 8000 | 8000 | 7000 | 6000 | 6000 | 8000 |
| Probe Accuracy | 76% | 75% | 64% | 55% | 78% | 72% |
Table 16.
Best numbers of model layers.
| MLP | CNN | |
|---|---|---|
| Best Feature Number | 21 | 23 |
| Best Data-Enhanced Number | 6000 | 8000 |
| Best Number of Model Layers | 4 | 6 |
| Accuracy of Probe Detection | 80% | 73% |
Table 17.
Best hyperparameters with WGAN-GP data enhancement for all classifiers.
| KNN | SVM | RF | XGB | MLP | CNN | |
|---|---|---|---|---|---|---|
| Best Feature Number | 15 | 41 | 15 | 18 | 21 | 23 |
| Best Data-Enhanced Number | 8000 | 8000 | 7000 | 6000 | 6000 | 8000 |
| Best Number of Model Layers | - | - | - | - | 4 | 6 |
| Probe Accuracy | 76% | 75% | 64% | 55% | 80% | 73% |
Disclaimer/Publisher’s Note: The statements, opinions and data contained in all publications are solely those of the individual author(s) and contributor(s) and not of MDPI and/or the editor(s). MDPI and/or the editor(s) disclaim responsibility for any injury to people or property resulting from any ideas, methods, instructions or products referred to in the content. |
© 2023 by the authors. Licensee MDPI, Basel, Switzerland. This article is an open access article distributed under the terms and conditions of the Creative Commons Attribution (CC BY) license (https://creativecommons.org/licenses/by/4.0/).
Share and Cite
MDPI and ACS Style
Lee, G.-C.; Li, J.-H.; Li, Z.-Y. A Wasserstein Generative Adversarial Network–Gradient Penalty-Based Model with Imbalanced Data Enhancement for Network Intrusion Detection. Appl. Sci. 2023, 13, 8132. https://doi.org/10.3390/app13148132
AMA Style
Lee G-C, Li J-H, Li Z-Y. A Wasserstein Generative Adversarial Network–Gradient Penalty-Based Model with Imbalanced Data Enhancement for Network Intrusion Detection. Applied Sciences. 2023; 13(14):8132. https://doi.org/10.3390/app13148132
Chicago/Turabian StyleLee, Gwo-Chuan, Jyun-Hong Li, and Zi-Yang Li. 2023. "A Wasserstein Generative Adversarial Network–Gradient Penalty-Based Model with Imbalanced Data Enhancement for Network Intrusion Detection" Applied Sciences 13, no. 14: 8132. https://doi.org/10.3390/app13148132
Note that from the first issue of 2016, this journal uses article numbers instead of page numbers. See further details here.