
Cross-Sectional Shape Optimization of Cylindrical Elastomer Spring for Sensitive Cargo Container

1
Department of Transportation System Engineering, Graduate School of Transportation, Korea National University of Transportation, Uiwang 16106, Republic of Korea
2
School of Railroad Engineering, Korea National University of Transportation, Uiwang 16106, Republic of Korea
*
Author to whom correspondence should be addressed.
Appl. Sci. 2023, 13(4), 2517; https://doi.org/10.3390/app13042517
Submission received: 1 February 2023
/
Revised: 14 February 2023
/
Accepted: 14 February 2023
/
Published: 15 February 2023
(This article belongs to the Special Issue Innovative Solutions for the Railway Sector: Design and Experimentation)
Abstract
:High-value sensitive cargoes are often damaged by low-frequency vibration and shock of containers during land and rail transport processes or mixed transport processes. Therefore, a dedicated cylindrical elastomer spring that absorbs vibration transmitted into the container has been developed. This study developed an optimal shape using a polyurethane material instead of the existing rubber spring. Elastomer spring requires an optimal design that satisfies the design target stiffness and strength by nonlinear finite element analysis. In order to develop an elastomer spring for a cargo container, the material constant was obtained by a hyperelastic behavior test of natural rubber, and based on this, the necessary optimal material constant of the new spring was predicted. In addition, nonlinear structural analysis was performed using ABAQUS to obtain the optimal shape of the spring, and optimal design was performed with I-SIGHT software. As a result of the sum of squared difference minimization with the comparison algorithm, it was found that the polyurethane material constant C10, C20, and C30 with the same characteristics as natural rubber was obtained. In addition, analysis using three optimization algorithms, Hooke–Jeeves algorithm, multi-island genetic algorithm, and optimal Latin hypercube, yielded a maximum principal strain of 0.244 of the spring obtained through the optimal cross-sectional shape design. It was found that this value was about 39% lower than the natural rubber spring in use. As a result of the compression load-displacement test of the actually developed product, it was confirmed that the correlation coefficient between the predicted value and the measured value was 0.928.
1. Introduction
Commonly used transportation methods for high-value-added sensitive cargo (e.g., electronics, LEDs, semiconductors, etc.) are vibration-free cargo trucks on roads. Although the transportation system of sensitive cargoes can be accessed conveniently from the origin to the destination, there are some issues, such as expensive freight charges, road traffic congestion, limited mass transport, and environmental problems (air pollution). These problems can be improved by incorporating the freight train (hereinafter, freight car) transport method from the perspective of modal shift.
Sensitive cargoes are damaged by low-frequency vibrations and shocks that occur during trans-shipment between road and rail transport. As an alternative to shock-absorbing packaging or installing a specific internal device to address vibration and shocks, containers for sensitive cargo are used [1]. However, damage to the rubber spring causes a large cost loss due to damage to the sensitive cargo. As shown in Figure 1, the rubber spring for containers consists of cylindrical natural rubber, an upper circular carbon steel plate, and a lower fixing support. Therefore, in order to develop a device with high reliability of rail transportation for sensitive cargo during operation, nonlinear finite element analysis (NFEA) is required considering rubber characteristics representing hyperelastic behavior [2]. It should also be an optimal structural design that satisfies the design target stiffness and strength of this spring in a road/railroad operating environment.
The existing research on rubber springs for railway vehicles has mainly focused on the truck suspension device of railway vehicles [3,4,5,6,7,8,9].
In the work of Atmazova et al. [3], based on a nonlinear quasi-static model analysis of rubber springs, techniques were used to superimpose residual stresses and consider material fatigue to predict damage to rubber springs. Luo et al. [4] proposed an effective stress tensor as a parameter for fatigue damage considering all compression, tensile, and shear stress range to study the effective fatigue evaluation of rubber mounts for railway vehicles. Lie et al. [5] determined the strength of the primary suspension rubber spring through finite element analysis of the rubber spring. In addition, a study was conducted to design a rubber spring of the required strength and verify its validity by verifying the stiffness value through tests. Mankovits et al. [6] performed structural optimization based on finite element method (FEM) and support vector regression (SVR) models for air springs for railway vehicles. Teng et al. [7] analyzed the frequency dependence and amplitude dependence characteristics of rubber springs for railway vehicles under low and high-temperature conditions. Zhao et al. [8] analyzed the effect of geometrical parameters on the fatigue life of conical rubber springs using an orthogonal numerical test method. Dal et al. [9] presented an optimization model through NFEA and optimization for conical rubber springs in railway vehicles, and the strain is reduced by about 7% compared to the initial model. Xu et al. [10] studied a non-hyperelastic elliptic analysis model of EMU rubber springs based on the experimental data of rubber springs to describe the non-hyperelastic properties of rubber springs. Salim et al. [11] analyzed the axial vibration according to the effects of mass and stiffness on the laminated rubber-metal spring. Pintado et al. [12] conducted a study on components necessary for models expressing the mechanical behavior of rubber springs for high-speed rail vehicles. Wang et al. [13] performed finite element simulations on the static characteristics of rubber mounts for vehicles. Zhao et al. [14] conducted finite element analysis and structure optimization to improve the fatigue life of rubber mounts. Berg [15] performed a rail vehicle dynamics analysis of a nonlinear rubber spring model to represent the mechanical behavior of rubber suspension components in rail vehicle dynamics. As such, there are many studies on rubber springs for suspension devices for railway vehicles, but studies on rubber springs for anti-vibration for containers are insufficient. In particular, it is difficult to evaluate the hyperelastic behavior of natural rubber, and due to the convergence of nonlinear analysis, it is necessary to investigate natural rubber springs exclusively for containers.
In this study, to develop an elastomer spring with sufficient characteristics even at high loads instead of natural rubber springs that are difficult to meet the target stiffness and strength characteristics:
First, the NFEA of the existing rubber spring was used to obtain the structurally weak point.
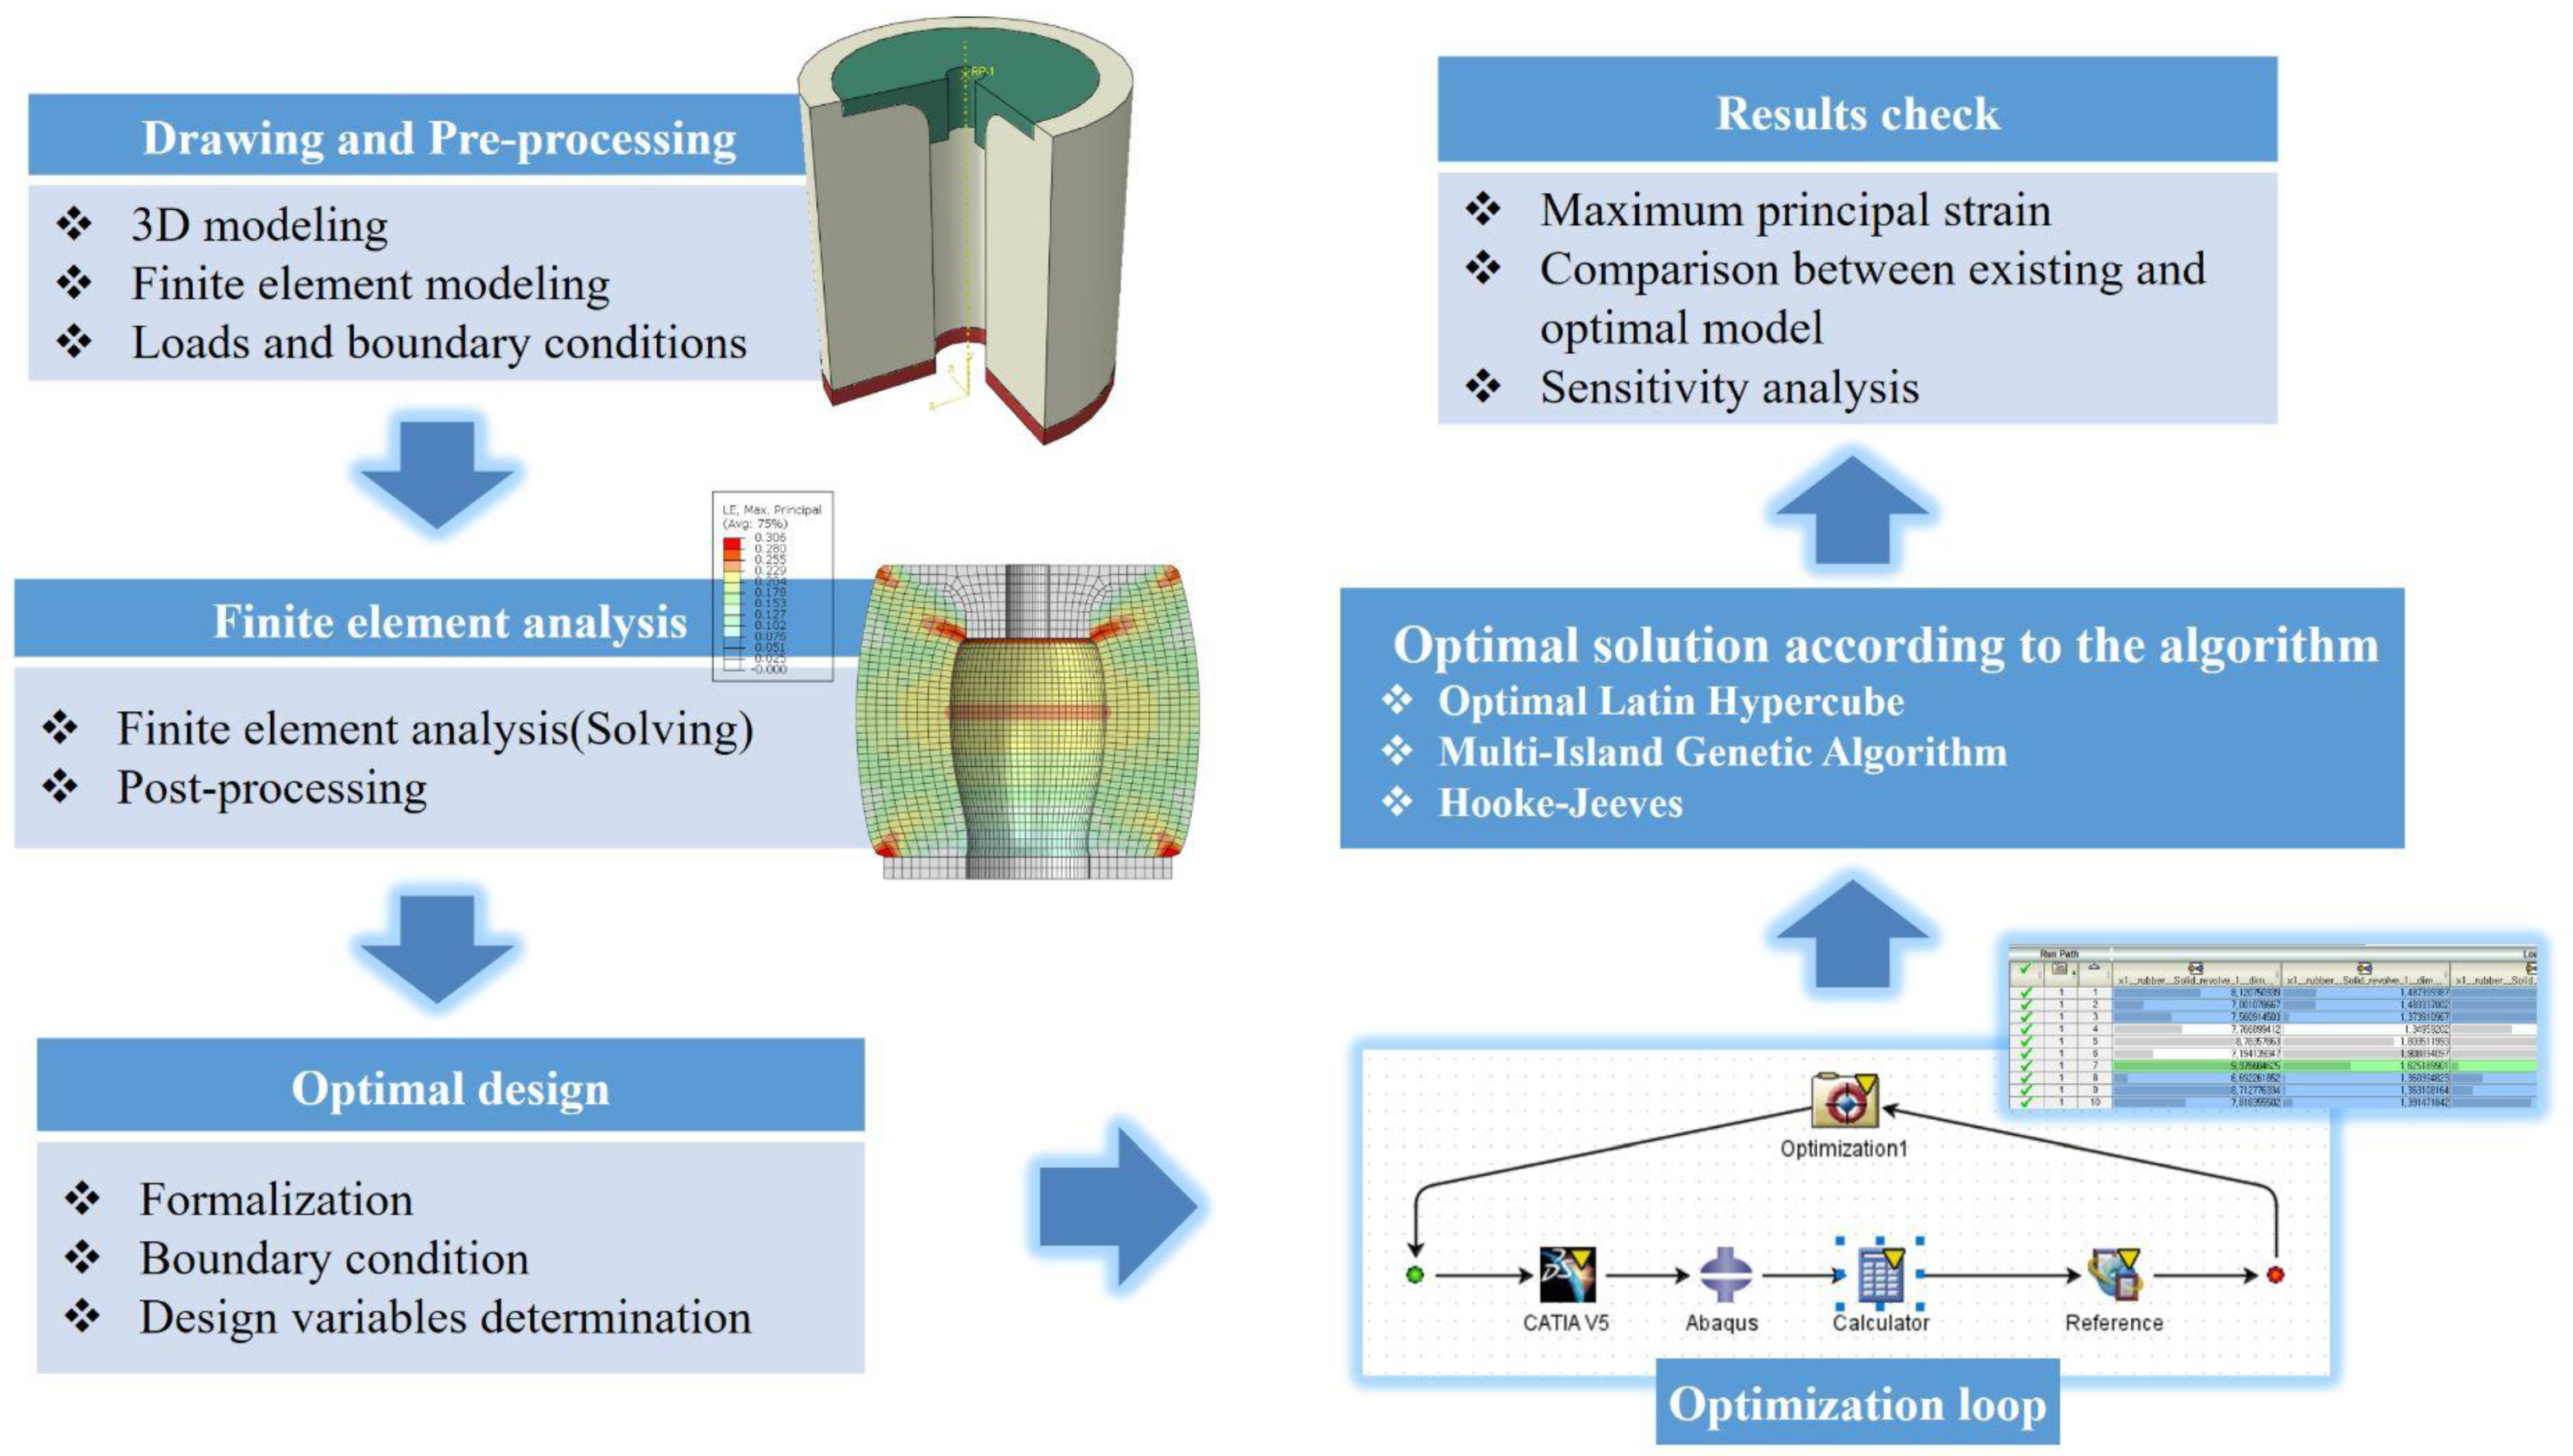
Second, a study on the optimal shape design of a polyurethane spring having the same hardness as rubber was conducted. To this end, the three-dimensional shape was modeled with CATIA, and then NFEA was performed using ABAQUS [16,17]. In addition, material constant prediction and spring cross-sectional shape optimization were performed using I-SIGHT [18].
An initial prototype was manufactured for verification, and based on the structural analysis results of this model, the optimal upgrade product was designed, the improvement effect was evaluated, and the analysis results were verified under displacement control conditions.
As a result of the verification, the correlation coefficient between the predicted value and the measured value was 0.928 as a result of the compression load-displacement test of the developed product.
2. NFEA and Shape Optimization
2.1. Mechanical Property Evaluation of Natural Rubber
The model equation representing the hyperelastic behavior of the elastic body used in the spring assumes isotropy in large deformation [19,20,21,22,23,24]. In order to increase the accuracy of NFEA, the material constant of the model equation with the highest correlation coefficient should be used.
The stress–strain hysteresis of natural rubber for spring was obtained through an isometric displacement control test, as shown in Figure 2 [19]. Figure 3 shows the hyperelastic behavior model of the strain-stress curve in Figure 2. These material constants are used as input data for the material properties of NFEA.
Since Yeoh’s model represents the highest correlation coefficient (0.991) among the hyperelastic model equations, it is commonly used to obtain the elastomer material constant [23]. The hyperelastic behavior of this elastomer is expressed as a strain energy density function (U), as shown in Equation (1), using Yeoh’s model equation.
where U is the strain energy function; Ī1 is the first strain invariant; Ci0 is the material constant, which are C10 = 0.318, C20 = −0.026, and C30 = 0.005, respectively.
This study developed a polyurethane spring for sensitive products instead of the existing natural rubber spring. The advantages of this polyurethane material over natural rubber are its high load compression properties, excellent abrasion properties, anti-cutting, and tear performance, durability against contaminants, and extended life, especially outdoors or in extreme environments [25,26]. The hyperelastic behavior of this material is generally evaluated through uniaxial tensile, shear, and biaxial tests. This research intends to predict the material constants of the polyurethane spring having the same hardness value as natural rubber by using Equation (1) instead of additional experiments.
2.2. Concept Designs of NFEA
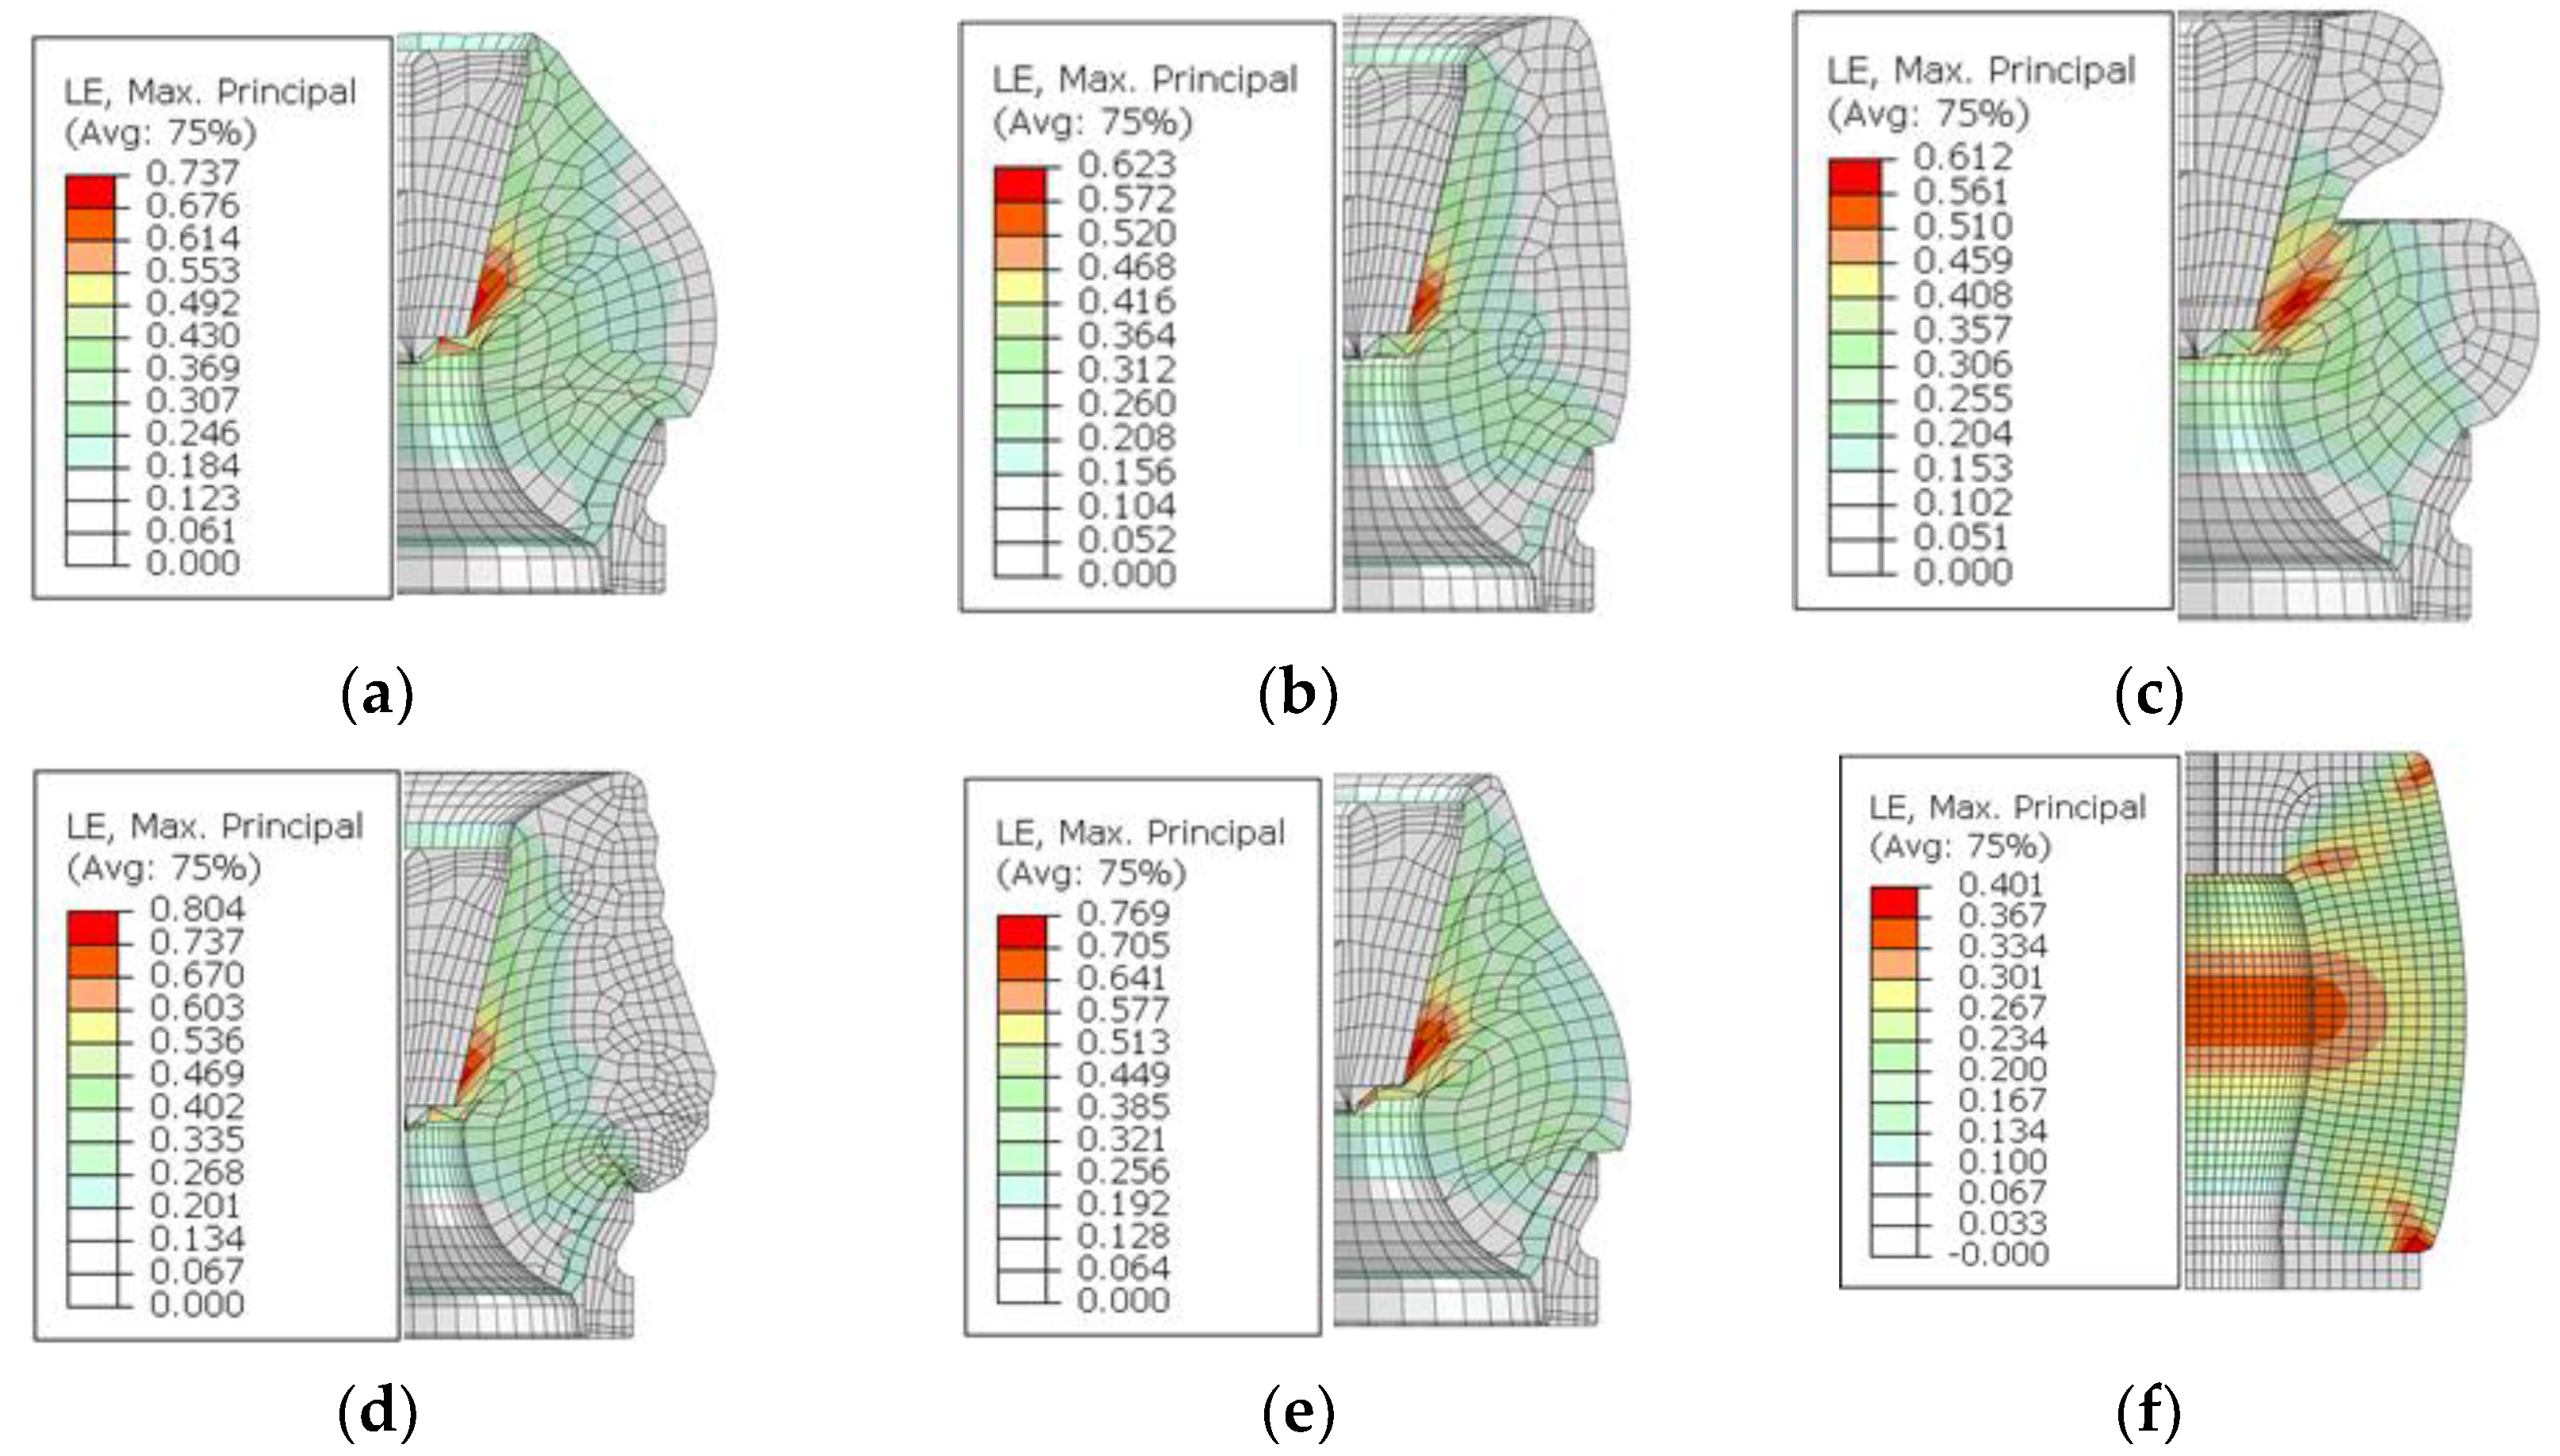
As a preliminary design step for optimization from the existing natural rubber spring, NFEA carried out a conceptual design for six types of cross-section shapes. Figure 4 shows the maximum principal strain (MPS) distribution for six types of natural rubber cross-sectional shapes under the condition of an applied load of 3.4 kN based on the required design specification [2]. Figure 4f shape 6 shows the smallest MPS among them. This model is the model finally selected among the proposed cylindrical cross-sectional shapes in a limited height and diameter range and is called the original model from hereafter. Using this model, material constant prediction and optimal shape cross-section design were performed to reinforce the weak point of the spring and to reduce MPS. The advantage of reducing MPS is that it could increase the fatigue life for the spring [27,28].
2.3. Determination of Material Coefficients for Polyurethane
Figure 5 shows a flowchart of the process for predicting the material constants for hyperelastic behavior. First, the known material constants of the hyperelastic behavior of natural rubber were set as initial values, and the material constants were set as C10 = 0.318, C20 = −0.026, and C30 = 0.005 for the Yeoh model equation (shown in Equation (1)). To predict the nonlinear hyperelastic behavior of polyurethane materials without additional testing, the stiffness of this polyurethane spring should be obtained in the same shape as the existing cylindrical natural rubber spring.
The characteristics of this polyurethane spring were obtained from the load-displacement diagram under compression displacement control. The nonlinear material constants of polyurethane were predicted using a data-matching optimization program based on Equation (1) and NFTA. The NFEA and data-matching optimization used ABAQUS 2022 and I-SIGHT, respectively. Table 1 shows the formalization of the data-matching optimization for predicting the material constants. The objective function is to minimize the difference between the load and displacement values obtained from the nonlinear analysis results of the natural rubber spring and the compression load-displacement test result of the polyurethane spring. The iteration for the material constant prediction was as follows:
The I-SIGHT input command was saved in the I-SIGHT database as a model parameter file in the model with zrf extension file format. During each optimization iteration, the finite element model and parameter file were computed. Based on each algorithm, the result of the optimization iteration was stored in the optimization neutral form to be changed and the finite element model.
From each optimization algorithm, the sum of squared difference (SSD) is iteratively performed to reduce the required condition of Table 1 [29].
where is the target stiffness of the polyurethane spring, is the calibrated stiffness of the polyurethane spring, and is the stiffness of the natural rubber spring.
Subsequently, the optimal material constant was used to compare each algorithm, and the material constant with the smallest SSD value was selected. The design data are immediately reflected by the analysis results during each stage of the optimization iteration. Figure 6 shows the compressive load-displacement diagram for the test and analysis of natural rubber and the test of polyurethane concerning the target presented in Table 1.
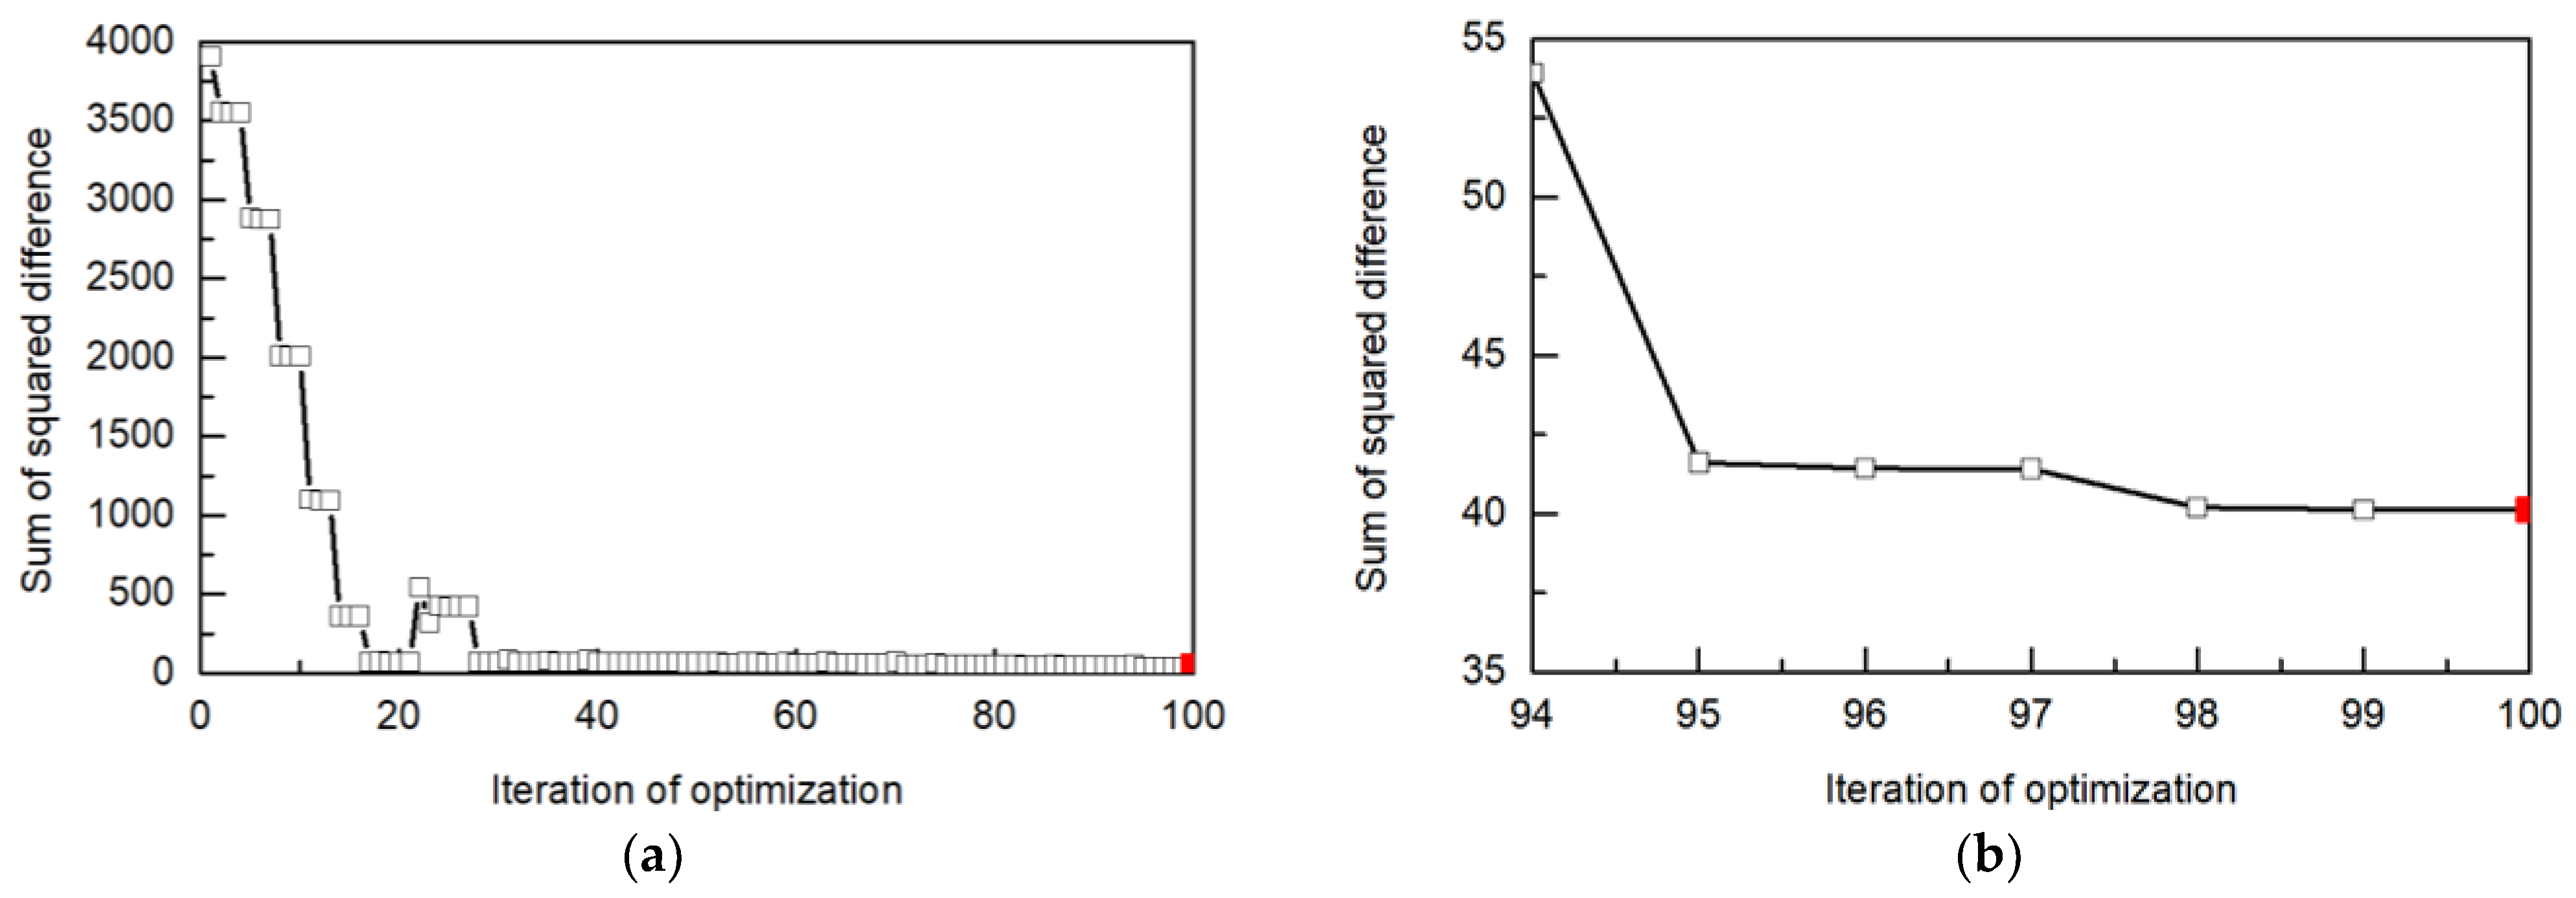
Figure 7 shows the SSD history during the iterative process of the material constant prediction. This material constant prediction was obtained 100 times of iteration, which could satisfy the target in Table 1. Figure 7 shows the SSD between the predicted value of the polyurethane material constant and the test value using the number of optimization iterations based on the Hooke–Jeeves algorithm (HJA) from Figure 6. Table 2 shows the optimal prediction value at the 100th, the smallest SSD of a total of 100 iterations from Figure 7. For reference, Table 3 shows a comparison of SSD values using the three types of optimal algorithms. As shown in this table, the SSD value obtained using the HJA was the lowest, as compared with those obtained using the multi-island genetic algorithm (MIGA) and optimal Latin hypercube (OLH) [12,29]. The material constants in Table 2 are input data for the NFEA to achieve the optimal design of the shape section for the polyurethane spring.
2.4. Nonlinear Finite Element Analysis
Figure 8 shows the boundary and load conditions applied for the NFEA of the polyurethane spring. The load applied was 3.4 kN. Based on the design specifications, the boundary condition for the lower base section was a fixed condition [2]. As shown in Figure 9, the mesh size was 2.5 mm considering the MPS and computational time (CPU time). At a mesh size of 2.5 mm, the MPS did not reduce significantly as the analysis time decreased rapidly.
Figure 10 shows the results of the NFEA of the existing natural rubber spring under the boundary and applied load conditions. Figure 10a shows the distribution of the MPS in the cross-sectional shape of this spring, and Figure 10b shows the MPS history based on the analysis of step increment during compressive loading and unloading. In this analysis model, the element shape was an eight-node hexahedron (C3D8R), and the number of elements and nodes were 29,697 and 34,993, respectively. The strength of this spring was evaluated based on the MPS while considering the incompressibility and hyperelastic behavior of rubber materials in the large deformation range [19,20,21,22,23,24]. The weak point was near the contact point between the inner center and lower end of the spring, and the MPS for the spring under the maximum applied load was 0.306, as shown in Figure 10a. As shown in Figure 10b, the MPS of the polyurethane spring was approximately 23% lower than that of the natural rubber spring of the same hardness (Hs 45A). Therefore, the use of polyurethane material instead of natural rubber reduces the MPS, thereby increasing the soundness of the polyurethane spring.
2.5. Cross-Section Shape Optimization
The design requirements of this cylindrical polyurethane spring are to satisfy the target stiffness listed in Table 4 and reduce the MPS [2].
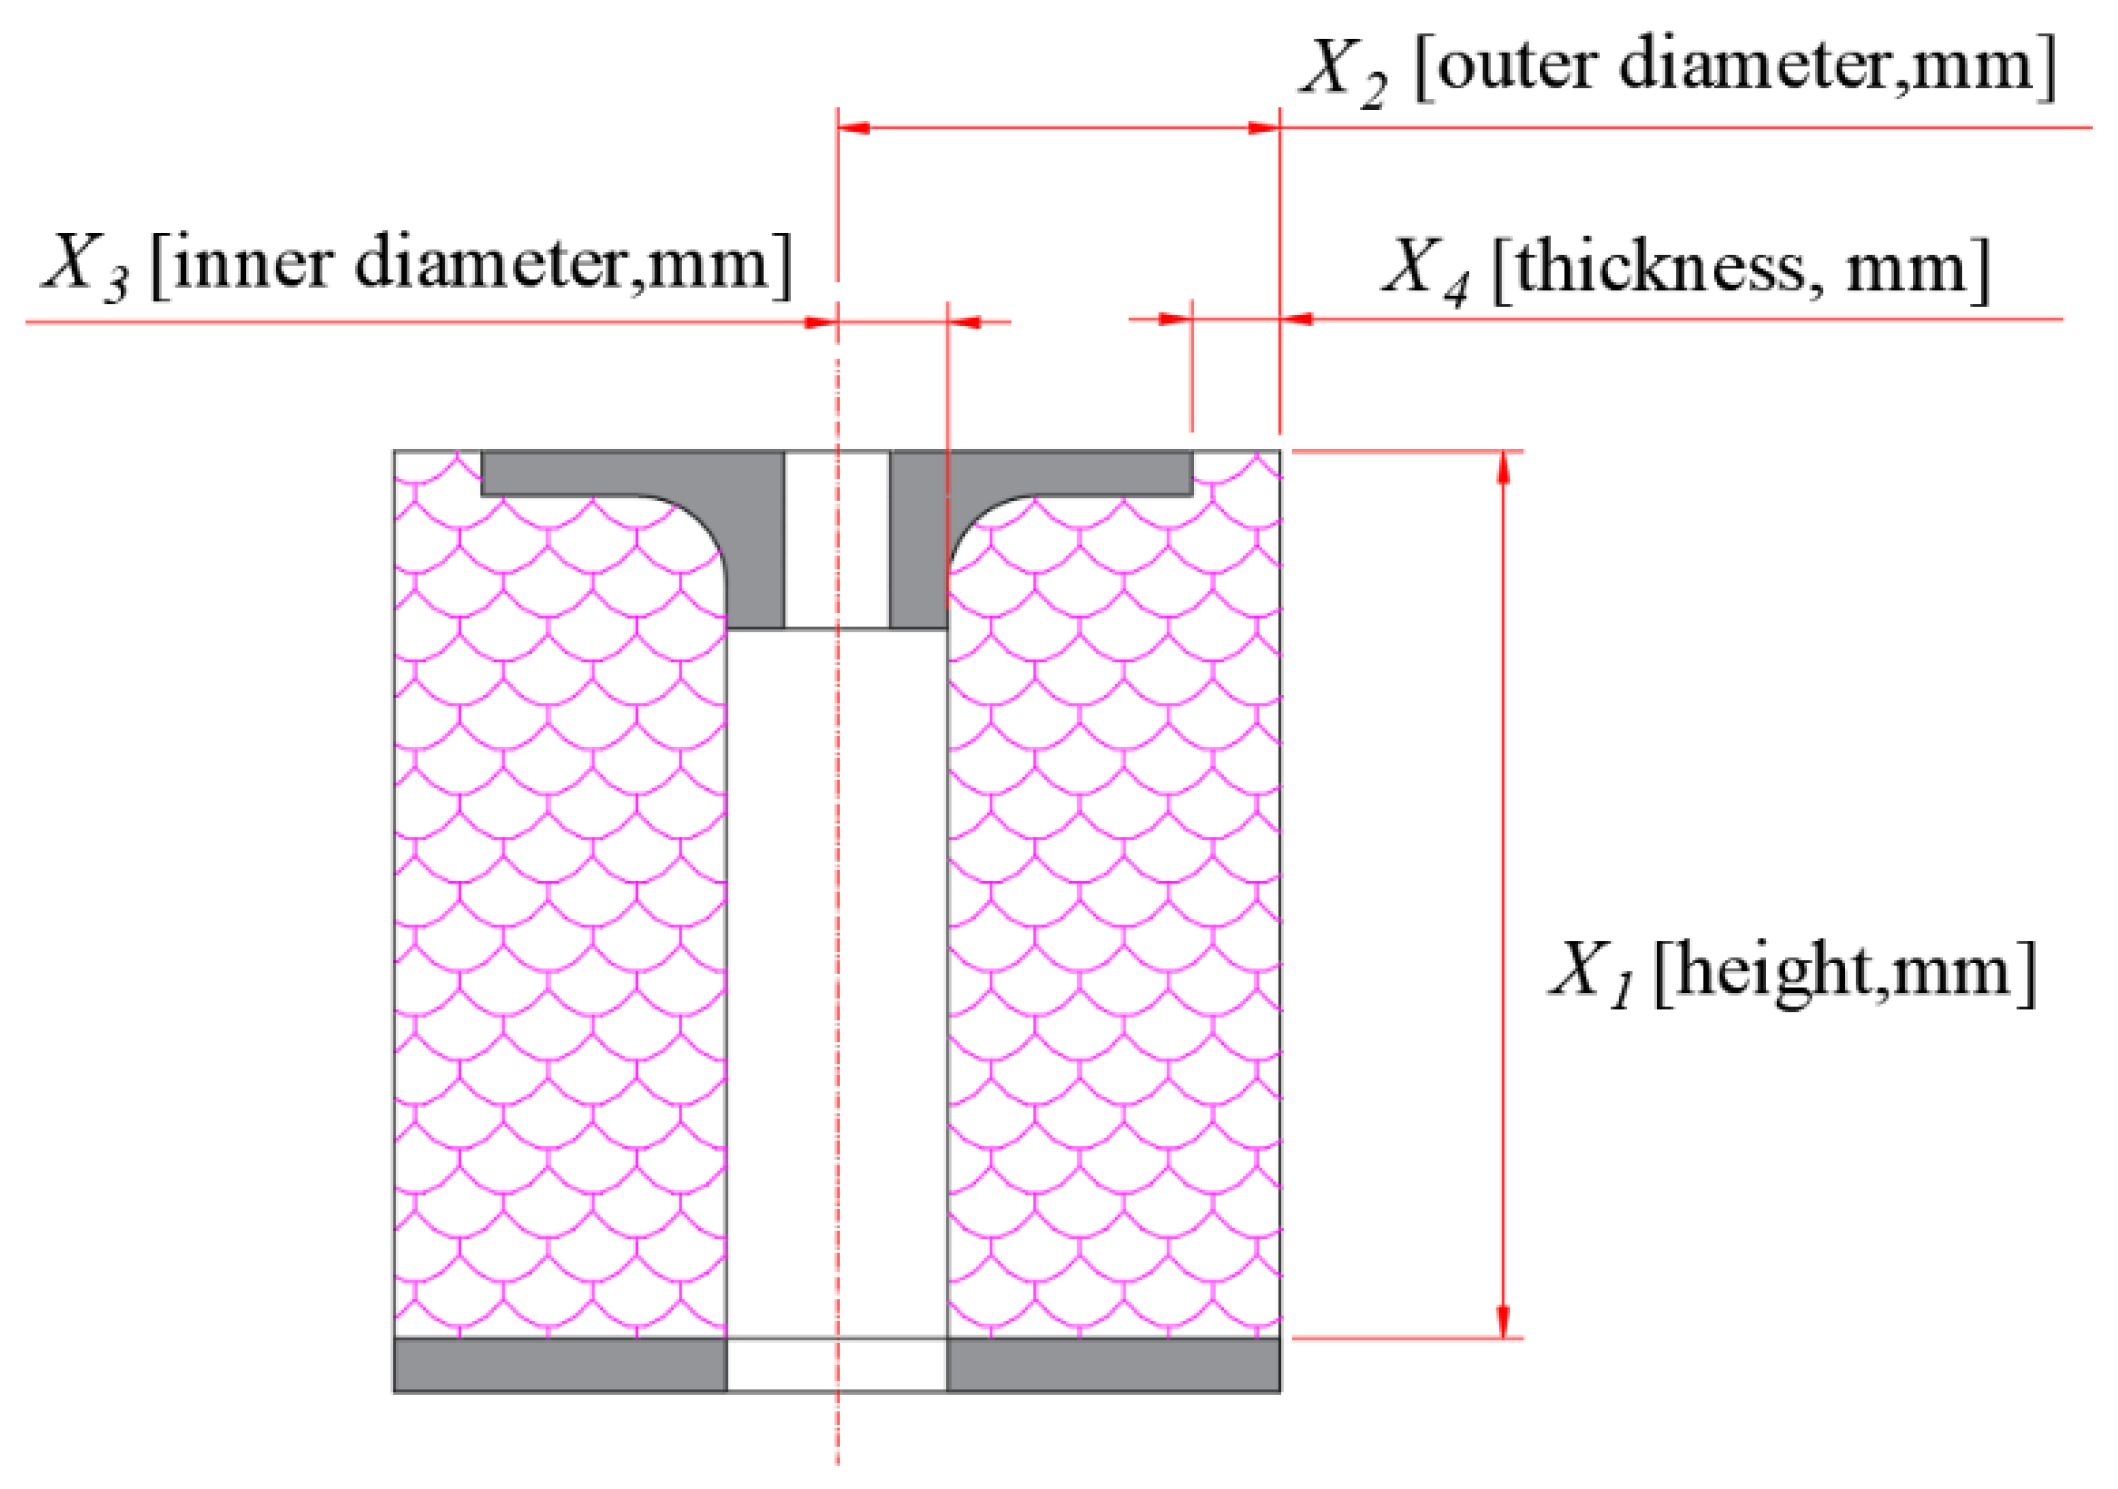
From a conservation design perspective, the design target stiffness (k) was then derived to prevent vibration and impact set at 0.25 to 2.5 Hz, i.e., natural frequency (f) based on a load cargo load (m) of 0.2 to 20 tons. Here, the resonance frequency was derived by assuming six springs were installed on one pallet. Therefore, an optimal design is performed. Table 5 summarizes the formulation of the optimal design of the cross-section shape of this polyurethane spring based on the design parameters listed in Figure 11.
The maximum vibration frequency of the container was set to 5 and 40 Hz during truck and freight car operation, respectively, based on the results of previous studies [30].
Figure 12 shows the flow of the optimal design process for the cross-section shape of the spring. First, a three-dimensional model drawing was prepared using the CAD program CATIA V5. Subsequently, preprocessing and nonlinear analysis were performed using the NFEA program ABAQUS (version 2022). Based on the results shown in Figure 10, the initial conditions of the optimization stage set as the design area and variables defined in Figure 11 and Table 5, and the ABAQUS odb file was designated as the objective function result file. The optimal design algorithms were three general-purpose optimization algorithms (i.e., OLH, HJA, and MIGA) provided by I-SIGHT. The iteration for the optimal design was as follows:
I-SIGHT input commands were stored in the I-SIGHT database as a model parameter file in the model zrf format. During the optimization iteration, the finite element model and parameter file were computed simultaneously. Based on each algorithm, the result of the optimization iteration was stored in the optimized neutral form, and the finite element model was changed. Based on each optimal algorithm, the MPS was reduced iteratively while satisfying the constraints listed in Table 5.
The optimal cross-section shapes were compared for each algorithm, and the cross-sectional shape with the smallest MPS value was selected. These design data were immediately reflected in the analysis results during each stage of the optimization iteration.
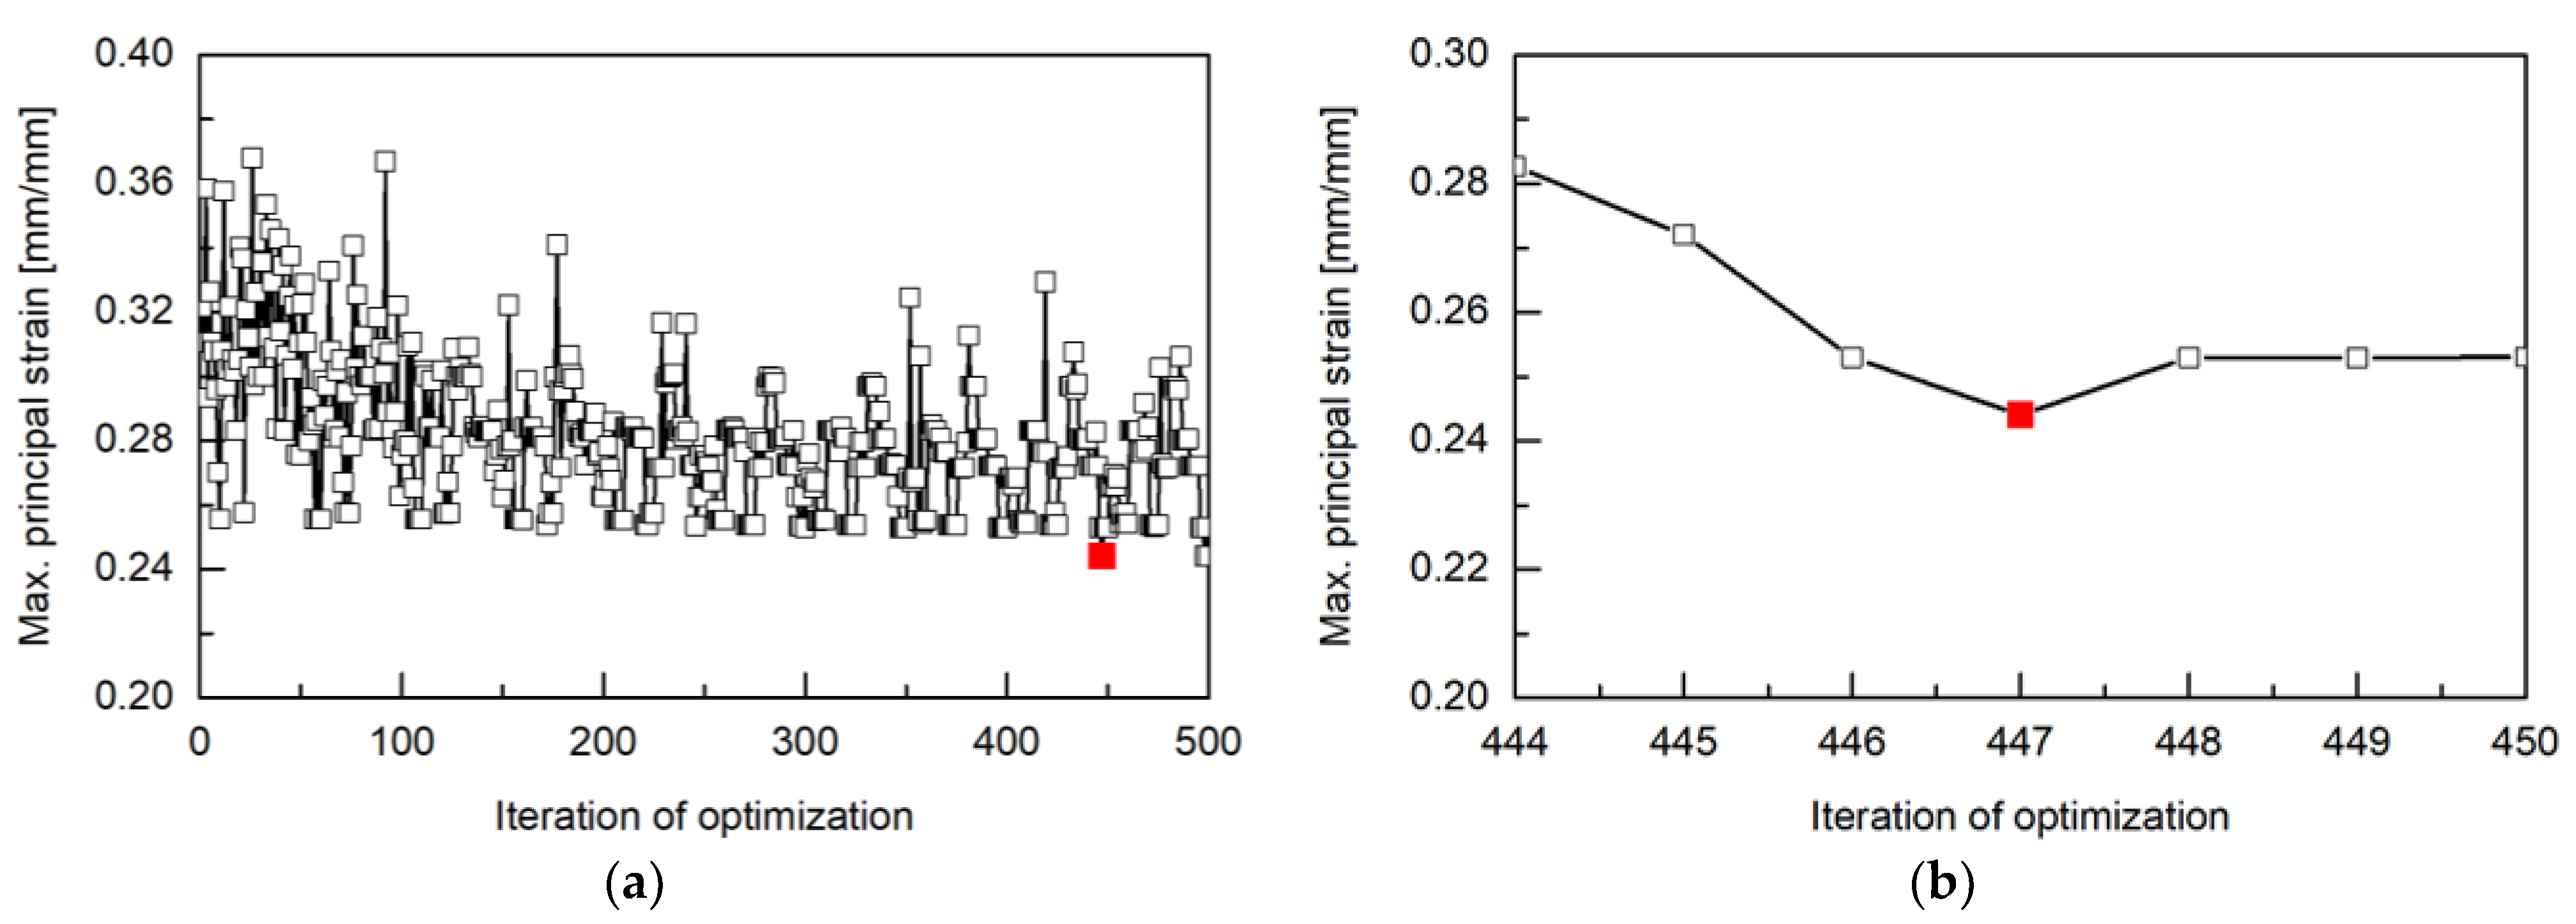
Figure 13 shows the history of the MPS in the iterative process of shape optimization. The optimized shape was obtained at 447th, the smallest MPS of a total of 500 iterations from Figure 13. Required design targets listed in Table 4 and Table 5, i.e., “20 mm displacement under a compressive load of 3.4 kN” and “minimum value of MPS,” were satisfied. Figure 13 shows the optimal design result of the polyurethane spring using the MIGA presented in Figure 12.
Figure 14a shows the distribution of the MPS for the optimal design of this spring, and Figure 14b shows the history of the MPS at the weakest point in the original drawing and the optimal design section. The MPS at the weakest point of the optimal design shape was 0.244, which was approximately 20% lower than the original shape (0.306), as shown in Table 6. In terms of the target stiffness, i.e., “20 mm displacement under a compressive load of 3.4 kN,” the compression displacement of the optimal shape was 20.01 mm, which was satisfied within the allowable error range, unlike the existing shape (compressive displacement of 25.8 mm), as shown in Table 5. For reference, Table 7 shows a comparison of the MPS values in the weak point based on the optimal algorithm. In this table, the optimal design result obtained using the MIGA yielded the lowest MPS, as compared with those of the OLH and HJA.
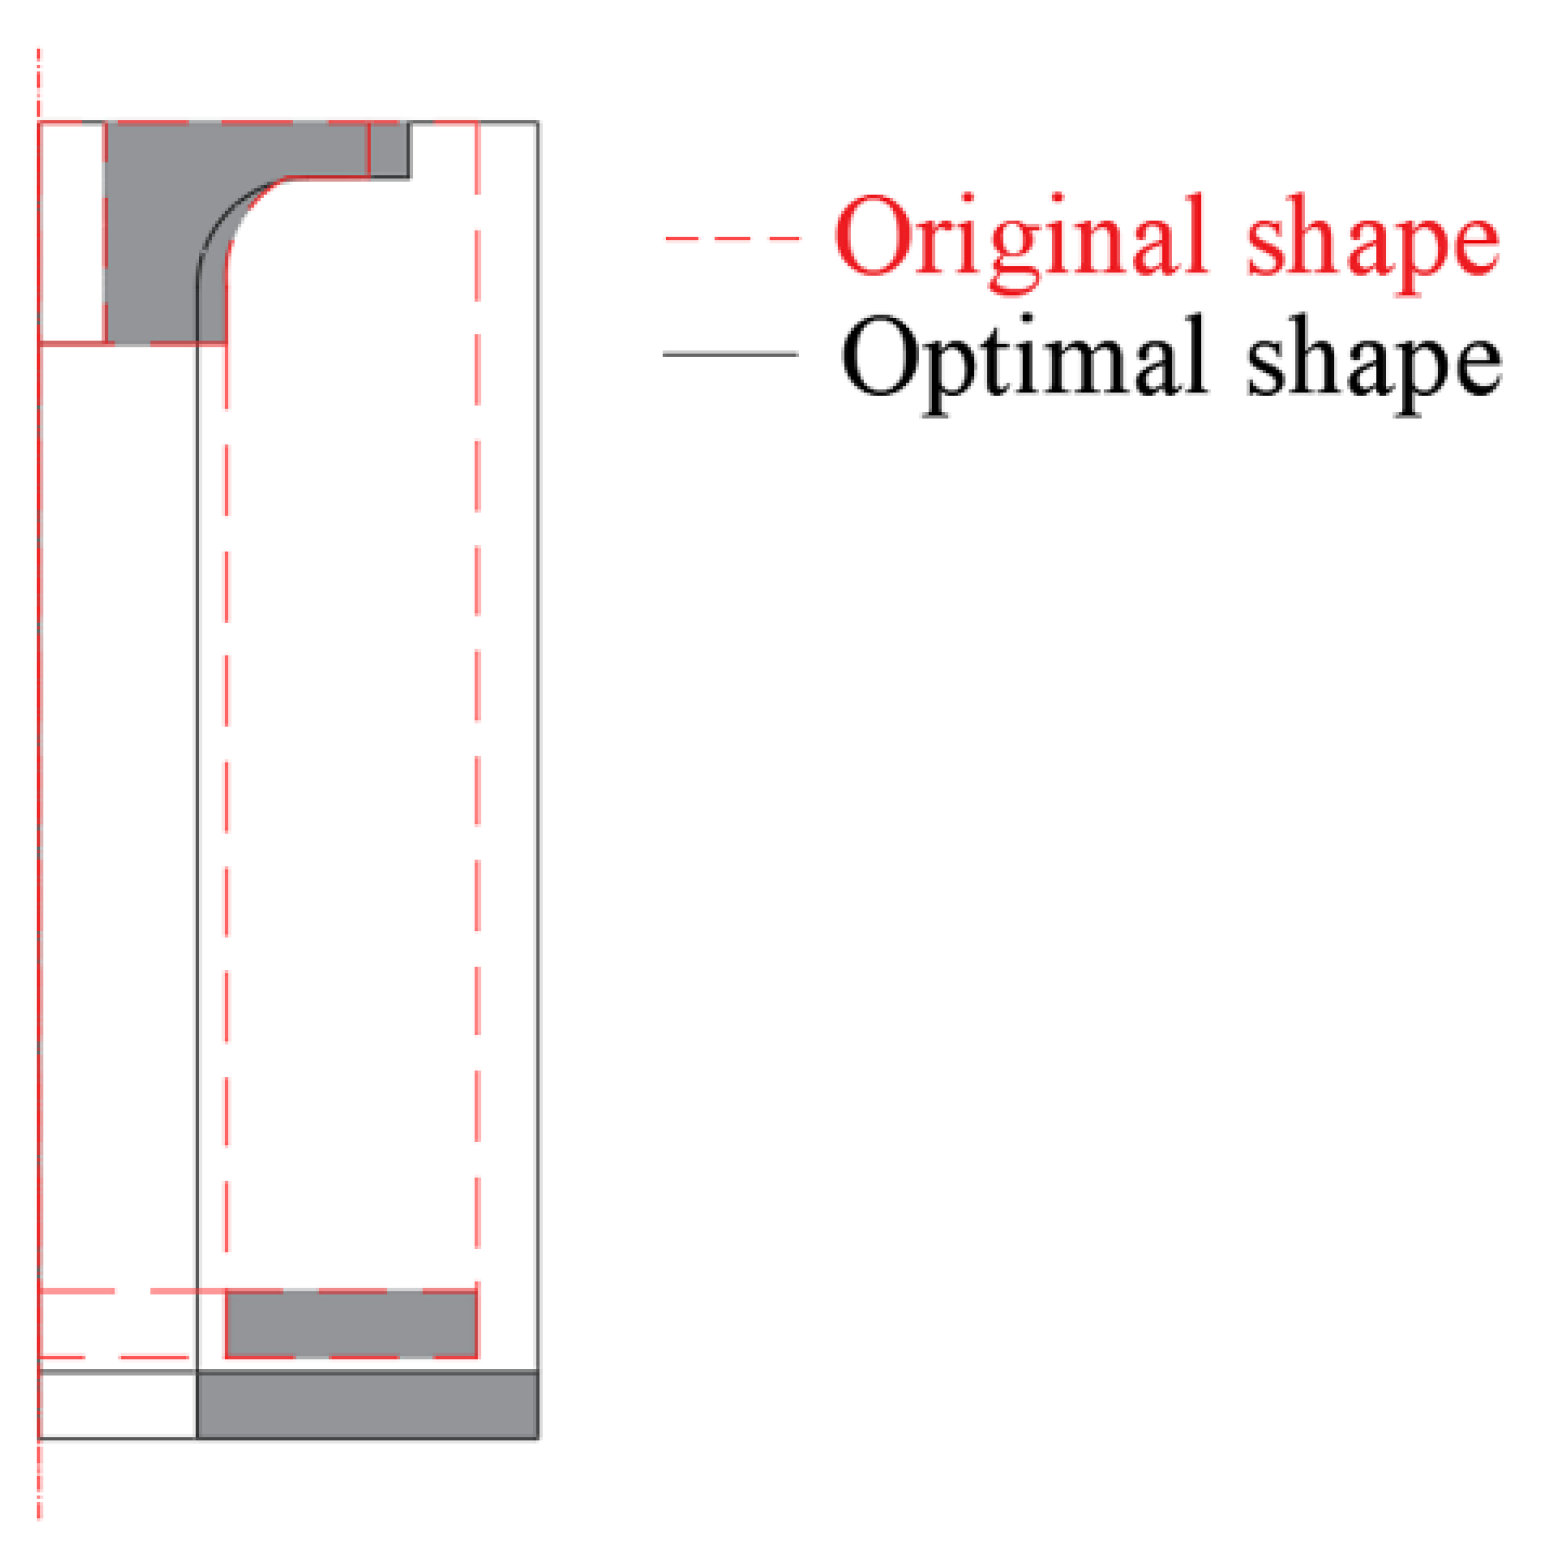
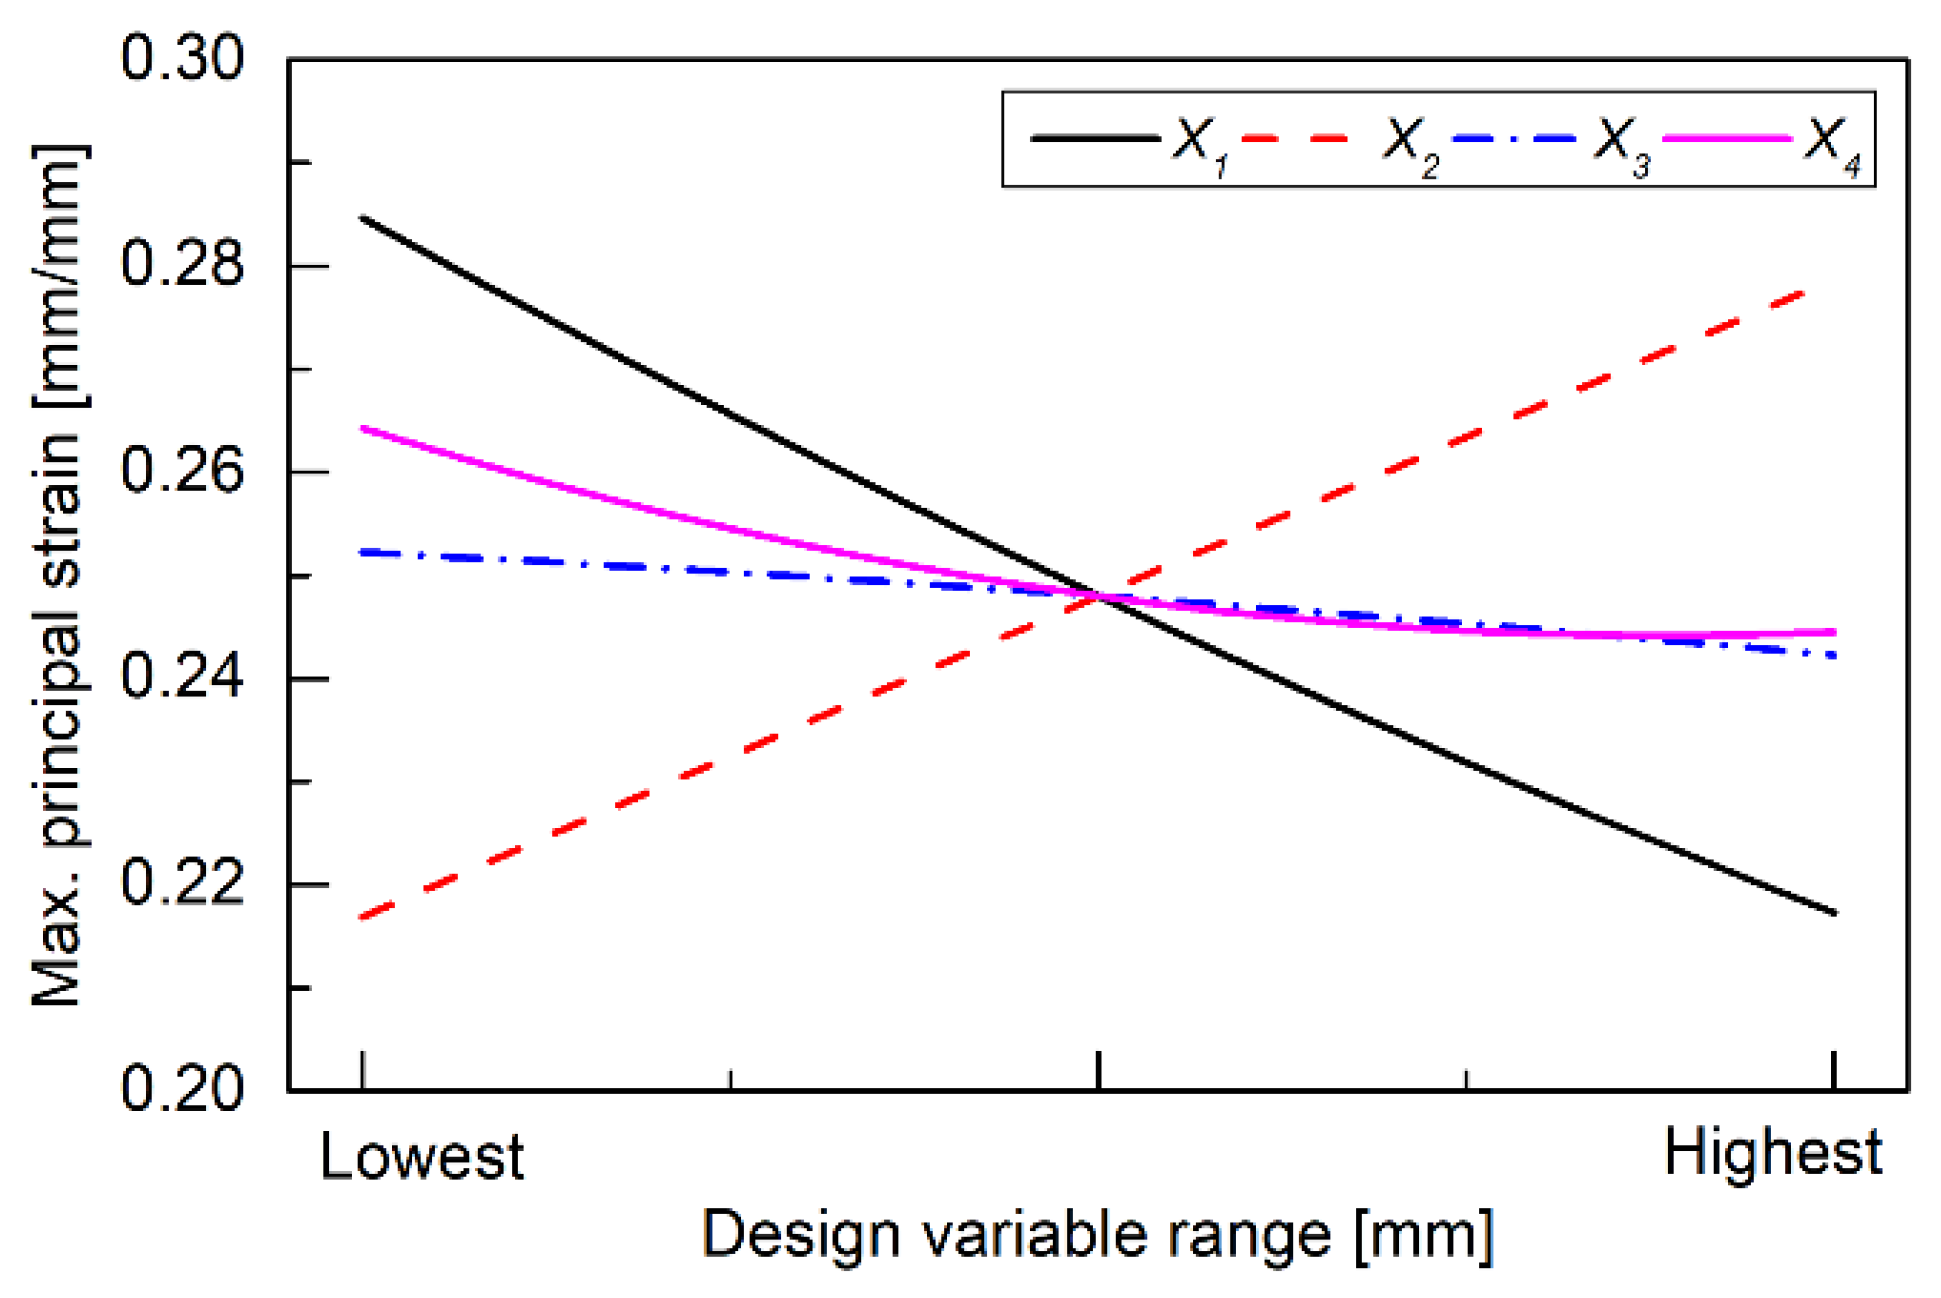
Figure 15 shows a comparison of geometric shapes of the existing drawing and the optimal design section based on the MIGA. The sensitivity analysis results for the design variables of each shape section are in Figure 16. As shown in the figure, the slope of the MPS based on the increase in the length of the design variable was the greatest within the design area; therefore, it was the most sensitive.
3. Discussion
This study is an experimental and analytical study on the development of an optimal shape of a polyurethane spring instead of natural rubber for anti-vibration spring materials inside a sensitive cargo container.
A compression displacement control test was performed on the polyurethane spring to verify the effectiveness of the optimized cross-section. Figure 17 shows the results of the compressive load-displacement test and analysis for the original and optimal shapes. Figure 17a shows a compressive load-displacement test using a tester rig. As shown in Figure 17b, the correlation coefficient between the analysis of the original shape and the test result was 0.911, and the correlation coefficient of the optimal shape was 0.928.
The correlation coefficient of the optimal shape was higher than that of the original shape, so the shape optimization effect could be confirmed.
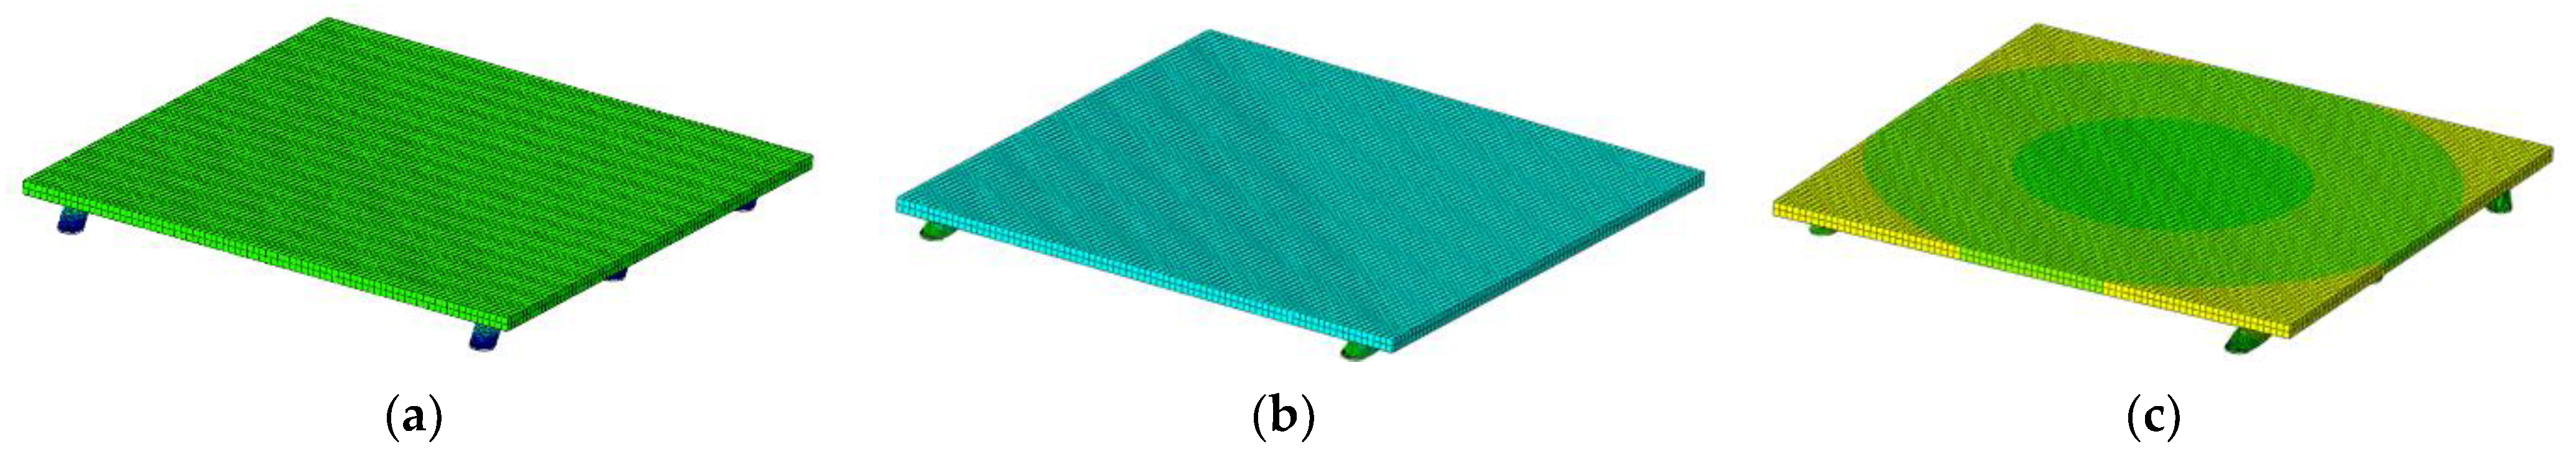
Figure 18 shows the mode shape of the modal analysis result of the elastomer spring. Figure 18a is a longitudinal mode shape, Figure 18b is a transverse mode shape, and Figure 18c is a torsional mode shape.
Table 8 shows a comparison of the values of stiffness, natural frequency, and MPS based on shape and material. It was found that the stiffness increased by about 62.7% due to the change in the polyurethane material of the spring and the optimization of the height and diameter of the cross-sectional shape. Therefore, it was possible to meet the requirements for high loads in the range of 0.2 to 20 tons. The natural frequency of the first mode increased from 1.09 to 1.51 Hz, and the fifth mode increased from 3.26 to 4.37, but the condition of 5 Hz or less listed in Table 4 was satisfied. The MPS is reduced by approximately 39% from 0.401 to 0.244; thus, the fatigue life of the optimal polyurethane model is expected to increase compared to the original rubber model.
In order to improve the stiffness and strength of the spring, nonlinear transition analysis, optimal design, and spring tests and a comparison was performed in this study.
Since the test and analysis were performed during the spring development stage, the effect of reducing vibration when loading cargo after applying the spring inside the actual container was not confirmed.
The vibration optimization of the elastomer spring should take into account the weight or material of the load. Therefore, it will also be necessary to classify several cargoes and optimize vibration by category.
In future studies, it is necessary to conduct a study to improve the vibration reduction effect through additional vibration optimization and train operation tests after cargo loading.
4. Conclusions
In this study, a nonlinear structural analysis and an optimal design of the polyurethane spring were performed to improve the safety of the cylindrical rubber spring inside the container of a transporting sensitive cargo that is under development. The conclusions obtained from this study were as follows:
- As a result of the equi-biaxial displacement control test of the natural rubber specimen, it was found that the hyperelastic behavior equation with the highest correlation coefficient for the stress–strain curve was the Yeoh model. Therefore, the material constants of polyurethane were predicted using this equation and used for NFEA;
- The conceptual design was carried out to satisfy the basic design requirements of the spring, and a nonlinear structural analysis of six-shaped rubber springs was performed. As a result, a weak point could be identified in the center inside the spring. Through NFEA, the shape with the lowest MPS (shape 6) was selected as the original model, and the optimal design of the polyurethane spring was carried out;
- Using the original model obtained from the conceptual design, the optimal design was performed using three optimization algorithms: the OLH, HJA, and MIGA. As a result of performing optimization on the polyurethane spring, an optimal cross-section that satisfies the design requirements through changes in height, external diameter, and internal diameter can be obtained. The stiffness was 166 N/mm, an increase of 61% over natural rubber, satisfying the high-weight condition. The required frequency for resonance prevention also met 5 Hz or less. In addition, the MPS was 0.244, which is about 39% lower than the original natural rubber type, and the fatigue life was expected to be longer;
- A compression displacement control test was performed on the optimal shape prototype to obtain a correlation coefficient between the analysis and the measured value. The correlation coefficient was 0.928, and it was confirmed that the verification result of the optimal shape spring made of polyurethane was valid.
Since this research was conducted limited to detailed spring design, further research on temperature, durability, etc., shall be conducted through a train operation test for future research.
Author Contributions
Conceptualization, K.-S.K. and C.-S.K.; validation, K.-S.K. and C.-S.K.; writing—original draft preparation, K.-S.K. and C.-S.K.; writing—review and editing, C.-S.K.; visualization, K.-S.K. and C.-S.K.; project administration, C.-S.K. All authors have read and agreed to the published version of the manuscript.
Funding
This research was supported by the Korea Agency for Infrastructure Technology Advancement (KAIA) grant funded by the Ministry of Land, Infrastructure, and Transport (Grant RS-2020-KA162811).
Data Availability Statement
Not applicable.
Acknowledgments
This work was supported by Korea Agency for Infrastructure Technology Advancement (KAIA). The authors would like to express their gratitude.
Conflicts of Interest
The authors declare no conflict of interest.
References
- Woo, S.W.; Dennis, L.O.; Michael, P. Reliability design of residential sized refrigerators subjected to repetitive random vibration loads during rail transport. Eng. Fail. Anal. 2011, 18, 1322–1332. [Google Scholar] [CrossRef]
- Jang, S.H.; Jang, G.S.; Lee, H.M.; Kim, C.S. Development of Low-Vibration, Shock-Proof Logistics Technology to Improve Railway Freight Transportation Service; Korea Agency for Infrastructure Technology Advancement: Anyang-si, Republic of Korea, 2020. [Google Scholar]
- Atmadzhova, D.; Nenov, N. Study of the rubber metal spring fatigue of primary spring suspension of electric locomotives. Mech. Eng. 2012, 10, 63–70. [Google Scholar]
- Luo, R.K. Effective fatigue evaluation on rubber mounts for rail vehicles. Shock Vib. 2021, 2021, 12. [Google Scholar] [CrossRef]
- Li, S.L.; Zhang, J.B. Finite element analysis on the key parts of rubber suspension. Adv. Mater. Res. 2015, 1090, 217–221. [Google Scholar]
- Mankovits, T.; Szabo, T.; Kocsis, I.; Paczelt, I. Optimization of the shape of axi-symmetric rubber bumpers. J. Mech. Eng. 2014, 60, 61–71. [Google Scholar] [CrossRef] [Green Version]
- Teng, W.X.; Tan, F.; Shi, H.L. Experimental study of high/low temperature effects on the dynamic performance of rubber spring for railway vehicles. J. Phys. Conf. Ser. 2019, 1213, 052042. [Google Scholar] [CrossRef]
- Zhao, R.G.; Yang, X.Q.; Huang, Y.J.; Liu, W.H.; Zhou, X.; Liu, Y.L.; Ye, D.H. Optimization design and fatigue life analysis of damping conical rubber spring for rail vehicle. Advances in Materials Science and Engineering; CRC Press: Boca Raton, FL, USA, 2021; pp. 47–56. [Google Scholar]
- Mun, H.U.; Lee, H.Y.; Chung, J.D.; Hong, H.R.; Jeong, N.T.; Lee, G.S.; Suh, M.W. Study on optimum design of conical rubber spring by design of experiment. J. Korean Soc. Railw. 2019, 22, 118–128. [Google Scholar] [CrossRef]
- Xu, C.; Chi, M.; Liang, S.; Dai, L.; Jiang, Y. Research on non-hyperelastic mechanical model of EMU rubber spring based on experimental data. J. Strain Anal. Eng. Des. 2021, 57, 255–265. [Google Scholar] [CrossRef]
- Salim, M.A.; Putra, A.; Abdullah, M.A. Analysis of axial vibration in the laminated rubber-metal spring. Adv. Mater. Res. 2014, 845, 46–50. [Google Scholar] [CrossRef]
- Pintado, P.; Ramiro, C.; Berg, M.; Morales, A.L.; Nieto, A.J.; Chicharro, J.M.; de Prziego, J.C.; Garcia, E. On the mechanical behavior of rubber springs for high speed rail vehicles. J. Vib. Control 2017, 24, 1–13. [Google Scholar] [CrossRef]
- Wang, L.R.; Lu, Z.H.; Hagiwara, I. Finite element simulation of the static characteristics of a vehicle rubber mount. Proc. Inst. Mech. Eng. Part D: J. Automob. Eng. 2002, 216, 965–973. [Google Scholar] [CrossRef]
- Zhao, J.; Li, Q.; Shen, X. Finite element analysis and structure optimization for improving the fatigue life of rubber mounts. J. Macromol. Sci. Part A: Pure Appl. Chem. 2008, 45, 542–547. [Google Scholar] [CrossRef]
- Berg, M. A Non-linear rubber spring model for rail vehicle dynamics analysis. Veh. Syst. Dyn. Int. J. Veh. Mech. Mobil. 1998, 30, 197–212. [Google Scholar] [CrossRef]
- CATIA Documentation. Available online: http://catiadoc.free.fr/online/CATIA_P3_default.htm (accessed on 29 September 2022).
- Dassault Systemes. Abaqus user’s Manual, version 6.14; HKS Inc.: New York, NY, USA, 2022. [Google Scholar]
- Dassault Systemes. I-SIGHT Component Guide, version 5.9; HKS Inc.: New York, NY, USA, 2022; pp. 1–43. [Google Scholar]
- Hwang, J.H.; Kim, C.S. Cross-Sectional shape optimization of secondary damper oil seal for rolling stock. J. Korean Soc. Railw. 2019, 22, 846–851. [Google Scholar] [CrossRef]
- Darijani, H.; Naghdabadi, R. Hyperelastic materials behavior modeling using consistent strain energy density functions. Acta Mech. 2010, 213, 235–254. [Google Scholar] [CrossRef]
- Mooney, M.A. A theory of large elastic deformation. J. Appl. Phys. 1940, 11, 582–592. [Google Scholar] [CrossRef]
- Horgan, C.O. A note on a class of generalized neo-Hookean models for isotropic incompressible hyperelastic materials. Int. J. Non-Linear Mech. 2021, 129, 103665. [Google Scholar] [CrossRef]
- Yeoh, O.H. Some form of strain energy function for rubber. Rubber Chem. Technol. 1993, 66, 754–771. [Google Scholar] [CrossRef]
- Ogden, R.W. Large deformation isotropic elasticity on the correlation of theory and experiment for the compressible rubber like solids. Proc. R. Soc. Lond. 1972, A328, 565–584. [Google Scholar]
- Choi, E.S.; Park, S.P.; Woo, D.S. Estimation of compressive stiffness of polyurethane rubber-springs and its application. J. Korean Steel Constr. 2017, 29, 220–236. [Google Scholar]
- Polyurethane Versus Rubber. Available online: http://knowledgecenter.mearthane.com/polyurethane-vs.-rubber (accessed on 29 September 2022).
- Li, Q.; Zhao, J.C.; Zhao, B. Fatigue life prediction of a rubber mount based on test of material properties and finite element analysis. Eng. Fail. Anal. 2009, 16, 2304–2310. [Google Scholar] [CrossRef]
- Mars, W.V.; Fatemi, A. Multiaxial fatigue of rubber: Part I: Equivalence criteria and theoretical aspects. Fatigue Fract. Eng. Mater. Strutures 2005, 28, 515–522. [Google Scholar] [CrossRef]
- Velden, A.V.; Koch, P. I-SIGHT Design Optimization Methodologies; ASM: Novelty, OH, USA, 2010; pp. 10–11. [Google Scholar]
- Ki, H.C.; Lee, S.Y.; Kim, C.S. A Fundamental study on vibration characteristics of container car for sensitive cargo transportation according to ASTM D-4169. J. Korea Acad. Ind. 2019, 20, 53–59. [Google Scholar]
Figure 1.
Cylindrical rubber spring: (a) wagon container; (b) internal module of cylindrical natural rubber spring installed with pallet.
Figure 1.
Cylindrical rubber spring: (a) wagon container; (b) internal module of cylindrical natural rubber spring installed with pallet.

Figure 2.
Stress–strain curves of the natural rubber under equi-biaxial tension.

Figure 3.
Stress–strain curves of the hyperelastic model.

Figure 4.
Concept design of the natural rubber spring under 3.4 kN compressive load: (a) shape 1; (b) shape 2; (c) shape 3; (d) shape 4; (e) shape 5; (f) shape 6.
Figure 4.
Concept design of the natural rubber spring under 3.4 kN compressive load: (a) shape 1; (b) shape 2; (c) shape 3; (d) shape 4; (e) shape 5; (f) shape 6.

Figure 5.
Flowchart of the data-matching optimization procedure.

Figure 6.
Comparison of compressive load displacement between natural rubber and polyurethane.

Figure 7.
Optimization histories of sum of squared difference using HJA: (a) optimization history; (b) detailed view of optimization history.
Figure 7.
Optimization histories of sum of squared difference using HJA: (a) optimization history; (b) detailed view of optimization history.

Figure 8.
Boundary conditions and applied loads.

Figure 9.
MPS and CPU time vs. mesh size.

Figure 10.
MPS distribution and histories of the original shape (shape 6 in Figure 4): (a) NFEA results; (b) comparison of MPS history between natural rubber and polyurethane.
Figure 10.
MPS distribution and histories of the original shape (shape 6 in Figure 4): (a) NFEA results; (b) comparison of MPS history between natural rubber and polyurethane.

Figure 11.
Design parameters for polyurethane spring.

Figure 12.
Flowchart of the iterative optimization procedure.

Figure 13.
Optimization histories using MIGA: (a) optimization history; (b) detailed view of optimization history.
Figure 13.
Optimization histories using MIGA: (a) optimization history; (b) detailed view of optimization history.

Figure 14.
Result optimization of polyurethane spring: (a) MPS distribution of optimal design shape; (b) comparison of MPS histories among shape and material.
Figure 14.
Result optimization of polyurethane spring: (a) MPS distribution of optimal design shape; (b) comparison of MPS histories among shape and material.

Figure 15.
Comparison of cross-section shape for cylindrical polyurethane spring.

Figure 16.
Design sensitivity analysis.

Figure 17.
Compressive load-displacement test: (a) test rig of polyurethane spring; (b) comparison of compressive load displacement between analysis and test.
Figure 17.
Compressive load-displacement test: (a) test rig of polyurethane spring; (b) comparison of compressive load displacement between analysis and test.

Figure 18.
Result of modal analysis for the elastomer spring: (a) longitudinal mode; (b) transverse mode; (c) torsional mode.
Figure 18.
Result of modal analysis for the elastomer spring: (a) longitudinal mode; (b) transverse mode; (c) torsional mode.


Table 1.
Formulation of data-matching optimum design.
| Design | Parameter |
|---|---|
| Find | Material constants Yeoh model (C10, C20, C30) |
| Minimize | Minimize sum of squared difference ( Target stiffness of polyurethane spring, Calibrated stiffness of polyurethane spring Stiffness of natural rubber spring) |
| Target | Polyurethane compressive load-displacement curve |
Table 2.
Comparison of material coefficients of natural rubber (test) and polyurethane (predicted).
| Material Coefficients | Natural Rubber (Test) | Polyurethane (Predicted) |
|---|---|---|
| C10 | 0.318 | 0.405 |
| C20 | −0.026 | −0.016 |
| C30 | 0.005 | 0.012 |
Table 3.
Comparison of the SSD based on the optimization algorithm.
| Algorithm | Sum of Squared Difference |
|---|---|
| Optimal Latin Hypercube | 45.5 |
| Multi-Island Genetic Algorithm | 40.8 |
| Hooke–Jeeves Algorithm | 40.1 |
Table 4.
Technical requirements of polyurethane spring.
| Technical Requirement | Value |
|---|---|
| Maximum compressive displacement under 3.4 kN | 20 mm |
| Maximum principal strain | Minimum value |
| Natural frequency | ≤5 Hz |
Table 5.
Formulation of optimum design.
| Design | Parameter | |
|---|---|---|
| Find | , , , | |
| Minimize | Maximum principal strain at a weak point | |
| Boundary | −20% < < 20% −20% < < 20% −20% < < 20% −20% < < 20% | (height, mm) (outer diameter, mm) (inner diameter, mm) (thickness, mm) |
| Constraint | Displacement = 20 mm (±0.01 mm) | |
Table 6.
Comparison of variables and MPS between existing and optimum design shapes.
| Design Shape | Parameter | Maximum Principal Strain | Decreasing Rate of Maximum Principal Strain | |
|---|---|---|---|---|
| Original shape polyurethane | 105.00 (mm) | 0.306 | 20.2 (%) | |
| 40.00 (mm) | ||||
| 17.00 (mm) | ||||
| 10.00 (mm) | ||||
| Optimal shape polyurethane | 113.02 (mm) | 0.244 | ||
| 45.10 (mm) | ||||
| 14.30 (mm) | ||||
| 11.49 (mm) | ||||
Table 7.
Comparison of the sum of squared difference based on the optimization algorithm.
| Algorithm | Maximum Principal Strain |
|---|---|
| Optimal Latin Hypercube | 0.248 |
| Multi-Island Genetic Algorithm | 0.244 |
| Hooke–Jeeves Algorithm | 0.247 |
Table 8.
Comparison of stiffness, natural frequency and maximum principal strain according to shape and material.
Table 8.
Comparison of stiffness, natural frequency and maximum principal strain according to shape and material.
| Shape and Material | Stiffness (N/mm) | Natural Frequency (Hz) | Maximum Principal Strain (mm/mm) | ||||
|---|---|---|---|---|---|---|---|
| 1st | 2nd | 3rd | 4th | 5th | |||
| Original shape - Natural rubber | 102 | 1.09 | 1.10 | 1.47 | 2.71 | 3.26 | 0.401 |
| Original shape - Polyurethane | 131 | 1.24 | 1.25 | 1.66 | 3.06 | 3.68 | 0.306 |
| Optimal shape - Polyurethane | 166 | 1.51 | 1.52 | 2.04 | 3.63 | 4.37 | 0.244 |
Disclaimer/Publisher’s Note: The statements, opinions and data contained in all publications are solely those of the individual author(s) and contributor(s) and not of MDPI and/or the editor(s). MDPI and/or the editor(s) disclaim responsibility for any injury to people or property resulting from any ideas, methods, instructions or products referred to in the content. |
© 2023 by the authors. Licensee MDPI, Basel, Switzerland. This article is an open access article distributed under the terms and conditions of the Creative Commons Attribution (CC BY) license (https://creativecommons.org/licenses/by/4.0/).
Share and Cite
MDPI and ACS Style
Kim, K.-S.; Kim, C.-S. Cross-Sectional Shape Optimization of Cylindrical Elastomer Spring for Sensitive Cargo Container. Appl. Sci. 2023, 13, 2517. https://doi.org/10.3390/app13042517
AMA Style
Kim K-S, Kim C-S. Cross-Sectional Shape Optimization of Cylindrical Elastomer Spring for Sensitive Cargo Container. Applied Sciences. 2023; 13(4):2517. https://doi.org/10.3390/app13042517
Chicago/Turabian StyleKim, Kyung-Sik, and Chul-Su Kim. 2023. "Cross-Sectional Shape Optimization of Cylindrical Elastomer Spring for Sensitive Cargo Container" Applied Sciences 13, no. 4: 2517. https://doi.org/10.3390/app13042517
Note that from the first issue of 2016, this journal uses article numbers instead of page numbers. See further details here.