
Modal Identification of Train Passenger Seats Based on Dynamic Tests and Output-Only Techniques


1
CONSTRUCT–LESE, Faculty of Engineering, University of Porto, 4099-002 Porto, Portugal
2
Department of Mechanical Engineering, School of Engineering, University of Minho, 4710-057 Guimarães, Portugal
3
CONSTRUCT–LESE, School of Engineering, Polytechnic of Porto, 4249-015 Porto, Portugal
4
Faculty of Engineering, University of Porto, 4099-002 Porto, Portugal
5
INEGI, LAETA, 4099-002 Porto, Portugal
*
Author to whom correspondence should be addressed.
Appl. Sci. 2023, 13(4), 2277; https://doi.org/10.3390/app13042277
Submission received: 15 January 2023
/
Revised: 3 February 2023
/
Accepted: 8 February 2023
/
Published: 10 February 2023
(This article belongs to the Special Issue Innovative Solutions for the Railway Sector: Design and Experimentation)
Abstract
:Railways are one of the most efficient and widely used mass transportation systems for mid-range distances, also being pointed out as the best strategy to reach European Union decarbonisation goals. However, to increase railways attractiveness, it is necessary to improve the quality of the ride, namely its comfort, by decreasing the vibration at the passenger level. This article describes the experimental vibration modal identification of train seats based on a dedicated set of dynamic tests performed on Alfa Pendular and Intercity trains. This work uses two output-only modal identification techniques: the transmissibility functions and the Enhanced Frequency Domain Decomposition (EFDD) method. The last method allows us to clearly distinguish the seat structural movements, particularly the ones related to torsion and bending of the seat frame, from the local vertical foam vibrations. The natural frequencies and mode shapes are validated by matching the results derived from the transmissibility functions and EFDD method. The identified modal parameters are particularly relevant to characterise the vibration transmissibility provided by the foams (local transmissibility) and the vibration transmissibility derived from the metallic seat frame (global transmissibility).
1. Introduction
Railways are one of the most widely used public transportation systems mainly due to their high safety levels and superior transportation capacity. Additionally, trains have been revealed to be the most sustainable transportation system, as a higher proportion of railway services are operated by electrified trains and, therefore, CO2 emissions per passenger-kilometre are considerably reduced compared with air or car transportation [1,2,3].
Due to the low environmental impact, several governments worldwide are promoting rail use as the main mass transportation system, especially for connecting low and mid-range distances. Following this strategy, passengers have continuously increased since 2013 until the 2020 COVID pandemic. After a historic 4000 billion passenger-kilometres recorded worldwide between 2015 and 2019, the number drastically decreased due to the multiple lockdowns. Nowadays, those numbers are even higher than the pre-pandemic ones [4,5]. To maintain this continuous rising trend, one must improve the trains’ attractivity, which is usually achieved based on three main parameters: safety, comfort, and user conditions [6,7,8,9]. Resulting from the rail motion and wheel–track interaction, seat vibration affects users’ comfort and health, limiting the attractiveness performance. As passengers spend most of their time seated, vibration will be transmitted to the user through the interfaces between the human body and the seat structure and vehicle [8]. Thus, evaluating vibration transmission in a rail environment is crucial to assess the vibration frequencies and amplitudes transmitted to the user and evaluate passengers’ comfort [9,10,11,12,13,14].
Several reference standards and guidelines, such as EN 12299 [8], UIC 513 [15], and ISO 2631-1 [16], define methodologies for the assessment of passengers’ comfort based on both simplified and complete measurements. The simplified measurements are exclusively based on the accelerations measured at the floor of the carbody. This approach has the advantage of using a simpler measurement layout. However, the transposition of the acceleration from the floor to the passenger seat level requires the application of dedicated weighting frequency-dependent filters [8,15,16]. Otherwise, the complete measurements are based on the acceleration recorded on the passenger–seat–carbody interfaces, such as headrest–neck, arm rest–upper arms, seat–hip, seatback, and floor–seat, as well as on the carbody floor, close to the seat. This approach requires a set of dedicated accelerometers installed on the several sites, which may be difficult. Inclusively, involuntary movements of the passengers can change the positioning of the accelerometers, compromising the quality of the measurements. Nevertheless, if performed adequately, it constitutes a more adequate approach to evaluate the passenger comfort as it considers more realistically the complexity of the seat structure dynamics [17,18,19,20].
Seat dynamics is quantified regarding transmissibility, which verifies seat efficiency in handling vibration discomfort. Train seats are crucial to decrease vibration transmission from the floor to the user. Together, the seat and human body constitute a coupled complex dynamic system [14,21,22,23]. A significant discrepancy can be observed when comparing the transmissibility of subjects with identical characteristics, including identical mass. Moreover, the human body has its own natural resonance frequencies that may lead to physiological responses when matched. The range between 5 and 10 Hz leads to resonance in the chest and abdominal region, and a higher frequency range, comprehended between 20 and 30 Hz, affects the head and neck muscles. Lastly, in the interval between 30 and 60 Hz, the ocular system perceives resonance [24,25,26,27]. Therefore, seat transmissibility can be significantly influenced by the biodynamics of the human body and its pronounced nonlinearity [28].
The biodynamic response of the human body is cross-axis-coupled, i.e., inducing vibration in one axis may lead to a response in another axis. Significant body movements in the fore-and-aft direction are produced during vertical excitation. This way, seat transmissibility is cross-axis-coupled. Additionally, the influence of subjects’ physical characteristics, such as weight, on the resonance frequency and seat transmissibility has been evaluated by several authors. Multiple studies developed using subjects with varying mass ranges reported unaffected results. Increasing the loading on the seat surface (by the subject’s weight) tends to increase the foam’s dynamic stiffness. This foam behaviour explains the absence of the subject’s weight’s effect on seat transmissibility [29,30,31,32].
Transmissibility differs in direction, particularly in the vertical, fore-and-aft, and lateral directions, and location, namely the seat surface and seatback. Several laboratory experiments have demonstrated a vertical transmissibility peak at 4–6 Hz when sitting upright with seatback support [23,32,33,34]. However, these experiments did not implement transmissibility tests in traditional train seats. Instead, a single rigid seat frame with distinct characteristics from the ones of a current train seat, such as frame dimensions and support points, was considered. In addition, the foam was freely placed on top of the seat surface without any restricting cover [23,32,33,34]. The constraint conditions of the foam are crucial to correctly address the influence of the foam thickness variation on the transmissibility of the seat, particularly on the evaluation of its dynamic stiffness [34].
Regarding seat cushion properties, changing foam thickness has generally been found to have the most prominent and predictable effects on seat transmissibility. Doubling the foam thickness roughly halves its stiffness, leading to increased transmissibility and discomfort. Patelli and Griffin [23] conducted a study to observe the effect of foam thickness on seat transmissibility. Increasing the thickness from 40 to 80 mm reduced the transmissibility from the range of 4–7 Hz to 3–5 Hz, respectively. Resonance frequencies were found equal to 3–4 Hz, for 40 mm foam, decreasing to 2–3 Hz for 80 mm foam. The experimented individuals did not have contact with the backrest [25]. A similar tendency was reported by Zhang et al. [35] where a higher transmissibility resonance was observed when the seat surface foam increased from 60 mm to 80 mm, and posteriorly to 100 mm.
In turn, changing the foam hardness (composition and density) does not present any significant effect on seat transmissibility. Due to hysteresis loss, density affects the static comfort instead of the seat transmissibility. Ebe and Griffin [13] examined seat transmissibility by considering four foam cushions with equal dimensions but varying densities (from 45 to 65 kg/m3). Seat transmissibility did not present significative differences, contrary to what was observed with the subjects’ comfort judgments. Therefore, those judgment differences were related to the static seat comfort [13].
Based on the limitations of the previous experiments, this study aims to give clear contributions about some aspects that presently, according to the authors’ knowledge, are not sufficiently addressed in the existing literature, particularly:
- −
- Development of an experimental test setup on a real train environment. This way, the influence of the flexible seat base, instead of the currently rigid base used in laboratory experiments, as well as the influence of the carbody/bogies resonance movements, are considered on the seat dynamic performance. In addition, this dedicated experimental setup can clearly distinguish the seat frame’s structural movements from the foam’s local vibrations.
- −
- Accurate characterisation of modal parameters of the seat structural frame and surface foam for different types of seats belonging to Alfa Pendular and Intercity trains, including standard and comfort seats.
- −
- Train seat modal parameters validation based on the application of two distinct output-only techniques, one based on transmissibility functions, which is used by most of the authors in the bibliography, and the other based on the Enhanced Frequency Domain Decomposition (EFDD) method. The latter allows for visualising the modal configurations, which is a novelty in relation to the previous research works.
2. Modal Identification Methodologies
Vibration measurements have been intensively applied to structural health monitoring applications in civil and transportation engineering [36,37,38]. The output-only modal analysis, also called operational modal analysis, relies on applying modal identification techniques based exclusively on the structural response measurements. Modal identification techniques are divided into two groups, those based on the frequency domain and those based on the time domain. The present research considers only frequency domain techniques [39], mainly the transmissibility function and the EFDD, which are discussed in the present section.
2.1. Transmissibility Function
Seat dynamics is quantified regarding transmissibility, which is an indicator of dynamic comfort [6,7,11,12,21,32]. Transmissibility is defined as the ratio between the response amplitude at a specific seat location under an external forced vibration and the excitation amplitude at the seat base, both expressed in the frequency domain [40]. Therefore, the transmissibility function between the user–seat interface and the floor, H(f), is a non-dimensional parameter calculated by the following equation:
where Go(f) is the output acceleration spectrum at the seat–user interface, and Gi(f) represents the input acceleration spectrum at the floor level [23].
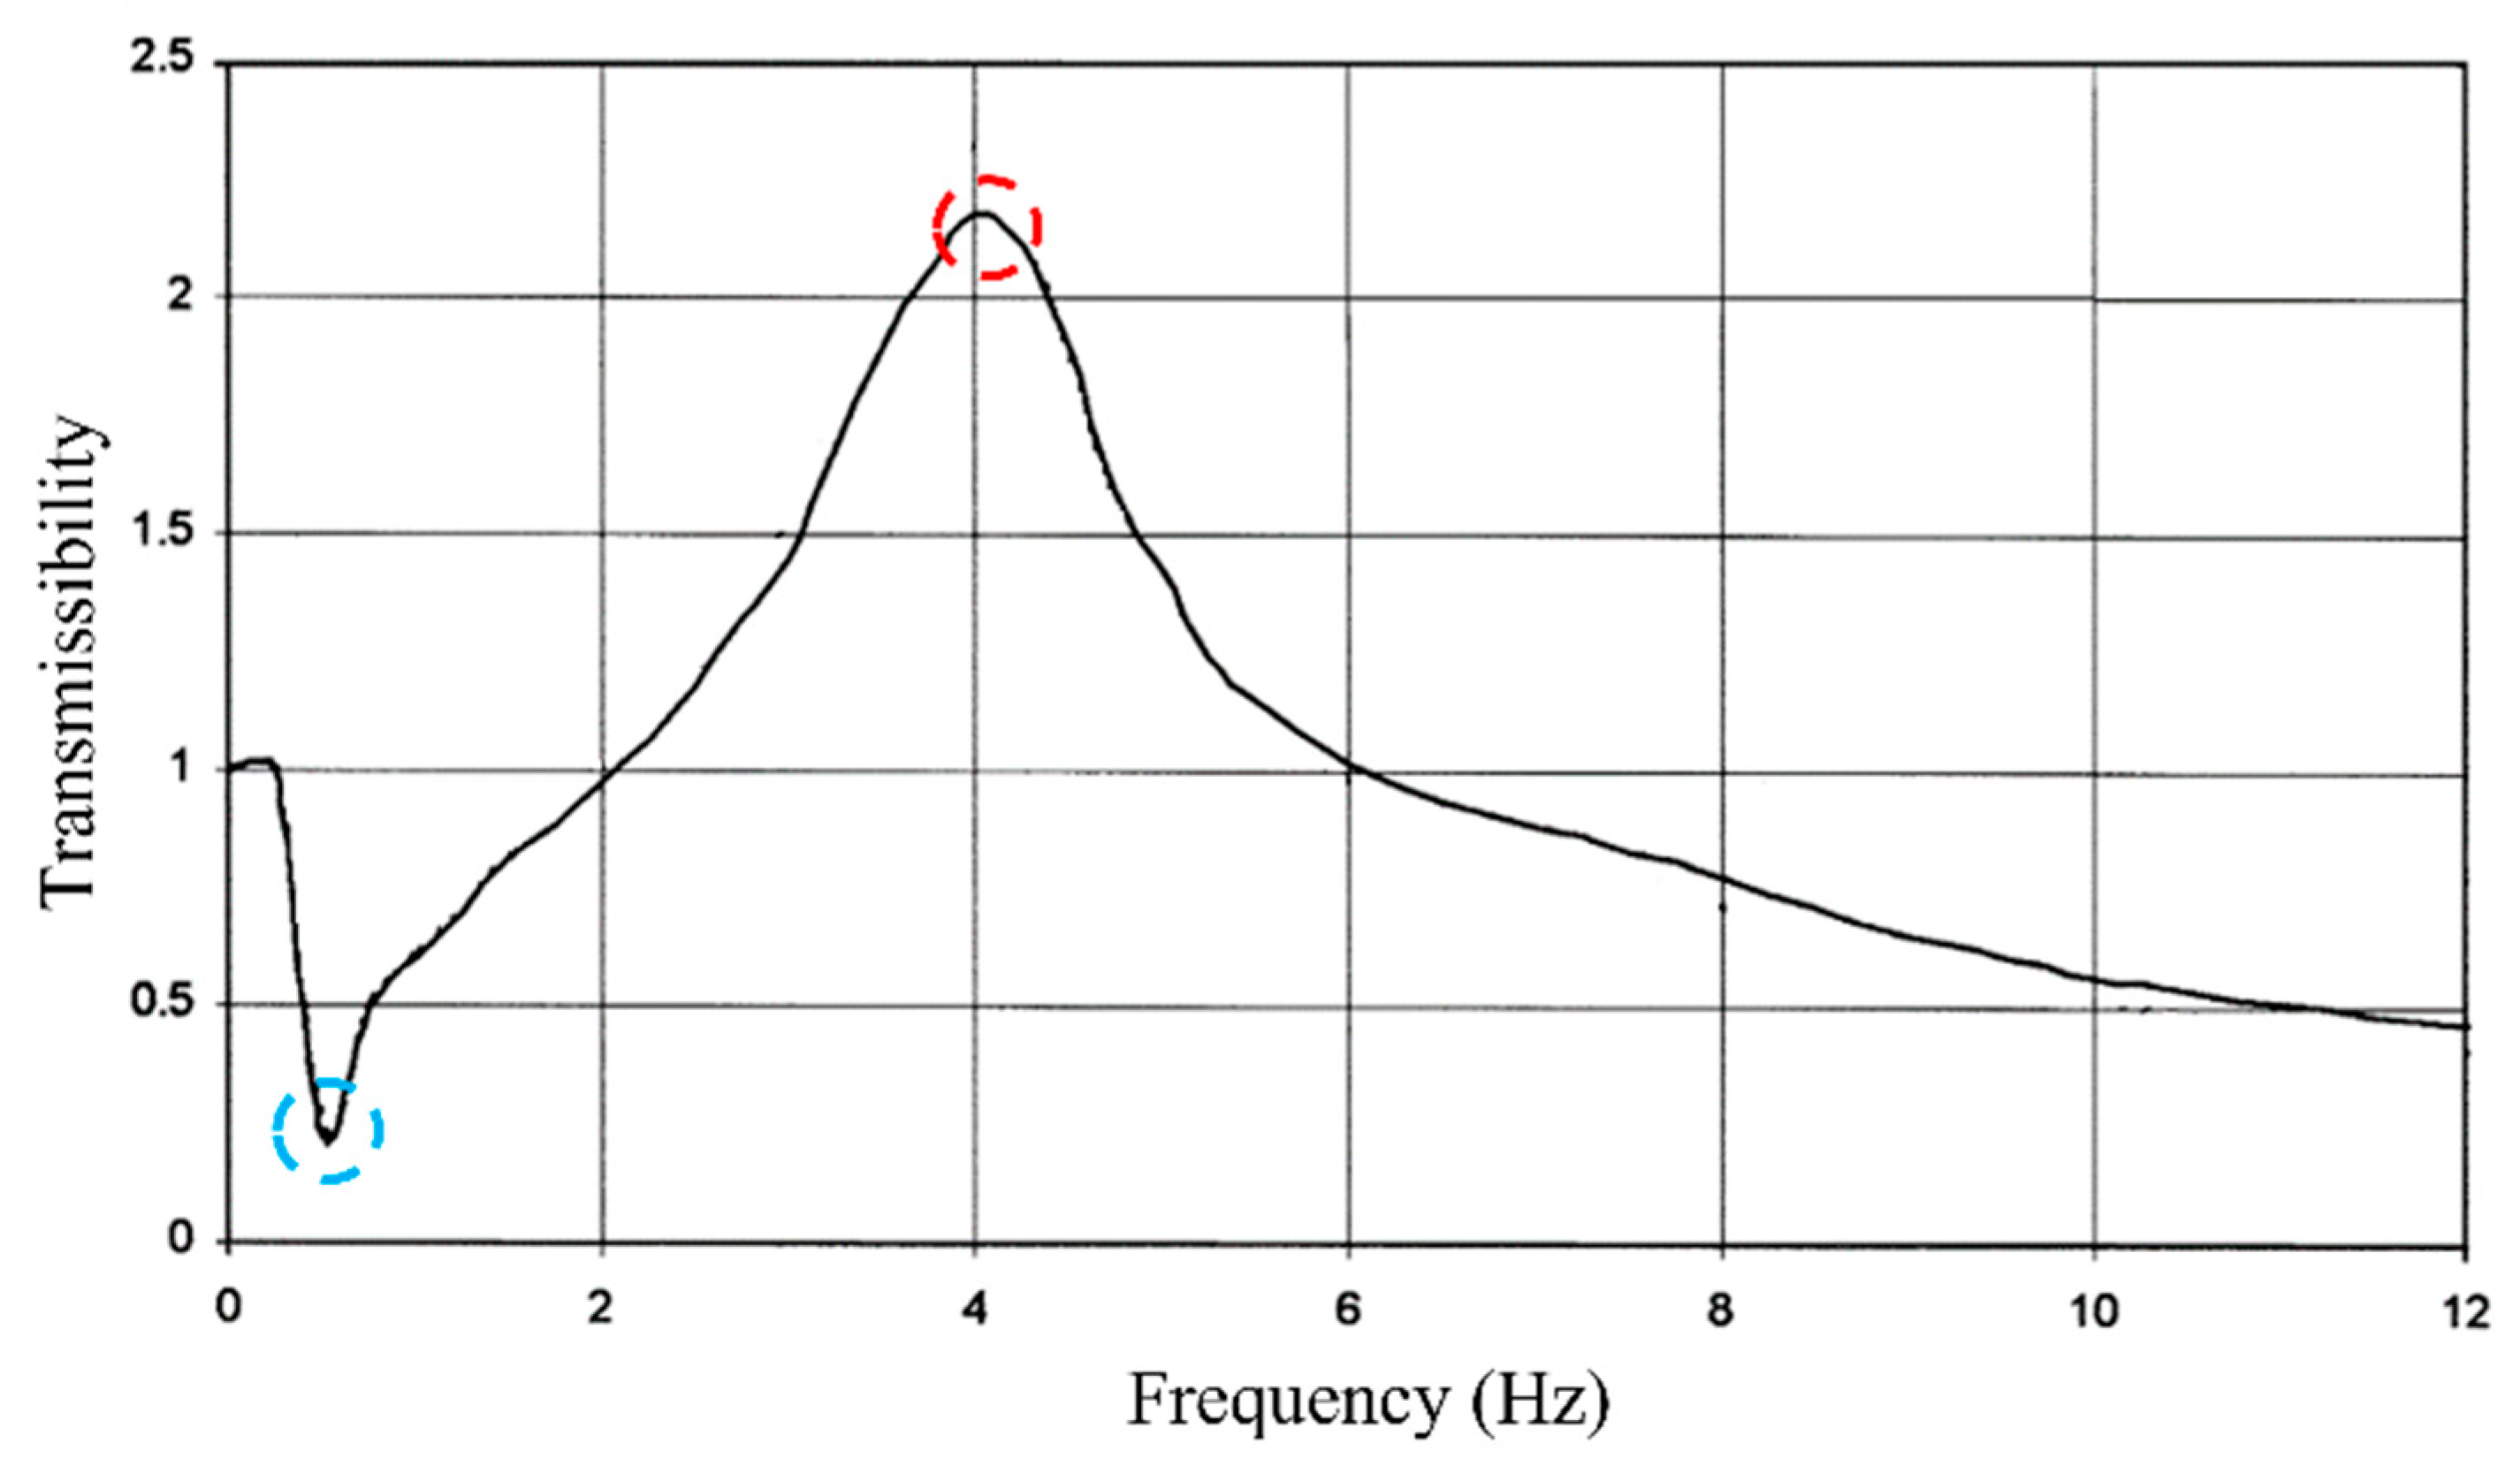
As the human body is a highly complex nonlinear biomechanical system, the vibration transmissibility varies with the direction and location of the measurements [41]. Therefore, seat transmissibility can be measured according to the axis (vertical, lateral, or longitudinal) and location (e.g., seat surface, seatback, armrest). Most published research involves the study of vertical transmissibility measured at the floor and seat surface, as these are the axes and locations most affecting passenger comfort [40]. Conventional train seats show a typical seat transmissibility curve, as displayed in Figure 1, and resonances comprehended between 4 and 6 Hz [25].
In Figure 1, a resonance peak (red dot) is noticed that characterises, in this case, the highest vibration transmission to the user, but in other situations, it can also be associated with a local maximum. In contrast, the antiresonance valley (blue dot) occurs when the responses of certain system components under forced excitation present a local minimum, in most situations, quite close to zero [39,40,42,43].
Regarding the train seat, the resonance frequencies can be associated with the single or combined movements of the foam and structural seat frame, while the antiresonance frequencies may be associated with the transition between the distinct type of seat vibrations.
2.2. Enhanced Frequency Domain Decomposition (EFDD)
The EFDD method is an upgrade of the Frequency Domain Decomposition (FDD) method, proposed by Brincker et al. [44], and allows an accurate estimation not only of the natural frequencies, but also mode shapes and damping coefficients. This method is based on the Singular Value Decomposition (SVD) of the Power Spectral Density (PSD) matrix, , which can be obtained by the Fourier transform of the time-domain autocorrelation functions. Thus, the main diagonal of the PSD matrix is composed by the auto-spectral density functions, and the out-of-diagonal terms represent the cross-spectral density functions. The SVD decomposition of the PSD matrix can be summarised by the following equation:
where Σ is a diagonal matrix containing the singular values, and U and V are similar matrices containing the singular vectors. Brincker et al. [44] demonstrated that, for structures with low values of damping and subject to white noise excitations, the matrix of singular values corresponds to the power spectral density functions of a set of one degree-of-freedom (DOF) oscillators, whose singular values and vectors coincide with those of the real structure. If the white noise excitation assumption is not fulfilled, the method can still be applied, and the obtained results are approximated. Those results are considered reliable and enhanced compared to those obtained on the classical peak-picking method [44,45]. Then, the SVD allows for isolating the contribution of each of the mode vibrations as a 1-DOF system. The main steps (1 to 4) of the EFDD method are summarised in Figure 2 and involve mathematical operations first in the time domain and then in the frequency domain.
In the case of well-separated modes, only the first singular value will have significant information. However, in the case of closely spaced modes, one will be identified in the first singular value curve, while the others will be identified in the second- or higher-order singular values curves. The natural frequencies and damping coefficients are derived from the time domain autocorrelation function, which is calculated by the Inverse Fourier Transform (IFFT) of the singular values around each resonance peak.
The comparison between vectors can be performed employing a scalar index denominated as the Model Assurance Criterion (MAC), which investigates the correlation between two modal configurations [44,45]. By averaging the singular vectors of the neighbourhood points of the resonance frequencies with MAC higher than 0.8, and weighting by the value of the corresponding singular values, the estimation of modal configurations associated with each natural frequency is calculated. This way, the selection of the SVD points is based on the similarity between their singular vectors calculated through the MAC parameter. Respecting the assumptions of the method, these functions will be proportional to the free vibration decay of the 1-DOF oscillator. Thus, it is possible to estimate the natural frequency based on a dedicated counting of vibration cycles and damping coefficient, by applying the logarithm decrement method, which involves adjusting the exponential term ) to the free vibration decay movement [44,46,47].
Regarding the present work, pairing comfort and standard seat modes can be conducted through the MAC parameter, which, as stated, measures the linear correlation between modal vectors through their mean square deviation [48]. The MAC parameter is a scalar, varying between 0 and 1, whose unit value indicates that the modes are coincident or linearly dependent [49,50]. Its value is estimated based on the following expression:
where is the vector containing the coordinates from the comfort seat mode j corresponding to its data, and is the vector containing the standard seat information of mode i.
3. Case Study: Alfa Pendular
The Portuguese CPA 4000 series Pendolino, traditionally named as the Alfa Pendular (AP) train, started its operation in 1999. Figure 3 shows the CPA 4000 series on a regular passenger service. The train is a conventional electric train with an active tilting system and a total length of 158.9 m. It is operated as a single unit and comprises six vehicles, four motor and two hauled vehicles [51,52].
Cars 1 and 2 are classified as comfort classes, while the others are standard class. Despite being visually similar, the seats of the two classes are different in terms of their dimensions. The comfort seat is larger than the standard one. Therefore, comfort class seats present a higher seating area, thicker seat surface and seatback foams, larger seat frame, and higher distance between seats.
In 2017, the AP train was renovated, leading to a significant change in seat design while retaining the same seat structural frame. This renovation introduced several changes to the seat cover and foam design. While the pre-renovation seats presented a free foam covered by fabric, the renovated ones exhibited a restricting leather cover with large hems and new foams [53,54]. Figure 4 illustrates the renovated comfort and standard class seats and their respective location. Seats instrumented on this work were positioned in the same location inside vehicles 1 and 6, respectively, for comfort and standard classes, more specifically near the rear bogies.
The comfort class seats have a seat surface foam thickness of 190 mm, while for the standard class seats, the same thickness is equal to 130 mm. Regarding the seatback, the foam thickness is 127 mm and 110 mm, respectively, for comfort and standard seats. Moreover, both seats and foams have a 2 mm thick leather cover. The aluminium structural frame underneath that supports the seats is presented in Figure 5. The frame comprises two vertical columns and a transversal girder, and provides the seat’s connection to the carbody platform. These elements compose the structural frame of both seat classes. As the seats differ in dimensions, the elements constituting the comfort seat frame have higher dimensions than those of the standard seat [54].
3.1. Dynamic Tests
A set of dedicated experimental tests were performed in the Portuguese Train operator–CP maintenance facilities to evaluate the seats’ dynamic behaviour. Three volunteers (2 males and 1 female), aged between 26 and 39, weighing 58–115 kg, and 1.70–1.87 m in height, participated in the tests (Table 1). The experiment was approved by the Ethics Committee of the University of Minho. Each experiment was conducted three times for each subject. The subjects were instructed to sit in a normal posture, place both hands on their thighs, and perform complete contact with the seatback.
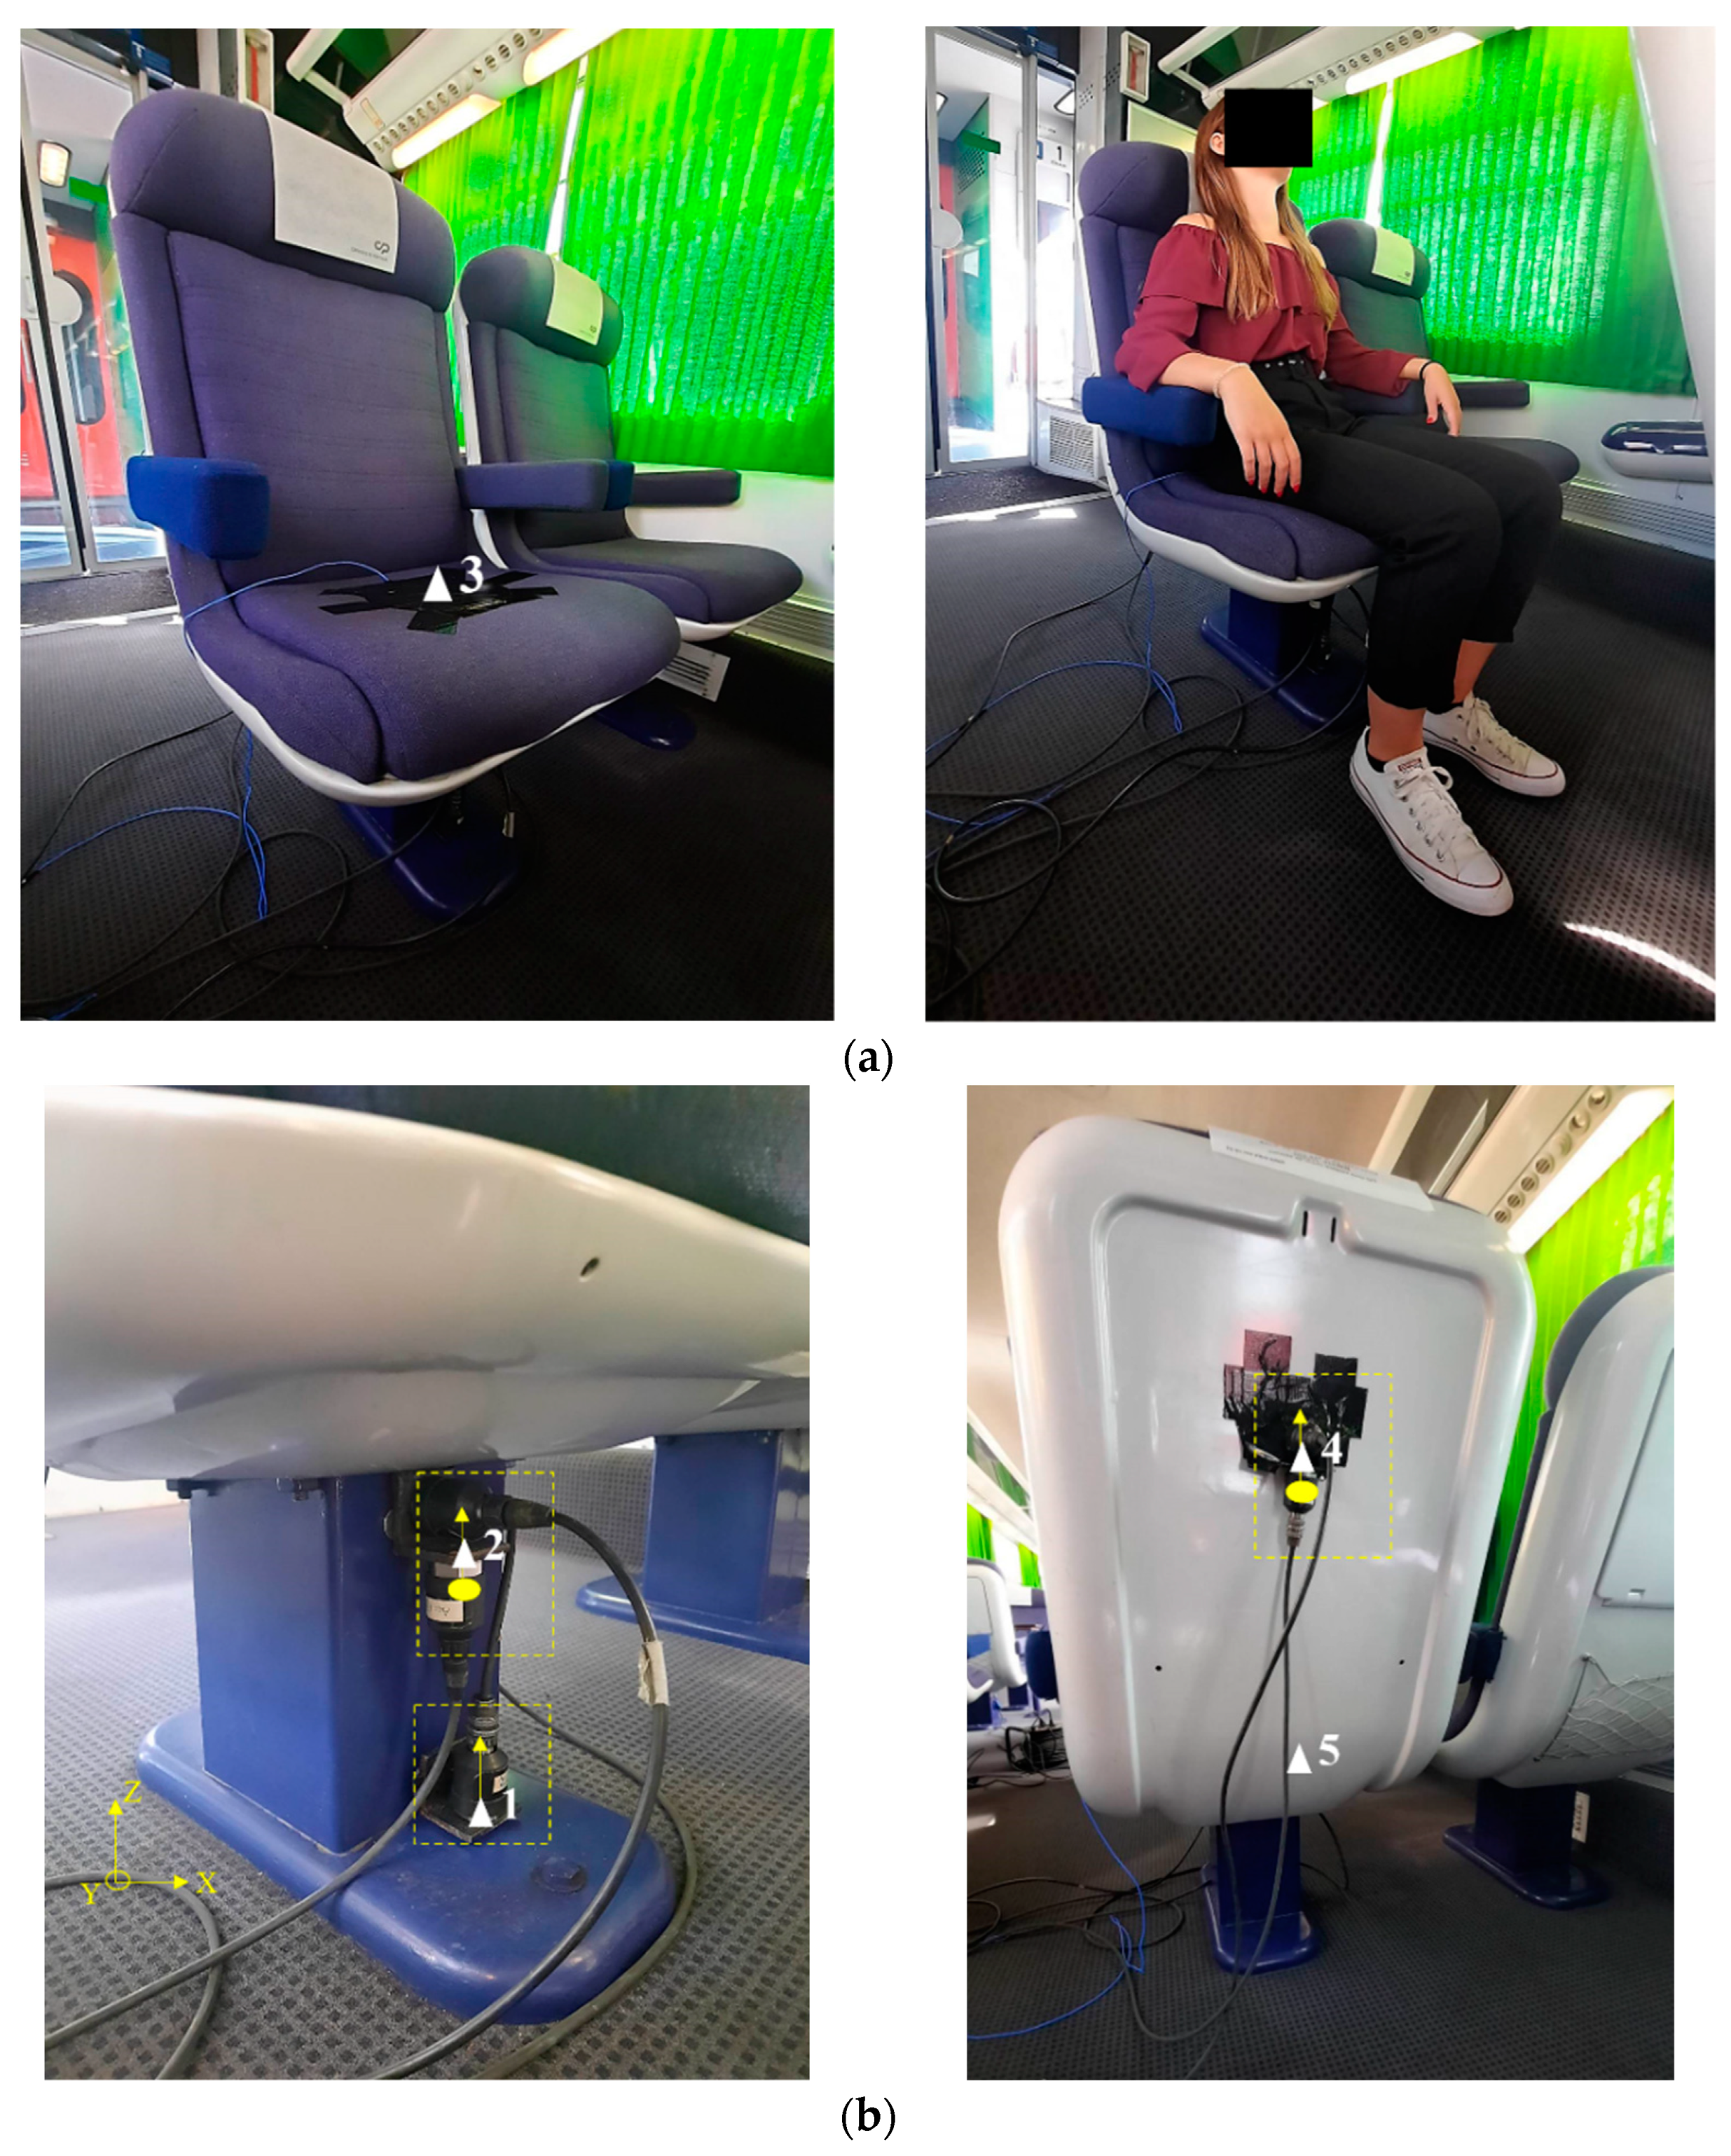
Figure 6 illustrates the experimental setup used to estimate the AP seats’ transmissibility and modal parameters. Two seats, one of each class, were instrumented. It should also be highlighted that the subjects were seated near the window. The acceleration at the seat surface was measured using a 3-axial seat pad accelerometer (PCB model 356B41), as illustrated in Figure 6a (left side). On the same Figure 6a, but on the right side, an ongoing experimental test is demonstrated. Additionally, uniaxial accelerometers (PCB model 393A03) were placed on the floor (1 unit) and the metallic support frame (4 units) for measuring the acceleration in the Z (vertical) direction at the seat frame, as represented in Figure 6b. It should be highlighted that accelerations on node 2 were derived from the accelerations on node 1. Based on this assumption, when using ARTeMIS® software, node 1 was defined as the master while node 2 assumed the slave position. The accelerometers were strategically distributed to properly distinguish the seat frame’s vertical torsion and bending modes and the seat foam’s local vibrations.
Time series were acquired in periods of 5 min, with a sampling frequency of 2048 Hz, posteriorly decimated to a frequency of 64 Hz. The down-sample was conducted based on the assumption that the frequencies of interest regarding passengers’ comfort are generally ranged between DC and 20 Hz. In addition, the data are presented between DC and 12 Hz, which enables a closer view to the frequencies of interest. The data acquisition system was composed of a National Instruments (NI) cDAQ-9172 equipped with IEPE analogue input modules with 24-bit resolution (NI 9234) connected to a PC to acquire and record data measurements. The vibration was induced by a group of people randomly walking and jumping nearby the seat. The experiments were run with a train interior temperature of around 20 °C.
3.2. Results
Results are divided according to the modal identification technique used, namely the transmissibility curves (Section 3.2.1) and EFDD method (Section 3.2.2).
3.2.1. Transmissibility Curves
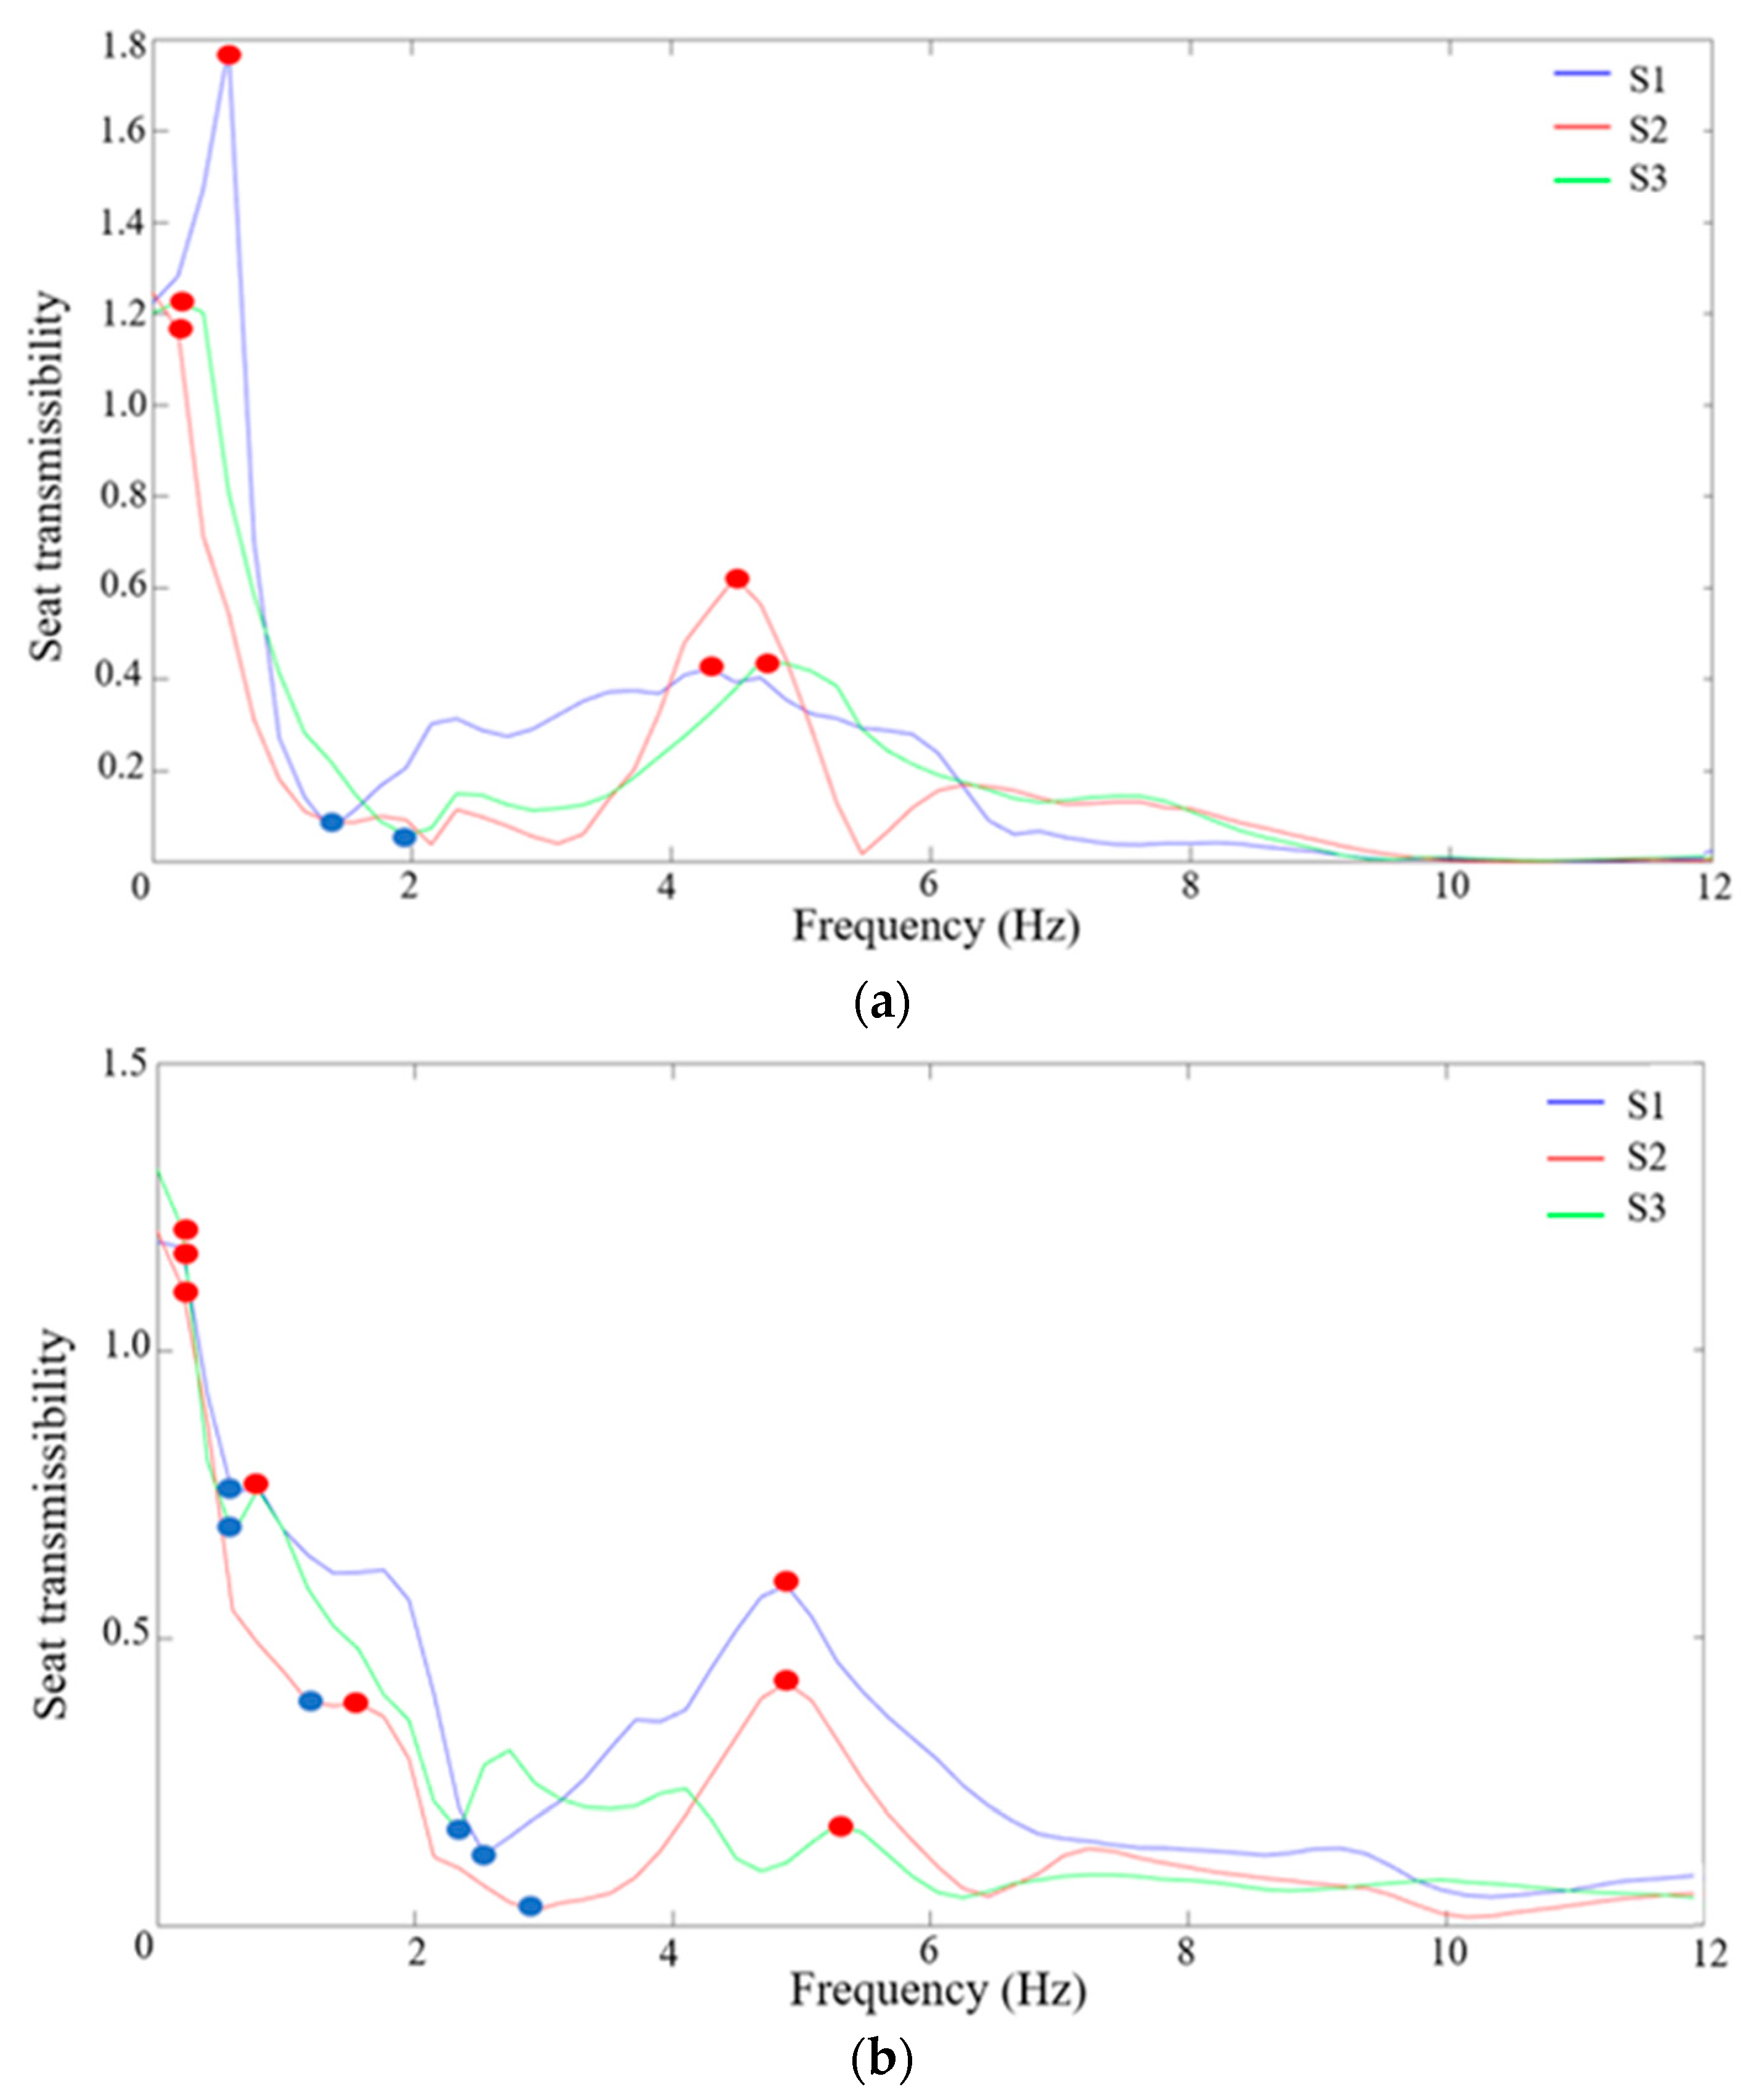
Transmissibility curves were evaluated using MATLAB scripts validated in previous works [55]. These curves were obtained based on the information from accelerometers 1 and 6, both at the z-axis. Due to the similarity between experiments and to obtain a cleaner presentation, only 1 experiment per subject is presented. Figure 7 shows the transmissibility curves for the three subjects (S1, S2, and S3) considering the comfort (Figure 7a) and standard (Figure 7b) seats. It is possible to observe the resonance peaks (marked by red circles) and the antiresonance peaks (marked by blue circles).
Table 2 summarises the main resonance and antiresonance peaks for the comfort and standard seats. Due to its intensity, it is expected that some of these frequencies cannot induce a different type of movement.
Comfort seat transmissibilities are characterised by resonance frequencies of 0.20, 1.37–1.56, 2.54, and 4.69–4.88 Hz. It should be pointed out that the higher-amplitude transmissibility peaks occur at low frequencies, namely 0.20 and 1.37–1.56 Hz. The antiresonance values are found between 0.39–0.59 and 4.30–4.69 Hz. Despite the inter-subject variability, no significant differences are found between the transmissibility resonances and antiresonances frequency values when comparing all subjects’ results. These conclusions comply with the ones found by Toward and Griffin [32].
Regarding standard seat transmissibility, the results are also similar for all analysed subjects. Resonances of 0.20, 1.76, 2.34–2.73, and 4.30–4.69 Hz and antiresonances equal to 0.78–1.37 and 3.52–4.30 Hz characterise this class. Higher transmissibility resonances are obtained for 0.20 and 1.76 Hz. Those transmissibility peaks are higher than the ones of the comfort seat. This result agrees with the conclusions derived from the studies performed by Patelli and Griffin [23] and Zhang et al. [35], where the transmissibility peak values decreased for higher foam thicknesses. As aforementioned, the comfort seat has a seat surface thickness of 190 mm, whereas the standard seat thickness is equal to 130 mm. The previously mentioned studies evaluated the effect of foam thickness on less thick foams, namely 40, 60, 80, and 100 mm. Therefore, the AP seat foam thickness is higher than those of the previous studies. Following the reported trend, comparing those results with the present ones, lower transmissibility frequencies in the present results were observed.
The transmissibility frequency resonance peaks presented in this study are lower than those presented by other authors [23,32,33,34], who found vertical transmissibility frequencies around 4.30 Hz. However, the experiments reported in the bibliography were performed in laboratory conditions instead of using a real railway vehicle. More specifically, those tests considered a single seat with a simplified rigid metallic structure (with a mass of approximately 1000 kg) composed of 4 vertical rigid columns and a free foam on top of the surface without covering it nor restricting its movement. In turn, the train seats instrumented in this study present a leather cover with a large seam hem. The cover significantly modifies the foam vibration transmission by restricting the foam cellular morphology movements. Therefore, the vibration absorption is clearly distinct when compared to the free foam of the laboratory experiments.
Figure 7 also identifies a peak around 3 Hz associated with the rigid body movement of the seat frame over the carbody due to the stiffness provided by the flexible connection elements, particularly screws and rubber pads. These elements act as a spring that flexibilize the seat frame movements.
3.2.2. EFDD Method
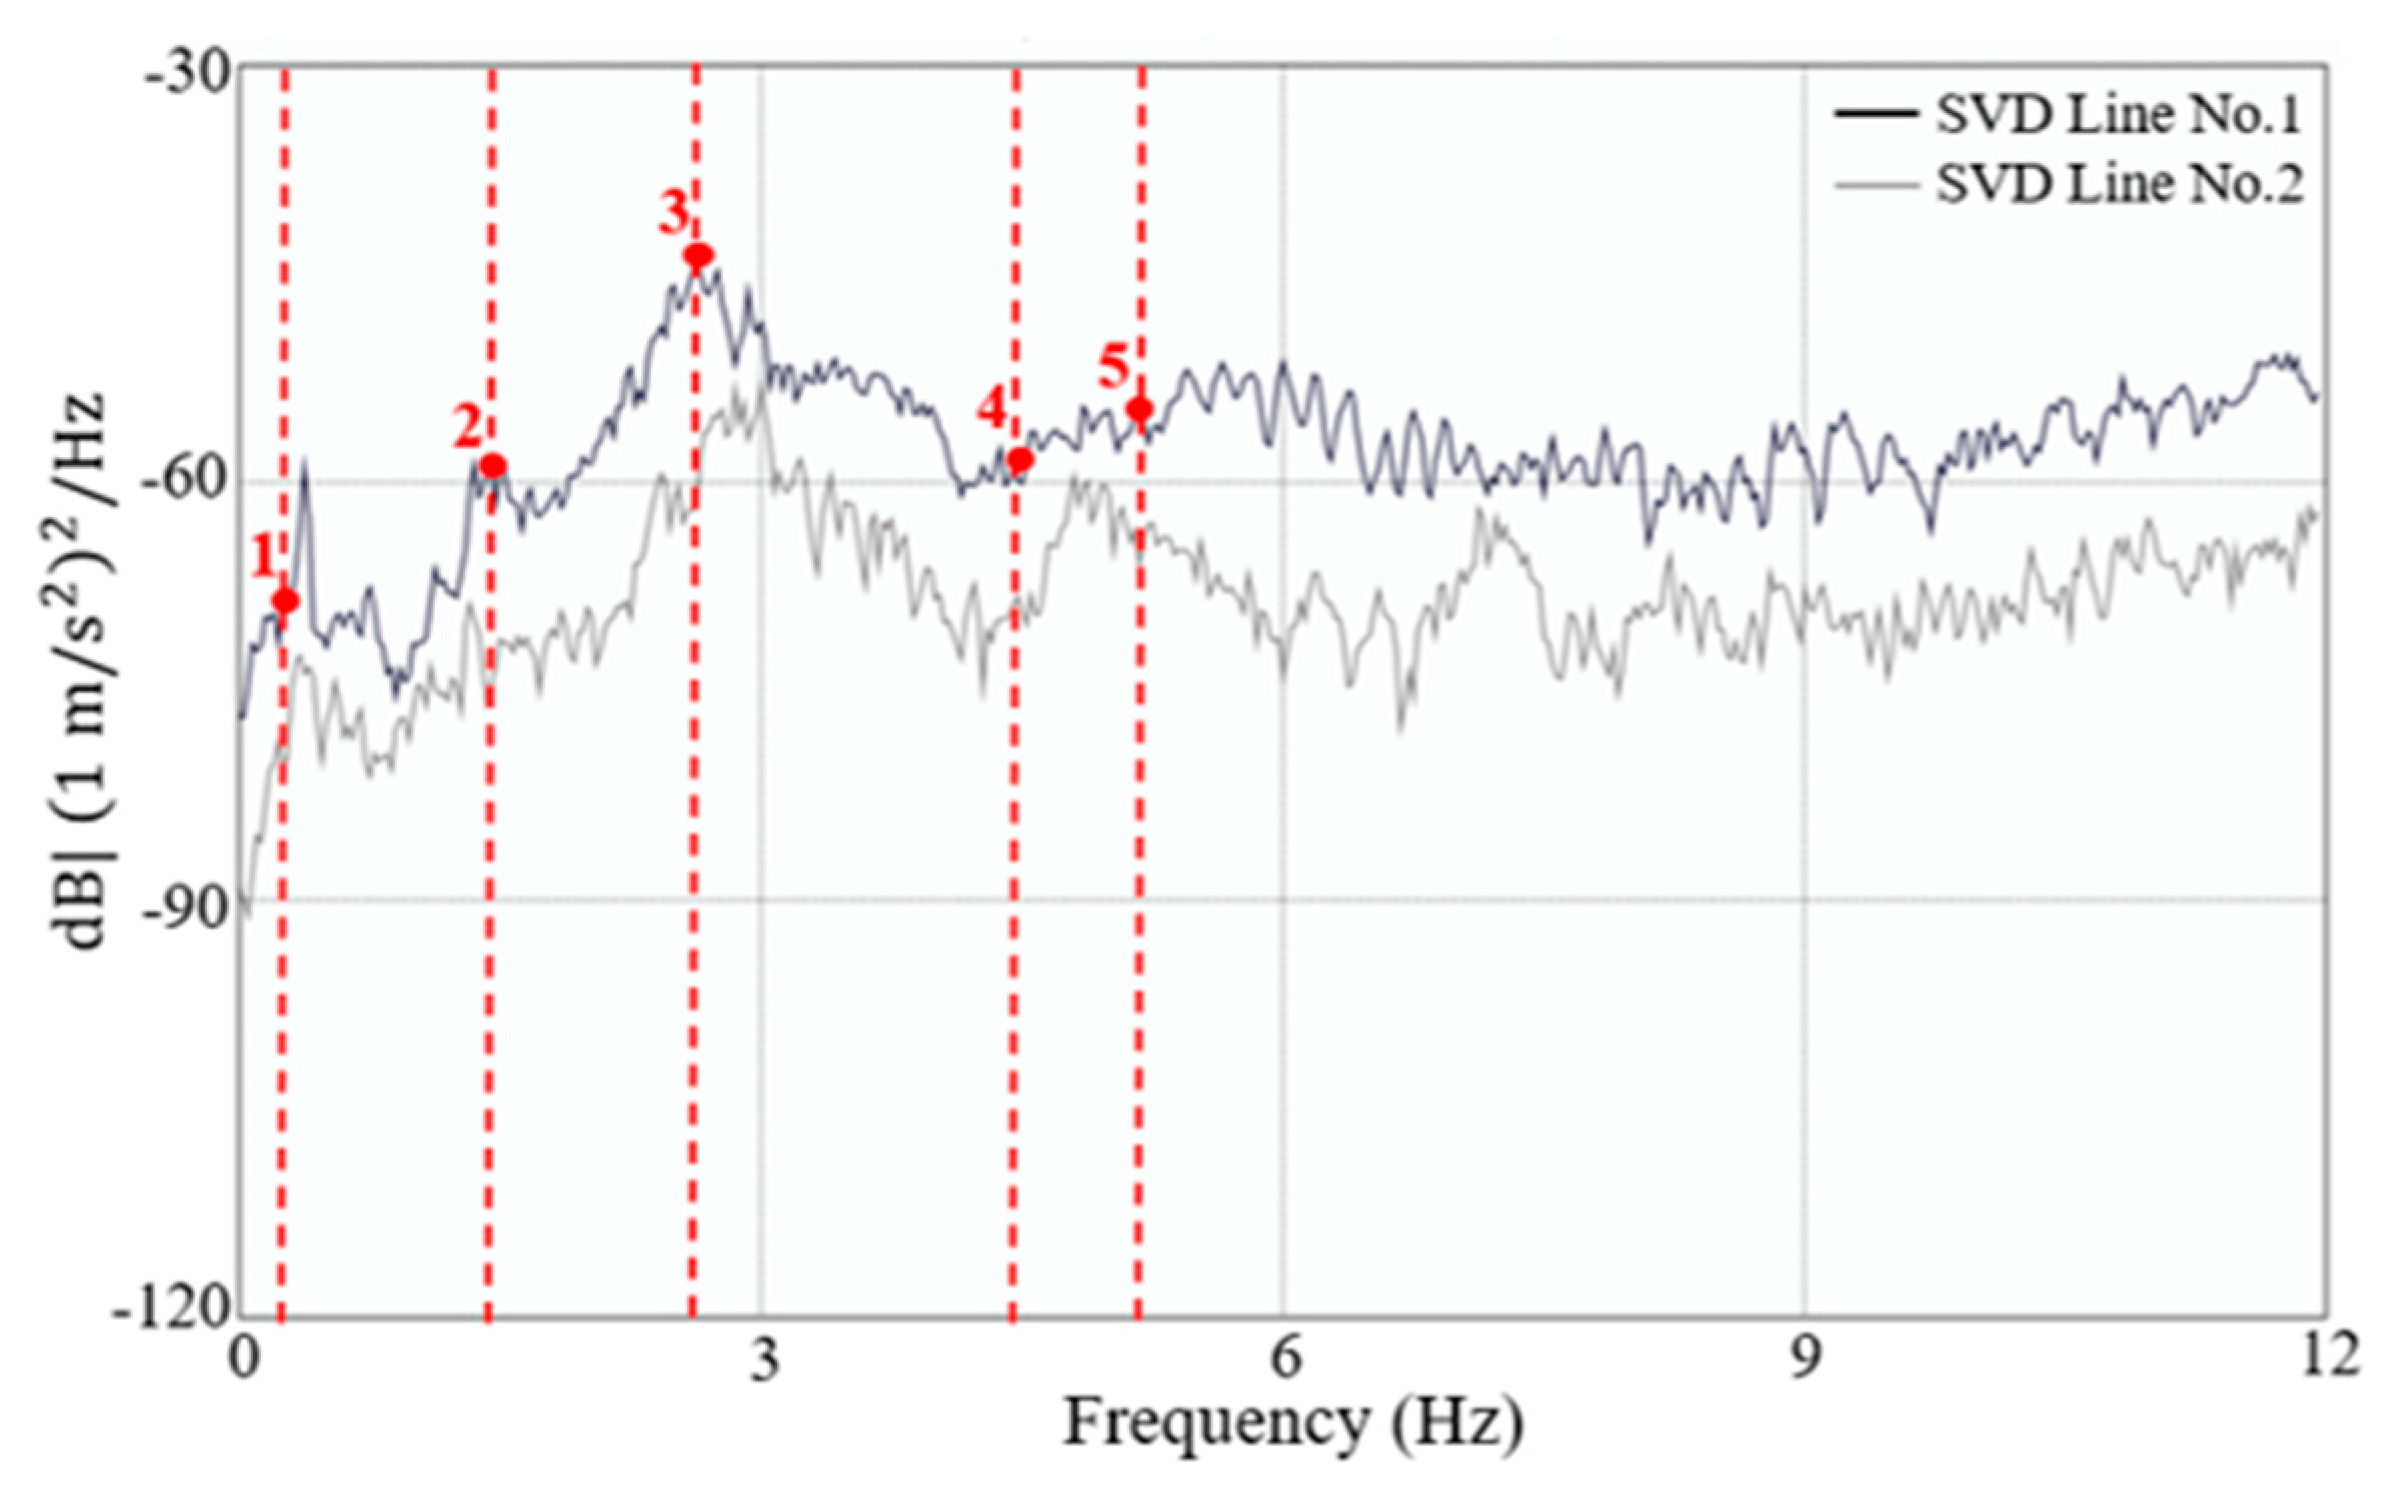
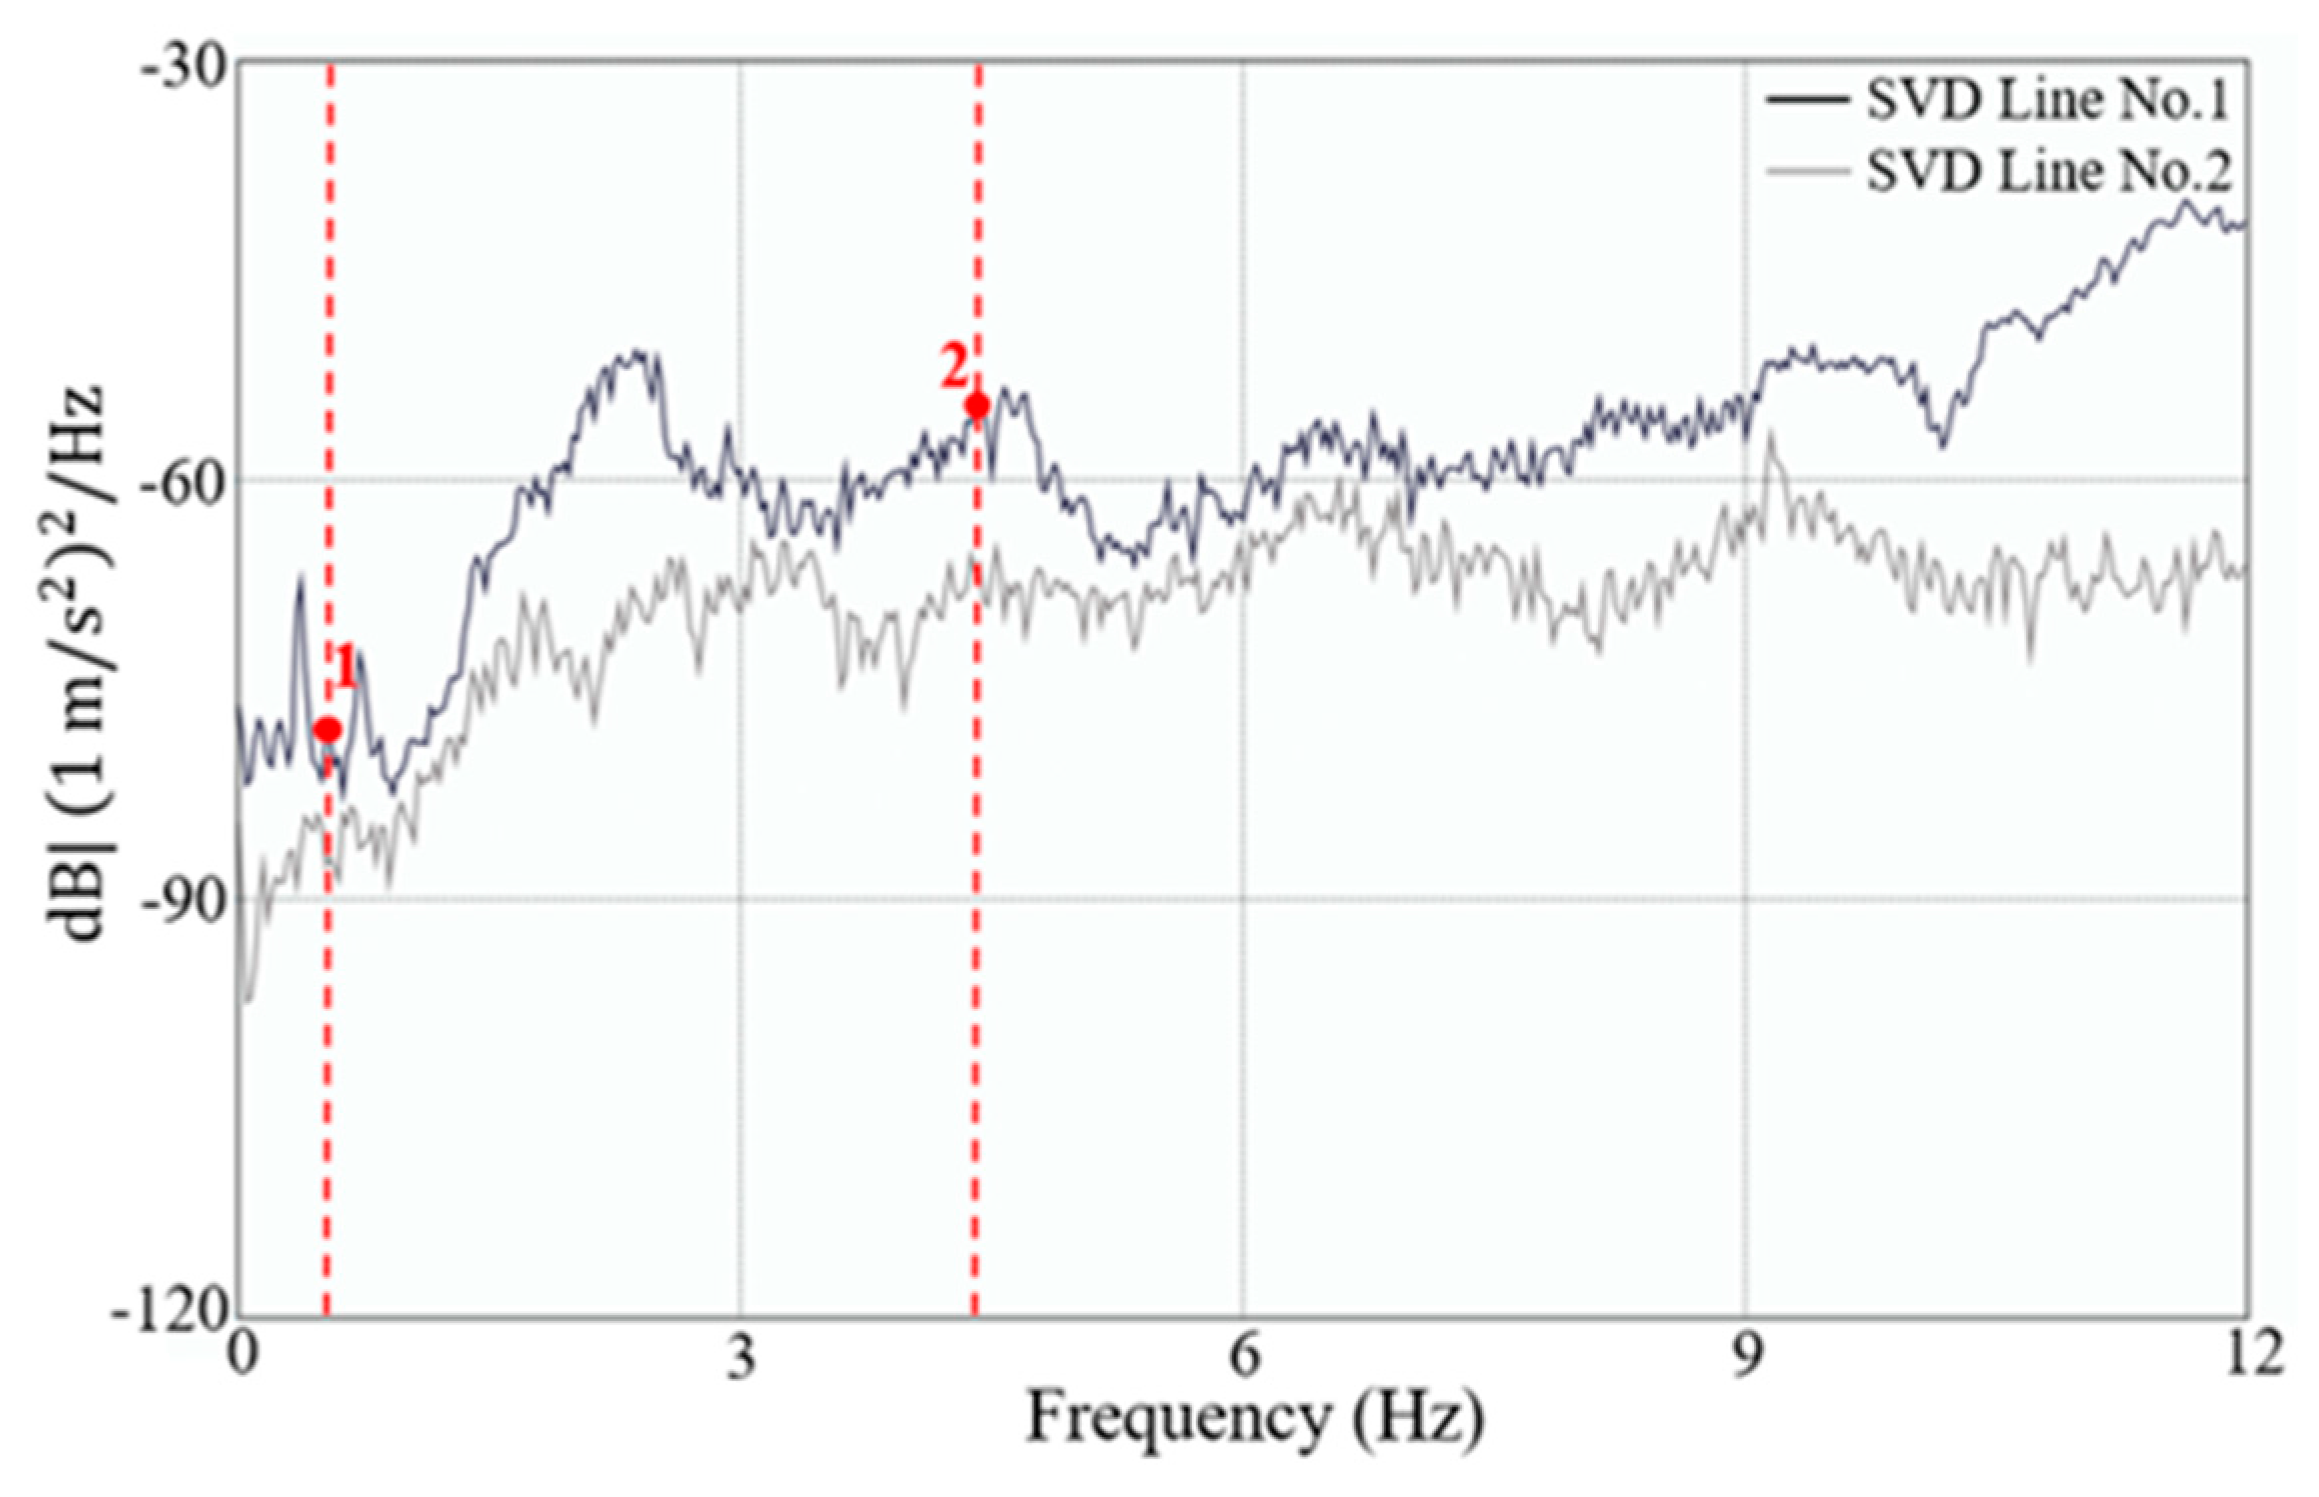
The modal identification was also performed using the EFDD method available in the ARTeMIS® software [56]. Once the inter-subject variability did not notice any significant alteration in transmissibility analysis, the EFDD method was performed only for subject S1. The natural frequencies estimated from the EFDD method and transmissibility functions are equal once the latter is the base for identifying the natural modes. Figure 8 shows the first two curves of the average normalised singular values of the spectral density matrices of subject S1 considering the comfort seat test. In this figure, it is possible to observe the peaks corresponding to the identified frequencies and mode shapes.
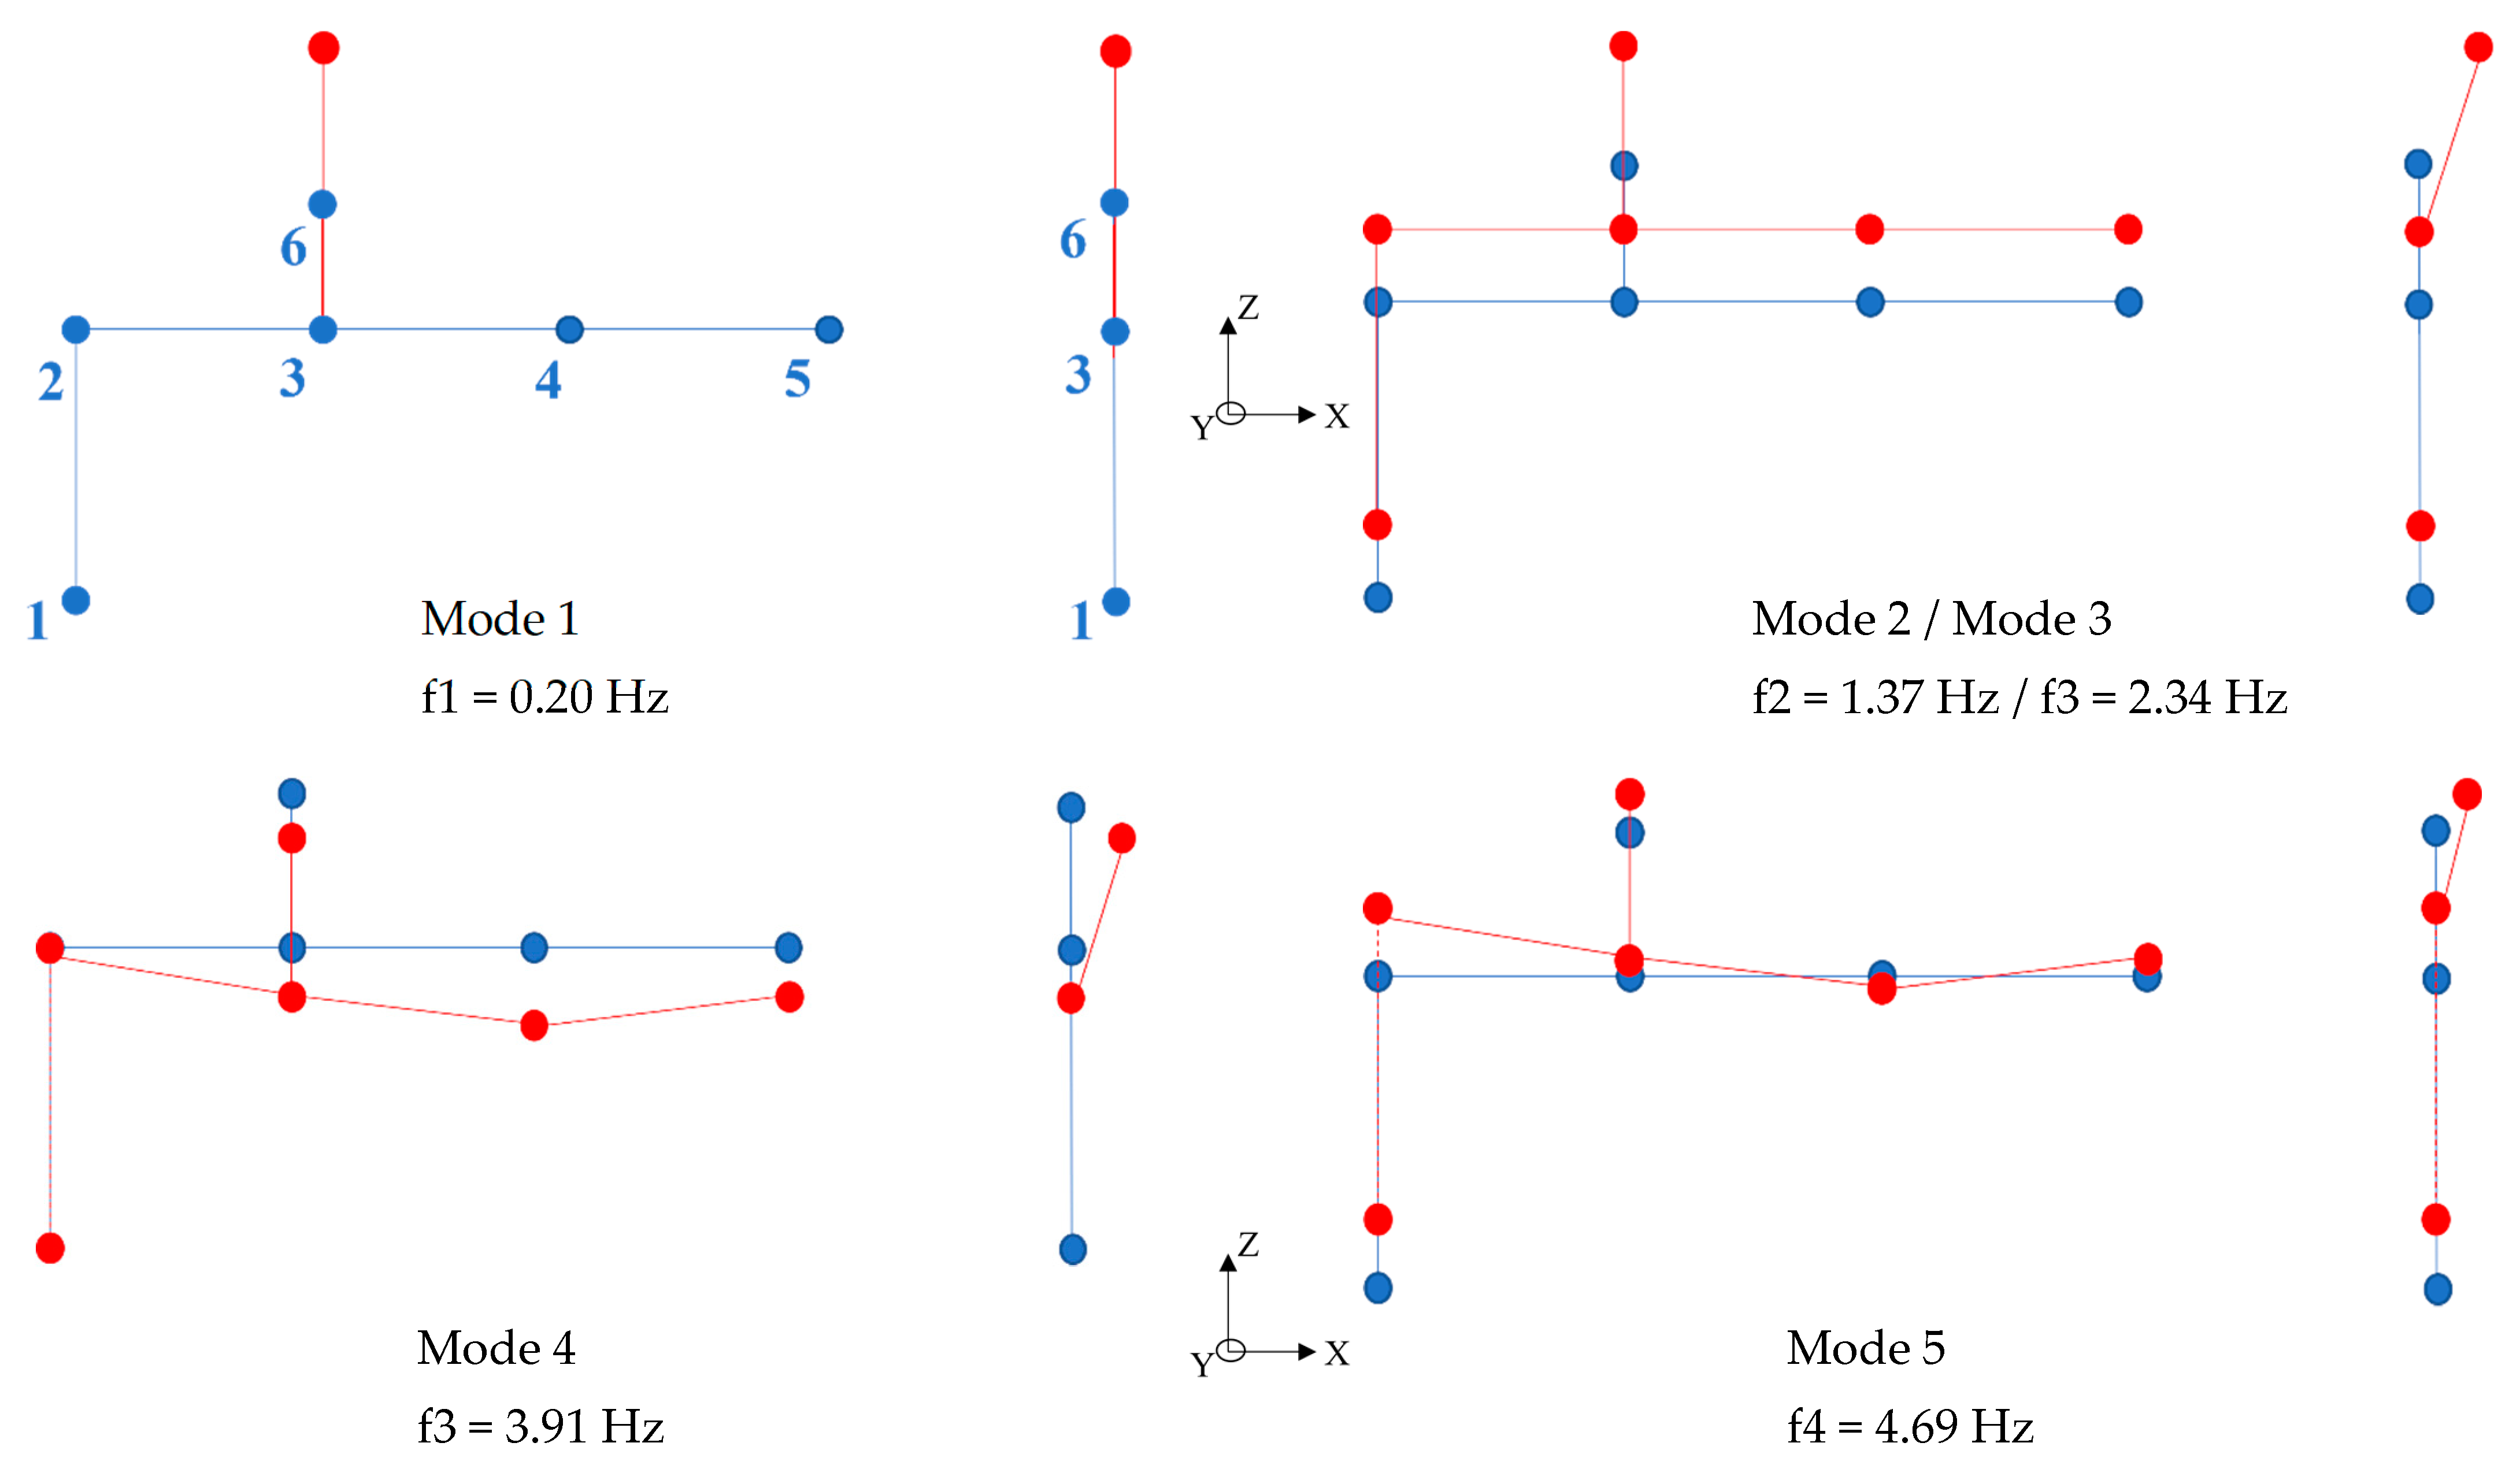
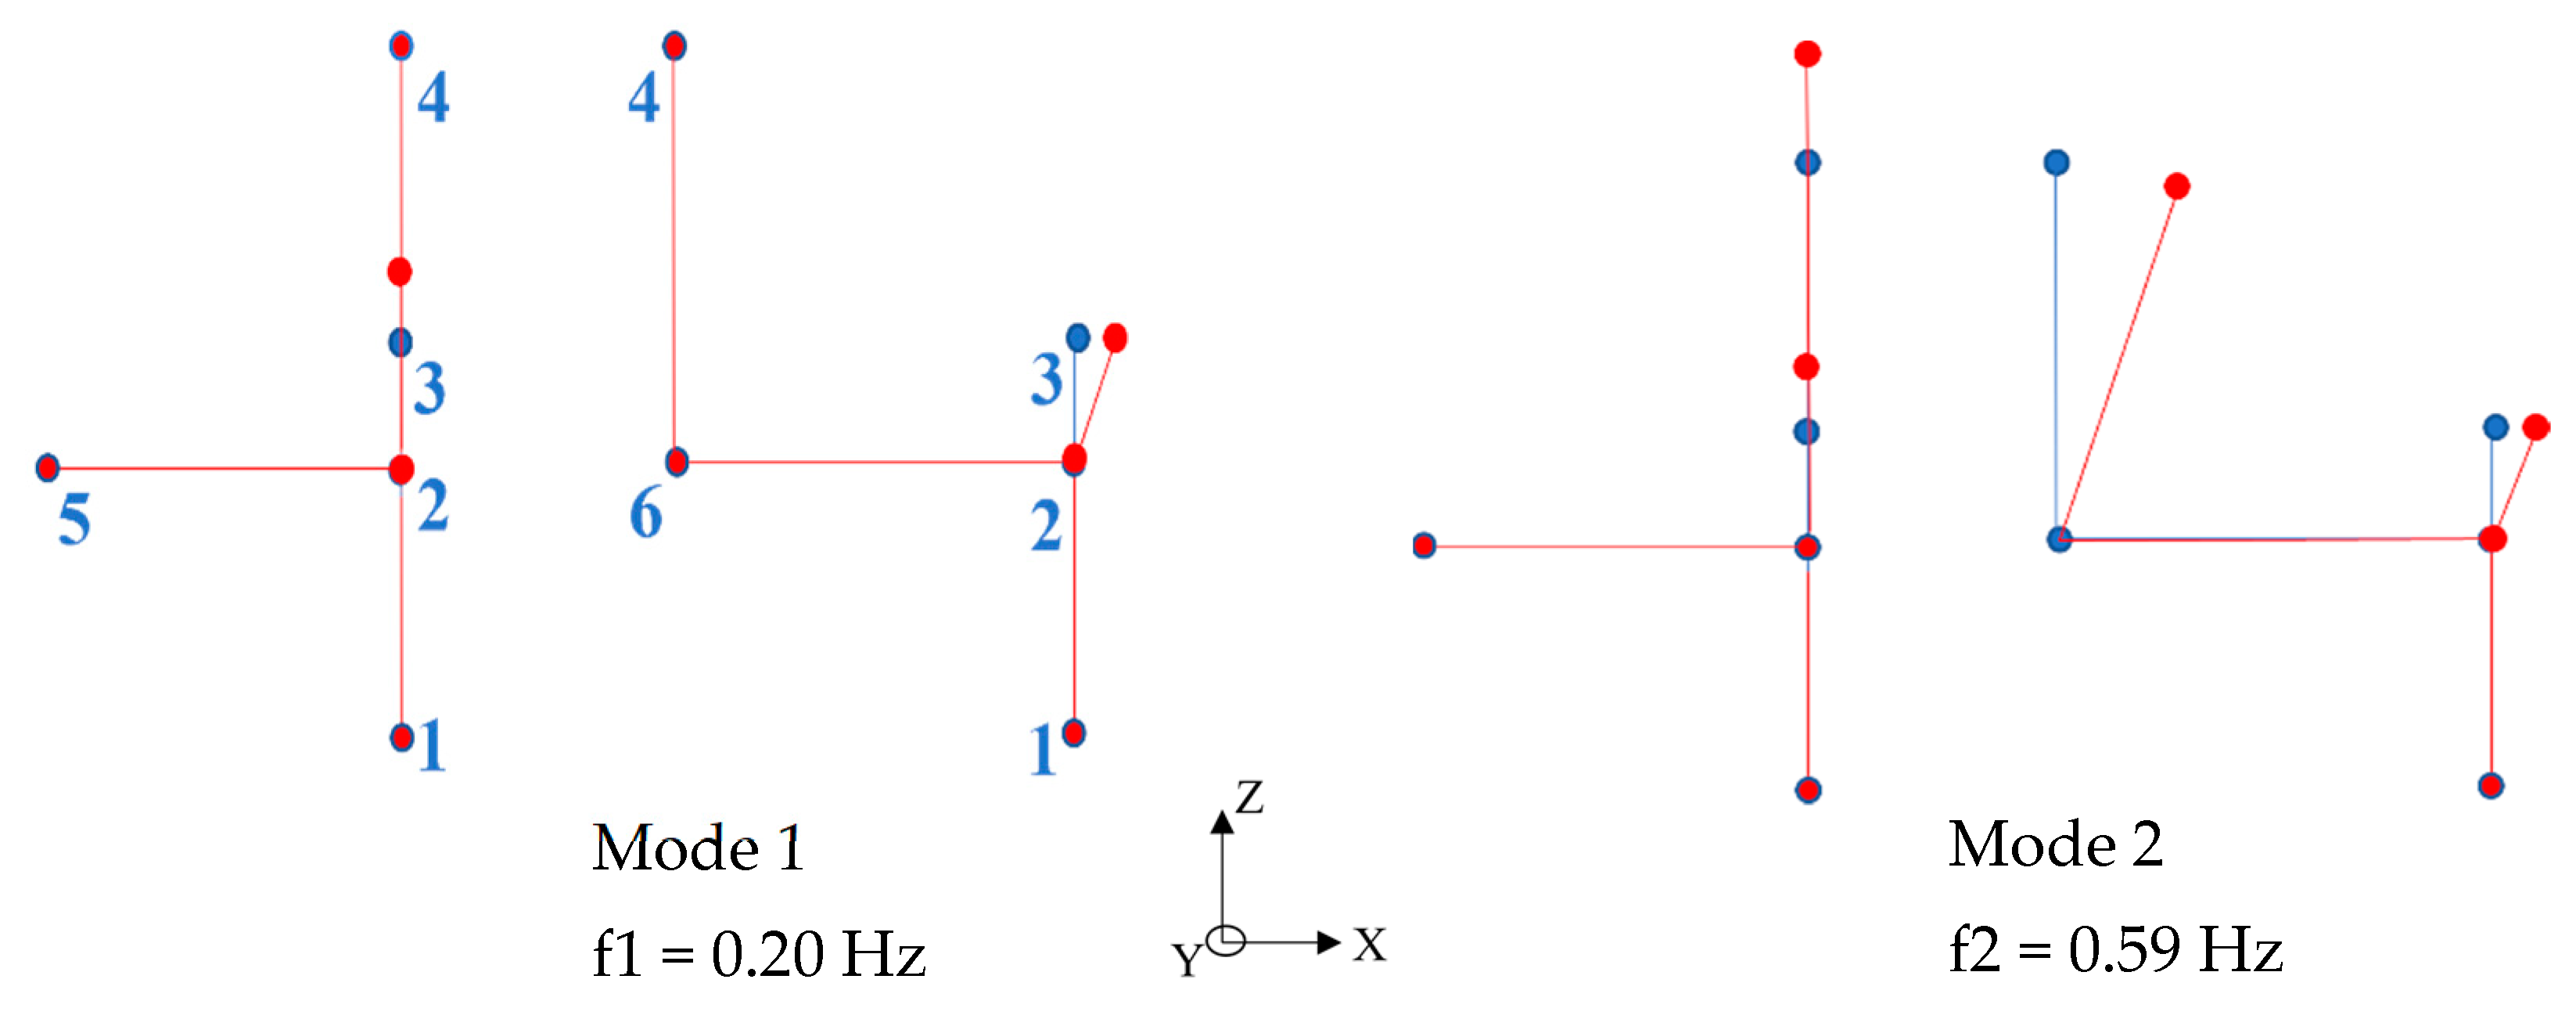
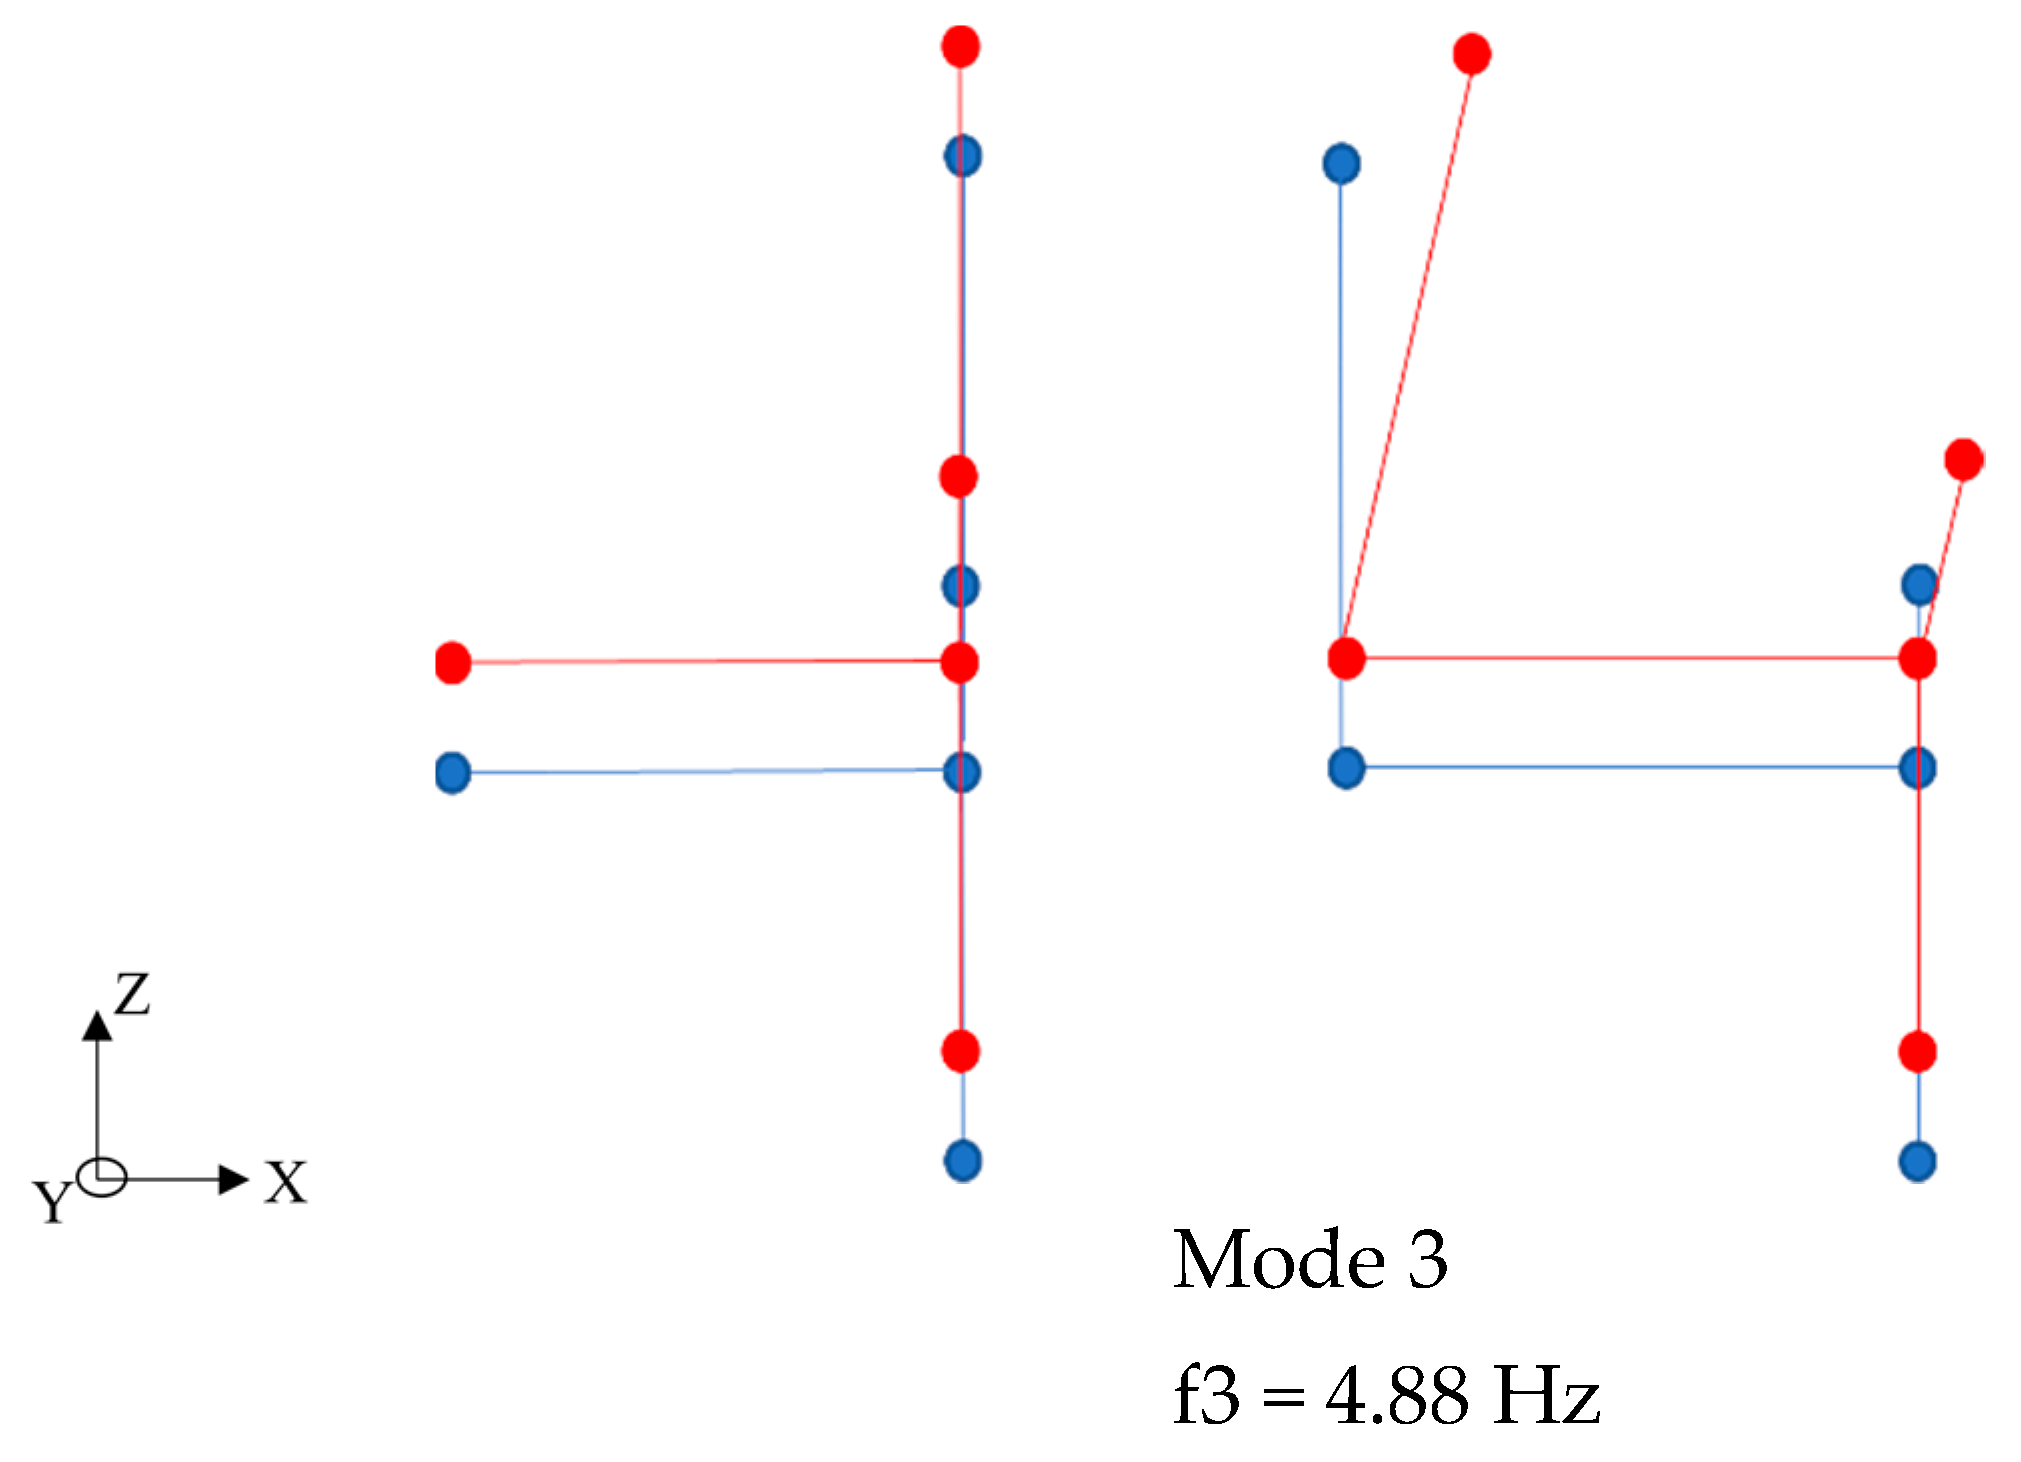
The seat modal parameters, namely the natural frequencies and modal configurations, are depicted in Figure 9, where f represents the average value of each natural frequency. The figure represents each modal configuration by the front and lateral views. Moreover, the undeformed structure is represented in blue, while the deformed structure is red-coloured.
As expected, each vibration mode corresponds to a different seat movement. Mode 1 with a frequency equal to 0.20 Hz is related to the vertical foam local movements.
Mode 2, with a frequency of 1.37 Hz, is possibly associated with a global movement of the vehicle carbody, which induces a rigid body motion on the seat structure, with a slight foam movement in the vertical and longitudinal directions. This longitudinal component is associated with distorsional movements of the foam layer. Concerning the AP train natural frequencies, Ribeiro et al. [55], based on a forced vibration test of the carbody, estimated the frequency values of the three rigid body modes of the carbody, associated with rolling, bouncing, and pitching movements, ranging between 1.0 Hz and 1.6 Hz, which are in full compliance with Mode 2’s physical interpretation. It should be highlighted that the 0.59 Hz antiresonance frequency identified on the transmissibility curve matches the same movements as Mode 2.
Mode 3, with a frequency around 3 Hz, is associated with rigid body movements of the seat frame due to the flexibility provided by the connection elements between the seat and the carbody. This modal configuration has similar movements to the ones of Mode 2.
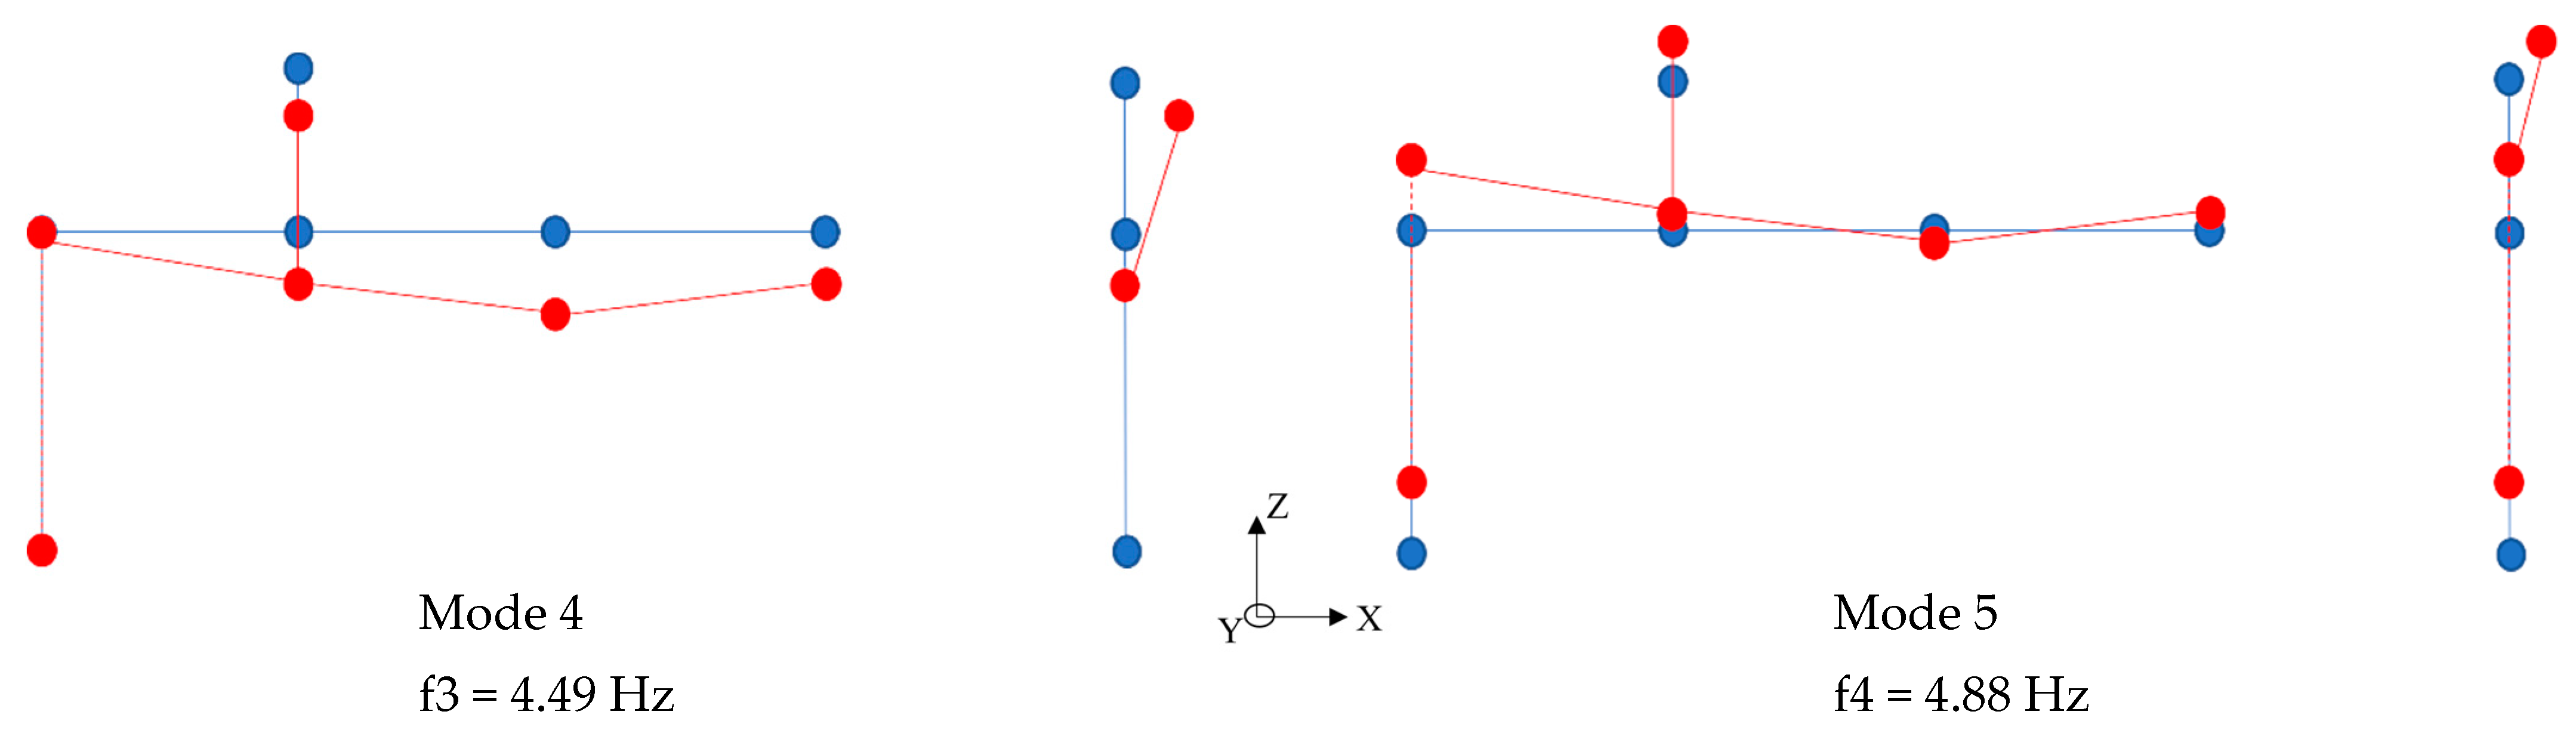
Mode 4 demonstrates a seat movement transition. Characterised by this antiresonance frequency, the seat frame presents a quite well-defined bending movement coupled with a torsion movement, as stated by the longitudinal movement of the seat foam. The bending of the seat frame is naturally mobilised by the externally induced vibration and the mass of the passenger (Figure 10). At this frequency value, the foam layer strictly follows the movement of the seat frame without any type of independent vibration, being comparable to the result obtained by Ribeiro [55], 4.23 Hz, conducted in the same environment but on a pre-renovation seat and with a simplified experimental setup. That was composed of an accelerometer placed on the floor and one tri-axial accelerometer on the seat surface. Therefore, the author obtained the transmissibility curves but could not perform the modal identification. The new foams and restricting covers justify the slight difference between results.
Mode 5, with a frequency equal to 4.88 Hz, is associated with a coupled mode involving structural movement of the carbody, as stated by the quite visible support vertical movement, structural movement of the seat frame, demonstrated by bending movement, and vertical foam movements.
In conclusion, resonance modes 1 and 5 are connected with the seat frame and foam natural frequencies and, therefore, amplified movements. Mode 2 and the antiresonance valley, Mode 4, are strictly connected with seat frame movements and the generation of those movements transitions.
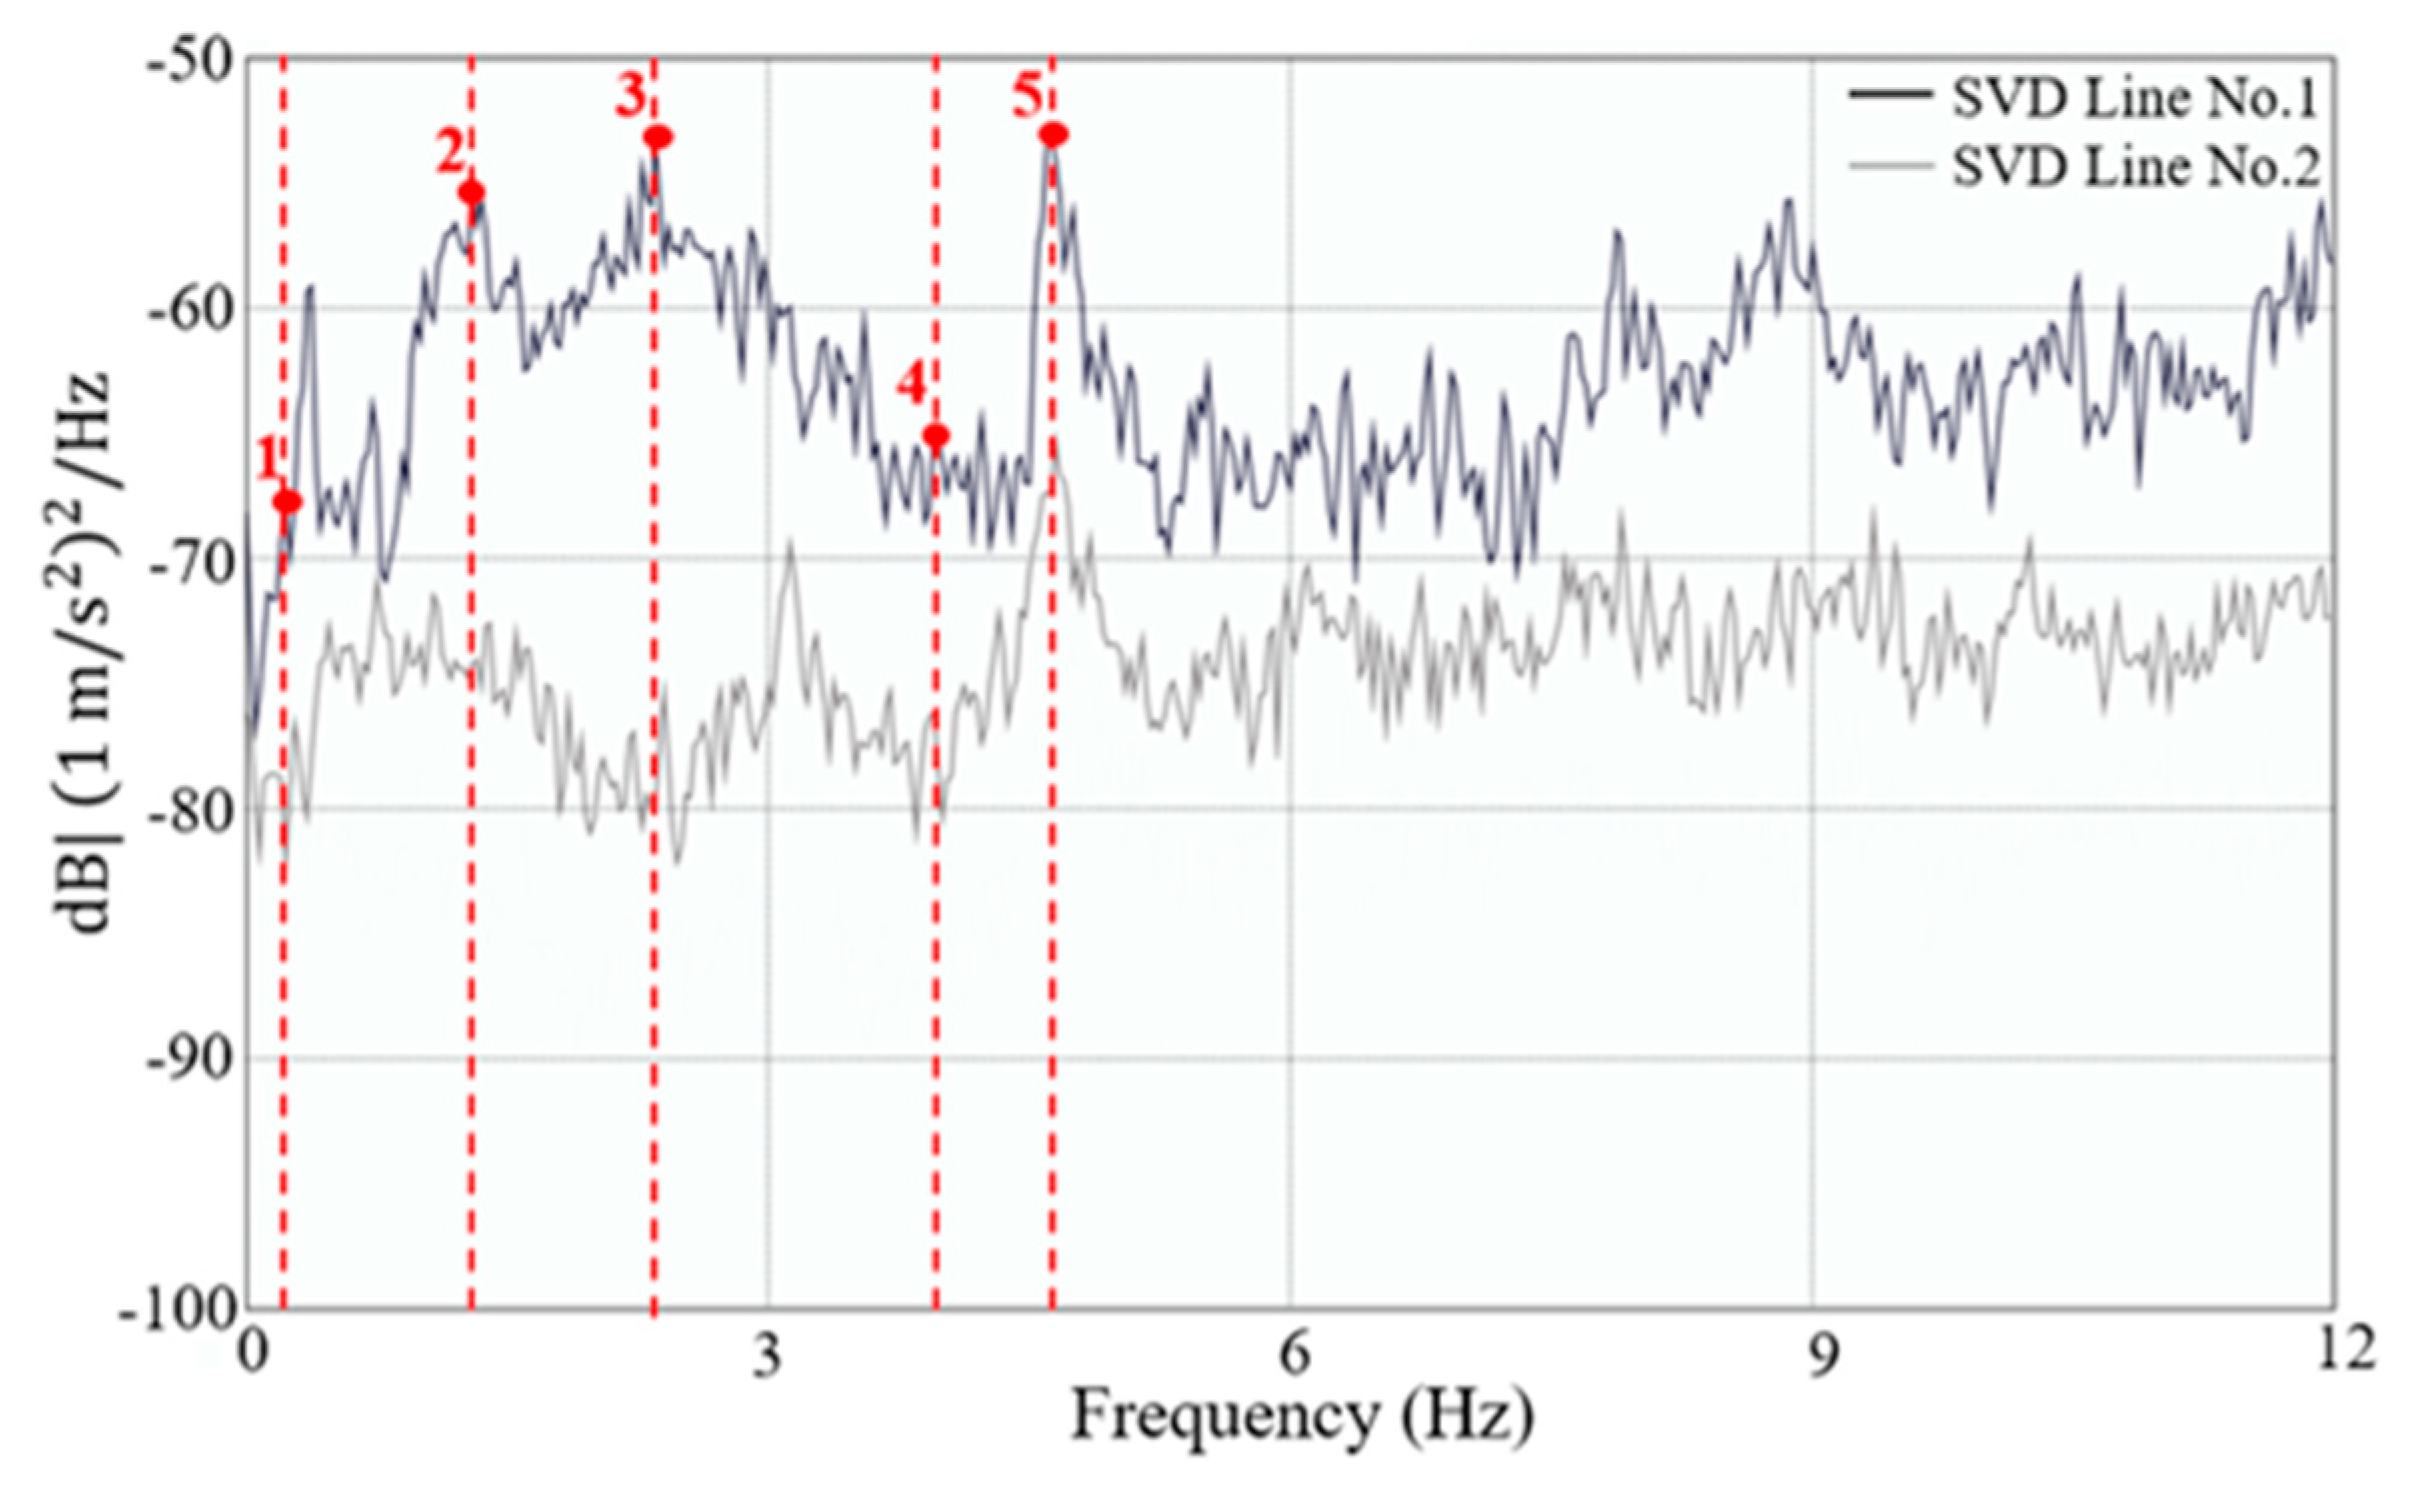
Figure 11 illustrates the first two curves of the average normalised singular values of the spectral density matrices of the S1 standard seat test, where it is possible to observe the peaks corresponding to the identified frequencies and mode shapes.
The seat movements derived from the vibration modes are demonstrated in Figure 12, where f represents the average value of the natural frequency.
As previously mentioned, standard and comfort seats differ mainly in terms of dimensions. Therefore, it was anticipated that both seats face a similar structural behaviour. Due to the foam thickness difference, a distinct foam vibration range absorption was expected, as observed on transmissibility curves.
To confirm the similar structural behaviour of both seats, mode pairing was conducted through the MAC parameter. Mode 2 presents an MAC value of 0.96, followed by Mode 1 (MAC equal to 0.93) and Mode 5 (0.86).
Indeed, the modal analysis demonstrated that standard and comfort seats present the same seat frame movements occurring at different frequencies. Mode 1 is the exception, as it occurs on the same frequency for both seats. Standard seat Mode 2 matches Mode 2 of the comfort seat. Modes 4 and 5, characterised by higher deformations, occur at slightly, but not significant, lower frequencies for the standard seat.
The standard seat foam demonstrates the capacity to absorb vibrations within the 1.37–3.91 Hz frequency range. This parameter represents the main difference regarding both seats, as the comfort foam presents a larger vibration range absorption (0.59–4.88 Hz).
4. Case Study: Intercity Train
The Intercity train service was introduced earlier than the AP in 1980 and was renovated in 2002. Figure 13 illustrates the Intercity train in its regular passenger service. This service is run by 5600 series locomotives with five hauled Corail coaches. Generally, coaches 1 and 2 are comfort classes, while the other cars are designed as standard classes.
Being from different classes, comfort and standard seats are distinct. In opposition to AP train seats, the Intercity seats differ in terms of dimensions and structural frame. While the comfort seat is a single seat (like those used in laboratory experiments), the standard seat is a classical double seat (Figure 14). The figure demonstrates the seat location within the train. As on the AP experimental setup, both seats were positioned in the same location inside vehicles 1 and 5, respectively, for comfort and standard classes, particularly near the rear bogies.
Regarding the dimensions, the comfort seat has a foam thickness of 80 mm, and equal to the seatback. For the standard class, the thickness is 60 mm for both seat surface and seatback. Although presenting different foam dimensions, both seats share the fabric cover type. This way, the foam is placed freely on top of the seat’s metallic support structure without any movement restriction. This represents a more similar configuration with the laboratory experiments setup in comparison to the one of AP train.
Regarding the structural frame, the comfort seat is composed of a vertical column connected on its base to the floor. The standard seat comprises two circular transversal girders connected at both extremities and linked with two vertical columns located at the centre of each seat. Figure 15 illustrates the metallic seat frame concerning both seat types.
4.1. Dynamic Tests
The experimental tests were accomplished in the CP-maintenance facilities with the same subjects, accelerometers, seat location, and vibration conditions as the AP experiments. One seat of each class was instrumented on the seat surface and support frame. Due to the metallic frame differences, a different experimental setup was designed for each seating class. Regarding the comfort seat, acceleration measurements took place at the floor connection (Figure 16b, left), beneath the seat surface, at the seat surface (Figure 16a represents this configuration with/without subject), and at the seatback (Figure 16b, right). For the standard seat, accelerometers were placed at the floor connection (Z-axis), beneath both seat surfaces (Z-axis), at the seat surface (Z and X-axes), and the seatback (Z and X-axes). The experiments were performed with a train interior temperature of approximately 20 °C.
4.2. Results
4.2.1. Transmissibility Curves
Figure 17 shows the transmissibility curves of the three subjects within the two seats. It is possible to observe the resonance (red marks) and antiresonance peaks (blue marks).
Table 3 presents the resonance and antiresonance peaks regarding both seats. Due to the seat specification, namely seat design and foam restrictions, Intercity’s seat transmissibility is expected to differ from those of AP train seats.
Comfort seat transmissibilities are characterised by resonance frequencies between 0.20–0.59 Hz and 4.30–4.69 Hz. As on AP train seats, the higher transmissibility peaks occur at low frequencies, namely 0.20 and 0.59 Hz, while the antiresonances are found between 1.37 and 1.95 Hz. Resonance and antiresonance frequencies are similar for all subjects, which agrees with the results of Toward and Griffin [32]. The comfort seat is similar to those used in laboratory experiments. Therefore, a vertical resonance transmissibility between 4 and 6 Hz is anticipated, which agrees with the results presented by several authors and reinforce the influence of the movement restriction introduced by the cover leather on the AP train seats [23,32,33,34].
Standard seat transmissibility results are comparable for all subjects as the comfort seat has resonances of 0.20, 0.78–1.56, and 4.88–5.27 Hz and antiresonances between 0.59–1.17 and 2.34–2.93 Hz. Higher transmissibility peaks are found for this seat compared to the comfort class. Those results match the AP seat observation and comply with the studies conducted by Patelli and Griffin [23] and Zhang et al. [35].
Due to the positioning of accelerometers on the seatback structure of the seats, it was possible to explore the seatback fore-and-aft/floor vertical transmissibility. This transmissibility, illustrated in Figure 18, may provide important information about the seatback’s local bending movements.
Prominent resonance equal to 0.59 Hz defines the seatback comfort seat, whereas those of the standard seat demonstrate main peaks of 0.98, 2.34, and 4.88 Hz. The modal identification is expected to prove the influence of seatback local bending movements regarding those frequencies.
4.2.2. EFDD Method
The EFDD method was applied using ARTeMIS® software [56]. Based on the assumption of AP seats, the modal analysis was conducted only for S1. Figure 19 shows the first two curves of the average normalised singular values of the spectral density matrices of the S1 comfort seat experiment, where it is possible to observe the peaks corresponding to the identified frequencies and mode shapes.
The seat movements derived from the vibration modes are represented in Figure 20, where f represents the average value of the natural frequency.
As estimated, each mode corresponds to a different seat movement. Frequencies lower than 0.59 Hz are characterised by vertical and longitudinal foam movements and seatback local bending movements. This frequency matches the one identified as a prominent resonance on the fore-and-aft seatback transmissibility curve. This factor validates the applied methodology and the experimental setup and reveals a strong connection between the transmissibility curve and the modal identification. Mode 1 is deeply connected with foam movements, which represents a dependency on the foam’s capacity to absorb vibration.
Mode 2 is associated with a global movement of the vehicle carbody. This induces a rigid body movement on the seat frame, coupled with foam distortions in the vertical and longitudinal directions and seatback local bending.
Concerning the standard seat experiment, Figure 21 illustrates the first two curves of the average normalised singular values of the spectral density matrices, where it is possible to observe the peaks corresponding to the identified frequencies and mode shapes.
Figure 22 illustrates the seat movements derived from the vibration modes, where f represents the average value of the natural frequency.
Mode 1 is characterised by the foam’s incapacity to absorb low-frequency vibrations (<0.20 Hz), while Mode 2 combines that foam incapacity with seatback local bending movements. Mode 3 demonstrates rigid body movements induced by the carbody, associated with seatback local bending movements and foam vertical and longitudinal motion. As on the other analysed seats, the last mode is defined by a combination of the remaining modes.
The fore-and-aft seatback transmissibility results show resonance peaks within the modes presenting seatback local bending movements, complying with comfort seat observations. Modes 1 and 2 are related with vibration transmission associated with vertical and longitudinal foam movements, so these can be designated as local transmissibility. Mode 3 relies on structural and foam movements; thus, it can be classified as global and local transmissibility.
5. Conclusions
This study performed a dynamic experimental analysis of typical rail seats under a real train in situ environment. This analysis included the modal identification of the seat based on output-only methodologies, namely the transmissibility functions and the EFDD method. The study included the development of dedicated experimental setups that were applied on real train seats, namely the comfort and standard seats of Alfa Pendular and Intercity trains. Being employed in a real train environment, the experiments can realistically consider all aspects of the seat dynamics, particularly the effect of the flexibility of the seat surfaces and carbody components.
Based on the results of the dynamic testing, it was possible to draw conclusions about the influence of the seat structural movements and dependence on the foam vibration absorption capacity. Regarding AP train seats, the inter-subject variability did not affect transmissibility resonances and antiresonances. Moreover, the standard seat presented higher transmissibility peaks than the comfort seat. Compared with laboratory experiments, AP seats presented lower transmissibility resonance peaks, which reveals the influence of the seat structural frame and foam leather cover. These factors significantly modify the vibration transmission; particularly, the cover restricts the foam cellular morphology movements, leading to variations in foam absorption capacity, while the seat frame movements may couple with movements of the carbody components. Modal identification depicted seat bending movements and vertical foam movements. By matching transmissibility and modal identification, it was possible to associate the resonance frequencies with seat and foam natural frequencies and the corresponding amplified movements. In contrast, the antiresonance valleys generated those movement changes on the structural support.
The Intercity train’s comfort seat is similar to that used in laboratory experiments. The foam is freely placed on top of the seat surface, covered by a non-restricting leather fabric. Its results are close to those of laboratory conditions. The Intercity seats experimental setup allows for concluding about the influence of the seatback local bending movements on the transmissibility response. Seatback transmissibility resonances matched the local bending movement frequencies identified by modal identification. This way, the applied methodology was validated based on the strong correlation between the transmissibility curve and the EFDD method.
The present work demonstrated the influence of seat structural frame movements and foam vibration absorption on user–seat vibration transmissibility. Moreover, to the authors’ knowledge, this is a pioneer study regarding train seat modal identification, which may be used for further studies concerning seat vibration reduction to increase passengers’ comfort.
Author Contributions
Conceptualization, P.S. and D.R.; methodology, P.S. and D.R.; software, P.S. and D.R.; validation, P.S., D.R., J.M. and E.S.; formal analysis, P.S. and D.R.; investigation, P.S.; resources, P.S. and D.R.; data curation, P.S.; writing—original draft preparation, P.S.; writing—review and editing, D.R., J.M. and E.S.; visualization, P.S.; supervision, D.R. and J.M.; project administration, D.R., J.M. and E.S.; funding acquisition, P.S., D.R., J.M. and E.S. All authors have read and agreed to the published version of the manuscript.
Funding
This research was funded by Fundação para a Ciência e Tecnologia grant number PD/BD/143161/2019. The authors also acknowledge the financial support from the Base Funding-UIDB/04708/2020 and Programmatic Funding-UIDP/04708/2020 of the CONSTRUCT—Instituto de Estruturas e Construções, funded by national funds through the FCT/MCTES (PIDDAC).
Institutional Review Board Statement
The study was conducted in accordance with the Declaration of Helsinki, and approved by the Institutional Ethics Committee of University of Minho (CEICSH 062/2022 and 02/08/2022).
Informed Consent Statement
Informed consent was obtained from all subjects involved in the study.
Data Availability Statement
Data is unavailable due to privacy restrictions.
Acknowledgments
This work is a result of project “FERROVIA 4.0”, with reference POCI-01-0247-FEDER- 046111, co-funded by the European Regional Development Fund (ERDF), through the Operational Programme for Competitiveness and Internationalization (COMPETE 2020) and the Lisbon Regional Operational Programme (LISBOA 2020), under the PORTUGAL 2020 Partnership Agreement. The first author thanks Fundação para a Ciência e Tecnologia (FCT) for a PhD scholarship under the project iRail (PD/BD/143161/2019). The authors would like to acknowledge the support of the projects FCT LAETA–UIDB/50022/2020, and UIDB/04077/2020. Finally, the authors express their gratitude to Nuno Pinto, from the LESE-FEUP laboratory, for his great assistance during the preparation of the experimental tests.
Conflicts of Interest
The authors declare no conflict of interest.
References
- Consulting, M. Tractebel Engineering. In European High Speed Rail—An Easy Way to Connect; Tractebel Engineering: Brussels, Belgium, 2009; pp. 1–213. [Google Scholar]
- Román, C.; Espino, R.; Martín, J.C. Competition of high-speed train with air transport: The case of Madrid-Barcelona. J. Air Transp. Manag. 2007, 13, 277–284. [Google Scholar] [CrossRef]
- European Federation for Transport and Environment. Air2Rail Reducing CO2 from Intra-European Aviation by a Modal Shift from Air to Rail. Delft. 2020. Available online: https://www.transportenvironment.org/wp-content/uploads/2021/07/2020_03_Air2Rail_Koios_strategy_rev.pdf (accessed on 12 December 2022).
- Eurostat Statistics Explained. Railway Passenger Transport Statistics—Quarterly and Annual Data; Eurostat Statistics Explained: Luxembourg, 2021. [Google Scholar]
- Office of Rail and Road. Passenger Rail Usage 2020–2021 Quarter 3; Office of Rail and Road: London, UK, 2021.
- Kim, Y.G.; Kwon, H.B.; Kim, S.W.; Park, C.K.; Park, T.W. Correlation of ride comfort evaluation methods for railway vehicles. Proc. Inst. Mech. Eng. Part F J. Rail Rapid Transit 2002, 217, 73–88. [Google Scholar] [CrossRef]
- Jiang, Y.; Chen, B.K.; Thompson, C. A comparison study of ride comfort indices between Sperling’s method and EN 12299. Int. J. Rail Transp. 2019, 7, 1–18. [Google Scholar] [CrossRef]
- EN 12299; Railway Applications—Ride Comfort for Passengers—Measurement and Evaluation. European Committee for Standardization: Brussels, Belgium, 2009.
- Wibowo, R.K.K.; Soekarno, S.; Puspitasari, I. Analysis of Train Passenger Seat Using Ergonomic Function Deployment Method. Int. J. Transp. Veh. Eng. 2017, 11, 1747–1751. [Google Scholar] [CrossRef]
- Bosso, N.; Gugliotta, A.; Zampieri, N. Design and simulation of a railway vehicle for the transport of people with reduced mobility. Shock. Vib. 2018, 2018, 9207639. [Google Scholar] [CrossRef]
- Hostens, I. Analysis of Seating during Low Frequency Vibration Exposure. Ph.D. Thesis, Katholieke Universiteit Leuven, Leuven, Belgium, 2004. [Google Scholar]
- Park, S.J.; Subramaniyam, M. Evaluating Methods of Vibration Exposure and Ride Comfort in Car. J. Ergon. Soc. Korea 2013, 32, 381–387. [Google Scholar] [CrossRef]
- Ebe, K.; Griffing, M. Factors affecting seat cushion comfort. Ergonomics 2001, 44, 901–921. [Google Scholar] [CrossRef]
- Montenegro, P.A.; Ribeiro, D.; Ortega, M.; Millanes, F.; Goicolea, J.M.; Zhai, W.; Calçada, R. Impact of the train-track-bridge system characteristics in the runnability of high-speed trains against crosswinds—Part II: Riding comfort. J. Wind. Eng. Ind. Aerodyn. 2022, 224, 104987. [Google Scholar] [CrossRef]
- UIC 513 (E). Guidelines for Evaluating Passenger Comfort in Relation to Vibration in Railway Vehicles; International Union of Railways (UIC): Paris, France, 1994. [Google Scholar]
- ISO 2631; Mechanical Vibration and Shock—Evaluation of Human Exposure to Whole-Body Vibration. International Standard Organization: Geneva, Switzerland, 2001.
- Schust, M.; Blüthner, R.; Seidel, H. Examination of perceptions (intensity, seat comfort, effort) and reaction times (brake and accelerator) during low-frequency vibration in x- or y-direction and biaxial (xy-) vibration of driver seats with activated and deactivated suspension. J. Sound Vib. 2006, 298, 606–626. [Google Scholar] [CrossRef]
- Hong, K.-T.; Hwang, S.-H.; Hong, K.-S. Automotive Ride-Comfort Improvement with an Air Cushion Seat. In Proceedings of the SICE Annual Conference in Fukui, Fukui, Japan, 4–6 August 2003; Fukui University: Fukui, Japan, 2003. [Google Scholar]
- Bonin, G.; Cantisani, G.; Loprencipe, G.; Sbrolli, M. Ride quality evaluation: 8 D.O.F. vehicle model calibration. In Proceedings of the 4th International SIIV Congress, Palermo, Italy, 12–14 September 2007. [Google Scholar]
- van Niekerk, J.L.; Pielemeier, W.J.; Greenberg, J.A. The use of seat effective amplitude transmissibility (SEAT) values to predict dynamic seat comfort. J. Sound Vib. 2003, 260, 867–888. [Google Scholar] [CrossRef]
- Maier, J.; Zierke, O.; Hoermann, H.J.; Goerke, P. Effects of personal control for thermal comfort in long-distance trains. Energy Build. 2021, 247, 111125. [Google Scholar] [CrossRef]
- Năstac, S.; Picu, M. Evaluating Methods of Whole-Body-Vibration Exposure in Trains. In The Annals of “Dunarea de Jos”; University of Galați: Galați, Romania, 2010. [Google Scholar]
- Patelli, G.; Griffin, M.J. Effects of seating on the discomfort caused by mechanical shocks: Measurement and prediction of SEAT values. Appl. Ergon. 2019, 74, 134–144. [Google Scholar] [CrossRef] [PubMed]
- Harris, C.; Piersol, A. Harris’ Shock and Vibration Handbook; McGraw-Hill: New York, NY, USA, 2002. [Google Scholar]
- Chaffin, D.; Anderson, G.; Martin, B. Occupational Biomechanics; John Wiley & Sons: New York, NY, USA, 1999. [Google Scholar]
- Bruel & Kjaer. Primer: Human Vibration, Booklet; K. Larsen & Son: Naerum, Denmark, 1989. [Google Scholar]
- Griffin, M.J. Handbook of Human Vibration; Academic Press: London, UK, 1990. [Google Scholar] [CrossRef]
- Tufano, S.; Griffin, M. Nonlinearity in the vertical transmissibility of seating: The role of the human body apparent mass and seat dynamic stiffness. Veh. Syst. Dyn. 2013, 51, 122–138. [Google Scholar] [CrossRef]
- White, S.W.; Kim, S.K.; Bajaj, A.K.; Davies, P.; Showers, D.K.; Liedtke, P.E. Experimental techniques and identification of nonlinear and viscoelastic properties of flexible polyurethane foam. Nonlinear. Dyn. 2000, 22, 281–313. [Google Scholar] [CrossRef]
- Wei, L.; Griffin, M. The prediction of seat transmissibility from measures of seat impedance. J. Sound Vib. 1998, 214, 121–137. [Google Scholar] [CrossRef]
- Varterasian, J.; Thompson, R. The dynamic characteristics of automobile seats with human occupants. Soc. Automot. Eng. SAE 1977, 1173–1182. [Google Scholar] [CrossRef]
- Toward, M.G.R.; Griffin, M.J. The transmission of vertical vibration through seats: Influence of the characteristics of the human body. J. Sound Vib. 2011, 330, 6526–6543. [Google Scholar] [CrossRef]
- Gong, W.; Griffin, M.J. Measuring, evaluating and assessing the transmission of vibration through the seats of railway vehicles. Proc. Inst. Mech. Eng. Part F J. Rail Rapid Transit 2018, 232, 384–395. [Google Scholar] [CrossRef]
- Basri, B.; Griffin, M.J. The application of SEAT values for predicting how compliant seats with backrests influence vibration discomfort. Appl. Ergon. 2014, 45, 1461–1474. [Google Scholar] [CrossRef] [Green Version]
- Zhang, X.; Qiu, Y.; Griffin, M. Transmission of vertical vibration through a seat: Effect of thickness of foam cushions at the seat pan and the backrest. Int. J. Ind. Ergon. 2015, 48, 36–45. [Google Scholar] [CrossRef]
- Gharehbaghi, V.R.; Noroozinejad Farsangi, E.; Noori, M.; Yang, T.Y.; Li, S.; Nguyen, A.; Málaga-Chuquitaype, C.; Gardoni, P.; Mirjalili, S. A Critical Review on Structural Health Monitoring: Definitions, Methods, and Perspectives. Arch. Comput. Methods Eng. 2022, 29, 2209–2235. [Google Scholar] [CrossRef]
- Ghannadi, P.; Kourehli, S.S.; Mirjalili, S. The application of PSO in structural damage detection: An analysis of the previously released publications (2005–2020). Frat. Integrità Strutt. 2022, 16, 460–489. [Google Scholar] [CrossRef]
- Yang, Y.; Zhang, Y.; Tan, X. Review on vibration-based structural health monitoring techniques and technical codes. Symmetry 2021, 13, 1998. [Google Scholar] [CrossRef]
- Dziedziech, K.; Staszewski, W.J.; Mendrok, K.; Basu, B. Wavelet-Based Transmissibility for Structural Damage Detection. Materials 2022, 15, 2722. [Google Scholar] [CrossRef]
- Kolich, M.; Essenmacher, S.; McEvoy, J. Automotive seating: The effect of foam physical properties on occupied vertical vibration transmissibility. J. Sound Vib. 2005, 281, 409–416. [Google Scholar] [CrossRef]
- Dong, R.; Welcome, D.; McDowell, T.; Wu, J. Theoretical relationship between vibration transmissibility and driving-point response functions of the human body. J. Sound Vib. 2013, 332, 6193–6202. [Google Scholar] [CrossRef]
- Pozharskiy, D.; Zhang, Y.; Williams, M.O.; McFarland, D.M.; Kevrekidis, P.G.; Vakakis, A.F.; Kevrekidis, I.G. Nonlinear resonances and antiresonances of a forced sonic vacuum. Phys. Rev. E 2015, 92, 063203. [Google Scholar] [CrossRef]
- Shi, Y.; Li, S. An inverse modification method for assigning antiresonant frequencies. Appl. Acoust. 2020, 170, 107524. [Google Scholar] [CrossRef]
- Brincker, R.; Zhang, L.; Andersen, P. Modal Identification from Ambient Responses using Frequency Domain Decomposition. In Proceedings of the 18th International Modal Analysis Conference (IMAC), San Antonio, TX, USA, 7–10 February 2000; pp. 625–630. [Google Scholar]
- Allemang, R.; Brown, D. A Correlation Coefficient for Modal Vector Analysis. In Proceedings of the 1st International Modal Analysis Conference (IMAC I), Orlando, FL, USA, 8–10 November 1982; pp. 110–116. [Google Scholar]
- Magalhães, F. Identificação Modal Estocástica Para Validação Experimental de Modelos Numéricos [Stochastic Modal Identification for Experimental Validation of Numerical Models]. Ph.D. Thesis, University of Porto, Porto, Portugal, 2004. (In Portuguese). [Google Scholar]
- Brincker, R.; Ventura, C.E.; Andersen, P. Damping estimation by frequency domain decomposition. In Proceedings of the International Modal Analysis Conference—IMAC 2001, Kissimmee, FL, USA, 5–8 February 2001; pp. 698–703. [Google Scholar]
- Allemang, R.J. The modal assurance criterion–twenty years of use and abuse. Sound Vib. 2003, 37, 14–23. [Google Scholar]
- Ghannadi, P.; Kourehli, S.S. Efficiency of the slime mold algorithm for damage detection of large-scale structures. Struct. Des. Tall Spec. Build. 2022, 31, e1967. [Google Scholar] [CrossRef]
- Pastor, M.; Binda, M.; Harčarik, T. Modal assurance criterion. Procedia Eng. 2012, 48, 543–548. [Google Scholar] [CrossRef]
- Ribeiro, D.; Calçada, R.; Brehm, M.; Zabel, V. Train–Track–Bridge Dynamic Interaction on a Bowstring-Arch Railway Bridge: Advanced Modeling and Experimental Validation. Sensors 2022, 23, 171. [Google Scholar] [CrossRef] [PubMed]
- Meixedo, A.; Ribeiro, D.; Calçada, R.; Delgado, R. Global and local dynamic effects on a railway viaduct with precast deck. In Proceedings of the Civil-Comp Proceedings 2014, Naples, Italy, 2–5 September 2014; p. 104. [Google Scholar]
- Comboios de Portugal. CP—Comboio Elétrico Pendular, Séries 4000; Comboios de Portugal: Lisbon, Portugal, 1998. [Google Scholar]
- Comboios de Portugal. CP—Comboio Elétrico Pendular, Séries 4000; Comboios de Portugal: Lisbon, Portugal, 2017. [Google Scholar]
- Ribeiro, D.; Calçada, R.; Delgado, R.; Brehm, M.; Zabel, V. Finite-element model calibration of a railway vehicle based on experimental modal parameters. Veh. Syst. Dyn. 2013, 51, 821–856. [Google Scholar] [CrossRef]
- ARTeMIS. ARTeMIS Extractor Pro—Academic License, User’s Manual, SVS 2009; ARTeMIS: Aalborg, Denmark, 2009.
Figure 1.
Typical transmissibility curve on conventional train seats (red dot represents the resonant frequency and blue dot represents the antiresonance frequency) (adapted from [42]).
Figure 1.
Typical transmissibility curve on conventional train seats (red dot represents the resonant frequency and blue dot represents the antiresonance frequency) (adapted from [42]).

Figure 2.
Main steps for the application of the Enhanced Frequency Domain Decomposition (EFDD) method.
Figure 2.
Main steps for the application of the Enhanced Frequency Domain Decomposition (EFDD) method.

Figure 3.
CPA 4000 series train in operation.

Figure 4.
Alfa Pendular seats: (a) comfort class seat; (b) standard class seat.

Figure 5.
Seat metallic frame.

Figure 6.
Experimental test setup: (a) seat pad location and experimental test; (b) accelerometers distribution along seat frame structure. Each number represents the modal node used on ARTeMIS software (see Section 3.2.2).
Figure 6.
Experimental test setup: (a) seat pad location and experimental test; (b) accelerometers distribution along seat frame structure. Each number represents the modal node used on ARTeMIS software (see Section 3.2.2).

Figure 7.
Transmissibility curves: (a) comfort seat; (b) standard seat.

Figure 8.
EFDD method: average normalised singular values of the spectral density matrices regarding AP comfort seat.
Figure 8.
EFDD method: average normalised singular values of the spectral density matrices regarding AP comfort seat.

Figure 9.
Experimental modal parameters for the comfort seat.


Figure 10.
Demonstration of seat bending movement.

Figure 11.
EFDD method: average normalised singular values of the spectral density matrices regarding AP standard seat.
Figure 11.
EFDD method: average normalised singular values of the spectral density matrices regarding AP standard seat.

Figure 12.
AP standard seat experimental modal parameters, where the front and lateral views are presented.
Figure 12.
AP standard seat experimental modal parameters, where the front and lateral views are presented.

Figure 13.
Intercity train in operation.

Figure 14.
Intercity train seats: (a) comfort class; (b) standard class.

Figure 15.
Seat metallic structural frame: (a) comfort seat structural frame; (b) standard seat structural frame.
Figure 15.
Seat metallic structural frame: (a) comfort seat structural frame; (b) standard seat structural frame.

Figure 16.
Experimental setup: (a) seat pad location; (b) accelerometers on seat frame structure.

Figure 17.
Transmissibility curves of Intercity train seat: (a) comfort seat; (b) standard seat.

Figure 18.
Seatback (X-axis)/Floor (Z-axis) transmissibility: (a) comfort seat; (b) standard seat.

Figure 19.
EFDD method: average normalised singular values of the spectral density matrices regarding Intercity comfort seat.
Figure 19.
EFDD method: average normalised singular values of the spectral density matrices regarding Intercity comfort seat.

Figure 20.
Comfort seat experimental modal parameters, where the front and lateral views are presented.
Figure 20.
Comfort seat experimental modal parameters, where the front and lateral views are presented.

Figure 21.
EFDD method: average normalised singular values of the spectral density matrices regarding Intercity standard seat.
Figure 21.
EFDD method: average normalised singular values of the spectral density matrices regarding Intercity standard seat.

Figure 22.
Standard seat experimental modal parameters, where the front and lateral views are presented regarding Intercity trains.
Figure 22.
Standard seat experimental modal parameters, where the front and lateral views are presented regarding Intercity trains.


Table 1.
Subjects’ characteristics.
| Subject | Gender | Age (Years) | Weight (kg) | Height (m) |
|---|---|---|---|---|
| S1 | Female | 25 | 58 | 1.70 |
| S2 | Male | 26 | 80 | 1.87 |
| S3 | Male | 39 | 115 | 1.85 |
Table 2.
Main resonance and antiresonance frequency values for comfort and standard seats of AP train.
Table 2.
Main resonance and antiresonance frequency values for comfort and standard seats of AP train.
| Subject | Comfort | Standard | ||
|---|---|---|---|---|
| Resonance (Hz) | Antiresonance (Hz) | Resonance (Hz) | Antiresonance (Hz) | |
| S1 | 0.20 | 0.59 | 0.20 | 1.37 |
| 1.37 | 4.49 | 1.76 | 3.91 | |
| 2.54 | 2.34 | |||
| 4.88 | 4.69 | |||
| S2 | 0.20 | 0.39 | 0.20 | 1.17 |
| 1.56 | 4.69 | 1.76 | 3.52 | |
| 2.54 | 2.34 | |||
| 4.88 | 4.30 | |||
| S3 | 0.20 | 0.39 | 0.20 | 0.78 |
| 1.37 | 4.30 | 1.76 | 4.30 | |
| 2.54 | 2.73 | |||
| 4.69 | 4.69 | |||
Table 3.
Main resonance and antiresonance frequency values for comfort and standard seats of Intercity trains.
Table 3.
Main resonance and antiresonance frequency values for comfort and standard seats of Intercity trains.
| Subject | Comfort | Standard | ||
|---|---|---|---|---|
| Resonance (Hz) | Antiresonance (Hz) | Resonance (Hz) | Antiresonance (Hz) | |
| S1 | 0.59 | 1.37 | 0.20 | 0.59 |
| 4.30 | 0.78 | 2.54 | ||
| 4.88 | ||||
| S2 | 0.20 | 1.37 | 0.20 | 1.17 |
| 4.49 | 1.56 | 2.93 | ||
| 4.88 | ||||
| S3 | 0.20 | 1.95 | 0.20 | 0.59 |
| 4.69 | 0.78 | 2.34 | ||
| 5.27 | ||||
Disclaimer/Publisher’s Note: The statements, opinions and data contained in all publications are solely those of the individual author(s) and contributor(s) and not of MDPI and/or the editor(s). MDPI and/or the editor(s) disclaim responsibility for any injury to people or property resulting from any ideas, methods, instructions or products referred to in the content. |
© 2023 by the authors. Licensee MDPI, Basel, Switzerland. This article is an open access article distributed under the terms and conditions of the Creative Commons Attribution (CC BY) license (https://creativecommons.org/licenses/by/4.0/).
Share and Cite
MDPI and ACS Style
Silva, P.; Ribeiro, D.; Mendes, J.; Seabra, E. Modal Identification of Train Passenger Seats Based on Dynamic Tests and Output-Only Techniques. Appl. Sci. 2023, 13, 2277. https://doi.org/10.3390/app13042277
AMA Style
Silva P, Ribeiro D, Mendes J, Seabra E. Modal Identification of Train Passenger Seats Based on Dynamic Tests and Output-Only Techniques. Applied Sciences. 2023; 13(4):2277. https://doi.org/10.3390/app13042277
Chicago/Turabian StyleSilva, Patricia, Diogo Ribeiro, Joaquim Mendes, and Eurico Seabra. 2023. "Modal Identification of Train Passenger Seats Based on Dynamic Tests and Output-Only Techniques" Applied Sciences 13, no. 4: 2277. https://doi.org/10.3390/app13042277
Note that from the first issue of 2016, this journal uses article numbers instead of page numbers. See further details here.