
Research on the Arrangement of Additional Source for Large Space Protection of an Active Noise Barrier

School of Mechanical and Power Engineering, Henan Polytechnic University, Jiaozuo 454003, China
*
Author to whom correspondence should be addressed.
Appl. Sci. 2024, 14(2), 885; https://doi.org/10.3390/app14020885
Submission received: 8 December 2023
/
Revised: 15 January 2024
/
Accepted: 15 January 2024
/
Published: 19 January 2024
(This article belongs to the Special Issue Traffic Noise and Vibrations in Public Transportation Systems)
Abstract
:When active noise control technology is applied to traffic noise control, additional sources are often added to the facade of the barrier, and error sensors are placed in the protected area. The noise reduction effect in the area without error sensors is often ignored. In this paper, the effect of the additional source configuration on the sound field in the space without error sensors is researched. By analyzing the directivity and distribution of the sound field at the top of the barrier under various conditions, it is believed that the optimal location of the additional source is related to the height of the primary source and the barrier. An approximate model is established to evaluate the optimal location of the additional source for achieving a good noise reduction effect in a large space. Experiments are also carried out to verify the model. The conclusions are beneficial for improving the noise reduction effect in the area higher than the barrier and without error microphones.
1. Introduction
Traffic noise not only degrades people’s quality of life but also increases the risk of cardiovascular and metabolic diseases. Complaints and disputes related to the pollution of noise have increased dramatically in recent years [1,2]. The increase in traffic volume and speed have led to a growing problem of traffic noise pollution, along with the limited availability of urban land, resulting in main roads being located near residential areas. Therefore, traffic noises are pervasive and difficult to avoid in major cities. To combat noise pollution, mitigation measures can be applied at the noise source, along the noise propagation path, or at the receivers’ end [3]. For traffic noise control, the general practice is to use noise barriers [4]. A noise barrier is positioned between the noise source and the receiver; the performance of a barrier can be quantified by insertion loss (IL), which is obtained by measuring the difference in sound pressure levels (SPLs) at the same point with and without a barrier [5]. A barrier can prevent the direct traveling of sound from the source to the receiver, but the noise can still propagate to the receiver by diffraction around the top of the barrier. The performance of the barrier is limited by its height, and noise reduction at locations above the barrier is usually unsatisfactory. In addition, according to the theory of diffraction, the low-frequency noise is less affected by the noise barrier during propagation, resulting in unsatisfactory noise reduction in the low-frequency range. To overcome the shortages mentioned above, many solutions have been suggested, such as optimizing the cross-sectional geometry of the top edge of the barrier, adopting composite periodic structures, and active noise barriers [6,7,8,9,10]. Among them, active noise barriers have attracted a lot of attention.
Active noise barriers are based on active noise control theory and use an electronic system containing loudspeakers and microphones that generate secondary sound waves to eliminate unwanted noise [11]. An active noise barrier prototype developed by Borchi et al. was able to operate in a stationary, almost pure tone, low-frequency noise environment effectively, and the prototype could obtain a peak insertion loss of about 15 dB [12]. The results of many studies show that the location of the loudspeaker (additional source/secondary source) and the microphone (error sensor) are important factors affecting the performance of the active noise barrier [13,14,15,16,17], in addition to the number of the controllers [18]. The sound attenuation caused by the active noise control system is only significant when the system is optimally arranged; otherwise, the active control system may be ineffective or even reduce the insertion loss of the barrier.
Sohrabi et al. researched the general criteria for the locations of the additional sources and error microphones and suggested that the additional sources should be located on the incident side and below the path that connects the furthest point in the shadow zone to the edge of the barrier, and the error microphones should be located on the shadow side of the barrier where they are under the diffracted field of both the primary and the additional sources [19]. The shadow zone is behind the barrier and below the path that connects the source and the top of the barrier. Hart et al. investigated the effect of the angular orientation on the noise abatement of an active noise barrier; in their research, a linear array of additional sources was placed above the top of a noise barrier. They concluded that highly effective control within the shadow zone is possible when the active noise control system is oriented at an angle where two or more error sensors are in line with the first diffracting edge and the primary noise. To further increase the area of the quiet zone, three or more control sources should be utilized [20]. Niu et al. found that the additional source should be placed in a lower position than the error sensor [21]. Huang et al. studied the feasibility of using active control systems to improve the performance of indoor barriers based on 2D numerical simulations. The simulation results showed that an extra IL of about 10 dB can be obtained below 500 Hz with the ideal error sensing strategy. In their investigation, the additional source is located on the top of the barrier [22].
The directivity of the additional source is also a factor that affects the performance of the active noise barrier. Chen et al. proposed a type of unidirectional additional source that consists of two close loudspeakers. They indicated that the noise reduction performance can be improved remarkably by replacing monopoles with the unidirectional sources when the secondary sound field of the unidirectional sources is adjusted to maximally match with the primary sound field in the shadow zone behind the barrier [23].
In the studies mentioned above, most of the research is focused on improving the performance in local spaces or some desired positions, such as the shadow zone. However, for traffic noise control, Lee et al. suggested that attention should be paid not only to the shadow zone of the barrier but also to the space beyond the shadow zone [24].
This paper aims to improve the noise reduction effect in a large space behind a barrier by optimizing the arrangement of the additional source. The relationship between the location of the additional source and the noise reduction effect in a large space is explored by the method of FEM. Section 2 introduces the concept of an active noise barrier. In Section 3, the simulation method is explained and the sound field at the top of the barrier is calculated under different conditions to explore the effect of the additional source’s location on the directivity of sound waves. Section 4 investigates the effect of the primary source’s location on the arrangement of the additional source. An approximate model for the optimal location of the additional source is proposed in Section 5. Finally, Section 6 presents the results of experiments conducted to verify the conclusions. The preliminary research helps to explore the new layout of an active noise barrier system, which is meaningful for improving the performance of active noise barriers in a large space.
2. Active Noise Barrier
An active noise barrier is composed of a noise barrier and an active control system. The noise barrier is used to control the noise in the middle and high-frequency ranges, and the active control system is used to control the noise in the low-frequency range. The active control system consists of additional sources, control systems, and error sensors, where the additional source is generally set on the same side as the primary source, mostly attached to the façade of the barrier, and the error sensors are set at the region where the noise reduction needs to be focused, usually behind the barrier. The scheme of an active noise barrier is shown in Figure 1. The principle of an active noise barrier in low-frequency noise abatement is to achieve superimposed noise reduction by controlling the additional source to generate a series of sound waves that have the same amplitude and opposite phase with the primary source at the region where error microphones are located.
Diffraction occurs when a sound wave encounters the top edge of a sound barrier during propagation; sound waves travel in a straight line, but diffraction at the top of the barrier bends the direction of propagation by an amount related to the wavelength of the sound wave. The bending of the propagation direction allows the sound waves to travel to the protected area bypass the barrier. There is a loss of sound energy during the diffraction process, resulting in a reduction in noise. In the case of an active noise barrier, sound waves from both the primary source and the additional source are diffracted at the top of the barrier and continue to propatagate to the rear of the barrier. These waves combine to form the sound field behind the barrier. However, controlling the sound field beyond the region where the error microphones are located can be challenging, and this may lead to increased noise pollution in large spaces behind the barrier. This is an unavoidable phenomenon determined by the noise reduction mechanism of an active noise barrier. In practice, there are often many buildings and other protected regions that are taller than the barrier, as shown in Figure 1. Therefore, there is a need for effective noise protection in large spaces. In addition to increasing the number of error sensors, methods to improve the noise reduction effect of a barrier in large spaces can be achieved by optimizing the location of the additional sources to improve the sound field distribution behind the barrier.
The direction of the waves will be changed after diffraction at the top of the barrier, and the waves in a certain frequency range may propagate mainly in a certain direction: it is beneficial to reduce the noise pollution behind the barrier when the propagation direction of the waves is bent upward. Therefore, the noise reduction effect of the barrier in a large space can be evaluated by analyzing the directivity of the waves around the top of the barrier and the sound field behind the barrier.
3. Numerical Analysis
3.1. Simulation Model
This research uses 2D numerical simulations, because a complete analytical solution is still not available. The validity of the computational model is tested by examining the free-field behavior of the two-dimensional line source. In the absence of a barrier and with the source located on the ground, a sound pressure level drop of 3 dB per doubling of distance is verified.
In the calculation process, an 8 m long by 3.5 m wide rectangular space is under investigation, where the coordinate origin is chosen at the bottom left corner of the enclosure. A 2 m high and 0.01 m thick single barrier located at x = 6.5 m. The sound transmitted through the barrier is negligible by assuming the transmission loss of the barrier is great. A primary source with a source intensity of 0.01 ms is placed on the left side of the barrier as the equivalent traffic noise, and an additional source with the same intensity used to cancel the noise behind the barrier is arranged on the facade of the barrier. Taking the sound field in the space behind the barrier as the main consideration, 35 observation points with a radius of 1 m centered on the apex of the barrier are selected to analyze the directivity of the diffracted waves. The ground and the barrier are considered to be rigid, and the sound waves will be totally reflected when they propagate to the surface of the ground and the barrier.
3.2. Calculation Results
Firstly, the sound field in the observation area is calculated when the primary source is located at (4.5 m, 0.5 m) and the additional source is located at 0.3 m, 0.5 m, 1 m, 1.5 m, and 2 m above the ground. Figure 2 shows the calculation results at the frequency of 800 Hz. The results at the frequency of 500 Hz, 630 Hz, and 1000 Hz are also calculated, and they showed the same characteristics as at 800 Hz. It can be seen from Figure 2 that the barrier shows good performance, and the sound pressure behind the barrier is significantly reduced. The sound waves behind the barrier propagate forward with the apex of the barrier as the center, and the directivity of the sound field is similar. However, when the additional source is located at the top of the barrier, the noise reduction in the large space behind the barrier is significantly worse than otherwise, as shown in Figure 2d.
In addition, the sound field behind the barrier is also calculated when the primary source is located at 1 m above the ground; the calculation results agree with the results shown in Figure 2. It can be concluded that in order to obtain good performance in the large space behind the barrier, it is not appropriate to locate the additional source at the top of the barrier or a position higher than the barrier.
Secondly, in order to analyze the effect of the additional source location on the sound field behind the barrier more conveniently, observation points were set at the top of the barrier, and the directivity of the sound field over the top of the barrier is analyzed when the additional source is located at different positions. The SPLs at the central frequency of one-third octave were compared in the frequency range between 500 Hz and 5000 Hz. The results showed that the effect of the location of the additional source on the sound field is almost the same whether located at the low or middle part of the barrier in the frequency range over 2500 Hz. Moreover, the active noise control technology is mainly applied to the control of low-frequency noise. Therefore, the following analysis focuses on the effect of the additional source location on the sound field behind the barrier in the frequency range of 500 Hz–1000 Hz.
When the primary source is located at 0.5 m above the ground, the directivity of the sound field over the barrier is calculated as shown in Figure 3, where the additional source is located at 0.3 m, 0.5 m, and 1 m above the ground.
The right half of the graph (0–90°–180°) represents the space behind the barrier, which is the main concern. It can be seen from Figure 3 that the effect of the additional source on the sound field behind the barrier is closely related to the location of the additional source and the frequency of the sound waves. At the frequency of 500 Hz, the SPLs in the space behind the barrier are the smallest when the additional source is located at 0.5 m above the ground. The SPLs are almost the same when the additional source is located at 0.3 m and 1 m above the ground. At the frequency of 630 Hz, the SPLs are the smallest in the region of 0 to 150° when the additional source is located at 0.3 m above the ground. When the additional source is located at 0.5 m or 1 m above the ground, the SPLs are almost the same in the region of 150° to 180° and smaller than in other cases. At the frequency of 800 Hz, the SPLs are the smallest in the region of 0 to 120° when the additional source is located at 0.3 m above the ground. In the region of 120° to 160°, the SPLs are the smallest when the additional source is located at 1 m above the ground. In the region of 160° to 180°, the SPLs are the smallest when the additional source is located at 0.5 m above the ground. At the frequency of 1000 Hz, the SPLs are the smallest in the region of 0 to 150° when the additional source is located at 0.3 m above the ground. In the region of 150° to 180°, the SPLs are the smallest when the additional source is located at 0.5 m above the ground. The difference is small when the additional source is located at 0.3 m and 1 m above the ground.
According to the calculation results shown in Figure 3, taking the value of the SPLs near 120° as the main concern, the ideal locations of the additional source at each frequency can be acquired as shown in Table 1. As can be seen in Table 1, to acquire good performance in multiple frequency bands, the additional source should be located at 0.3 m above the ground. It can also be concluded that good noise reduction can be achieved in a large space when the additional source is located lower than the primary source.
Then, the directivity of the sound field on the top of the barrier is also calculated when the primary source is located at 1 m above the ground; the calculation results are shown in Figure 4.
At the frequency of 500 Hz, the SPLs in the large spaces behind the barrier are the smallest when the additional source is located 0.5 m above the ground. The SPLs are almost the same when the additional source is located at 0.3 m and 1 m above the ground. At the frequency of 630 Hz, the SPLs are the smallest in the region of 0 to 125° when the additional source is located at 0.5 m above the ground, but the difference is small compared with when the additional source is located at 1 m above the ground. The SPLs are the smallest in the region of 125° to 180° when the additional source is located at 0.3 m above the ground. At the frequency of 800 Hz, in the region of 0 to 150°, the SPLs are almost the same when the additional source is located at 0.3 m and 1 m above the ground and greater than when the additional source is located at 0.5 m above the ground. At the frequency of 1000 Hz, the difference in SPLs is small when the additional source is located at 0.3 m and 1 m above the ground. The SPLs are the smallest in the region of 0 to 150° when the additional source is located at 0.3 m above the ground. On the whole, it is beneficial to acquire good performance in large spaces behind the barrier when the additional source is located 0.5 m above the ground in the case of the primary source is located at 1 m above the ground.
Comparing the calculation results mentioned above, it is clear that the optimal location of the additional source is not the lower the better, but it should be lower than the primary source.
4. Directivity Calculation When the Primary Source Is Located Away from the Barrier and Double Sources
Generally, urban roads are multi-lane, and the distance between adjacent lanes in China is 3.75 m. It is well known that it is hard to acquire good performance only with the barrier itself when the source is located away from the barrier. In order to improve the noise reduction effect through active noise control methods, it is necessary to investigate the effect of the additional source on the sound field when the primary source is located away from the barrier. Therefore, the directivity of the sound field at the top of the barrier is calculated in this section, when the primary source is located away from the barrier, as well as when multiple sources exist. The calculation scheme is the same as mentioned above. In the calculation process, the primary source is located at (0.75 m, 0.5 m), 5.75 m away from the center of the barrier. The calculation results are shown in Figure 5, when the additional source is located at 0.3 m, 0.5 m, and 1 m. It can be seen from Figure 5 that the calculation results are similar to those shown in Figure 3. At the frequency of 500 Hz, the SPLs are the smallest when the additional source is located at 0.5 m above the ground, and in the frequency range over 500 Hz, the SPLs are the smallest when the additional source is located at 0.3 m above the ground. It can also be seen that the effect of the additional source location is small in the frequency range over 800 Hz. Therefore, the distance between the primary source and the barrier has little effect on the arrangement of the additional source.
The directivity of the sound field over the barrier is also calculated when the primary sources were located in two lanes, and the results are shown in Figure 6. In the calculation process, two primary sources are located 5.75 m away from the center of the barrier and 0.5 m above the ground and 2 m away from the center of the barrier and 1 m above the ground, which represents the sources located in the adjacent lanes. It is not difficult to find that the results shown in Figure 6 agree well with those shown in Figure 4, showing that the noise reduction effect is the best when the additional source is located at 0.5 m. In the frequency range over 800 Hz, the effect of the additional source location is small. It can be concluded that when the primary sources are located in multiple lanes, the arrangement of the additional source should mainly consider the characteristics of the source adjacent to the barrier.
5. Approximate Model for Optimal Location of Additional Source
In order to further investigate the effect of the arrangement of the additional source on the noise reduction effect in large spaces behind the barrier and acquire the optimal location of the additional source, the SPLs around the top of the barrier are calculated and compared when the additional source is located at different locations (the location of the additional source changed from 0.1 m to 1.7 m at an interval of 0.1 m). For the convenience of discussion, the SPLs at receiver R are mainly concerned, where the R is located at 1 m away from the top of the barrier, the angle between the line connecting R and the apex of the barrier and the horizontal plane is 30°, and the sound waves must pass through this region when propagating into a large space behind the barrier. In the calculation process, the primary source is located at 2 m away from the center of the barrier. Figure 7a shows the results when the primary source is located at 0.5 m above the ground. Figure 7b shows the results when the primary source is located at 1 m above the ground. It can be seen from Figure 7 that when the primary source is located at 0.5 m above the ground, the additional source should preferably be located at 0.2 m above the ground, and when the primary source is located at 1 m above the ground, the additional source should preferably be located at 0.4 m above the ground. This indicates that the optimal location of the additional source is highly related to the height of the primary source.
The height of the barrier is a key factor in the sound diffraction. To investigate the effect of the barrier height on the location of the additional source, the SPLs are also calculated when the height of the barrier is 1.5 m. The calculation results are shown in Figure 8. It can be seen that when the primary source is located at 0.5 m above the ground, the additional source should be located at 0.2 m above the ground, the same as when the height of the barrier is 2 m. However, when the primary source is located at 1 m above the ground, the additional source should be located at 0.2 m above the ground, which is different from when the height of the barrier is 2 m. It indicates that the optimal location of the additional source is also related to the height of the barrier.
According to the basic theory of acoustics and the analysis mentioned above, the optimal location of the additional source is related to the height of the primary source and the barrier, and the higher the location of the primary source or the higher the barrier is, the higher the optimal location of the additional source is. The optimal location of the additional source can be regarded as approximately proportional to the product of the height of the primary source and the height of the barrier. Thus, a model is established to acquire the optimal location of the additional source so as to reduce the noise in a large space. The model can be expressed as follows.
where is the height of the additional source, a is a coefficient, is the height of the primary source, and is the height of the barrier. 0.2 according to the calculation results mentioned above.
6. Experimental Results
To verify the accuracy of the conclusions mentioned above, experiments are conducted in an indoor environment, and the experiments met the requirements of the standard of HJ/T 90-2004 [25]. The height of the barrier used in the experiments is 1.2 m, and the distance between the top of the barrier and the roof is 2.4 m. The SPLs are measured by 1/2″ microphones (MAT231T, made by BSWA (Beijing, China), and the microphones met the requirements of the standard of IEC 61260-1:2014. Random noise is selected as the primary source, and the primary source is located at 0.3 m from the surface of the barrier, 0.8 m above the ground. The additional source is attached to the surface of the barrier. According to the location of the additional source, the experiments are divided into three groups, and three receivers are set in each group. The receivers are located on a circle with a radius of 0.4 m centered on the top of the barrier, and the anglea formed by the line connecting the receiver and the top of the barrier with the horizontal line are 30° (Receiver R1), 60° (Receiver R2) and 90° (Receiver R3). In the first group, the additional source is located at 0.08 m above the ground. In the second group, the additional source is located at 0.2 m above the ground. In the third group, the additional source is located at 0.4 m above the ground. When the additional source is located at 0.2 m above the ground, the height of the additional source is 0.2 times the product of the height of the barrier and the primary source. The scheme of the experiments is shown in Figure 9.
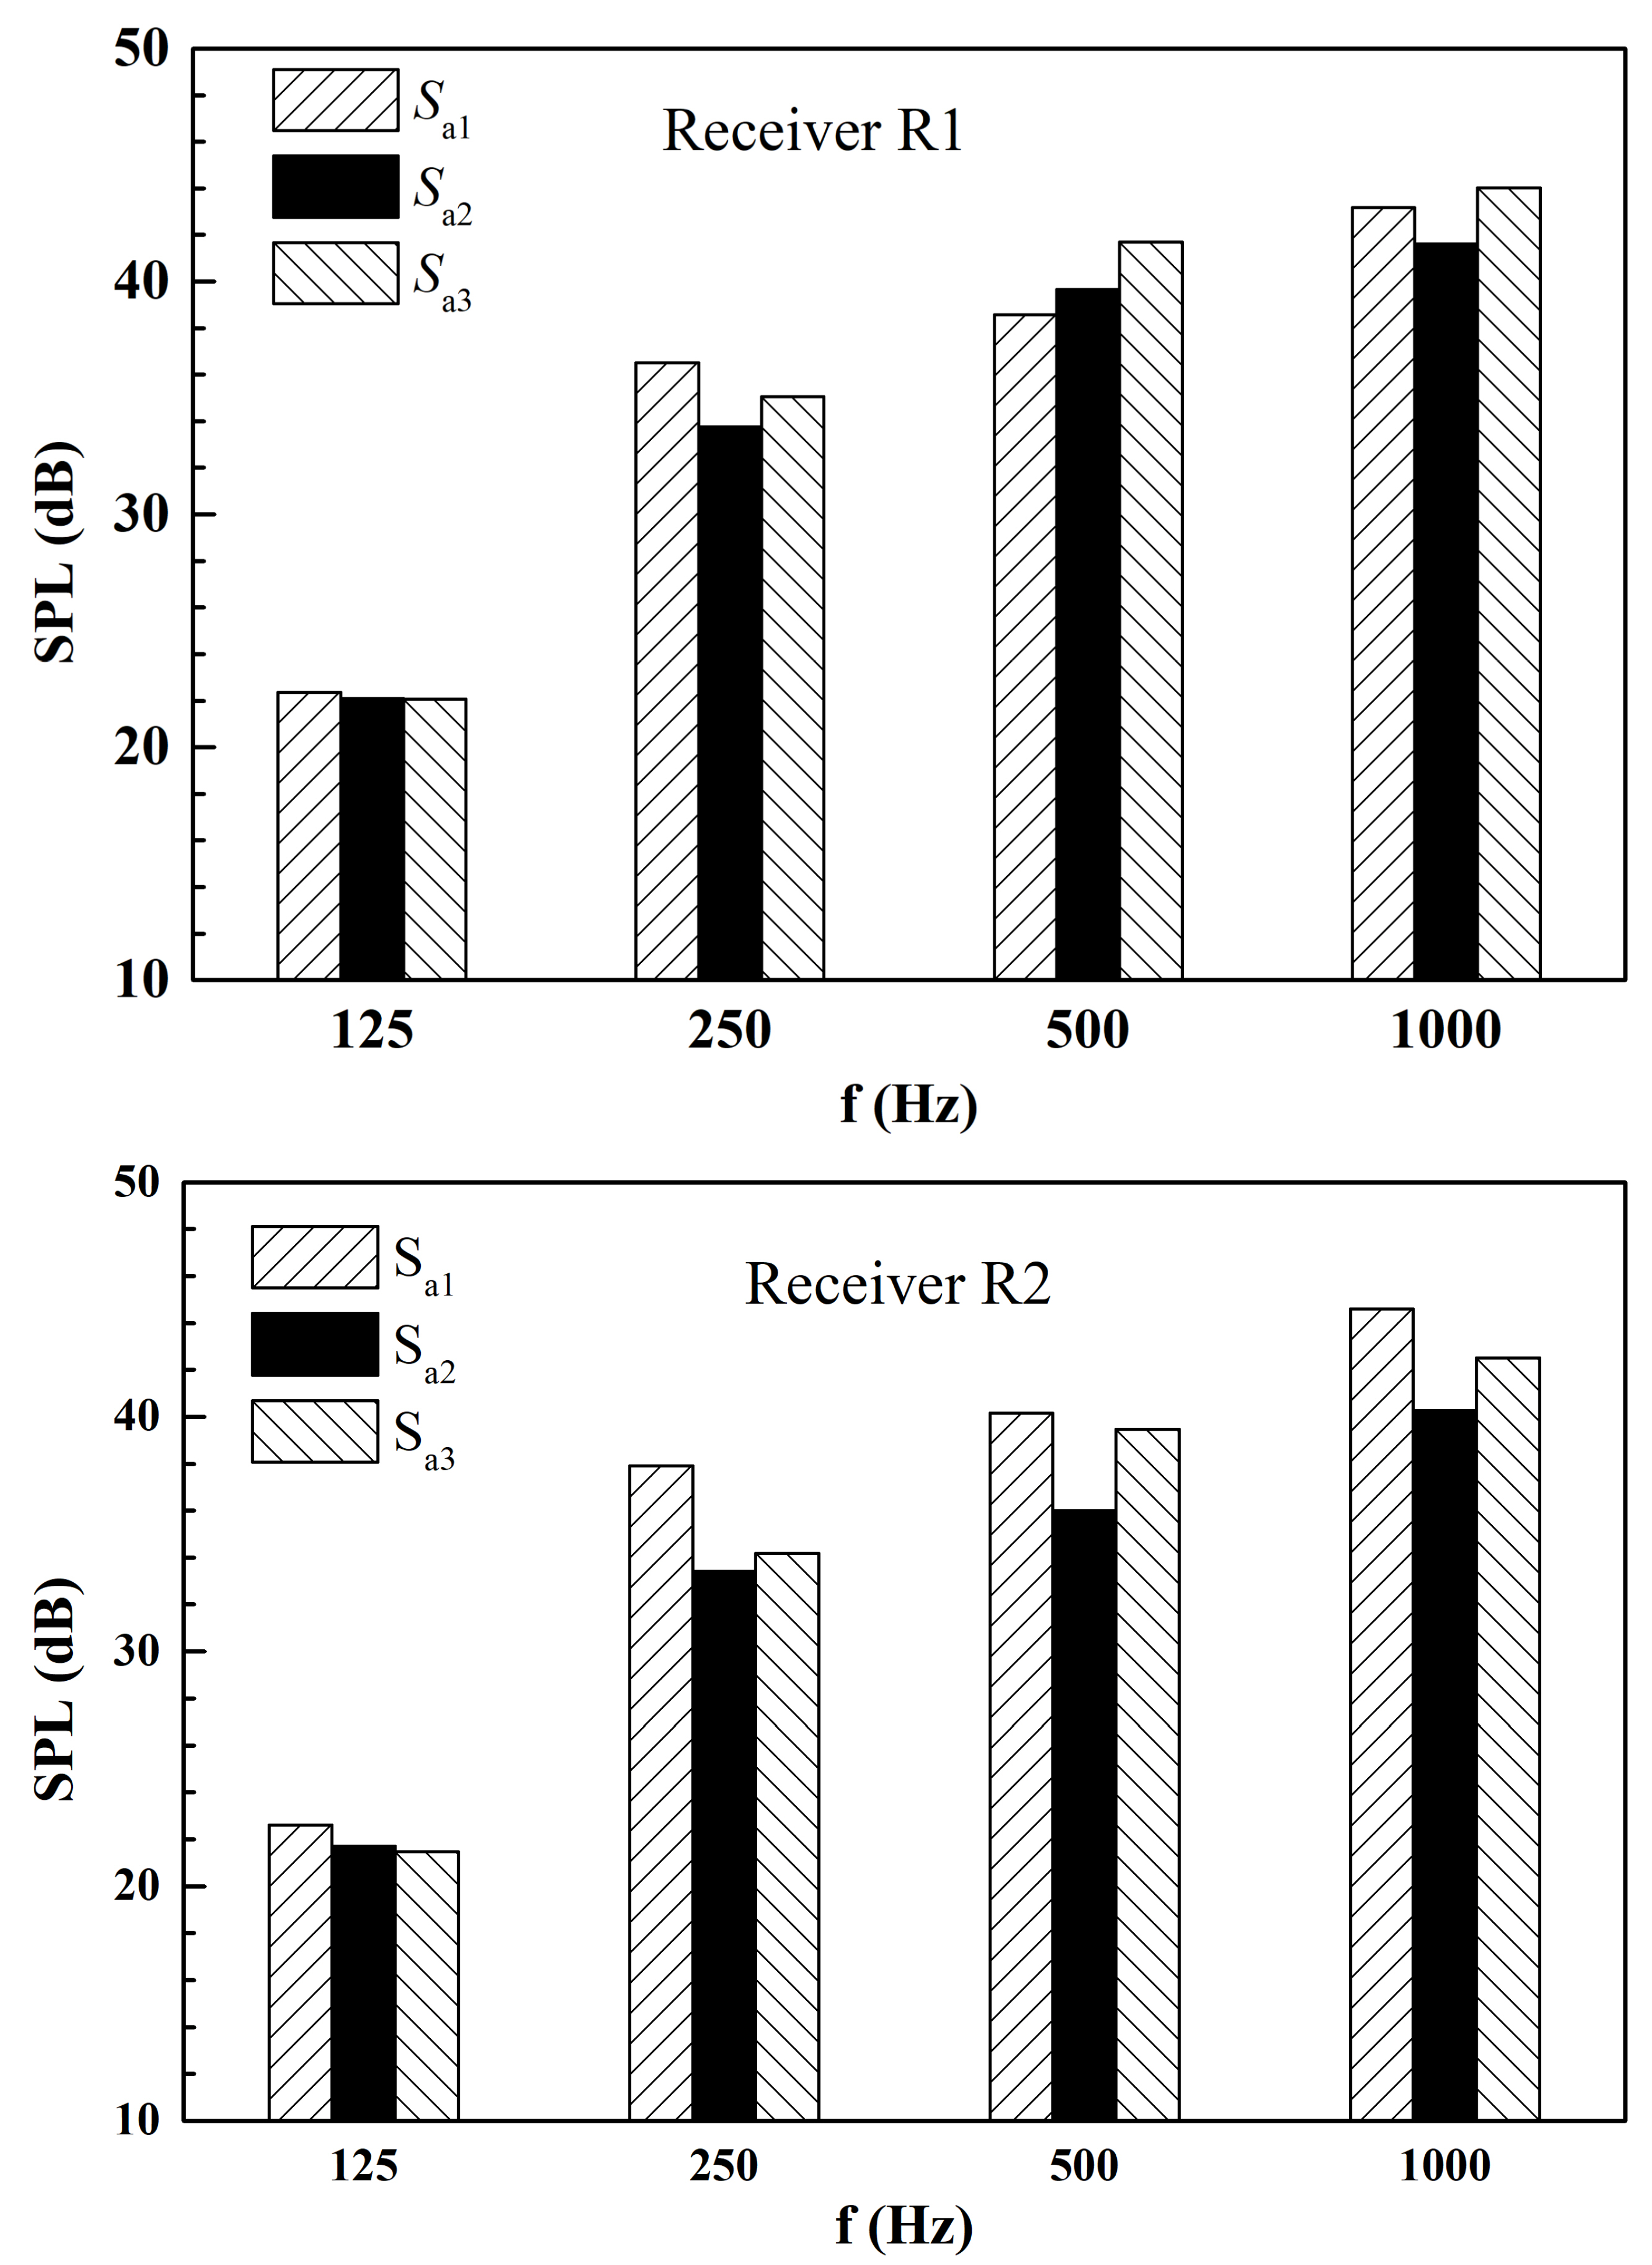
The overall SPLs at each receiver are shown in Table 2. As can be seen from Table 2, the SPLs measured in the second group are the lowest among the three groups. The comparison of the SPLs at the frequencies of 125 Hz, 250 Hz, 500 Hz, and 1000 Hz, measured at receiver R1 and receiver R2, are shown in Figure 10.
It can be seen from Figure 10 that at the frequency of 125 Hz, the SPLs are almost the same, especially at the receiver R1, and the additional source location has less influence on the low-frequency noise. At the frequency of 250 Hz, the SPLs are the smallest both at the receiver R1 and receiver R2 when the additional source is . At the frequency of 500 Hz, the SPL is the smallest for the additional source at the receiver R1, and the difference is 1.1 dB compared with the additional source and the SPL is the smallest for the additional source at the receiver R2. At the frequency of 1000 Hz, the SPLs are the smallest for the additional source both at the receiver R1 and receiver R2.
It is obvious from the experimental results that when the additional source is located at 0.2 m above the ground, where the height of the additional source is 0.2 times the product of the height of the barrier and the primary source, the values of the SPLs are the smallest in the area above the barrier, and it is conducive to obtaining a good noise reduction effect in the large spaces behind the barrier. The experimental results agree well with the conclusions mentioned above.
7. Conclusions
Active noise barriers have the potential to control traffic noise in the low- and medium-frequency ranges. However, the effect of the additional source arrangement on the sound field in the area without error sensors has not been thoroughly studied. This is crucial in improving the effectiveness of noise reduction in large spaces. In this paper, we calculated the directivity and SPLs of the sound field at the top of the barrier under various conditions. We also proposed and experimentally verified an optimal arrangement model for the additional source, which aids in noise protection in large spaces. The conclusions are summarized as follows:
1. The distance between the primary source and the barrier has a small effect on the arrangement of the additional source. The main focus should be on the primary source adjacent to the barrier when the primary sources are located in multiple lanes.
2. The height of the primary source and the barrier are the main factors that affect the location of the additional source, and the optimal height of the additional source can be regarded as proportional to the product of the two factors.
3. The sound waves in the frequency range below 500 Hz also occupy a large component in the traffic noise, and the experimental results show that the proposed method is effective for the sound wave with a center frequency of 250 Hz. However, the effect of the layout of the additional source on the sound waves below 500 Hz still needs to be studied in depth in the future.
Author Contributions
Conceptualization, Y.W.; software, Z.C.; validation, J.L.; writing—original draft preparation, Y.W.; writing—review and editing, G.C. All authors have read and agreed to the published version of the manuscript.
Funding
This research is funded by the Key Technologies R&D Program of Henan Province (No. 222102220024) and the Doctoral Program Foundation of Henan Polytechnic University (No. B2021-30).
Institutional Review Board Statement
Not applicable.
Informed Consent Statement
Not applicable.
Data Availability Statement
The data presented in this study are available in the figures shown in the present article.
Acknowledgments
We would like to thank Guo and Kang of Tianhai Auto Electronics Group Co., Ltd. for their valuable contributions to this research.
Conflicts of Interest
The authors declare no conflicts of interest.
References
- Jarosińska, D.; Héroux, M.È.; Wilkhu, P.; Creswick, J.; Verbeek, J.; Wothge, J.; Paunović, E. Development of the WHO Environmental Noise Guidelines for the European Region: An Introduction. Int. J. Environ. Res. Public Health 2018, 15, 813. [Google Scholar] [CrossRef] [PubMed]
- Kwon, N.; Park, M.; Lee, H.S.; Ahn, J.; Shin, M. Construction Noise Management Using Active Control Techniques. J. Constr. Eng. Manag. 2016, 142, 04016014. [Google Scholar] [CrossRef]
- Lam, B.; Gan, W.S.; Shi, D.; Nishimura, M.; Elliott, S. Ten questions concerning active noise control in the built environment. Build. Environ. 2021, 200, 107928. [Google Scholar] [CrossRef]
- Elrefae, A.G.; Issa Mohsen, A. Full-scale testing and nonlinear finite element analysis of a pioneering fully prefabricated noise barrier wall system. Proc. Meet. Acoust. 2023, 293, 116633. [Google Scholar] [CrossRef]
- Ding, Y. Experimental study on design of near rail noise barrier for Wenzhou surburban railway. J. Railw. Eng. Soc. 2022, 39, 98–104. [Google Scholar]
- Huang, X.; Zou, H.; Qiu, X. Effects of the top edge impedance on sound barrier diffraction. Appl. Sci. 2020, 10, 6042. [Google Scholar] [CrossRef]
- Sohrabi, S.; Gomez, T.P.; Garbi, J.R. Using genetic algorithms to optimize the location of transducers for an active noise barrier. J. Low Freq. Noise Vib. Act. Control 2023. [Google Scholar] [CrossRef]
- Hong, G.; Sun, Y.; Tang, Y.; Yuan, X.; Yang, J.; Jin, Z.; Jia, H. A subwavelength ventilated structure for efficient broadband sound insulation. J. Phys. D-Appl. Phys. 2023, 56, 425302. [Google Scholar] [CrossRef]
- Magliacano, D.; Catapane, G.; Petrone, G.; Verdière, K.; Robin, O. Sound transmission properties of a porous meta-material with periodically embedded Helmholtz resonators. Mech. Adv. Mater. Struct. 2023. [Google Scholar] [CrossRef]
- Li, Z.; Ma, M.; Liu, K.; Jiang, B. Performance of rubber-concrete composite periodic barriers applied in attenuating ground vibrations induced by metro trains. Eng. Struct. 2023, 285, 116027. [Google Scholar] [CrossRef]
- Lee, S.; Park, Y. Circular active noise barrier using theoretical control filter considering interaction between speaker and barrier. Sci. Rep. 2023, 13, 2649. [Google Scholar] [CrossRef] [PubMed]
- Borchi, F.; Carfagni, M.; Martelli, L.; Turchi, A.; Argenti, F. Design and experimental tests of active control barriers for low-frequency stationary noise reduction in urban outdoor environment. Appl. Acoust. 2016, 114, 125–135. [Google Scholar] [CrossRef]
- Wang, S.; Tao, J.; Qiu, X.; Pan, J. A boundary error sensing arrangement for virtual sound barriers to reduce noise radiation through openings. J. Acoust. Soc. Am. 2019, 145, 3695–3702. [Google Scholar] [CrossRef] [PubMed]
- Im, S.; Kim, S.; Woo, S.; Jang, I.; Han, T.; Hwang, U.; Lee, M. Deep learning-assisted active noise control in a time-varying environment. J. Mech. Sci. Technol. 2023, 37, 1189–1196. [Google Scholar] [CrossRef]
- Chen, W.; Pu, H.; Qiu, X. A compound secondary source for active noise radiation control. Appl. Acoust. 2010, 71, 101–106. [Google Scholar] [CrossRef]
- Tan, L.; Jiang, J. Active control of impulsive noise using a nonlinear companding function. Mech. Syst. Signal Process. 2015, 58–59, 29–40. [Google Scholar] [CrossRef]
- Fan, R.; Su, Z.; Cheng, L. Modeling, analysis, and validation of an active T-shaped noise barrier. J. Acoust. Soc. Am. 2013, 134, 1990–2003. [Google Scholar] [CrossRef]
- Ntumy, E.A.; Utyuzhnikov, S.V. Active sound control in 3D bounded regions. Wave Motion 2014, 51, 284–295. [Google Scholar] [CrossRef]
- Sohrabi, S.; Pàmies Gómez, T.; Romeu Garbí, J. Proper location of the transducers for an active noise barrier. J. Vib. Control 2023, 29, 2290–2300. [Google Scholar] [CrossRef]
- Hart, C.R.; Lau, S.K. Active noise control with linear control source and sensor arrays for a noise barrier. J. Sound Vib. 2012, 331, 15–26. [Google Scholar] [CrossRef]
- Niu, F.; Zou, H.; Qiu, X.; Wu, M. Error sensor location optimization for active soft edge noise barrier. J. Sound Vib. 2007, 299, 409–417. [Google Scholar] [CrossRef]
- Huang, X.; Zou, H.; Qiu, X. A preliminary study on the performance of indoor active noise barriers based on 2D simulations. Build. Environ. 2015, 94, 891–899. [Google Scholar] [CrossRef]
- Chen, W.; Rao, W.; Min, H.; Qiu, X. An active noise barrier with unidirectional secondary sources. Appl. Acoust. 2011, 72, 969–974. [Google Scholar] [CrossRef]
- Lee, H.M.; Wang, Z.; Lim, K.M.; Lee, H.P. A Review of Active Noise Control Applications on Noise Barrier in Three-Dimensional/Open Space: Myths and Challenges. Fluct. Noise Lett. 2019, 18, 1930002. [Google Scholar] [CrossRef]
- HJ/T 90-2004; Norm on Acoustics Design and Measurement of Noise Barriers. State Environmental Protection Administration: Beijing, China, 2004.
Figure 1.
The scheme of an active noise barrier.

Figure 2.
Calculation results of sound field when the additional source is located at different locations (800 Hz).
Figure 2.
Calculation results of sound field when the additional source is located at different locations (800 Hz).
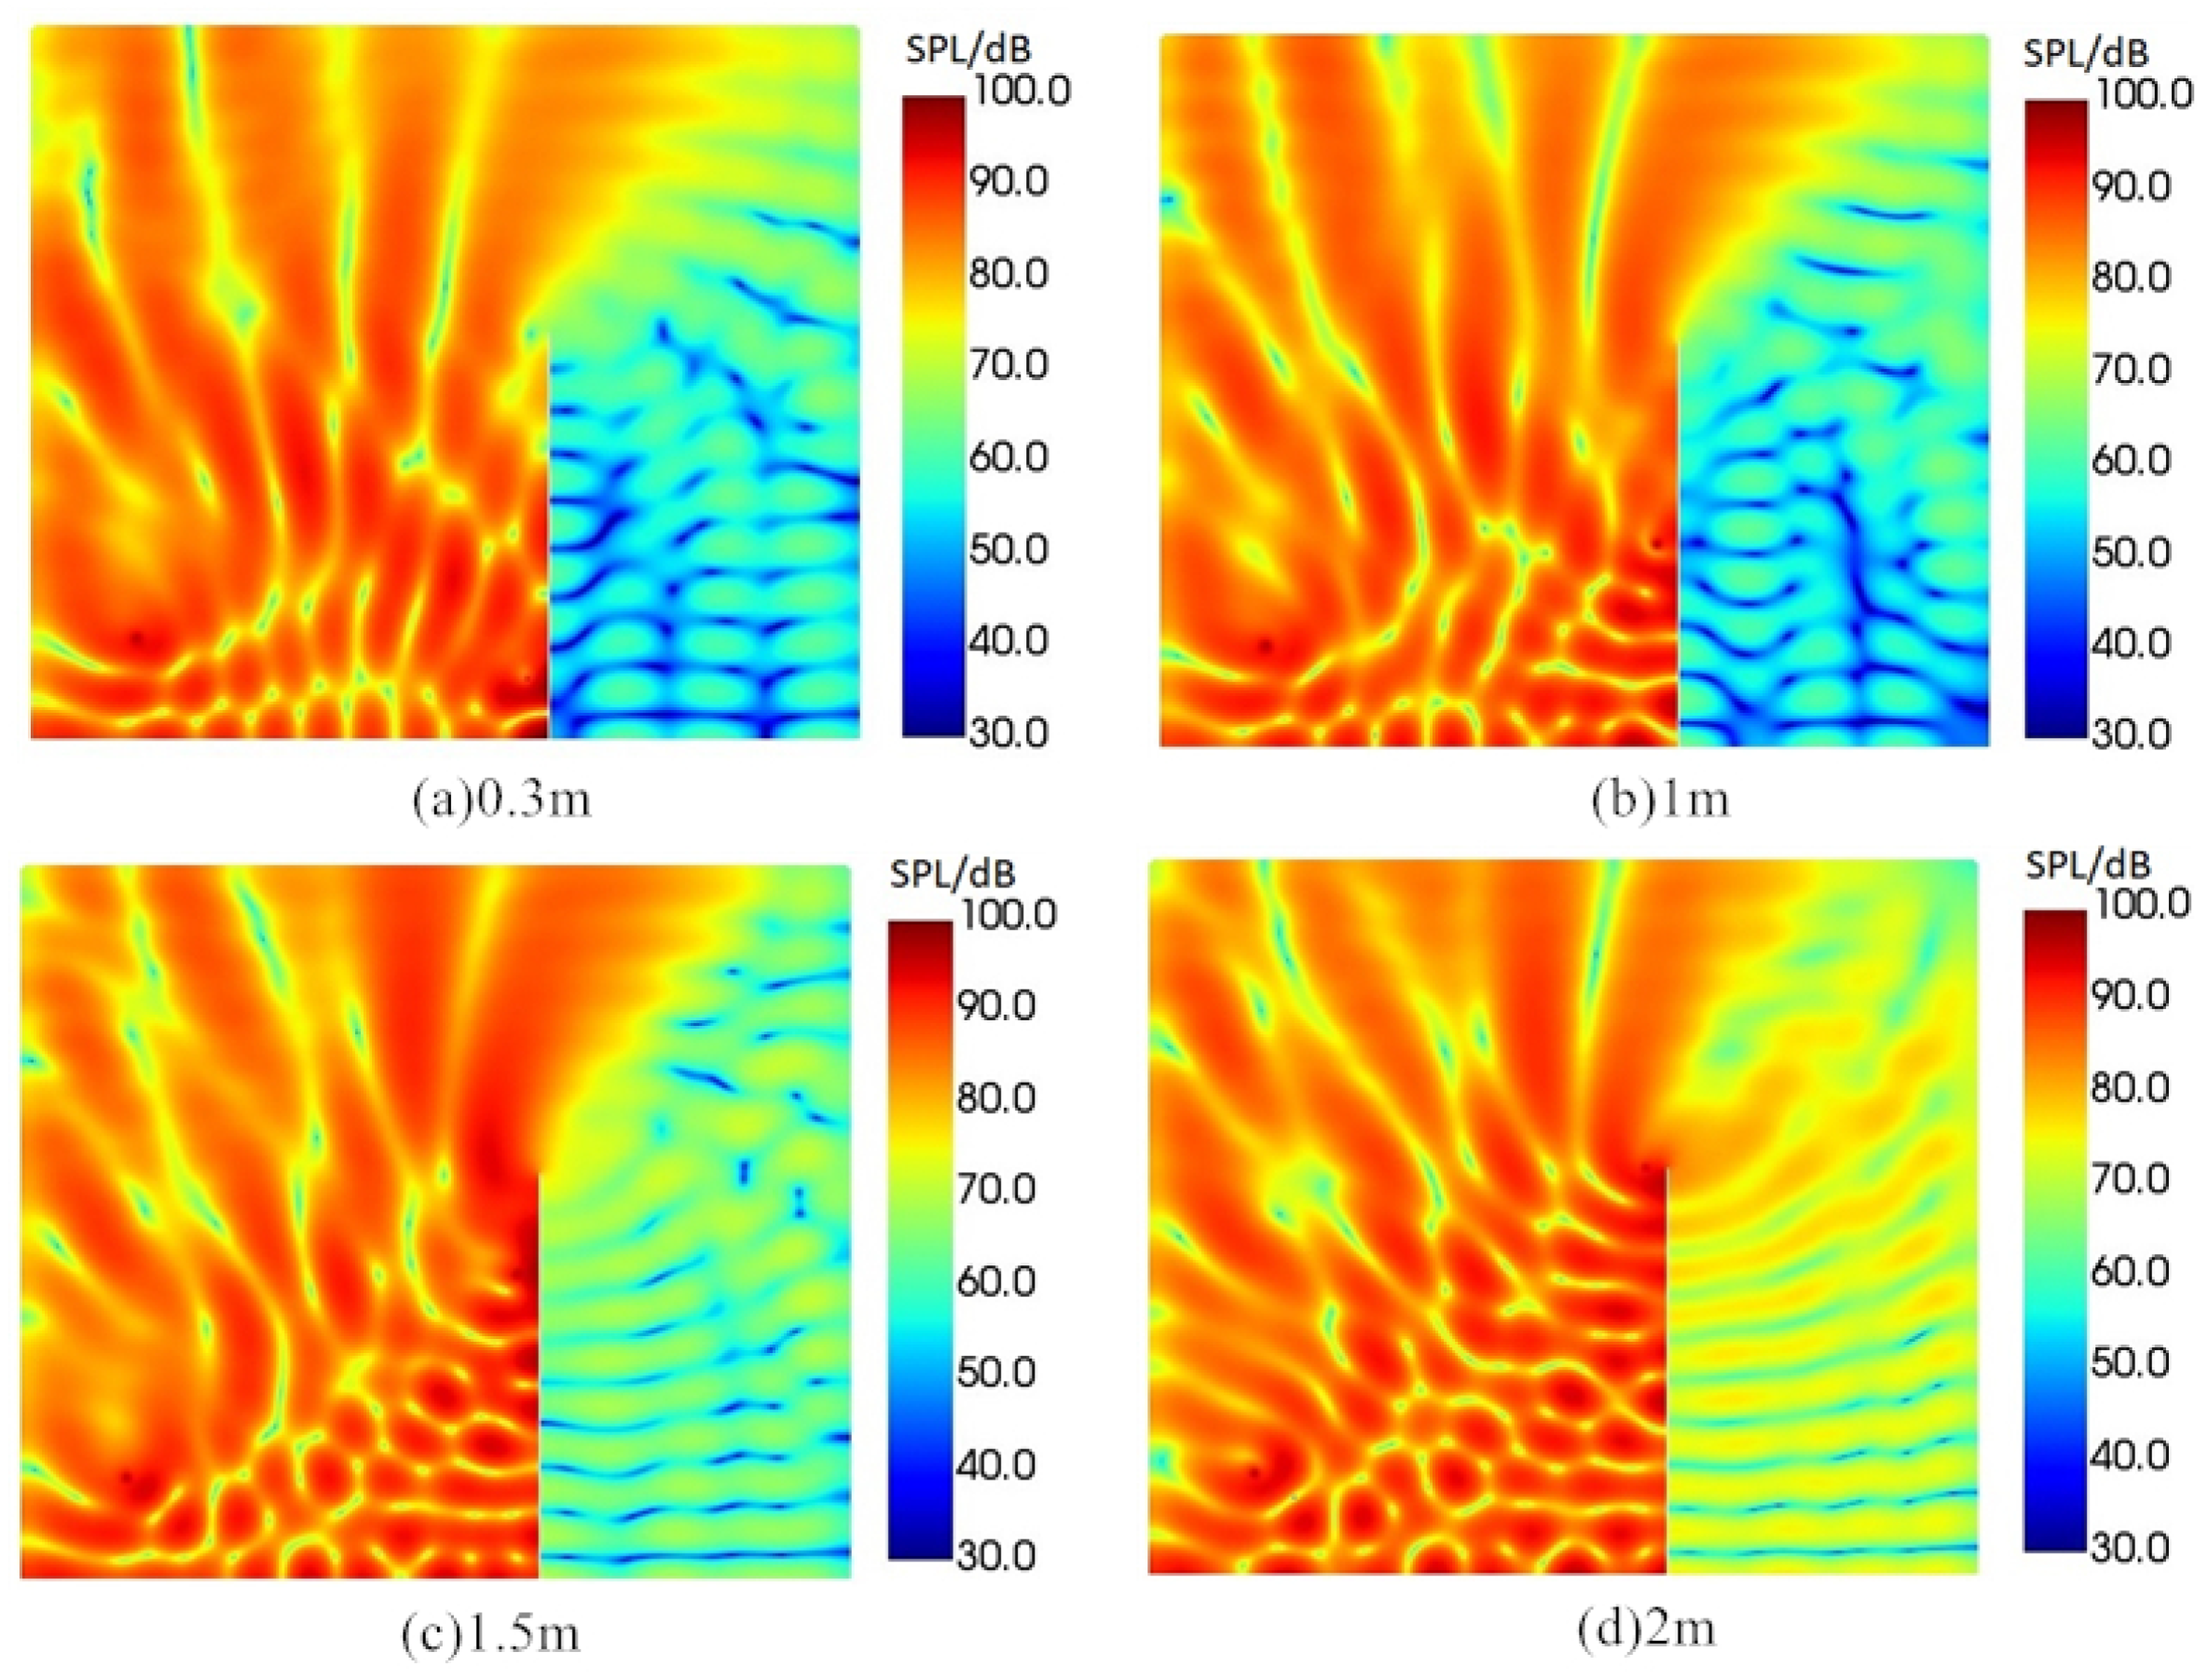
Figure 3.
Directivity of the sound field over the barrier when the primary source is located at 0.5 m above the ground.
Figure 3.
Directivity of the sound field over the barrier when the primary source is located at 0.5 m above the ground.

Figure 4.
Directivity of the sound field over the barrier when the primary source is located at 1 m above the ground.
Figure 4.
Directivity of the sound field over the barrier when the primary source is located at 1 m above the ground.
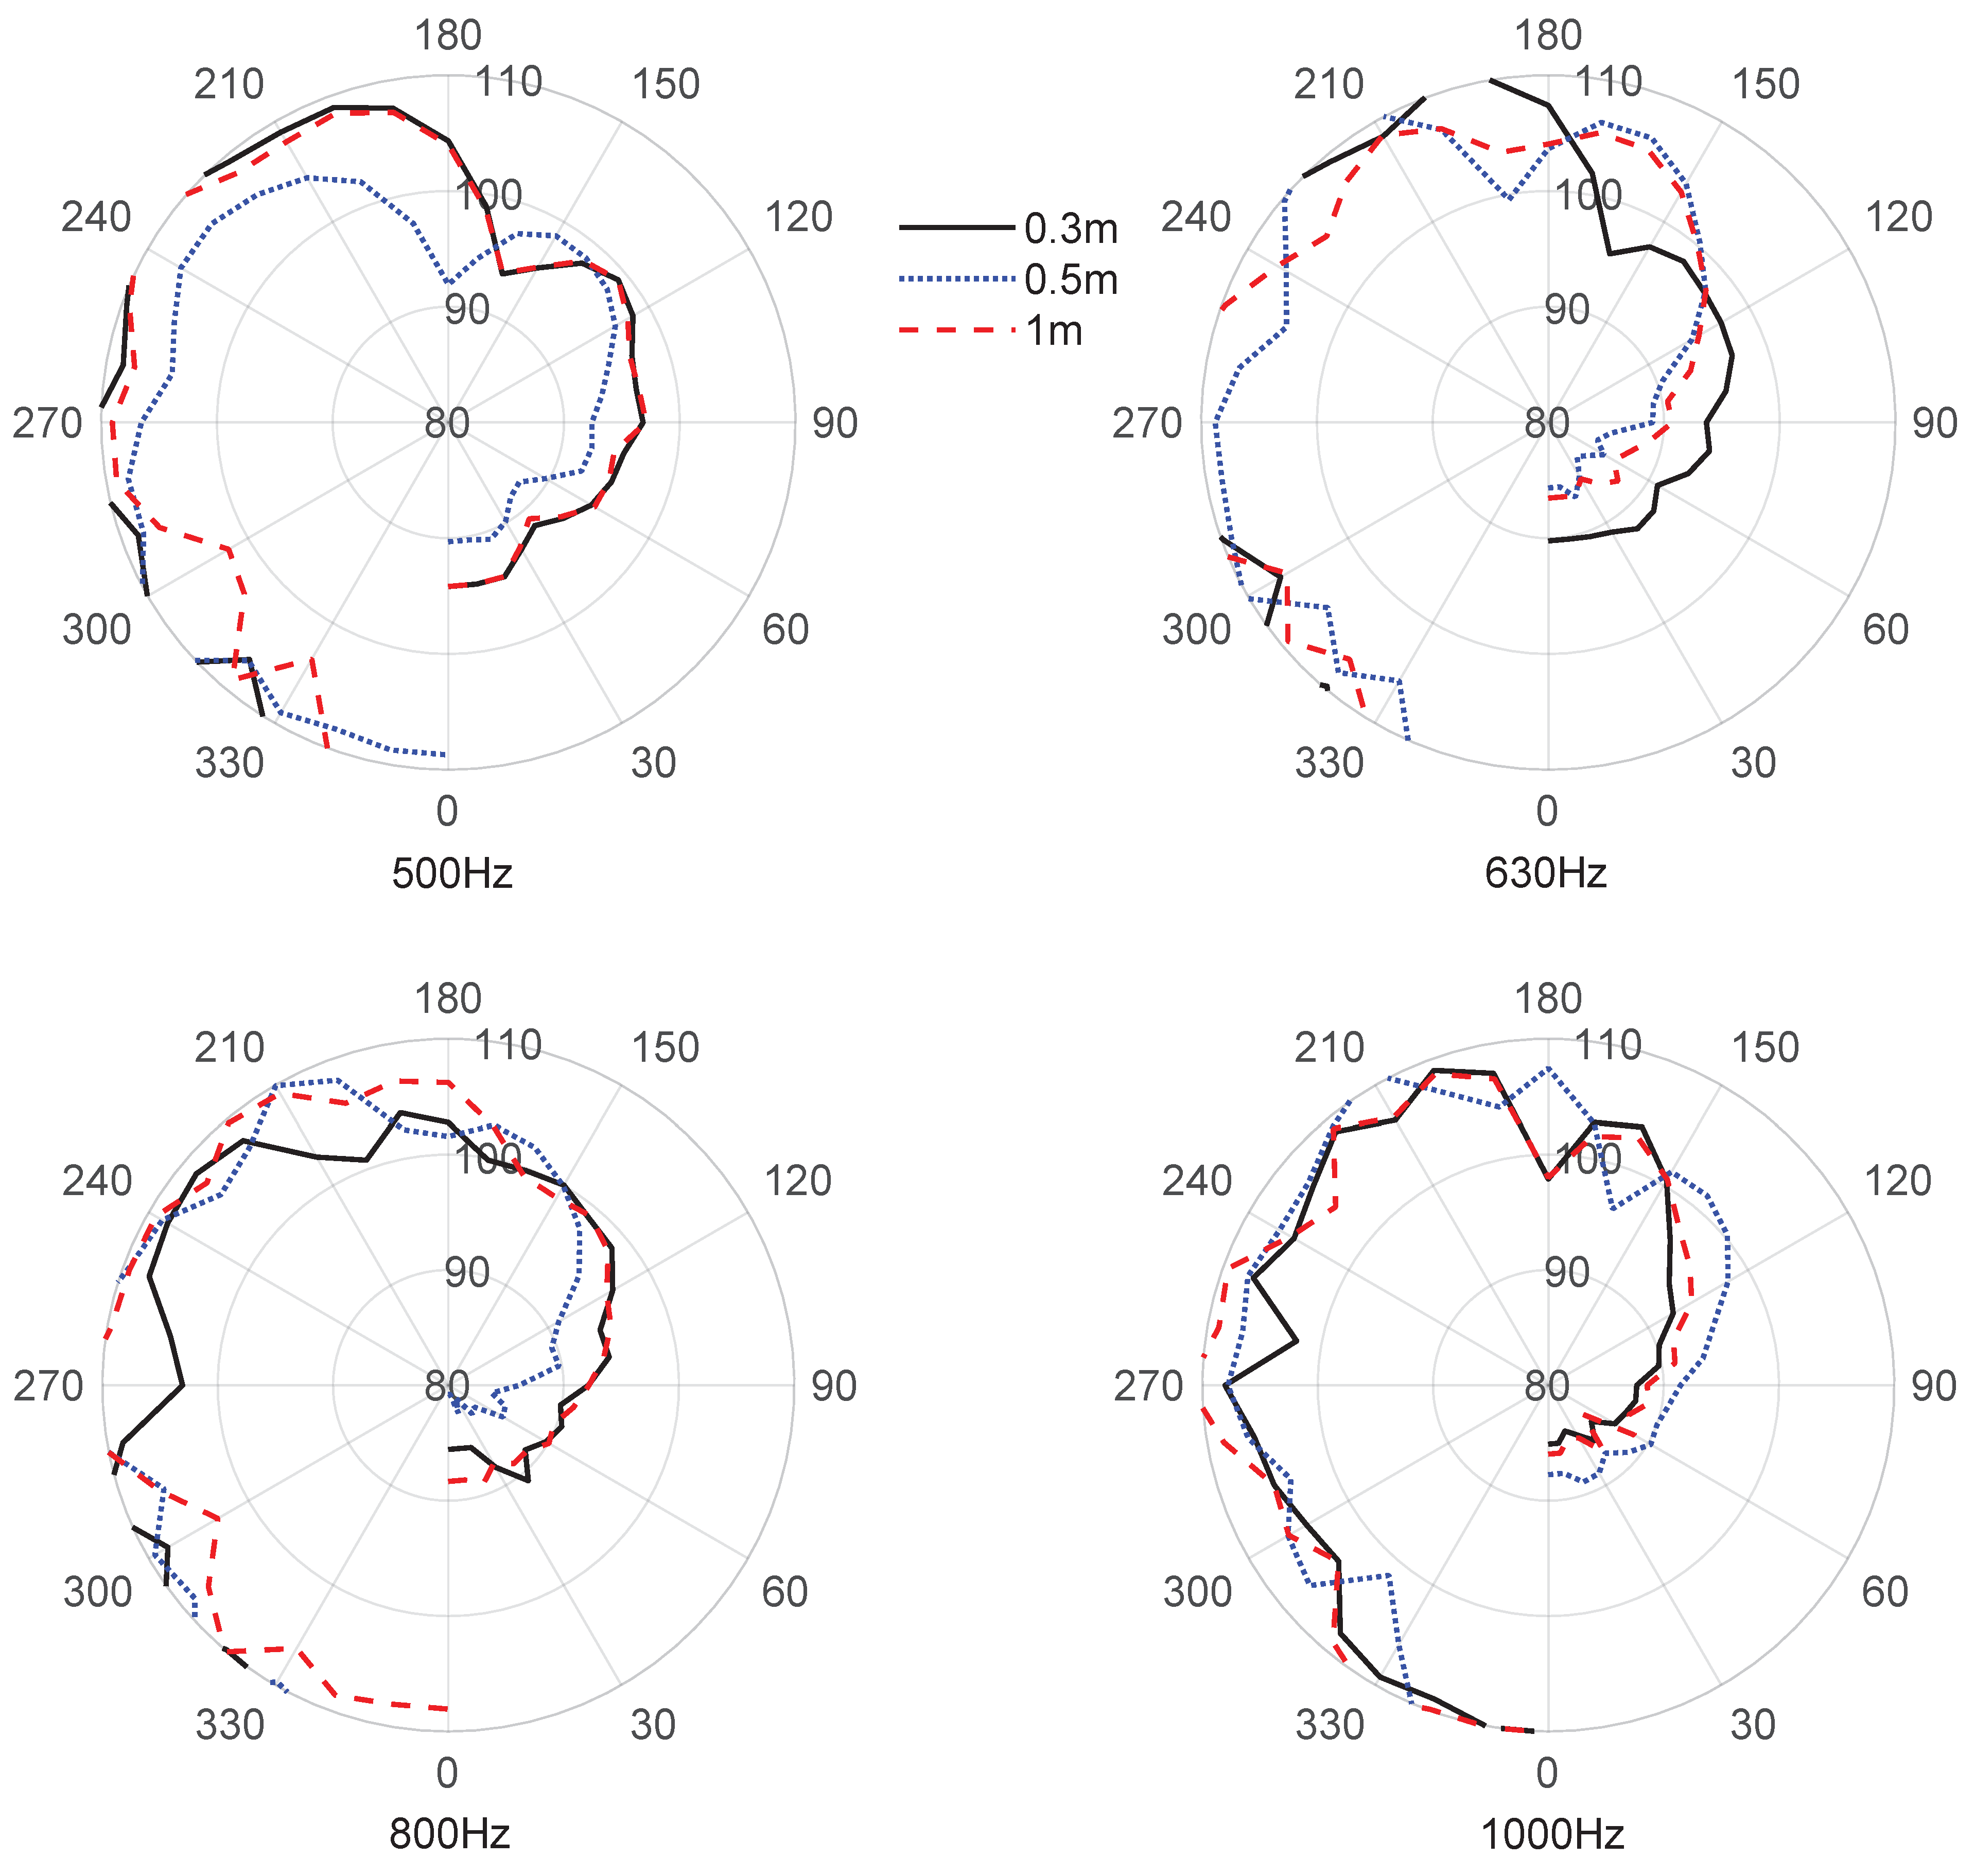
Figure 5.
Directivity of the sound field over the barrier when the primary source is located at 5.75 m from the barrier.
Figure 5.
Directivity of the sound field over the barrier when the primary source is located at 5.75 m from the barrier.

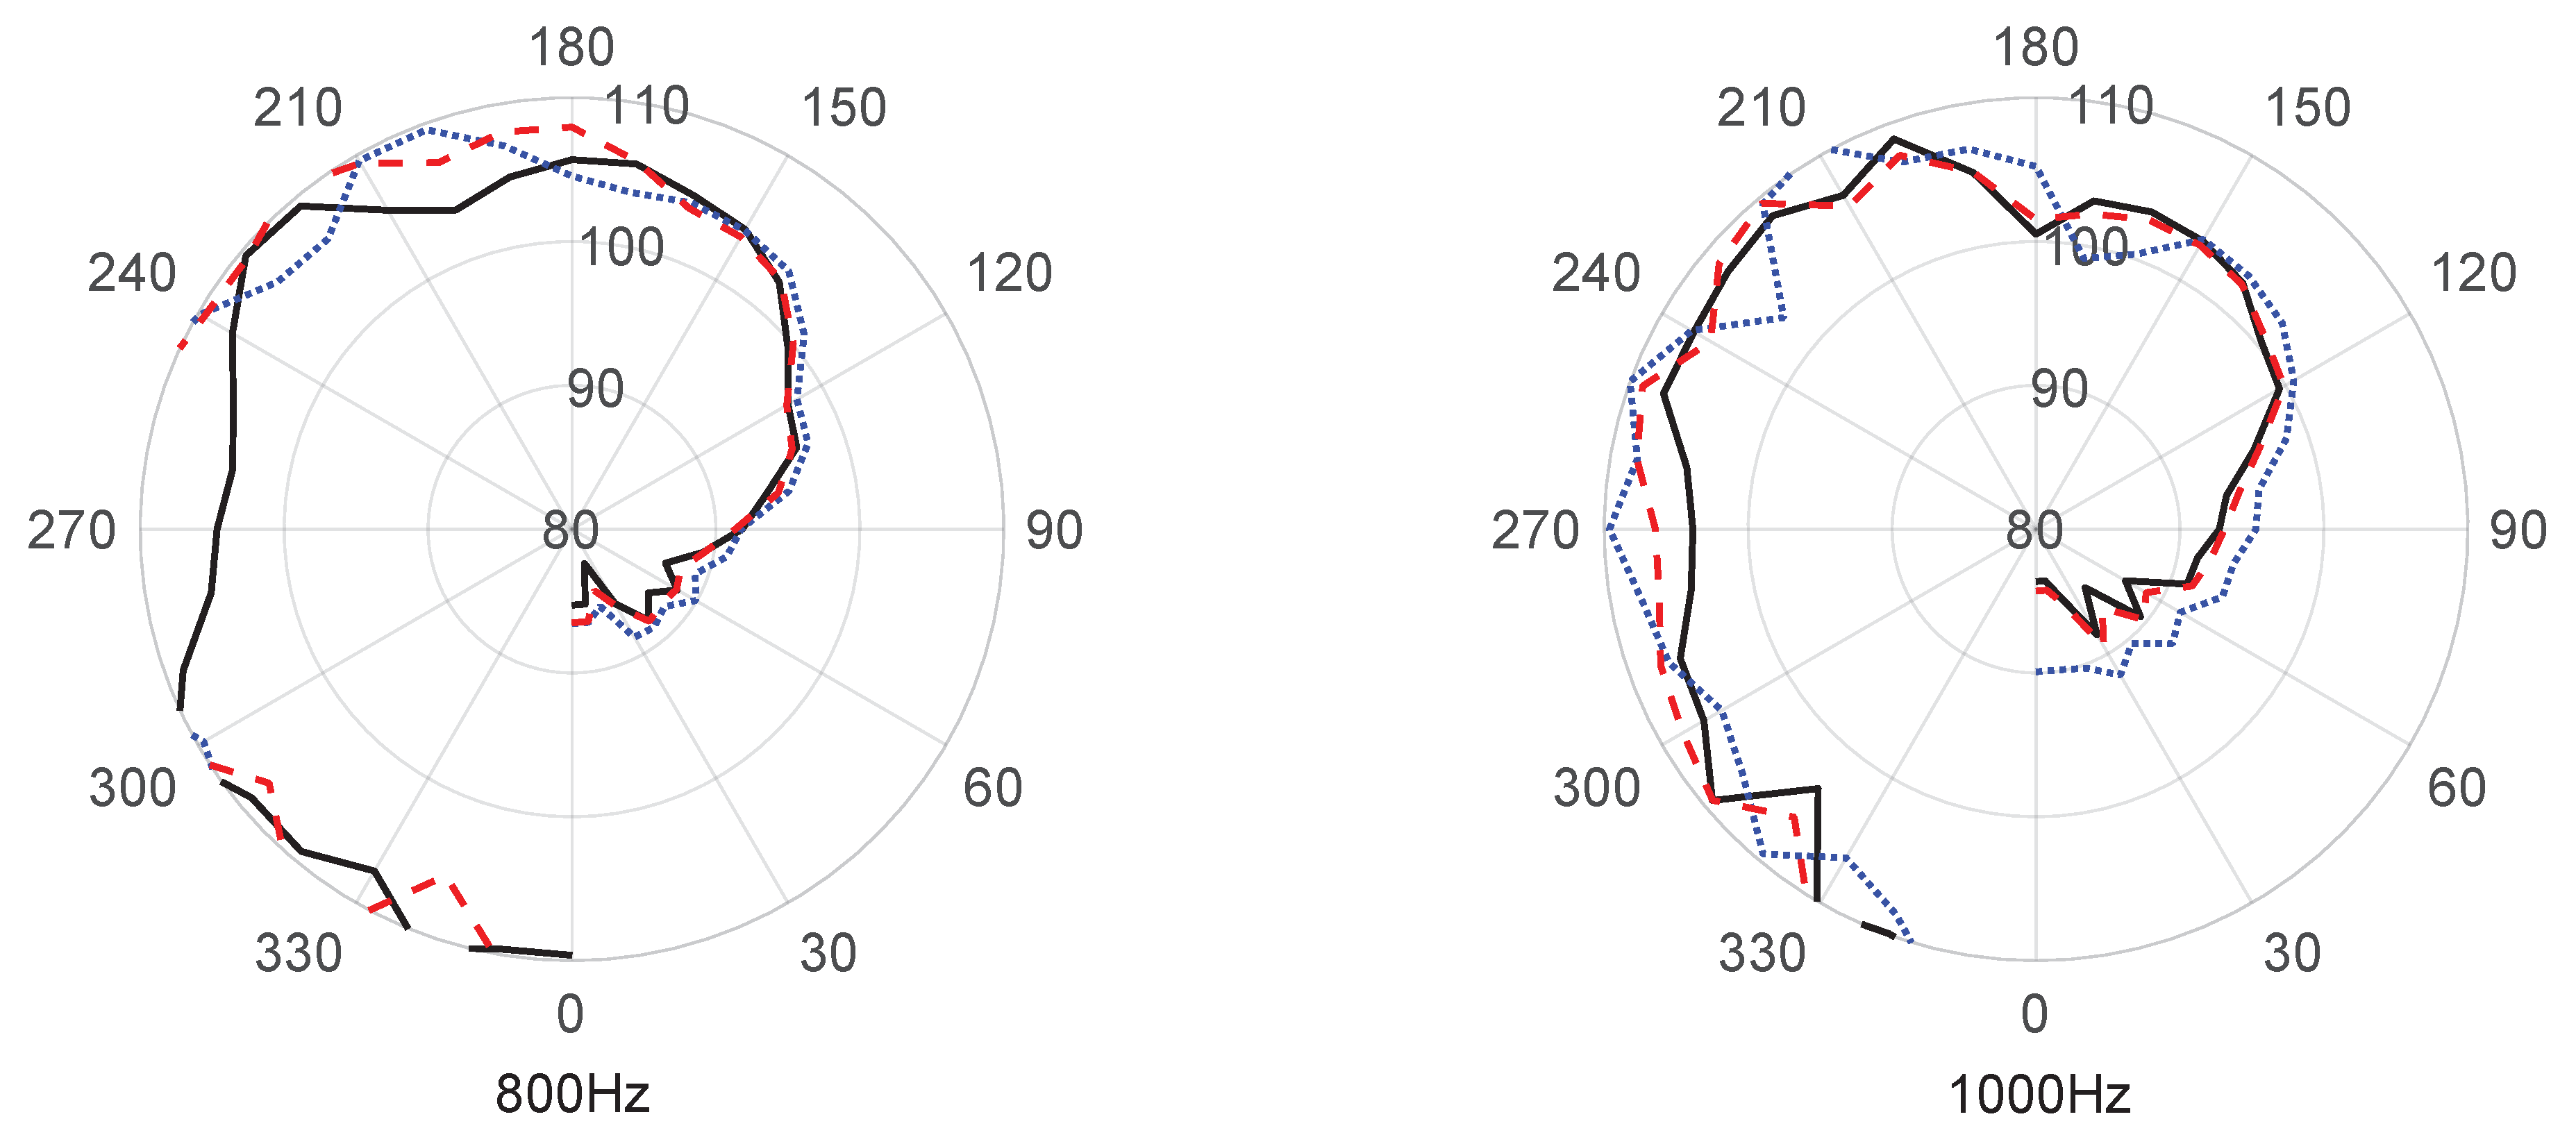
Figure 6.
Directivity of the sound field over the barrier when the primary sources are located in two lanes.
Figure 6.
Directivity of the sound field over the barrier when the primary sources are located in two lanes.

Figure 7.
The overall SPLs at R. (a) The primary source is located at 0.5 m above the ground. (b) The primary source is located at 1 m above the ground.
Figure 7.
The overall SPLs at R. (a) The primary source is located at 0.5 m above the ground. (b) The primary source is located at 1 m above the ground.

Figure 8.
The overall SPLs at R when the height of the barrier is 1.5 m. (a) The primary source is located at 0.5 m above the ground. (b) The primary source is located at 1 m above the ground.
Figure 8.
The overall SPLs at R when the height of the barrier is 1.5 m. (a) The primary source is located at 0.5 m above the ground. (b) The primary source is located at 1 m above the ground.

Figure 9.
The scheme of the experiments.
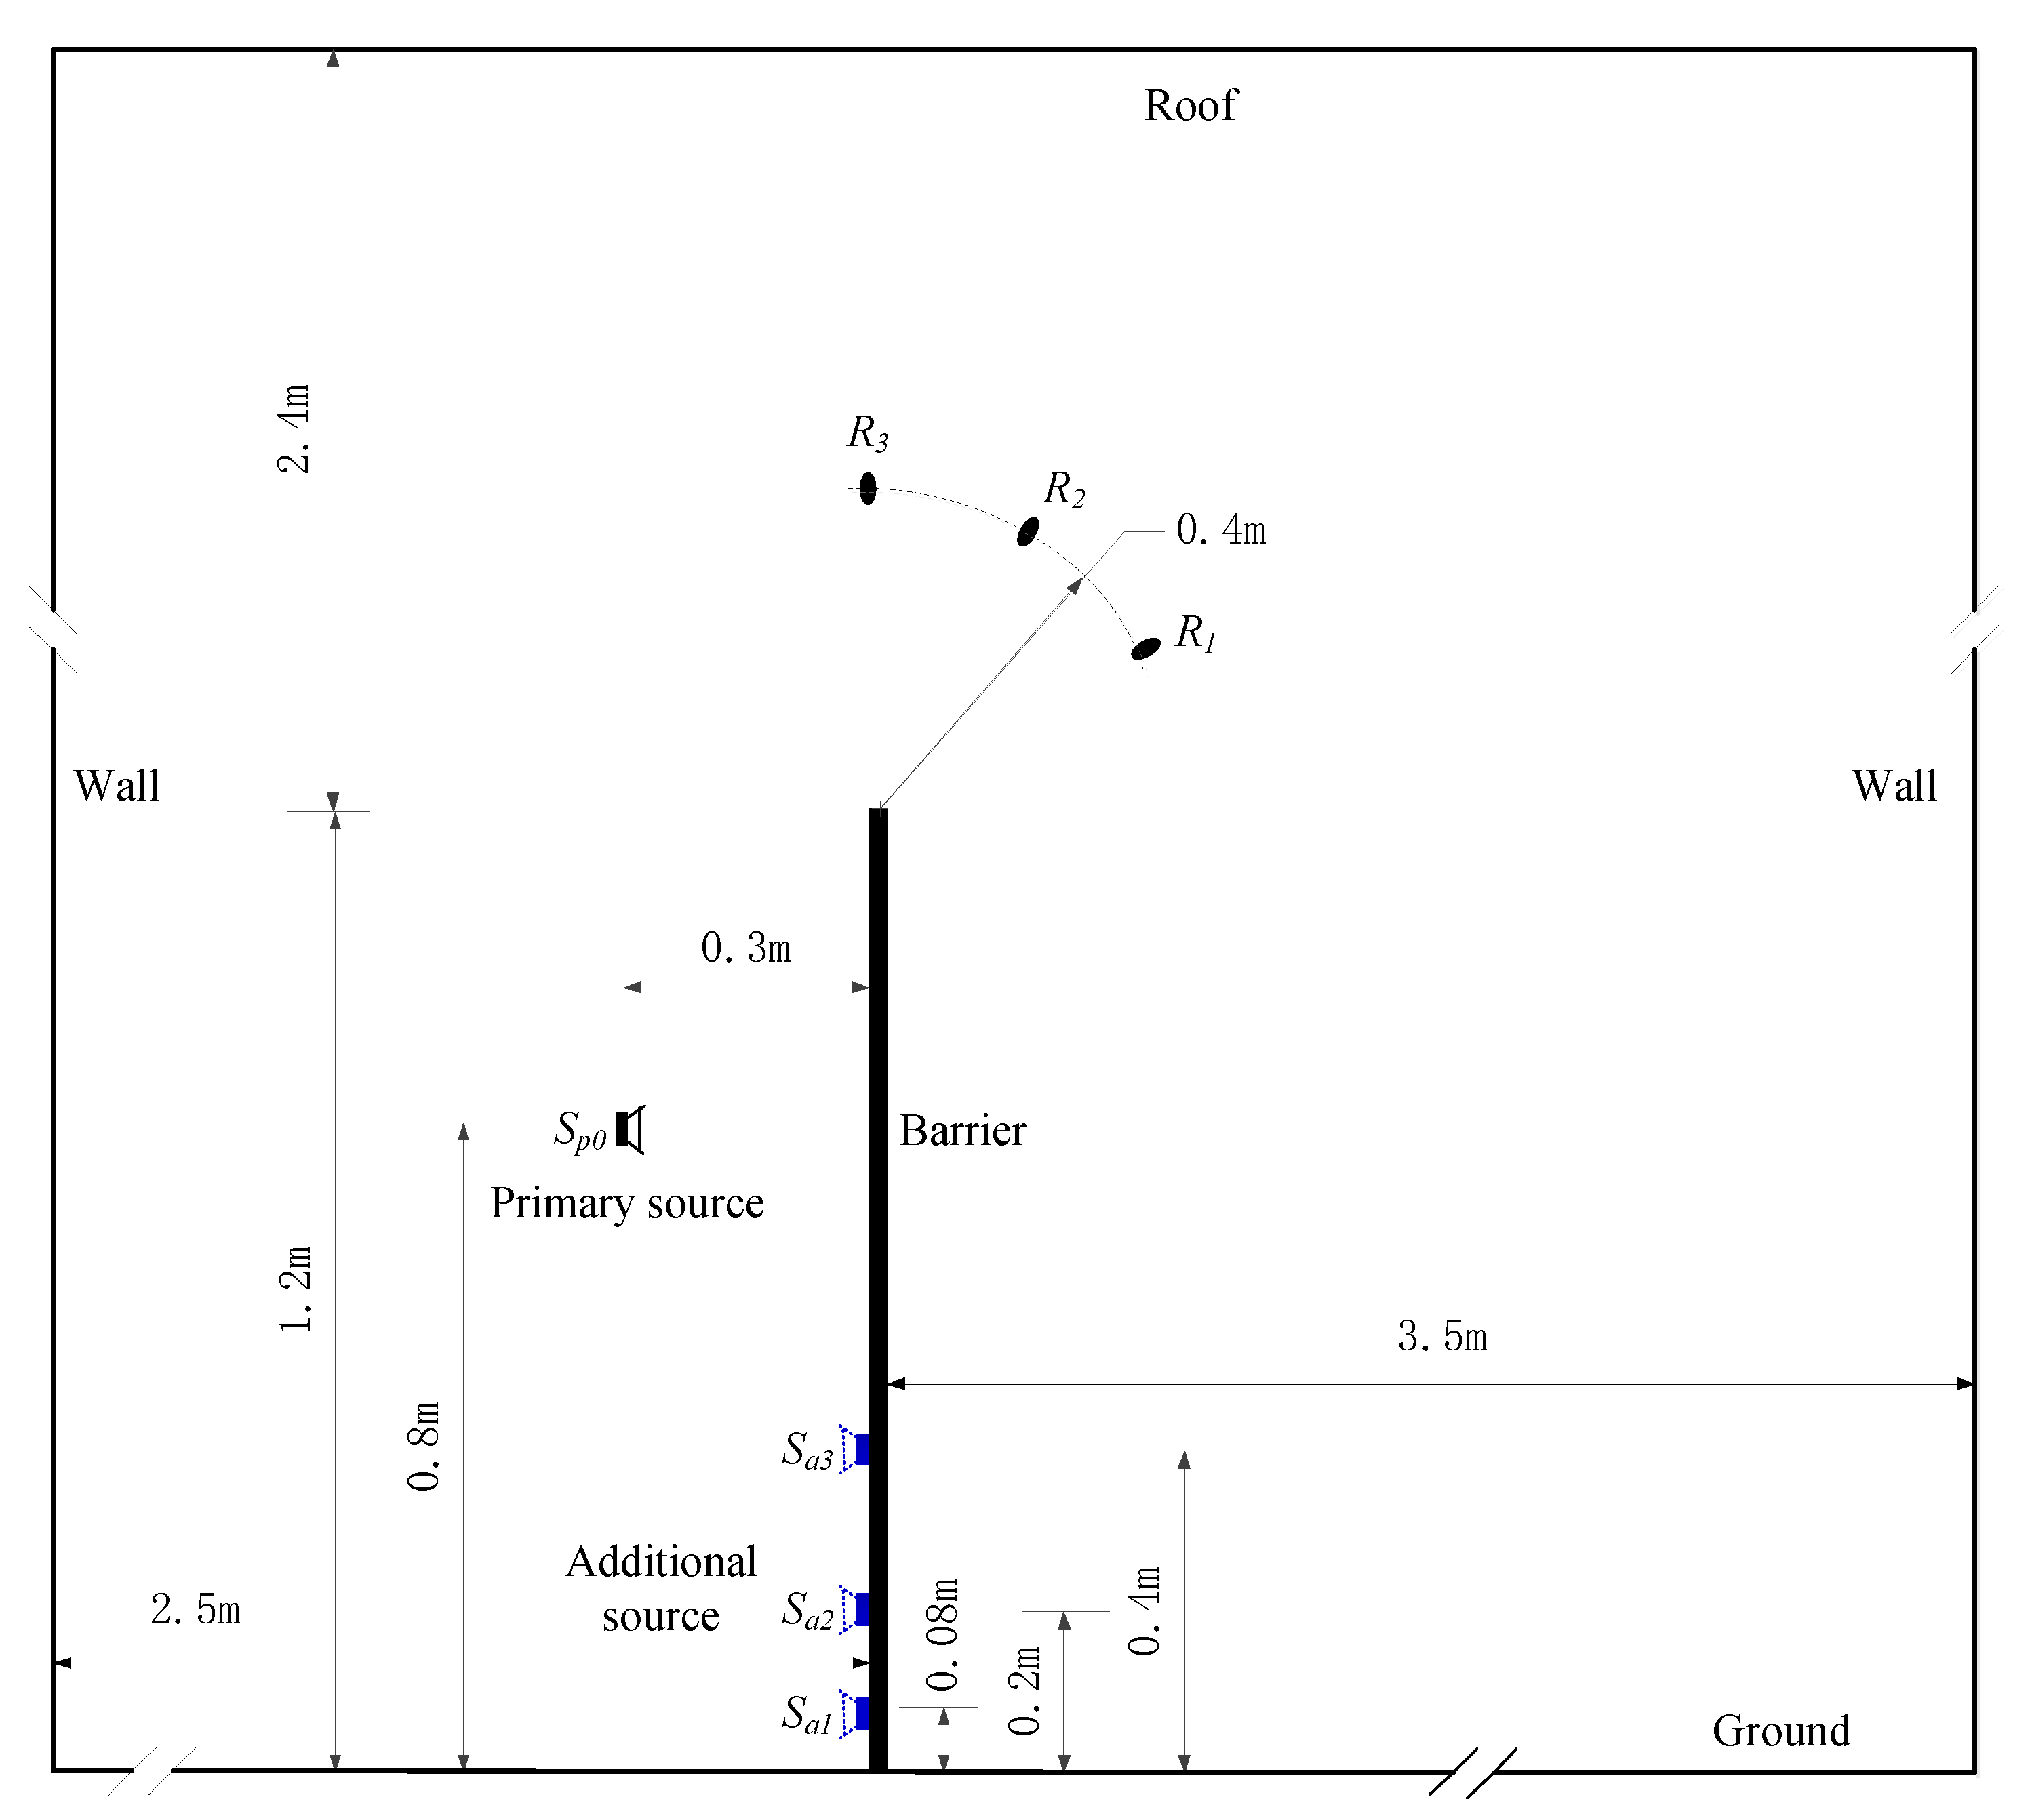
Figure 10.
The SPLs measured at the frequency of 125 Hz, 250 Hz, 500 Hz, and 1000 Hz.

Table 1.
The ideal location for each frequency.
| Frequency\Location | 0.3 m | 0.5 m | 1 m |
|---|---|---|---|
| 500 Hz | • | ||
| 630 Hz | • | ||
| 800 Hz | • | • | |
| 1000 Hz | • | • |
Table 2.
The overall SPLs measured at the receivers.
| Group\Receiver | R1 (dBA) | R2 (dBA) | R3 (dBA) |
|---|---|---|---|
| first | 55.52 | 57.73 | 52.63 |
| second | 54.56 | 52.78 | 51.78 |
| third | 57.64 | 54.88 | 53.58 |
Disclaimer/Publisher’s Note: The statements, opinions and data contained in all publications are solely those of the individual author(s) and contributor(s) and not of MDPI and/or the editor(s). MDPI and/or the editor(s) disclaim responsibility for any injury to people or property resulting from any ideas, methods, instructions or products referred to in the content. |
© 2024 by the authors. Licensee MDPI, Basel, Switzerland. This article is an open access article distributed under the terms and conditions of the Creative Commons Attribution (CC BY) license (https://creativecommons.org/licenses/by/4.0/).
Share and Cite
MDPI and ACS Style
Wang, Y.; Chang, Z.; Chen, G.; Liu, J. Research on the Arrangement of Additional Source for Large Space Protection of an Active Noise Barrier. Appl. Sci. 2024, 14, 885. https://doi.org/10.3390/app14020885
AMA Style
Wang Y, Chang Z, Chen G, Liu J. Research on the Arrangement of Additional Source for Large Space Protection of an Active Noise Barrier. Applied Sciences. 2024; 14(2):885. https://doi.org/10.3390/app14020885
Chicago/Turabian StyleWang, Yanpeng, Zhibo Chang, Guoqiang Chen, and Jiahao Liu. 2024. "Research on the Arrangement of Additional Source for Large Space Protection of an Active Noise Barrier" Applied Sciences 14, no. 2: 885. https://doi.org/10.3390/app14020885
Note that from the first issue of 2016, this journal uses article numbers instead of page numbers. See further details here.