
Exploring Deep Neural Networks in Simulating Human Vision through Five Optical Illusions

1
Graduate School of Engineering, Kochi University of Technology, Kami 782-8502, Kochi, Japan
2
School of Informatics, Kochi University of Technology, Kami 782-8502, Kochi, Japan
*
Author to whom correspondence should be addressed.
Appl. Sci. 2024, 14(8), 3429; https://doi.org/10.3390/app14083429
Submission received: 29 March 2024
/
Accepted: 15 April 2024
/
Published: 18 April 2024
Abstract
:Recent research has delved into the biological parallels between deep neural networks (DNNs) in vision and human perception through the study of visual illusions. However, the bulk of this research is currently constrained to the investigation of visual illusions within a single model focusing on a singular type of illusion. There exists a need for a more comprehensive explanation of visual illusions in DNNs, as well as an expansion in the variety of illusions studied. This study is pioneering in its application of representational dissimilarity matrices and feature activation visualization techniques for a detailed examination of how five classic visual illusions are processed by DNNs. Our findings uncover the potential of DNNs to mimic human visual illusions, particularly highlighting notable differences in how these networks process illusions pertaining to color, contrast, length, angle, and spatial positioning. Although there are instances of consistency between DNNs and human perception in certain illusions, the performance distribution and focal points of interest within the models diverge from those of human observers. This study significantly advances our comprehension of DNNs’ capabilities in handling complex visual tasks and their potential to emulate the human biological visual system. It also underscores the existing gaps in our understanding and processing of intricate visual information. While DNNs have shown progress in simulating human vision, their grasp of the nuance and intricacy of complex visual data still requires substantial improvement.
1. Introduction
Visual illusions, as fascinating phenomena, have long been a hot topic in psychological and neuroscience research. These illusions reveal the limitations and characteristics of the human visual perception system in processing visual information [1,2]. Traditional studies of visual illusions emphasize the subjectivity and complicated internal mechanisms of the brain in processing visual stimuli [3,4]. These studies provide critical insights into how the human brain interprets complex visual environments, aiding our understanding of perceptual biases that may arise under various environmental conditions.
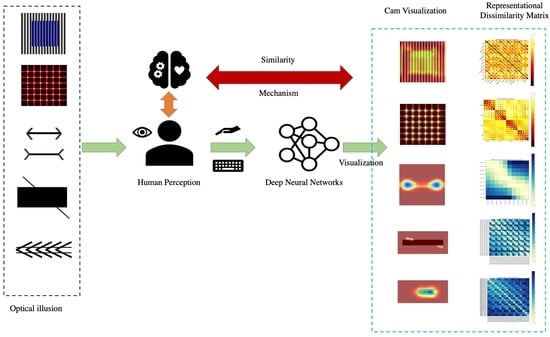
With the advent of deep neural networks (DNNs), inspired by the structural and functional aspects of the human brain, and the development of interdisciplinary approaches combining neuroscience and artificial intelligence, researchers have begun to leverage these computational models to simulate and probe into the brain’s processing of visual information [5,6]. This mutual inspiration and influence signify an integrative evolution of neuroscience and AI, offering novel insights and innovative possibilities to both fields (Figure 1A).
Particularly, convolutional neural networks (CNNs), a subtype of DNNs, have demonstrated remarkable capabilities in a variety of visual tasks, mirroring the brain’s hierarchical organization to manage complex visual patterns [7,8]. This synergy has not only deepened our theoretical understanding of visual processing but also introduced fresh methodologies for visual illusion studies. For example, employing DNNs to simulate visual illusions has shed light on their utility in decoding facets of human visual perception, with some models exhibiting responses strikingly similar to human behavior [9,10,11,12]. Such comparisons enrich our comprehension of the neural substrates underlying visual illusions and hint at underlying computational principles that could be mimicked in visual systems [13,14].
This burgeoning field intersection not only redefines our grasp of the human visual system but also propels AI research forward, demonstrating that emulating the brain’s visual information processing approach can lead to advanced visual cognitive functions in AI [15,16]. Concurrently, it equips neuroscientists with innovative tools to dissect complex visual phenomena [17,18]. However, the quest to perfectly replicate the nuanced and diverse nature of human perception in DNNs reveals the models’ current limitations and underscores the vast uncharted territories in both domains [19,20].
Despite deep neural network (DNN) strides in approximating human visual processing, their application in exploring visual illusions remains surprisingly narrow, typically confined to demonstrating the presence of illusions in isolated models. For instance, Ward et al. (2019) [21] utilized DNNs for binary classification to discern the presence of visual illusions, identifying the possibility of illusion in the Müller-Lyer illusion, yet failing to demonstrate the presence of illusions in four other geometric visual illusions. This approach underscores the limitations of relying on single models to test and explain phenomena, given the plethora of brain-like DNN architectures available. Similarly, Sun (2021) [11] observed visual illusions in the context of ImageNet but was unable to explain why these illusions occur in DNNs. These examples highlight the need for a more comprehensive approach that encompasses multiple models and types of illusions to better understand the phenomenon and its implications for both artificial and human vision.
Addressing this gap, our study pioneers the examination of 5 classic visual illusions—color assimilation, Hermann grid, Müller-Lyer, Zöllner, and Poggendorff—through 12 DNNs, utilizing the brain score and brain hierarchy score for evaluation [22,23,24]. These illusions span a diverse array of visual processing facets, from color and light perception to spatial and geometric interpretation, offering a rich landscape for assessing DNNs’ simulation capabilities.
Furthermore, through representational similarity analysis (RSA) and class activation mapping (CAM) techniques, we delve into the intricacies of how DNNs recognize and react to these illusions, comparing their feature attention mechanisms against human perception [25,26,27]. Our exploration not only uncovers the internal dynamics of DNNs in processing geometric visual illusions but also benchmarks different models’ performances, shedding light on both shared and unique aspects of human and machine visual perception.
Our study extends the insight on visual illusions in DNNs, demonstrating that while significant strides have been made, the exploration to fully understand and replicate the complexity of human vision is far from over. By broadening the scope of research to include a wider range of illusions and employing a comparative approach across multiple DNN models, we edge closer to unraveling the understanding of the human visual system.
2. Materials and Methods
2.1. Participant Characteristics
Thirteen male subjects (mean age = 27.08, sd = 2.6) were recruited for the visual illusion experiment. All participants were confirmed to be free of color blindness and had normal or corrected-to-normal vision. Moreover, to ensure a diverse understanding of visual perception, none of the subjects had prior experience with the visual illusions experienced in the experiment. This study was approved by the Human Research Ethics Committee of Kochi University of Technology and followed the relevant guidelines and regulations. We obtained written informed consent from all participants involved in the study.
2.2. Optical Illusions
Optical illusions are a key research topic in the field of visual perception, helping us understand the workings and limitations of the human visual system. In this study, to broaden the spectrum of investigated phenomena and contribute to a more comprehensive understanding of visual illusions, we employed five classic visual illusions: color assimilation, the Hermann grid illusion, the Müller-Lyer illusion, the Zöllner illusion, and the Poggendorff illusion (Figure 2).
The color assimilation illusion, as shown in Figure 2A, showcases the influence of adjacent colors on our visual perception. This phenomenon is exemplified by the appearance of squares in three distinct hues against a striped background. Conversely, the Hermann grid illusion, presented in Figure 2B, features a grid pattern interspersed with white dots. At the grid intersections, ephemeral dots emerge, unveiling our visual system’s approach to light contrast and edge delineation. The Müller-Lyer illusion (Figure 2C) employs lines terminated by differing arrow configurations to illustrate the impact of contextual indicators on length perception, whereby the inclusion of varied arrows modifies the perceived length of a line. Similarly, the Zöllner illusion (Figure 2D) induces a perception of misalignment in lines obscured by rectangles, underscoring our visual system’s challenges in discerning line orientation and parallelism. The Poggendorff illusion (Figure 2E), meanwhile, engenders a distorted perception of line angles contingent on arrow placement, shedding light on our visual processing of spatial positioning and alignment. By studying these illusions, we can gain a deeper understanding of the mechanisms of human visual perception and its similarities and differences with DNNs, especially in terms of color, brightness contrast, size, and spatial relationship processing.
Based on the variable factors of these five visual illusions, we set the parameters for each (Figure 2, Table 1). For color assimilation, we used 12 colors based on the RGB color wheel, with backgrounds of alternating black, gray, and white stripes which generate three hues of original color(three different depths) for the square colors, totaling 36 stimuli. In the Hermann grid illusion, we set five sizes of white dots (6~10) and five grayscale levels ( = 1~5) from white to black, and four grid colors (red, green, blue, gray), totaling 100 stimuli. For the Müller-Lyer illusion, we set lines of 200 to 380 pixels (20 increments) with matching inward and outward arrows, totaling 20 stimuli. The Zöllner illusion had seven rectangle widths (120~240, interval = 20) and five angles (15°, 30°, 45°, 60°, 75°), totaling 35 stimuli. In the Poggendorff illusion, we set six angles (30°, 40°, 45°, 55°, 60°, 75°), three arrow spacings (15, 25, 35), and line positions in three areas (, , ) (Figure 2E), totaling 54 stimuli.
2.2.1. Stimuli and Procedures
The experiment was conducted in a dark room using an HP monitor (HP P244 23.8-inch, refresh rate: 60 Hz, resolution: 1920 × 1080). The subjects’ head positions were stabilized using a chin rest (Tobii Pro AB), ensuring the same viewing angle and distance for all participants, 65 cm from the screen. Before the formal experiment, all subjects underwent practice and testing, and were instructed to observe and adjust based on visual perception only. The experiment was conducted using Matlab(vR2023a) and the Psychtoolbox [28] (v3.0.19).
Stimuli for color assimilation, the Hermann grid illusion, the Müller-Lyer illusion, the Zöllner illusion, and the Poggendorff illusion were presented in sequence, divided into five groups with 5-min breaks in between. The experiment was controlled using ASD keys, as well as the space and enter keys. Specific operations were as follows:
- Color assimilation: Each round displayed a group of colored squares and corresponding three depths with black, gray, and white striped backgrounds, with WASD displayed as labels on the screen (Figure 2A). Subjects were asked to observe the squares labeled ASD (corresponding to depths 1 to 3) and the original color on the right, and rank them from the highest to the lowest similarity. The pressed space to enter the next group.
- Hermann grid illusion: 100 stimuli images were randomly displayed (Figure 2B), with ASD corresponding to “Clear”, “Weak”, “None”. The subjects chose based on their perception of flickering dots. They pressed the chosen option to proceed to the next round.
- Müller-Lyer illusion: Lines 200 to 380 pixels (20 increments) were randomly displayed at the top of the screen. Below them, lines with inward or outward arrows of random lengths were shown (Figure 2C). Subjects observed the lines and adjusted the length of the arrowed lines using WASD; AD for larger adjustments (±10 pixels) and WS for smaller adjustments (±1 pixels). They pressed space to proceed.
- Zöllner illusion: 35 stimuli were randomly displayed in the middle of the screen (Figure 2D). In each round, a line parallel to (and at the same angle as) the line above the rectangle was shown below it, randomly positioned along the bottom of the rectangle. Subjects adjusted the lower line’s position until it visually aligned with the upper line. AD is for larger adjustments, WS is for smaller. They pressed space to proceed.
- Poggendorff illusion: 54 stimuli randomly appeared at the top of the screen, with two parallel, horizontal lines below them (Figure 2E). Subjects adjusted the angle of the lower lines based on the perceived angle of the line in the upper stimulus. They pressed ENTER to switch the control between lines. AD is for larger adjustments (±0.1°), WS is for smaller (±0.02°). Adjustments were optional; they pressed space to proceed.
2.2.2. Brain-like Deep Neural Networks
In this study, we aimed to bridge the gap between artificial intelligence and human cognitive science by focusing on the functional mapping relationship between deep neural networks (DNNs) and the human visual ventral pathway [23]. The high similarity between CNNs and the human early visual cortex in terms of regional mapping correlation reveals the similarity between the advanced layers of DNNs and the advanced regions of human brain visual processing in terms of visual recognition and understanding. This perspective provides a theoretical foundation for us to comprehensively evaluate the ability of DNNs in simulating the human visual system by considering both brain hierarchy (BH) scores [24] and brain score [22,23] rankings. A basic DNN model can be represented as a series of layers, each being a nonlinear transformation of the previous layer. The specific expression of DNNs can be represented as follows:
⋮
where:
- x is the input vector.
- is the output of the ith hidden layer.
- and are the weight and bias of the ith layer, respectively.
- is the activation function, such as ReLU or Sigmoid.
- y is the output vector.
We selected models with a single-path sequential feedforward architecture and extensive spatial integration features proposed based on BH scores (Figure 3), such as the Inception series (Inception_v3 [15], Inception_v4 [15]), AlexNet [7], and VGG series [8] (VGG16, VGG19). At the same time, for a more comprehensive perspective in evaluation, we also considered the ResNet and DenseNet series with high brain score rankings (including ResNetv2_50 [29], ResNetv2_101 [29], ResNet152 [16], ResNext_v2 [30], DenseNet121 [31], DenseNet169 [31], DenseNet201 [31]). This selection method is aimed at balancing two important but sometimes contradictory scoring systems: BH scores focus on assessing the brain-like characteristics of the model in hierarchical processing, while brain score evaluates the model’s similarity to the brain across multiple dimensions, including but not limited to image recognition capabilities. Brain score measures the overall ’brain-likeness’ of a model by its alignment with neural and behavioral measurements, thereby providing a comprehensive assessment of the model’s ability to simulate the human brain’s processing of visual information.
These models were deployed utilizing PyTorch’s torchvision package (v0.11.2) and the timm package [32] (v0.6.11), facilitating standardization and accessibility while harnessing PyTorch’s efficiency and adaptability. These pre-trained models were trained on large image datasets (such as ImageNet [33]), which not only saved substantial training resources but also performed excellently in simulating human visual processing tasks due to their optimization in processing a rich array of visual features.
Table 2 shows the pre-trained weights and total model parameters of each model.
2.2.3. Representational Dissimilarity Matrices
We utilized representational dissimilarity matrices (RDMs) as a novel approach to analyze and compare the response patterns of human behavioral data and deep neural networks (DNNs) when processing the same visual inputs. This method allows for a direct and quantifiable comparison between human and artificial visual processing, highlighting both similarities and discrepancies in their interpretation of visual stimuli.
Initially, we collected human response data to specific visual stimuli, reflecting behavioral response patterns when observing different images. Subsequently, the same visual stimuli were input into DNNs to obtain the network’s responses to these stimuli. This step is crucial as it allows for a direct comparison between human and model perception. RDMs are constructed using Euclidean distance, extracting feature vectors from the last layer before the classification layer. The Euclidean distance (L2 distance) between different feature vectors is calculated to construct the matrix. Considering the differences among the five visual illusions in the experiment, unconventional RDMs were constructed for three of the illusions, separate from color assimilation and the Hermann grid illusion. That is, feature vectors of both stimulus images and adjusted perceptual images were extracted, where the horizontal and vertical axes correspond to stimulus images and perceptual images (perception data adjusted after observation by human subjects).
The construction of specific RDMs is as follows:
- Color assimilation: A 48 × 48 RDM composed of 12 colors.
- Hermann grid illusion: A 25 × 25 RDM for each color, corresponding to different parameter combinations.
- Müller-Lyer illusion: A 10 × 10 RDM, based on the direction of arrows in perception data.
- Zöllner illusion: A 54 × 54 RDM, based on stimulus images and adjusted perceptual images.
- Poggendorff illusion: A 35 × 35 RDM, also based on stimulus images and adjusted perceptual images.
Overall, the construction equation for RDMs is expressed as follows:
where represents the distance between the ith and jth rows in the matrix, and are the values of the ith and jth feature vectors in the kth dimension, respectively.
By computing RDMs, we can compare these responses in a multidimensional space. Each RDM represents the differences between a set of stimuli and perceptual images, calculated based on either human behavioral responses or DNN outputs. This enables us to intuitively observe similarities and differences in processing the same visual information between humans and DNNs, including how they handle visual illusions compared to standard perceptual processing. Furthermore, by analyzing RDMs, we can explore the capability of DNNs in simulating human visual cognition, especially in handling complex, variable, or ambiguous visual information. The effectiveness of RDMs in distilling complex, high-dimensional data into a comprehensible, two-dimensional format provides a clear visual indication of whether the DNN’s internal representations align with human susceptibility to visual illusions. This analysis not only enhances our understanding of human visual processing mechanisms but also provides guidance for improving and optimizing the design of DNNs. By drawing closer parallels or distinctions with human visual processing, especially in identifying illusion-like phenomena within DNNs, we can gain insights into the underlying mechanisms.
2.2.4. Cam Visualization
To further understand the internal mechanisms of the network, and to draw parallels with human visual processing we utilized class activation mapping (CAM) visualization techniques, including Grad-CAM and Grad-CAM++ with their guided backpropagation, to explore the internal decision processes of deep neural networks (DNNs) in processing visual information. These techniques enable us to generate heatmaps of images, showing the areas of focus when the network makes decisions. The specific equation is as follows:
where:
- is the importance weight of category c for feature map .
- is the kth feature map of a specific convolutional layer.
- The ReLU function is used to retain features that positively influence category c and remove features that have a negative influence.
2.2.5. Proposed Visualization
We also combine RDM and CAM as new frames to clearly show the proposed visualization method. The integration equation for combining RDMs and CAM is conceptualized as follows:
where:
- x represents the input visual stimulus.
- and denote the feature vectors derived from DNNs and human perceptual data, respectively, for the input x.
- calculates the representational dissimilarity matrix for the given pairs of feature vectors, representing the multidimensional quantitative dissimilarities.
- signifies the activation maps for category c when processing input x through a DNN.
- generates the CAM heatmap based on the activation maps, highlighting regions of interest for the specific category.
- ⊗ represents an operation that overlays or integrates the dissimilarity information from RDMs onto the spatial heatmap generated by CAM, thus combining multidimensional dissimilarity with spatial attention cues.
3. Results
3.1. Color Assimilation
Color assimilation [34] refers to the perceptual changes in the hue of a color square when positioned against various backgrounds. Specifically, when the square is placed against backgrounds comprising black, gray, and white stripes, this leads to distinct variations in color perception. Based on the square’s location relative to these backgrounds, it shows three color hues in the base color. Consequently, we have categorized the three positions of the square against the background as depth1, depth2, and depth3, as illustrated in Figure 2A. This section presents participants’ perceptual rankings of three distinct color depths (labeled as depth1, depth2, and depth3 in Figure 2A) across a wheel of 12 colors and the DNN performance in ranking these three depths in 12 colors.
The data from participants, who observed a square of 12 colors and their corresponding three depths and then ranked the depths, are presented as average frequencies, as shown in Figure 4A, where each depth of the 12 colors corresponds to a specific ranking. These rankings reflect the perceived similarity between the color depth and the original color. A larger number on the axis indicates that the color depth is more similar to the color of the square. The results show that all colors ranked highest at depth2, suggesting that this depth is visually closest to the original color. Overall, the frequency of rankings is primarily concentrated in two configurations: depth (231) and (213).
In the color assimilation test involving the 12 models for the 12 colors, we extracted the feature vectors for each primary color and its corresponding color depth from the last convolutional layer of each model. We then calculated their L2 distances to assess their similarity. Based on these similarity data, we also conducted a ranking classification, as shown in Figure 4B. The ranking order presents six different combinations of depth ranking, with each number representing a color depth. Figure 2B shows the distribution of color rankings for each model. According to the high-frequency human rankings depth (231) and (213), only ResNetv2_101 [29] and VGG16 [8] show higher frequencies in these two rankings. In addition, the most frequently occurring ranking across all models is “312”.
We also presented the representational dissimilarity matrix (RDM) [25] heatmaps of 12 models for the 12 colors (Figure 5). The darker the color in the heatmap, the higher the similarity. Each color corresponds to the original color square and its depths from depth1 to depth3, forming a 4 × 4 matrix. From the heatmap, it can be observed that ResNet_v2 with “pre-activation” architecture exhibits deep red across almost all areas, indicating that this model may not be particularly sensitive to color. Similarly, VGG16, despite its similarity in human perceptual rankings, also displays this characteristic. In contrast, other models within the ResNet series demonstrate more pronounced color differentiation capabilities, especially outside the heatmap’s diagonal regions.
Among the colors in the high-frequency human ranking depths (231) and (213), green appeared most frequently across the 12 models. We visualized the different depths of green using CAM (class activation mapping) [26,27] to explore the network’s decision-making and feature preferences. As shown in Figure 6, most models focused, to some extent, on the inner color square, but VGG16 and VGG19 were exceptions. ResNext101 [30] focused on the features of the entire square at each color depth. Other models showed a preference for focusing on the features of the square’s edges or certain middle areas. Moreover, the most frequently occurring red color also showed a similar pattern across the 12 models (see Figure A1), but with more models tending to focus on the middle area and edges of the square. Additionally, as can be seen from Figure 4C, at the shallow layers (primary modules), all models showed a high frequency of depth (132) ranking. However, as the depth of the network increased, the models began to show rankings of multiple different depths, indicating that models have different color sensitivities at various depths.
3.2. Hermann Grid Illusion
The strength of the Hermann grid illusion is categorized into three clarity levels: clear, weak, and none. The illusion is associated with four colors, as well as five point sizes and five color gradient depths (ranging from white to black). The gradient depth is denoted from (1) to (5) to show the depth of the color of the point. (1) is white and (5) is black. As shown in Figure 7A, the results indicate that the perception of flickering dots is the most intense within the white gradient depths from (1) to (3). Flickering dots are perceived at the (1) depth in all four colors. As gradient intensity increases, the perception of flickering dots gradually weakens, with green grids showing the most significant perception from (1) to (3). Additionally, an increase in the dot size also leads to a weaker perception of flickering dots. Participants report that the perception of “Weak” flickering dots resembles that of gray dots, but less clear than the “Clear” level.
Subsequently, 12 deep neural networks (DNNs) processed these four colors of grid images, and experiments were conducted. Using the (1) depth (dot size 6) of the four colors as a baseline, the L2 distance of feature vectors was calculated for other gradient depths and dot size combinations of the same color compared to the baseline. As illustrated in Figure 7B, all 12 models initially showed an upward trend as the gradient intensified from white to black. However, a downward trend subsequently appeared in gray grids across all models. Generally, as gradient depth increased and white transitioned to black, the similarity decreased, i.e., L2 distance increased, usually in a monotonic presentation. However, it was observed that the trend was not unidirectional (only increasing or decreasing) but exhibited a more complex pattern with increasing gradient depth. The downward trend suggests that the models might have made judgments similar to flickering dots, and the slope of the decline could reflect the perception intensity of flickering dots. It is evident from the graph that the flickering dot perception was most pronounced in gray grids, while green and red grids (to a lesser extent) also showed similar perceptions. In contrast, blue grids showed almost no perception of flickering dots. Specifically, Inception_v4 displayed a decreasing and then increasing trend in green grids, possibly indicating a judgment similar to “Clear” but weaker than black flickering dots. A similar trend was also observed in the gray grids of DenseNet121 [31] (dot sizes 7 and 8) and ResNetv2_101. Under different dot sizes, the trend showed a positive correlation; the larger the dot size, the weaker the perception of flickering dots. Overall, the 12 models exhibited diverse perceptions of flickering dots in the four colors of grids, with most models showing weaker perception (lower slope). In the DenseNet series, flickering dot perception in gray, red, and green grids was more marked.
We then developed a representational dissimilarity matrix (RDM) for each color grid, as depicted in Figure 8A and Figure A2–Figure A4, following the Kriegeskorte method (2013) [25]. Analysis of these RDMs revealed structural similarities across the four color grids, with distinct variations in representational similarity across different gradient depths. Specifically, within the gray grid’s RDM, we identified distinct rectangular areas showing heightened similarity at intermediate gradient depths, notably between (3) and (4). This pattern suggests that these gradient depths may trigger a flickering dot perception in the models. Interestingly, as representational similarity increased between (4) and (5), the models’ flickering dot perception appeared to diminish, indicating a nuanced shift in perception with changing gradient conditions. For the blue grid, a high level of representational similarity was observed at shallower gradient depths, which might account for the reduced presence of flickering dots. Conversely, the other color grids exhibited fewer high-similarity areas at the shallowest gradients, (1) and (2). Specifically, models from the AlexNet [7] and VGG series [8] demonstrated increased similarity in the lower right corner of their RDMs, suggesting a potential decrease in sensitivity to color grid variations. Meanwhile, models from the DenseNet series [31] showed distinct low similarity regions in the lower left and upper right corners of the gray grid’s RDM, indicating a more nuanced and differentiated processing of color grids across gradient depths.
In Figure 8B, the feature tendencies of different models when processing Hermann grid illusion images are displayed [26,27]. Through Grad-CAM analysis, it was found that VGG series models mainly focus on each intersection of the grid image, while models performing better in flickering dot perception, such as the DenseNet and Inception series, tend to focus more on the edges of the grid and show weaker feature preferences for the middle dots. In contrast, the AlexNet model’s focal points are concentrated on the fence-like structures formed between the dots. When analyzed with Grad-CAM++, models that effectively identified flickering dots tended to focus on features of squares and intersections inside the grid, while those with weaker or no clear performance in perceiving flickering dots showed almost no significant changes. Subsequently, tests were conducted on the performance of flickering dot perception at different network depths, as shown in Figure 9. Using the image of (1) depth with dot size 6 as a baseline, the impact of dot size changes at different network depths on L2 distance was calculated. The graph shows that—at the same network depth—changes in dot size had almost no effect on L2 distance. However, as network depth increased, the non-monotonic change trend became more pronounced in deeper networks, possibly reflecting a significance in processing similar to human perception of flickering dots at deeper network levels.
3.3. Müller-Lyer Illusion
After collecting data on participants’ perceived lengths of lines in the Müller-Lyer illusion [35], we quantified the degree of visual illusion, which is the difference between the perceived length and the actual length. As shown in Figure 10A, significant differences in the degree of visual illusion were observed between inward-pointing arrows (represented by light green bar graphs) and outward-pointing arrows (represented by pink bar graphs) under different length standards. Specifically, the visual illusion caused by outward-pointing arrows was positive, whereas that by inward-pointing arrows was negative. This means that visually, lines with outward-pointing arrows seemed shorter than their actual length, while lines with inward-pointing arrows appeared longer. In other words, to visually match the actual length standard, lines with outward-pointing arrows needed to be adjusted longer than their actual length, and those with inward-pointing arrows shorter.
We calculated the Euclidean distance between the feature vectors of the perceived lines of inward and outward-pointing arrows after adjustment by users and constructed a representational dissimilarity matrix (RDM) [25], as shown in Figure 11A. The horizontal axis of the RDM represents lines with outward-pointing arrows, and the vertical axis represents lines with inward-pointing arrows. All lines correspond to the average perceived lengths after adjustment, meaning the perceived lengths visually equaled the actual lengths. The results showed that DenseNet169/201, VGG16/19 exhibited high similarity at the diagonal, indicating these networks’ highly similar representations of perceived lines with inward and outward-pointing arrows, reflecting a human-like performance in the visual illusion of length variation. In Figure 11B, a control group was similarly set up, with the axes still representing lines with outward- and inward-pointing arrows. However, here, the line lengths corresponded to actual length labels, e.g., a length label of 200 indicating an actual length of 200. Interestingly, apart from ResNetv2_50, other networks that showed human-like visual illusions exhibited shifts above the diagonal. This indicates that even with lines of the same length, the addition of opposite arrows led the models to make different length judgments, i.e., produce visual illusions. This further confirms the human-like perception performance of the models at the diagonal in Figure 11A. Under variations in network depth (Figure 10C), the perceived lines matched the actual lengths of the control group (right side), generally maintaining a similar trend, further indicating the models’ human-like perception in visual illusions.
When applying the visual CAM method [26,27], models that exhibited visual illusions were observed in Grad-CAM and Grad-CAM++ to focus on features of both the line itself and the arrows (Figure 10B). The focus was mainly on the overall or partial features of the arrows and the line, with some attention to the line in the middle area. In contrast, models that did not exhibit visual illusions mostly focused only on the arrows or the line and the overall features of the image. This difference indicates the cause of the models’ perception of the Müller-Lyer illusion.
3.4. Poggendorff Illusion
In the Poggendorff illusion [36] experiment, participants were asked to adjust the position of the lower line to visually align with the upper line, while observing different angles of the upper line and different widths of rectangular covering. The perceived position of each participant was recorded and averaged against the actual position. As shown in Figure 12A, the greater the angle between the upper line and the rectangular covering, the smaller the position deviation. As the width of the rectangular covering increases, the actual distance deviation at each angle fluctuates slightly, but the deviation at an angle of 15 degrees shows a more significant change. Overall, participants tend to adjust the line to the left to achieve visual alignment of the line.
Based on the average deviation values of the position, we regarded them as the perceived images after user adjustment. Then we extracted feature vectors between the actual position images of the true lines and perceived images in the last convolutional layer of the 12 models, calculating Euclidean distances to construct a representational dissimilarity matrix (RDM) [25], as shown in Figure 12C. Surprisingly, all models showed high similarity along the diagonal. The difference was that each model’s RDM near the diagonal presented multiple parallel lines of high similarity. Combined with the visualization heatmaps based on the CAM method (Figure 13) [26,27], the VGG series and AlexNet all showed feature tendencies towards the lines, as did Inception_v3 and ResNet152. Other models tended to focus on the rectangle or the overall image. Correspondingly, those models focusing on line features in the RDM showed multiple clear parallel lines of high similarity apart from the diagonal, with lower similarity in other areas. In contrast, models not particularly focusing on line features in the RDM presented multiple areas of high similarity, with weaker similarity outside the diagonal. Although the high similarity of all models along the diagonal indicates human-like judgments of visual illusions, these differences reflect whether the models truly focus on and understand the visual illusion phenomena in the images. Additionally, in the Euclidean distance analysis at different depths (Figure 12B), as network depth increased, deeper networks typically showed lower similarity values compared to shallower networks, possibly indicating a more complex mechanism of judgment of visual illusions at deeper levels of the models.
The exploration of the Poggendorff illusion highlights the sophisticated capability of DNNs to approximate human visual illusion perception, albeit with notable differences in sensitivity and processing depth. The alignment of DNN responses with human perception trends, particularly in terms of line adjustment and position deviation, underscores the models’ potential in simulating human visual processing. However, the variance in representational similarity and focus points across models underscores the importance of model-specific adjustments and enhancements to more closely replicate human visual illusion experiences.
3.5. Zöllner Illusion
In the Zöllner illusion [37] experiment, participants adjusted angles to reflect their degree of visual perception, thereby indicating the strength of the illusion. These adjusted angles were averaged and shown in Figure 14A, the average perceived angles varied under different arrow spacings and angles. The perceived angles were larger, typically exceeding 0.5 degrees when the arrow angles were 30 and 40 degrees. For other angles, the perceived angles fluctuated around 0 degrees, indicating almost no visual illusion. Additionally, the perception of the lines in different areas of the arrows (ABC in Figure 14A) also showed differences. Generally, the perceived angles of the lines were relatively larger at the middle position of the arrows (position 2 in Figure 2D, A in Figure 14). The perceived angle values of the two lines showed almost completely opposite trends, with similar magnitudes.
Then we generated perceptual images by using these averaged perceived angles, which were then compared with the stimulus images through a representational dissimilarity matrix (RDM) analysis [25]. As shown in Figure 14C, high similarity was observed at the diagonal in all 12 models. However, visualizations generated through the CAM method (Figure 15) [26,27] indicated that almost all models highly focused on the overall combination of arrows and lines, rather than the lines alone. The diagonal similarity in the RDMs of these models suggests that there are differences between the stimulus and perceived images as a whole, and these differences are also reflected in the CAM heatmaps, showing the comparison and perception of the overall images rather than angles. In terms of the Zöllner illusion, this does not conclusively prove that deep neural networks (DNNs) exhibit visual illusions. In Figure 14B, we observed that the overall trends at different network depths were similar to those of the Poggendorff illusion (Figure 14B), which might indicate that deep neural networks are more sensitive to the physical distance of lines rather than angular differences.
4. Discussion
In this study, we utilized representational similarity analysis (RSA) and class activation mapping (CAM) visualization methods to delve into how brain-like deep neural networks (DNNs) respond to and process various visual illusions. We observed that DNNs display both similarities and differences with the human visual system in processing colors, contrasts, lengths, angles, and spatial relationships. For example, the high representational similarity of VGG19 RDMs constructed based on human perceptual data and stimulus data shows that DNNs produce length variation patterns similar to those seen in humans (Figure 11A,B). Also, the clear difference in the color ranking distribution of all DNNs in Figure 4B highlights the differences and gaps between DNNs and human perception. Specifically, by analyzing perception data from color assimilation, Hermann grid, Müller-Lyer, Zöllner, and Poggendorff illusions (as shown in Figure 4 and Table 1), we evaluated whether DNNs exhibit responses similar to humans. RSA revealed the sensitivity of DNNs to specific features or patterns that might cause visual illusions. Post hoc interpretability methods like Grad-CAM or Grad-CAM++ helped us identify and visualize specific regions of interest that DNNs focus on while processing these illusions. Our experiments suggest that DNNs can certainly exhibit responses similar to human visual illusions. Particularly in Müller-Lyer and Poggendorff illusions, the high diagonal similarity in RDM and unified areas of attention revealed unique mechanisms in the model’s decision-making process regarding visual illusions (see Figure 8B, Figure 9, Figure 10C and Figure 11). However, in the Zöllner illusion, despite the high representational similarity, CAM visualizations showed that models fail to comprehend angular differences and only focus on the whole (see Figure 15), highlighting the limitations of DNNs in processing visual information. In the color assimilation experiment, some models were able to simulate human-like perception rankings (as shown in Figure 4), demonstrating DNNs’ capability in simulating basic visual processing. However, in the analysis of the Hermann grid illusion, we found that the models’ response patterns were non-monotonic, and the distribution of visual illusion responses significantly differed from human perception (see Figure 7), highlighting the limitations of DNNs in simulating complex visual phenomena.
Previous studies on topics like the brain score [22,23] and the brain BH score [24] have shown the potential for deep neural networks in simulating the human brain. As models that emulate the visual ventral stream, the architectural differences of DNNs significantly affect their effectiveness in visual tasks. These differences are reflected not only in the perception of visual illusions but also in how networks process complex visual information. The BH score emphasizes that networks with simpler, more uniform structures, such as AlexNet [7] and VGG series [8], have relatively higher brain-like indices. However, in the brain score, which combines brain-like scores from V1 to IT areas, these models rank lower compared to some like residual networks or deeper networks. Considering that deep neural networks (DNNs) pre-trained on large image datasets have been used to mimic human brain learning patterns, this study selects 12 pre-trained models (Figure 3), taking both standards into account.
Further analysis suggests these differences may stem from varying model architectures. For example, the VGG series, with a higher BH score, excelled in illusions involving length and spatial positioning but struggled with more complex image structures (like grid images or color assimilation features), focusing only on single-point features or rectangle edges (see Figure 6, Figure 8B and Figure A1–Figure A4). This is likely due to the VGG series’ architecture focusing on consecutive convolution operations, making it proficient in processing single-dimensional shape features. However, this structure is limited when facing complex image structures, as it focuses only on single-point features or rectangular edges and is unable to fully capture subtle color changes. The Müller-Lyer illusion, involving distortion in length perception where angles between lines affect length judgment, saw VGG16 and VGG19 performing well, effectively revealing their understanding of length and spatial relationships by focusing on the combination of arrows and lines. The more structurally simplistic AlexNet did not show significant visual illusion responses. In contrast, the higher-ranking brain score ResNet series showed high representational similarity between different colors in the color assimilation experiment (see Figure 4). This might be due to the pre-activation modules in ResNet architecture, allowing effective feature transmission at deeper levels but possibly reducing sensitivity to color details. In the Hermann grid experiment, all ResNet models [16,29,30] showed only weak responses to gray grid flickering dots, reflecting limitations in processing complex visual information. However, in the Poggendorff illusion, ResNet152, with its deep network and complex feature extraction capabilities, successfully focused on line features in the feature heatmap, demonstrating its advantages in processing certain visual illusions. The DenseNet series [31] showed increasing representational dissimilarity in color assimilation with increasing architectural size, possibly due to DenseNet’s dense connection strategy effectively capturing subtle color changes. However, despite some level of visual illusion response in Hermann grid and Müller-Lyer illusions, DenseNet’s performance in the Poggendorff illusion was not significant, suggesting limitations in processing more complex spatial relationships. The Inception series [15] showed varied performance in color assimilation and Hermann grid illusions. For instance, Inception v3 performed better than v4 in the Hermann grid illusion, possibly due to its modular design being more adapted to this specific task. However, in the Müller-Lyer illusion, neither showed significant visual illusion responses, possibly due to limitations of the Inception models in processing length and spatial positioning. In the Poggendorff illusion, v3 showed more focus on line features than v4, possibly indicating its stronger capability in processing visual illusions.
To understand the internal mechanisms of DNNs, we conducted a detailed analysis of 12 models at 6 different depth levels. In the color assimilation experiment, these models showed a consistent color processing pattern at the primary layer (see Figure 4C, depth 1), indicating similar color recognition strategies in early processing stages across different models. Notably, this early layer similarity might reflect a shared foundational mechanism in color processing, analogous to findings by Gomez-Villa et al. (2020) [38], who observed that CNNs trained for low-level visual tasks demonstrate human-like responses to brightness and color illusions. However, they also highlighted a divergence in illusion perception between CNNs and human vision, emphasizing the limitations of linear models and the complex, nonlinear behavior of more sophisticated network architectures. Figure 4C illustrates the highest frequency ranking changes of color depth under varying depths in DNNs, with most models undergoing significant changes in color processing strategies beyond the initial layer. This is in contrast to Gomez-Villa et al.’s observation that simple CNNs exhibit features akin to the human visual system, such as center-surround receptive fields. Our analysis further shows that only DenseNet121 and DenseNet169 maintained the same 132 ranking as the initial layer for many colors, underscoring a potential consistency with biological visual systems at early layers. However, the evolution of color processing strategies in deeper layers, and the ResNet_v2 series’ differentiation changes post the initial layer, signify a departure from early similarities. Interestingly, Engilberge et al. (2017) [39] and our findings highlight the initial high color sensitivity in DNNs, aligning with the biological visual system’s basic color processing mechanisms. Yet, as Gomez-Villa et al. (2020) articulate, the quest to model human vision through CNNs must navigate the intricate balance between linear approximations and the divergent outcomes of nonlinear, flexible architectures. This juxtaposition not only provides a deeper understanding of DNNs’ color processing capabilities but also highlights the challenges in creating models that fully encapsulate the complexity of human vision [40].
In the Hermann grid illusion, models showed non-monotonic changes at deeper network layers (Figure 9), while in the earlier layers, there was a monotonic increase in dissimilarity. This suggests that this type of visual illusion, under the same mapping in the ventral pathway, particularly in later stages like V4/IT, leads to the perception of illusions. This finding aligns with Kriegeskorte’s (2015) research [41], suggesting the higher-level structures of DNNs play a key role in mimicking advanced human visual processing mechanisms. However, this contrasts with the explanation of the Hermann grid illusion being caused by the responses of simple S1-type cells in the primary visual cortex to the grid [42].
In the Müller-Lyer illusion, across different network depths of DNNs (Figure 10C), there were minimal changes between the initial and deeper layers, with a slight increase in representational similarity, except for a few models. The currently prevailing explanation is that the Müller-Lyer illusion results from the interaction between the ventral and dorsal streams in response to length variation [43]. Similarly, the Poggendorff illusion, which involves IPS and LOC, is not solely a result of the ventral stream [44]. From Figure 12B, the Poggendorff illusion also exhibits minor representational similarity differences between initial and deeper layers. This may indicate that the ventral pathway, in processing Müller-Lyer and Poggendorff illusions, is not limited to basic processing of visual information but involves more complex spatial relationships and shape perceptions at deeper levels. Although there are minor differences in representational similarity between initial and deeper layers, these differences may reflect the capabilities and limitations of DNNs in mimicking the human visual system’s ventral pathway. The ventral pathway plays a key role in object recognition and categorization, as well as in processing illusions; it may reveal the depth and complexity of neural networks in understanding and interpreting visual information. Furthermore, this suggests that deep learning models require further optimization and adjustment to more accurately mimic the complex mechanisms of the human brain in processing illusions.
In the Zöllner illusion, despite feature heatmaps showing that models could not differentiate angular differences of lines (Figure 15), focusing only on overall representational similarity, analysis through RDM and changes in network depth yielded results similar to the Müller-Lyer and Poggendorff illusions. This further suggests that while DNNs may not fully replicate the detail processing in biological visual systems, they can replicate some basic illusion phenomena in human vision to some extent. This indicates that DNNs have made some progress in emulating the functions of the ventral pathway (responsible for object recognition and shape processing). However, this similarity might be limited to the manifestation of illusions, and there remain significant differences in the underlying mechanisms of illusions between human visual systems and DNNs. These observed differences may stem from unique strategies used by neural networks in processing the color, shape, and spatial positioning, and inherent limitations in attempting to mimic the complexity of the human visual system. This underscores the need for deeper adjustments and optimization of DNN architectures and processing mechanisms in future research to more precisely emulate the complex processes of the human brain in processing visual information.
Based on human behavioral data, DNNs can emulate certain functions of the human ventral pathway, especially in processing more direct visual tasks like color assimilation and Hermann grid illusions. However, in more complex visual scenes, such as the Poggendorff illusion, DNNs show clear limitations in emulating the advanced visual processing capabilities of the ventral pathway. The ventral pathway is a key part of the human visual system for object recognition and scene understanding [45], playing a crucial role in processing complex visual information. The results (Figure 9, Figure 10C and Figure 12B) suggest that while DNNs show potential in emulating the ventral pathway in processing some visual illusions, their capabilities in higher-level visual cognitive functions still need improvement.
Recalling our study, as for datasets, we utilize deep neural network (DNN) models that have been pre-trained on extensive and varied image datasets, such as ImageNet. These models demonstrate exceptional proficiency in handling a broad spectrum of visual features, showcasing their versatility across diverse visual processing tasks. However, this approach also unveils the intrinsic challenge of employing general-purpose models to emulate specific visual phenomena, such as illusions. According to the high representational similarity of DNNs (deep neural networks) in RDMs (representational dissimilarity matrices), further evidence supports the findings of Ward (2019) that the Müller-Lyer illusion is manifested in DNNs. However, it also highlights a potential issue, namely, that DNNs themselves are incapable of understanding illusion tasks. This problem is evident from the feature heatmap of the Zöllner illusion (Figure 15). The use of feature heatmaps underscores a critical problem identified in previous research—the illusion performance of DNNs is related to whether they are trained and the nature of the training set itself.
This revelation underscores a critical avenue for future research: the development of models and training datasets that more accurately reflect the unique attributes and principles underlying various visual illusions [46]. To deepen our understanding and simulation of human visual perception, future research would benefit from the utilization of datasets meticulously curated to encompass imagery with explicit perspectives, shapes, and color contrasts. Such precise enhancements are likely to significantly bolster the models’ capabilities in recognizing and accurately simulating visual illusions. Furthermore, the exploration and potential creation of new DNN architectures, designed to more effectively grasp the complexities of these phenomena, represent another promising direction. These architectural advancements could facilitate a more detailed emulation of the sophisticated mechanisms of human visual perception, indicating the potential for DNNs to more precisely mimic human visual processing mechanisms in the future by refining training datasets and model frameworks. Our study enriches the understanding of DNNs’ capacity to manage complex vision tasks, particularly in mimicking biological vision systems. Despite some advancements, these findings also highlight DNNs’ limitations in comprehending and processing complex visual information, signaling the necessity for ongoing research and optimization.
5. Conclusions
This study explores the ability of deep neural networks (DNNs) to simulate human visual illusions. Utilizing representational similarity analysis (RSA) and class activation mapping (CAM), this research uncovers the similarities and differences in how DNNs and the human visual system process visual illusions. These illusions pertain to aspects such as color, contrast, length, angle, and spatial positioning. Upon analyzing various pre-trained models’ responses to five visual illusions—color assimilation, Hermann grid, Müller-Lyer, Zöllner, and Poggendorff—we found that these models demonstrate human-like responses, particularly excelling with the Müller-Lyer and Hermann grid illusions. However, the varied performances among different DNN models highlight their distinct capabilities and limitations in processing visual information. Specifically, the notable differences between DNNs and human perception of visual illusions enhance our understanding of DNNs’ visual processing abilities and underscore their limitations in simulating human cognitive processes. Future research should aim to integrate specific illusion datasets to delve into the mechanisms behind visual illusions. This endeavor seeks to narrow the divide between DNNs and human visual perception, enriching our understanding of cognitive processes.
Author Contributions
Conceptualization H.Z. and S.Y.; methodology, H.Z.; software, H.Z.; validation, H.Z.; formal analysis, H.Z.; writing—original draft preparation, H.Z. and S.Y.; writing—review and editing, S.Y.; visualization, H.Z.; supervision, S.Y.; funding acquisition, S.Y. All authors have read and agreed to the published version of the manuscript.
Funding
This work was supported by JSPS KAKENHI, grant numbers JP22K12786, JP22K19650, JP21H03553, JP22H03699, and JP20H00267. There was no additional external funding received for this study.
Institutional Review Board Statement
This study was approved by the Human Research Ethics Committee of Kochi University of Technology and followed the relevant guidelines and regulations (protocol code: 265; date of approval: 17 June 2022).
Informed Consent Statement
We obtained written informed consent from all participants involved in the study.
Data Availability Statement
Data: The datasets of illusion using DNNs in this work are publicly available. All illusion datasets are available on OSF (https://osf.io/s2cm9/, accessed on 5 April 2024). Code: The source codes for reproducing the results in this study are available at GitHub (https://github.com/Vison-eden/optical-illusion, accessed on 5 April 2024). Additional information: Any additional information required to reanalyze the data reported in this work paper is available from the lead contact upon request.
Conflicts of Interest
The authors declare no conflicts of interest.
Appendix A
Figure A1.
The heatmap of feature attention on the red depth1/2/3.

Figure A2.
The representational dissimilarity of the blue grid.

Figure A3.
The representational dissimilarity of the green grid.

Figure A4.
The representational dissimilarity of the red grid.

References
- Eagleman, D.M. Visual illusions and neurobiology. Nat. Rev. Neurosci. 2001, 2, 920–926. [Google Scholar] [CrossRef] [PubMed]
- Ramachandran, V.S.; Hubbard, E.M. Synaesthesia—A window into perception, thought and language. J. Conscious. Stud. 2001, 8, 3–34. [Google Scholar]
- Gregory, R.L. Knowledge in perception and illusion. Philos. Trans. R. Soc. London. Ser. Biol. Sci. 1997, 352, 1121–1127. [Google Scholar] [CrossRef] [PubMed]
- Lotto, R.B.; Purves, D. The empirical basis of color perception. Conscious. Cogn. 2002, 11, 609–629. [Google Scholar] [CrossRef] [PubMed]
- LeCun, Y.; Bengio, Y.; Hinton, G. Deep learning. Nature 2015, 521, 436–444. [Google Scholar] [CrossRef] [PubMed]
- Goodfellow, I.; Bengio, Y.; Courville, A. Deep Learning; MIT Press: Cambridge, MA, USA, 2016. [Google Scholar]
- Krizhevsky, A.; Sutskever, I.; Hinton, G.E. Imagenet classification with deep convolutional neural networks. Adv. Neural Inf. Process. Syst. 2012, 25, 1097–1105. [Google Scholar] [CrossRef]
- Simonyan, K.; Zisserman, A. Very deep convolutional networks for large-scale image recognition. arXiv 2014, arXiv:1409.1556. [Google Scholar]
- Watanabe, E.; Kitaoka, A.; Sakamoto, K.; Yasugi, M.; Tanaka, K. Illusory motion reproduced by deep neural networks trained for prediction. Front. Psychol. 2018, 9, 345. [Google Scholar] [CrossRef] [PubMed]
- Zhang, H.; Yoshida, S.; Li, Z. Decoding Illusion Perception: A Comparative Analysis of Deep Neural Networks in the Müller-Lyer Illusion. In Proceedings of the 2023 IEEE International Conference on Systems, Man, and Cybernetics (SMC), Honolulu, HI, USA, 1–4 October 2023; pp. 1898–1903. [Google Scholar] [CrossRef]
- Sun, E.D.; Dekel, R. ImageNet-trained deep neural networks exhibit illusion-like response to the Scintillating grid. J. Vis. 2021, 21, 15. [Google Scholar] [CrossRef] [PubMed]
- Zhang, H.; Yoshida, S.; Li, Z. Brain-like illusion produced by Skye’s Oblique Grating in deep neural networks. PLoS ONE 2024, 19, e0299083. [Google Scholar] [CrossRef] [PubMed]
- Yamins, D.L.; DiCarlo, J.J. Using goal-driven deep learning models to understand sensory cortex. Nat. Neurosci. 2016, 19, 356–365. [Google Scholar] [CrossRef] [PubMed]
- Cadieu, C.F.; Hong, H.; Yamins, D.L.; Pinto, N.; Ardila, D.; Solomon, E.A.; Majaj, N.J.; DiCarlo, J.J. Deep neural networks rival the representation of primate IT cortex for core visual object recognition. PLoS Comput. Biol. 2014, 10, e1003963. [Google Scholar] [CrossRef] [PubMed]
- Szegedy, C.; Liu, W.; Jia, Y.; Sermanet, P.; Reed, S.; Anguelov, D.; Erhan, D.; Vanhoucke, V.; Rabinovich, A. Going deeper with convolutions. In Proceedings of the IEEE Conference on Computer Vision and Pattern Recognition, Boston, MA, USA, 12 June 2015; pp. 1–9. [Google Scholar]
- He, K.; Zhang, X.; Ren, S.; Sun, J. Deep Residual Learning for Image Recognition. In Proceedings of the 2016 IEEE Conference on Computer Vision and Pattern Recognition (CVPR), Las Vegas, NV, USA, 1 July 2016; pp. 770–778. [Google Scholar] [CrossRef]
- DiCarlo, J.J.; Zoccolan, D.; Rust, N.C. How does the brain solve visual object recognition? Neuron 2012, 73, 415–434. [Google Scholar] [CrossRef] [PubMed]
- Yamins, D.L.; Hong, H.; Cadieu, C.F.; Solomon, E.A.; Seibert, D.; DiCarlo, J.J. Performance-optimized hierarchical models predict neural responses in higher visual cortex. Proc. Natl. Acad. Sci. USA 2014, 111, 8619–8624. [Google Scholar] [CrossRef] [PubMed]
- Szegedy, C.; Zaremba, W.; Sutskever, I.; Bruna, J.; Erhan, D.; Goodfellow, I.; Fergus, R. Intriguing properties of neural networks. arXiv 2013, arXiv:1312.6199. [Google Scholar]
- Nguyen, A.; Yosinski, J.; Clune, J. Deep neural networks are easily fooled: High confidence predictions for unrecognizable images. In Proceedings of the 2015 IEEE Conference on Computer Vision and Pattern Recognition (CVPR), Boston, MA, USA, 12 June 2015; pp. 427–436. [Google Scholar] [CrossRef]
- Ward, E.J. Exploring perceptual illusions in deep neural networks. BioRxiv 2019, 19, 687905. [Google Scholar]
- Schrimpf, M.; Kubilius, J.; Hong, H.; Majaj, N.J.; Rajalingham, R.; Issa, E.B.; Kar, K.; Bashivan, P.; Prescott-Roy, J.; Geiger, F.; et al. Brain-score: Which artificial neural network for object recognition is most brain-like? BioRxiv 2018. BioRxiv:407007. [Google Scholar] [CrossRef]
- Schrimpf, M.; Kubilius, J.; Lee, M.J.; Murty, N.A.R.; Ajemian, R.; DiCarlo, J.J. Integrative benchmarking to advance neurally mechanistic models of human intelligence. Neuron 2020, 108, 413–423. [Google Scholar] [CrossRef] [PubMed]
- Nonaka, S.; Majima, K.; Aoki, S.C.; Kamitani, Y. Brain hierarchy score: Which deep neural networks are hierarchically brain-like? IScience 2021, 24, 103013. [Google Scholar] [CrossRef] [PubMed]
- Kriegeskorte, N.; Kievit, R.A. Representational geometry: Integrating cognition, computation, and the brain. Trends Cogn. Sci. 2013, 17, 401–412. [Google Scholar] [CrossRef] [PubMed]
- Selvaraju, R.R.; Cogswell, M.; Das, A.; Vedantam, R.; Parikh, D.; Batra, D. Grad-cam: Visual explanations from deep networks via gradient-based localization. In Proceedings of the IEEE International Conference on Computer Vision, Cambridge, MA, USA, 20–23 June 2017; pp. 618–626. [Google Scholar]
- Chattopadhay, A.; Sarkar, A.; Howlader, P.; Balasubramanian, V.N. Grad-cam++: Generalized gradient-based visual explanations for deep convolutional networks. In Proceedings of the 2018 IEEE Winter Conference on Applications of Computer Vision (WACV), Lake Tahoe, NV, USA, 15 March 2018; pp. 839–847. [Google Scholar] [CrossRef]
- Brainard, D.H.; Vision, S. The psychophysics toolbox. Spat. Vis. 1997, 10, 433–436. [Google Scholar] [CrossRef]
- He, K.; Zhang, X.; Ren, S.; Sun, J. Identity mappings in deep residual networks. In Proceedings of the Computer Vision—ECCV 2016: 14th European Conference, Amsterdam, The Netherlands, 11–14 October 2016; pp. 630–645. [Google Scholar] [CrossRef]
- Xie, S.; Girshick, R.; Dollár, P.; Tu, Z.; He, K. Aggregated residual transformations for deep neural networks. In Proceedings of the IEEE Conference on Computer Vision and Pattern Recognition, Honolulu, HI, USA, 26 July 2017; pp. 1492–1500. [Google Scholar]
- Huang, G.; Liu, Z.; Van Der Maaten, L.; Weinberger, K.Q. Densely Connected Convolutional Networks. In Proceedings of the 2017 IEEE Conference on Computer Vision and Pattern Recognition (CVPR), Honolulu, HI, USA, 26 July 2017; pp. 2261–2269. [Google Scholar] [CrossRef]
- Wightman, R. PyTorch Image Models. 2019. Available online: https://github.com/rwightman/pytorch-image-models (accessed on 5 April 2024).
- Deng, J.; Dong, W.; Socher, R.; Li, L.J.; Li, K.; Fei-Fei, L. Imagenet: A large-scale hierarchical image database. In Proceedings of the 2009 IEEE conference on computer vision and pattern recognition, Miami, FL, USA, 20 June 2009; pp. 248–255. [Google Scholar] [CrossRef]
- Pinna, B.; Brelstaff, G.; Spillmann, L. Surface color from boundaries: A new ‘watercolor’ illusion. Vis. Res. 2001, 41, 2669–2676. [Google Scholar] [CrossRef] [PubMed]
- Berry, J.W. Ecology, perceptual development and the Müller-Lyer illusion. Br. J. Psychol. 1968, 59, 205–210. [Google Scholar] [CrossRef] [PubMed]
- Day, R.; Dickinson, R. The components of the Poggendorff illusion. Br. J. Psychol. 1976, 67, 537–552. [Google Scholar] [CrossRef] [PubMed]
- Oyama, T. Determinants of the Zöllner illusion. Psychol. Res. 1975, 37, 261–280. [Google Scholar] [CrossRef] [PubMed]
- Gomez-Villa, A.; Martín, A.; Vazquez-Corral, J.; Bertalmío, M.; Malo, J. Color illusions also deceive CNNs for low-level vision tasks: Analysis and implications. Vis. Res. 2020, 176, 156–174. [Google Scholar] [CrossRef] [PubMed]
- Engilberge, M.; Collins, E.; Süsstrunk, S. Color representation in deep neural networks. In Proceedings of the 2017 IEEE International Conference on Image Processing (ICIP), Beijing, China, 20 September 2017; pp. 2786–2790. [Google Scholar] [CrossRef]
- Flachot, A.; Gegenfurtner, K.R. Color for object recognition: Hue and chroma sensitivity in the deep features of convolutional neural networks. Vis. Res. 2021, 182, 89–100. [Google Scholar] [CrossRef] [PubMed]
- Kriegeskorte, N. Deep neural networks: A new framework for modeling biological vision and brain information processing. Annu. Rev. Vis. Sci. 2015, 1, 417–446. [Google Scholar] [CrossRef] [PubMed]
- Schiller, P.H.; Carvey, C.E. The Hermann grid illusion revisited. Perception 2005, 34, 1375–1397. [Google Scholar] [CrossRef] [PubMed]
- Shen, L.; Zhang, M.; Chen, Q. The Poggendorff illusion driven by real and illusory contour: Behavioral and neural mechanisms. Neuropsychologia 2016, 85, 24–34. [Google Scholar] [CrossRef] [PubMed]
- Plewan, T.; Weidner, R.; Eickhoff, S.B.; Fink, G.R. Ventral and dorsal stream interactions during the perception of the Müller-Lyer illusion: Evidence derived from fMRI and dynamic causal modeling. J. Cogn. Neurosci. 2012, 24, 2015–2029. [Google Scholar] [CrossRef] [PubMed]
- Grill-Spector, K.; Malach, R. The human visual cortex. Annu. Rev. Neurosci. 2004, 27, 649–677. [Google Scholar] [CrossRef] [PubMed]
- Todorović, D. Polarity-dependent orientation illusions: Review, model, and simulations. Vis. Res. 2021, 189, 54–80. [Google Scholar] [CrossRef] [PubMed]
Figure 1.
Interdisciplinary: Learning relationship between neuroscience based on human behavior and deep learning. (A) Bidirectional interaction between deep neural networks, the brain, and human behavior: Deep neural networks draw inspiration from the brain’s functions and attempt to imitate its cognitive processes, while the brain uses its neuroplasticity to influence and control human behavior, which in turn provides data and scenarios for cognitive understanding and behavioral modeling of deep neural networks. (B) DNNs and the human brain are considered as two biologically similar structures, exploring potential similarities in visual interpretation.

Figure 2.
Experiments with human subjects based on 5 geometric visual illusions. (A) Color assimilation: 12 colored squares in alternating black, gray, and white striped backgrounds, divided into 3 depths. The task is to rank the similarity in color between the 3 depths and the square. (B) Hermann grid: Flickering dot illusion with a black background and grid. The grid has 4 colors, with 5 different dot sizes. The task is to select the perceived flickering dots. (C) Müller-Lyer illusion: The illusion of straight lines with arrows pointing outward and inward. The task is to adjust the length labels of the two types of arrows to visually match the length of the straight lines with actual length labels. (D) Zöllner illusion: The illusion of arrows combined with two straight line. The task is to observe the stimulus and adjust the perceived angle of the horizontal line to match the stimulus. (E) Poggendorff illusion: The illusion formed by a black rectangle and straight lines. The task is to adjust the line below the rectangle until it visually aligns with the line above.

Figure 3.
Brain-like deep neural networks and mapping relationships.

Figure 4.
Behavioral data on color assimilation, model testing, and frequency ranking of different depths in the model. (A) Human subjects’ rankings of color similarity for 12 colors at different depths compared to the original color square. (B) Frequency ranking of color similarity for 12 colors in DNNs. (C) The most frequent color similarity ranking distribution across six network depths in DNNs.

Figure 5.
RDMs of 12 colors in DNNs. The horizontal and vertical axes represent 12 colors, each corresponding to a square and three depths. The darker the heatmap color, the higher the representational similarity.
Figure 5.
RDMs of 12 colors in DNNs. The horizontal and vertical axes represent 12 colors, each corresponding to a square and three depths. The darker the heatmap color, the higher the representational similarity.

Figure 6.
Class activation heatmaps of 12 DNNs for 3 depths of green. Each model corresponds to Grad-CAM/Grad-CAM++ and their guided backpropagation, with red class activation heatmaps provided in Figure A1.
Figure 6.
Class activation heatmaps of 12 DNNs for 3 depths of green. Each model corresponds to Grad-CAM/Grad-CAM++ and their guided backpropagation, with red class activation heatmaps provided in Figure A1.

Figure 7.
Behavioral data distribution of the Hermann grid, perceptual testing in DNNs. (A) Distribution of the intensity of flickering dots in the Hermann grid for different colors as perceived by subjects. (B) Representational similarity changes in the model for the Hermann grid based on (1)/Dot_size(6), under different grid colors and gradient depth changes.

Figure 8.
RDMs of DNNs under different colored grids, class activation heatmap for the gray grid. (A) Horizontal and vertical axes represent four grid colors, each corresponding to a combination of dot size and gradient depth. Darker colors indicate higher representational similarity. (B) Class activation heatmap for gray, the most prominent color for flickering dots in DNNs. Class activation heatmaps for the other three colors are in Figure A2–Figure A4.

Figure 9.
Perceptual performance of flickering dots at different network depths in DNNs.

Figure 10.
Distribution of perceived length in the Müller-Lyer illusion, class activation heatmap for perceived length testing, L2 distance changes at different network depths. (A) The difference between perceived length and actual label length as observed by subjects. Pink represents arrows pointing outward; light green denotes inward. The vertical axis shows the average actual difference. (B) Class activation heatmap of straight lines with inward and outward arrows under perceived length groups in DNNs. (C) The left graph shows representational similarity changes between perceived length groups and actual length groups at different depths in DNNs; the right graph denotes the control group.

Figure 11.
Representational dissimilarity matrix of perceived length groups and control groups in DNNs. (A) The horizontal axis represents straight lines with outward arrows; the vertical axis represents inward arrows. All line lengths correspond to their respective average perceived lengths, darker colors indicate higher representational similarity. (B) The horizontal axis denotes outward arrow lines; the vertical axis denotes inward. All line lengths correspond to their actual length labels, darker colors indicate higher representational similarity.

Figure 12.
Distribution of perceived angles in the Poggendorff illusion, the response of DNNs to visual illusions at different network depths, and the representational dissimilarity matrix in DNNs. (A) Average distribution of perceived positions of the lower line by subjects, corresponding to three line positions ABC and two lines D and E. (B) Representational differences between actual and perceived position groups in DNNs at different network depths. (C) The horizontal axis corresponds to images of actual position groups; the vertical axis corresponds to perceived position groups; darker colors indicate higher representational similarity.

Figure 13.
Class activation heatmap of DNNs for images of perceived positions of lines and rectangles at a 30-degree angle.
Figure 13.
Class activation heatmap of DNNs for images of perceived positions of lines and rectangles at a 30-degree angle.

Figure 14.
Distribution of perceived data in the Zöllner illusion, the response of DNNs to visual illusions at different network depths, representational dissimilarity matrix in DNNs. (A) Average distribution of perceived angles as observed by subjects. (B) Representational differences between perceived angle images and stimulus images in DNNs at different network depths. (C) The horizontal axis corresponds to stimulus images; the vertical axis corresponds to perceived angle images; darker colors indicate higher representational similarity.

Figure 15.
Class activation heatmap of DNNs for stimulus images of arrows at a 15-degree angle.


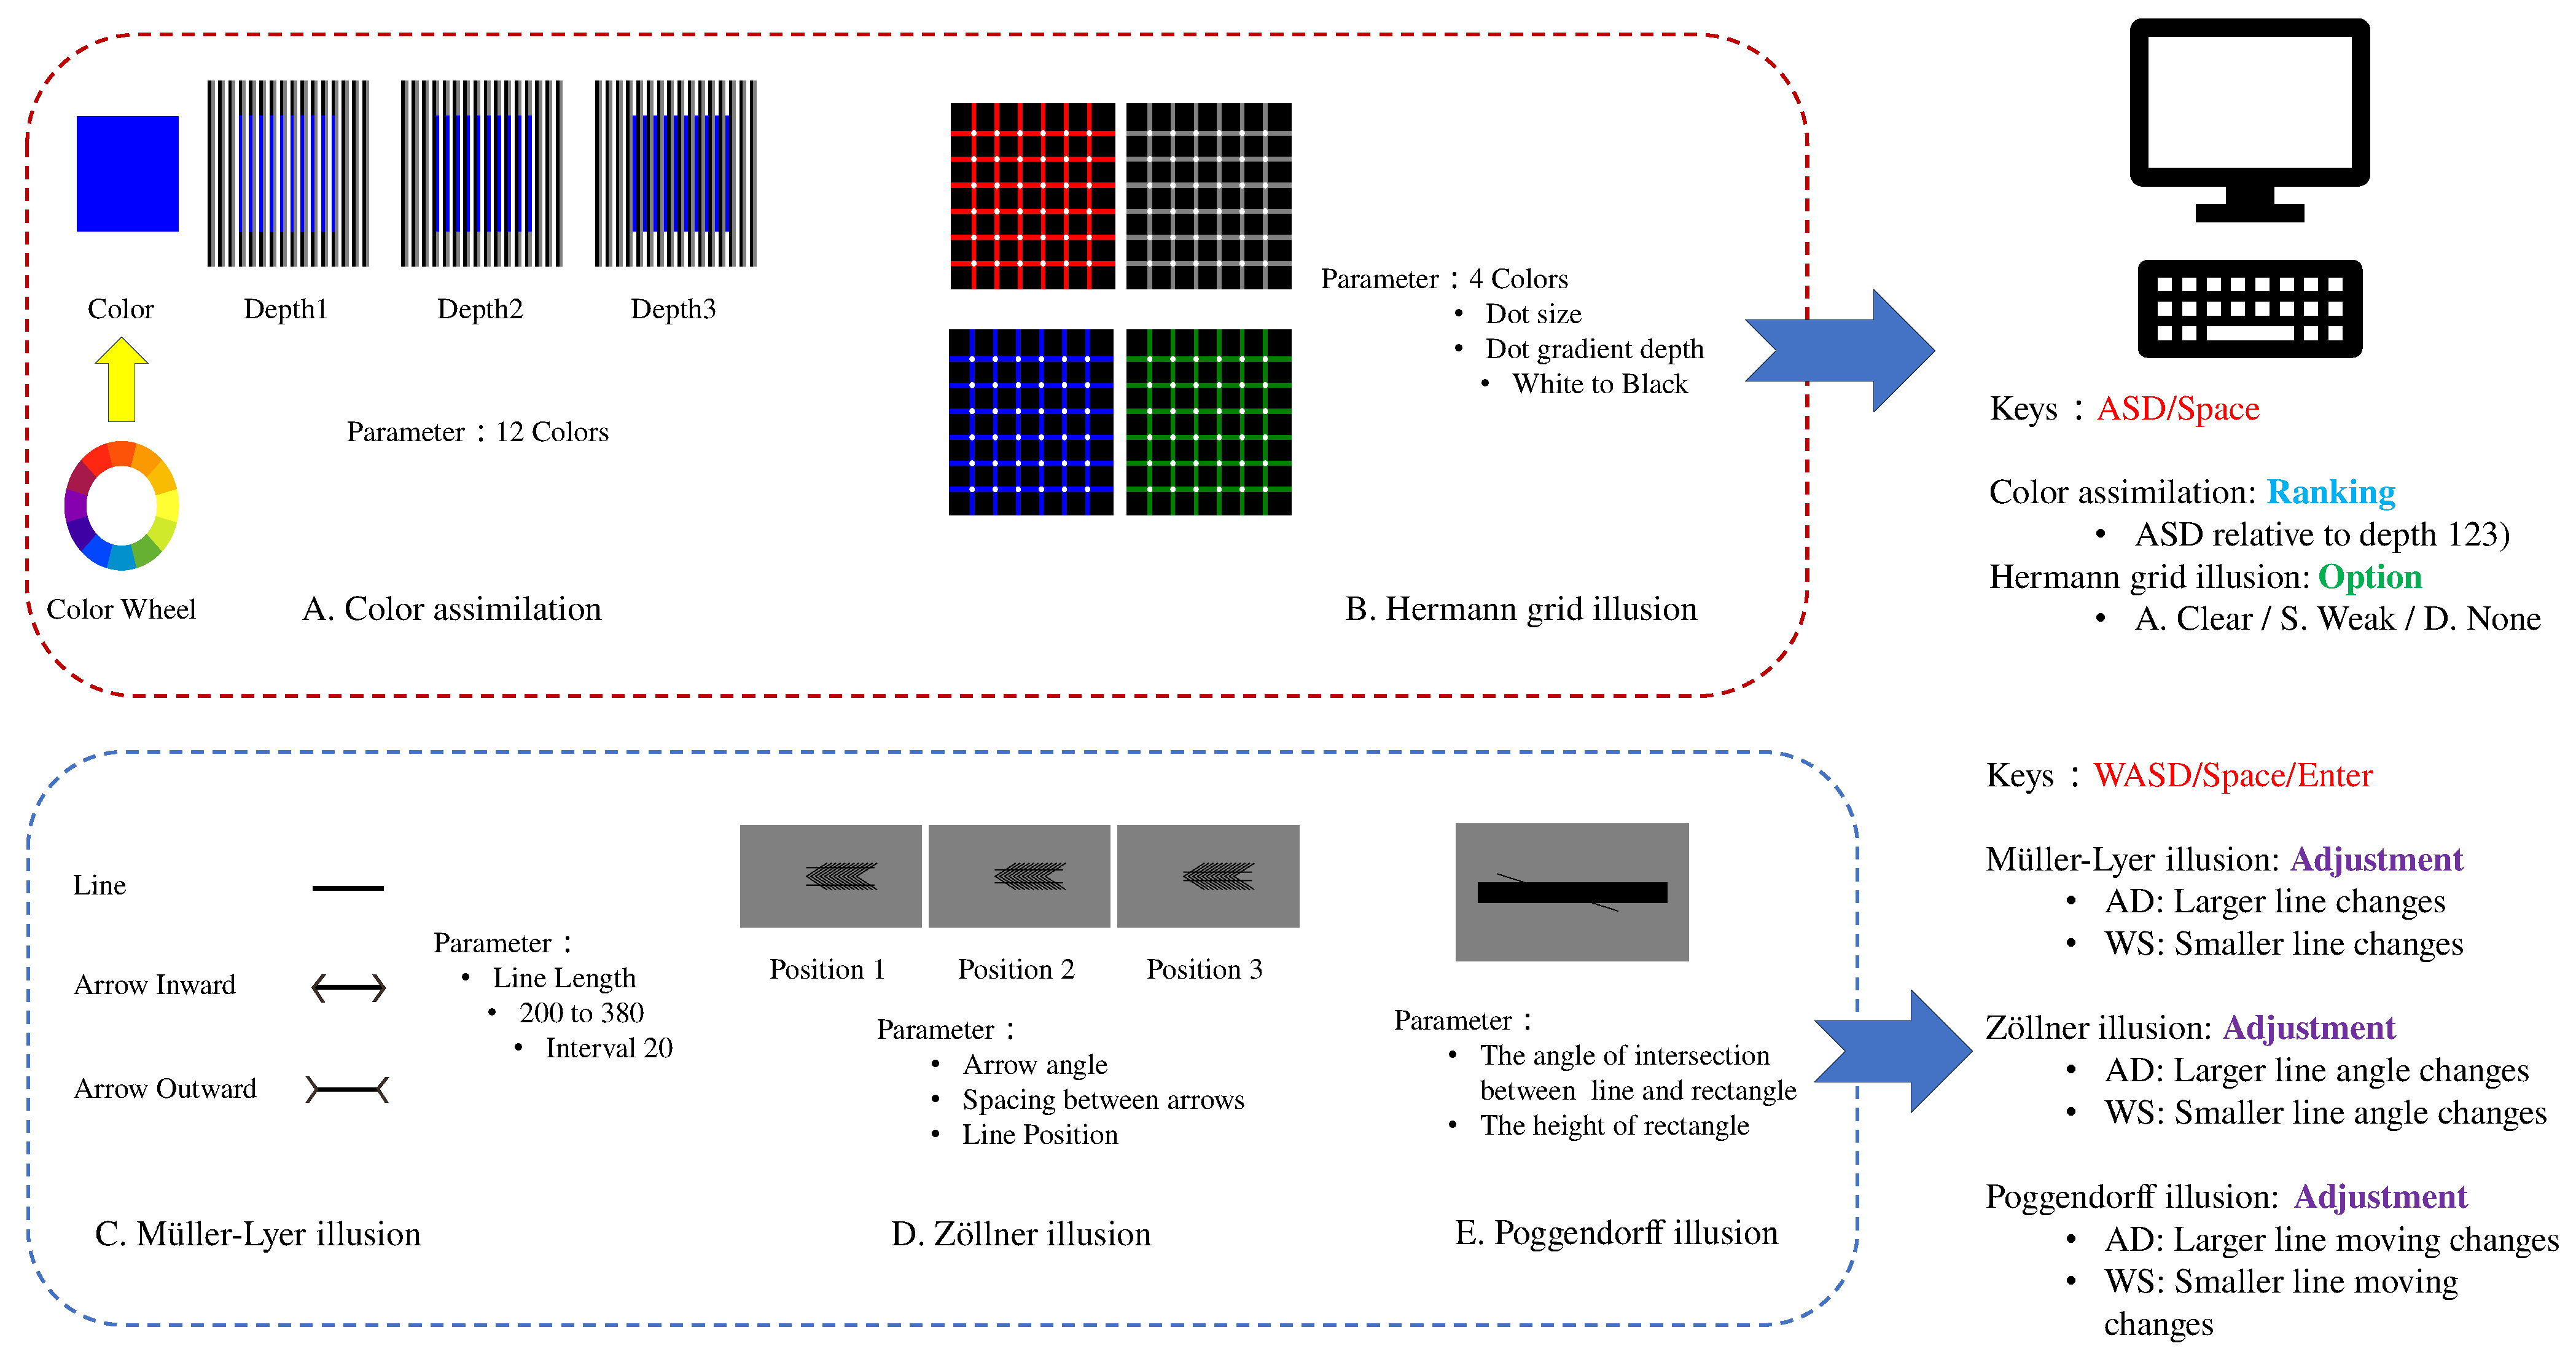
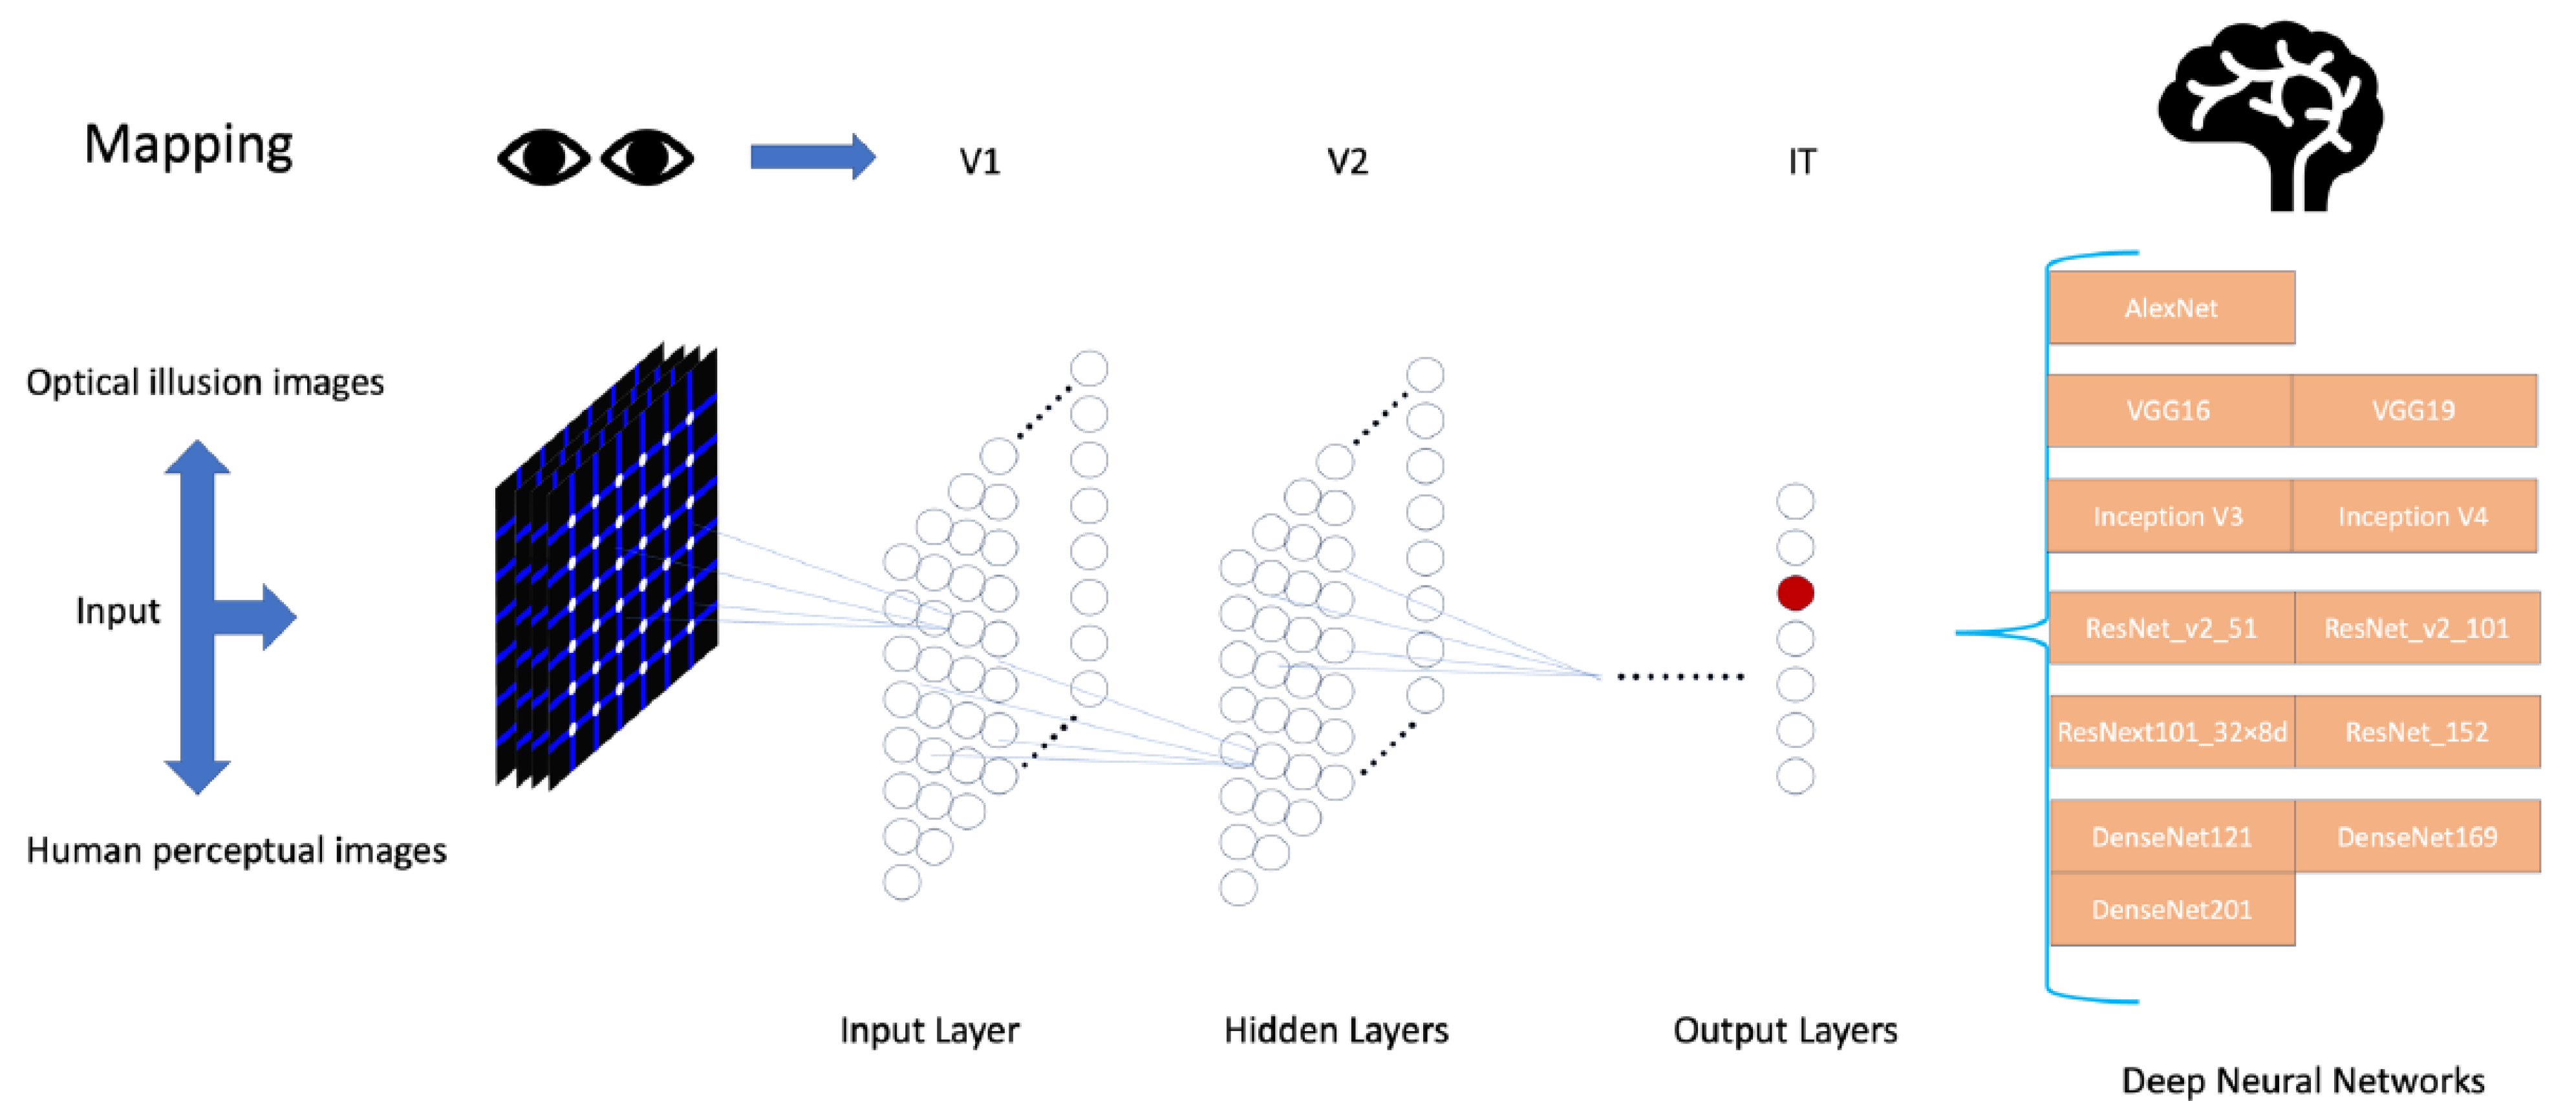
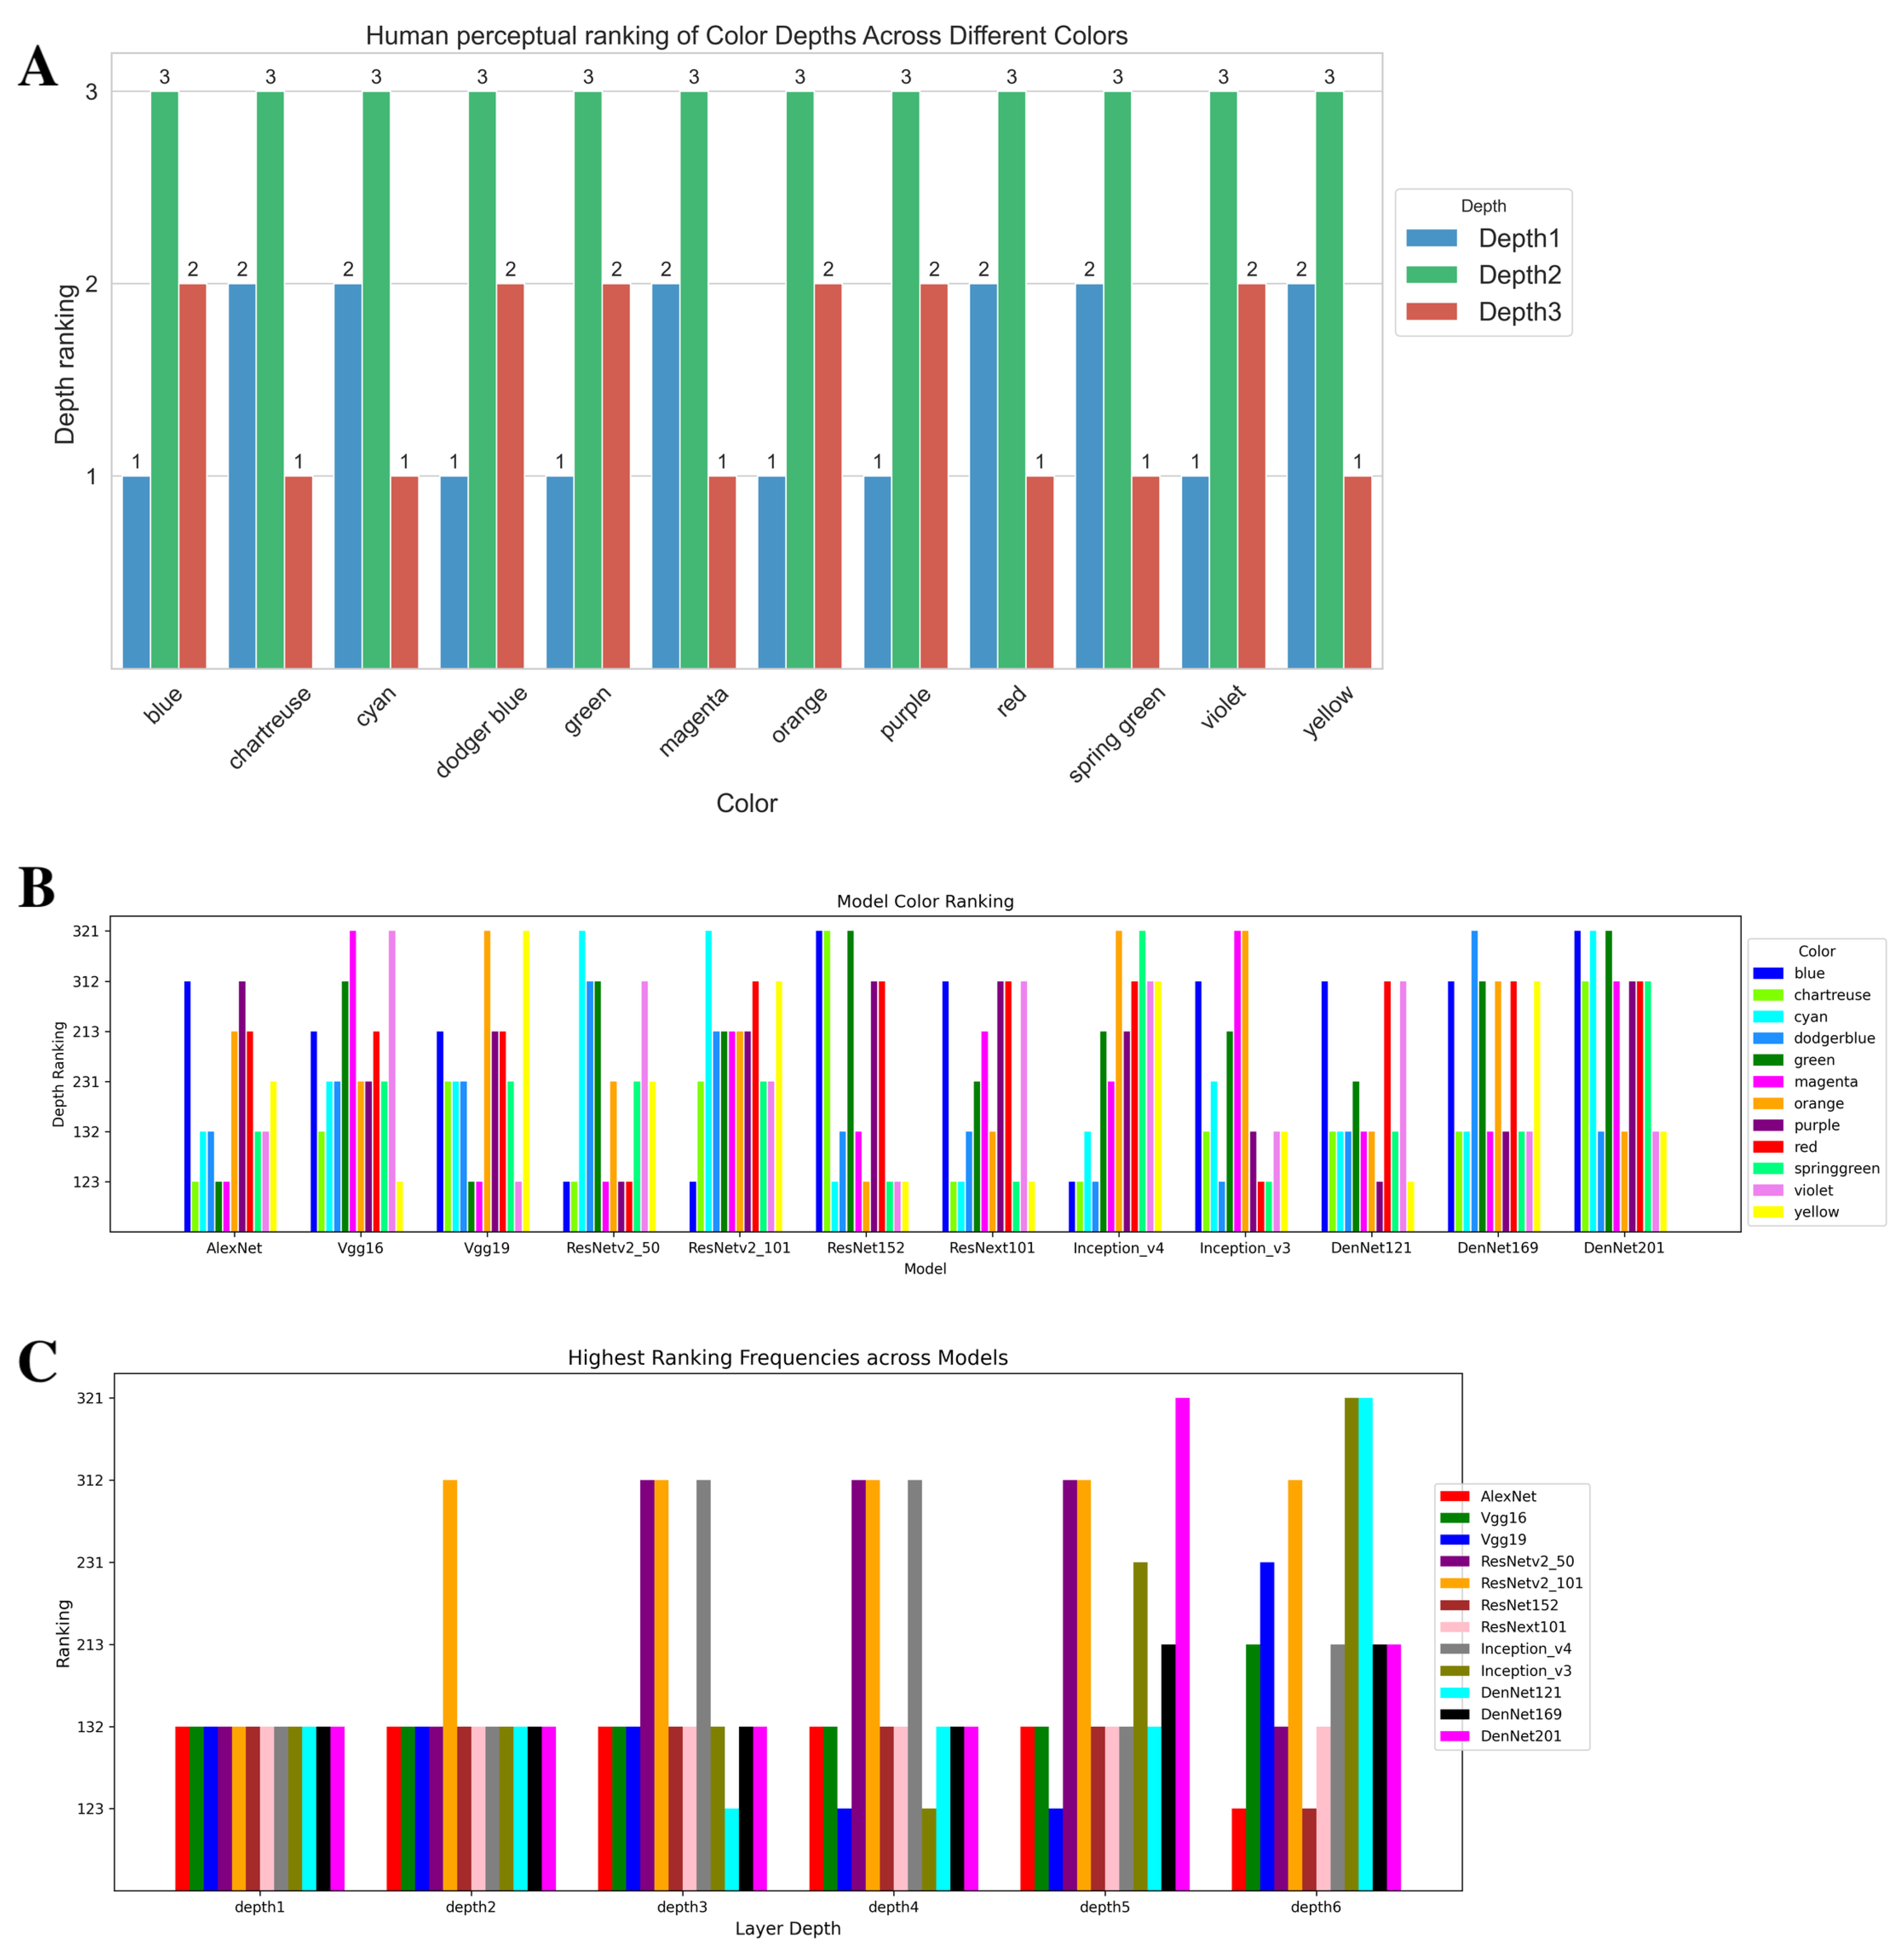
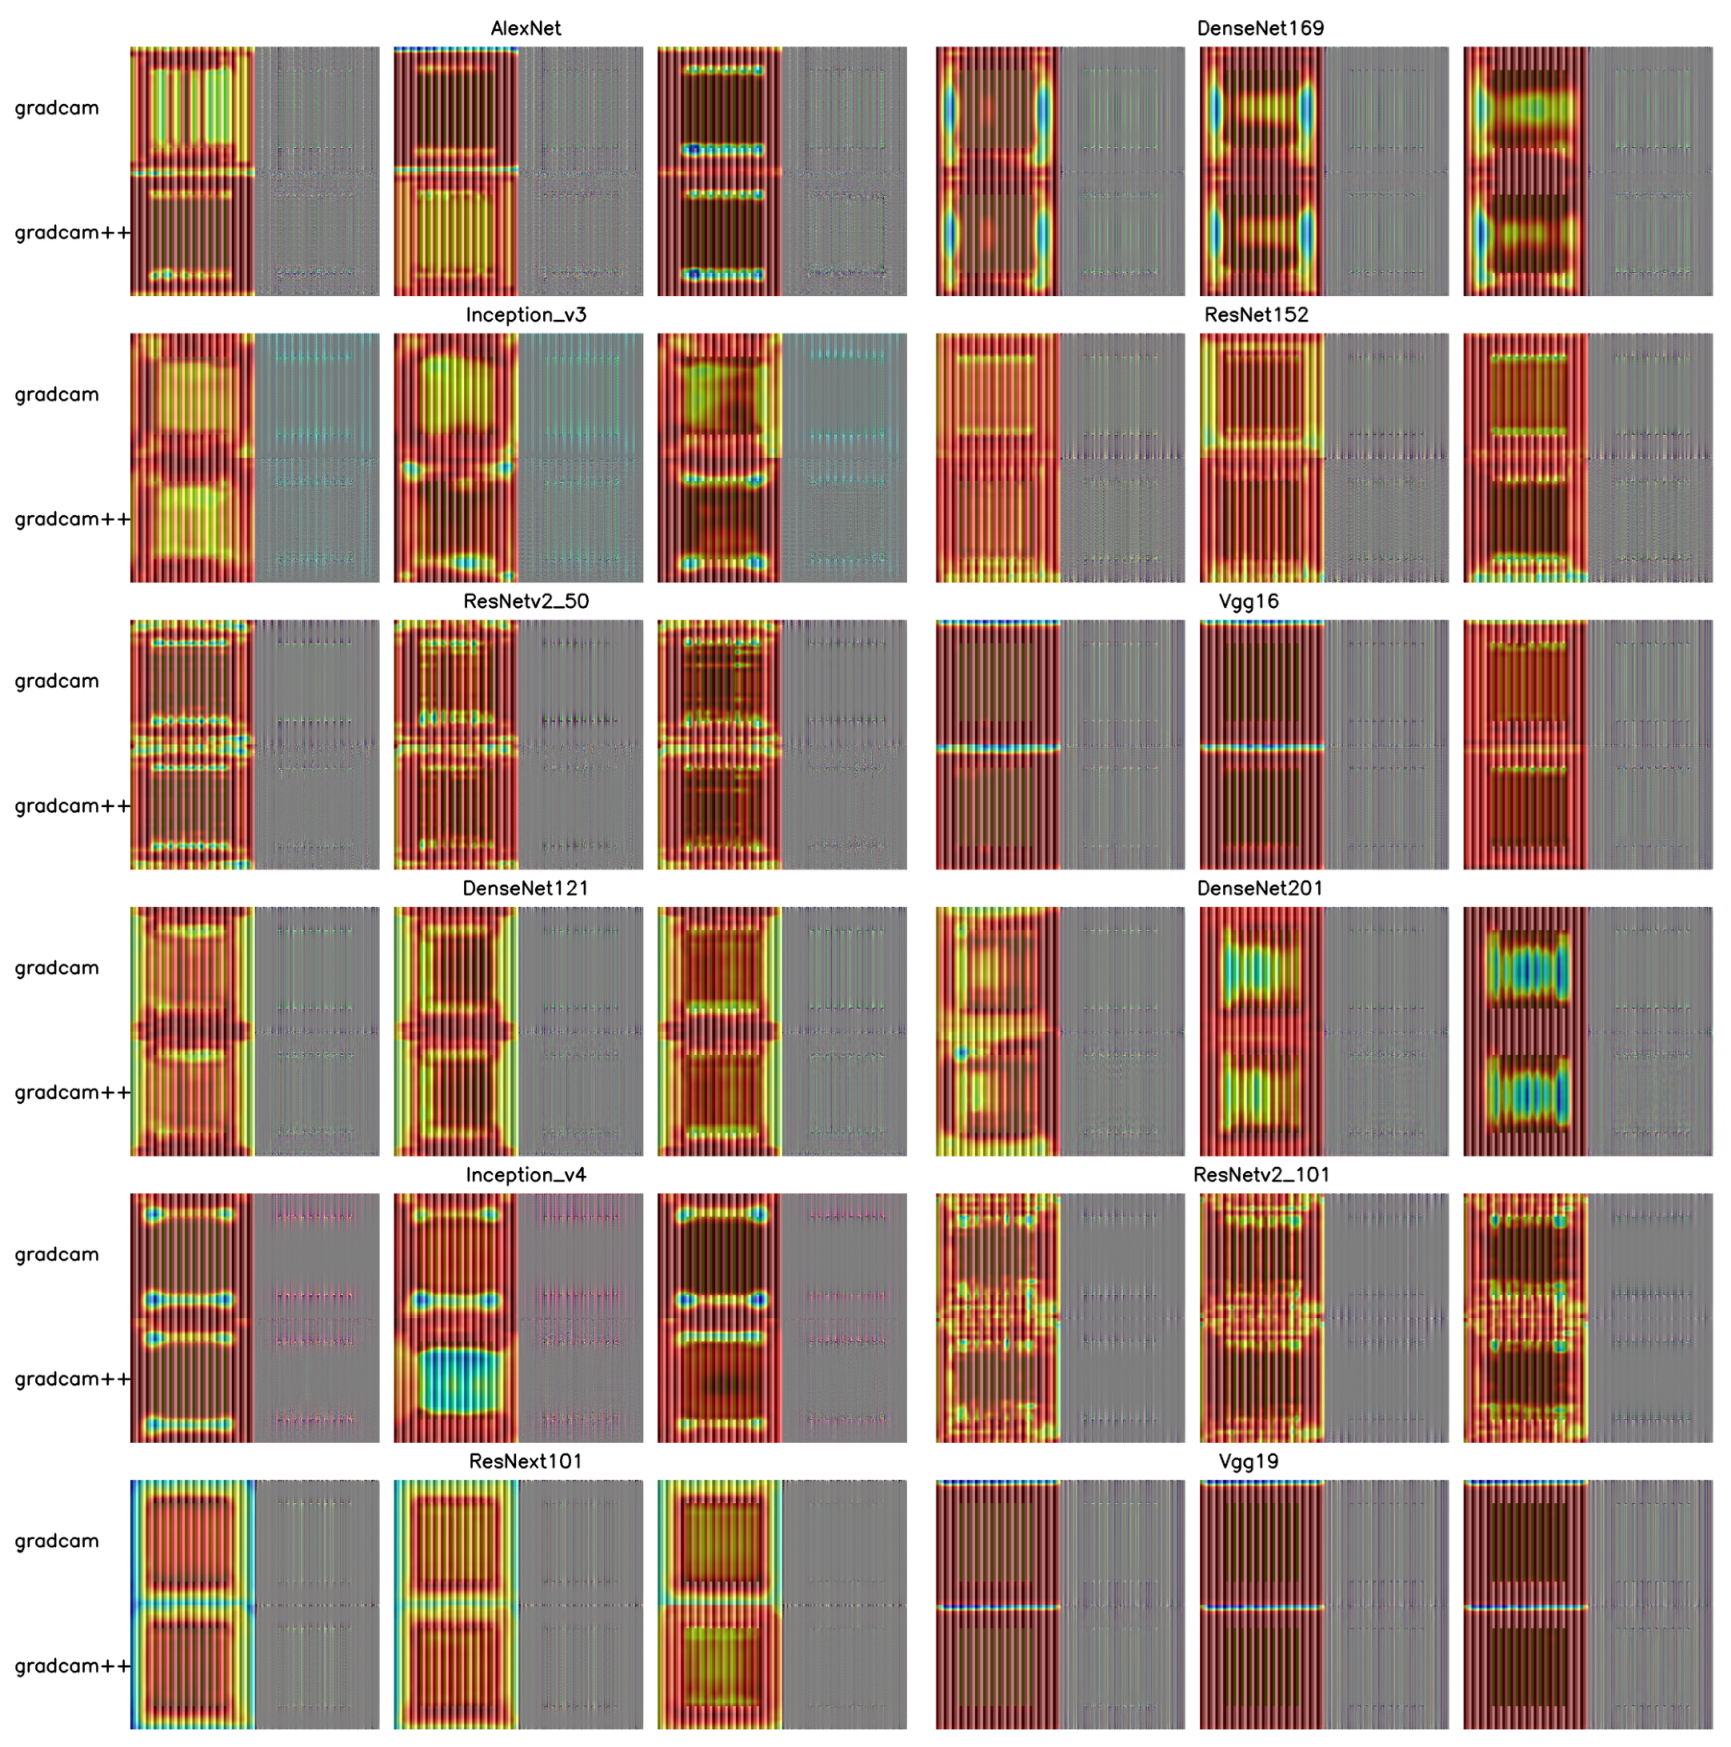
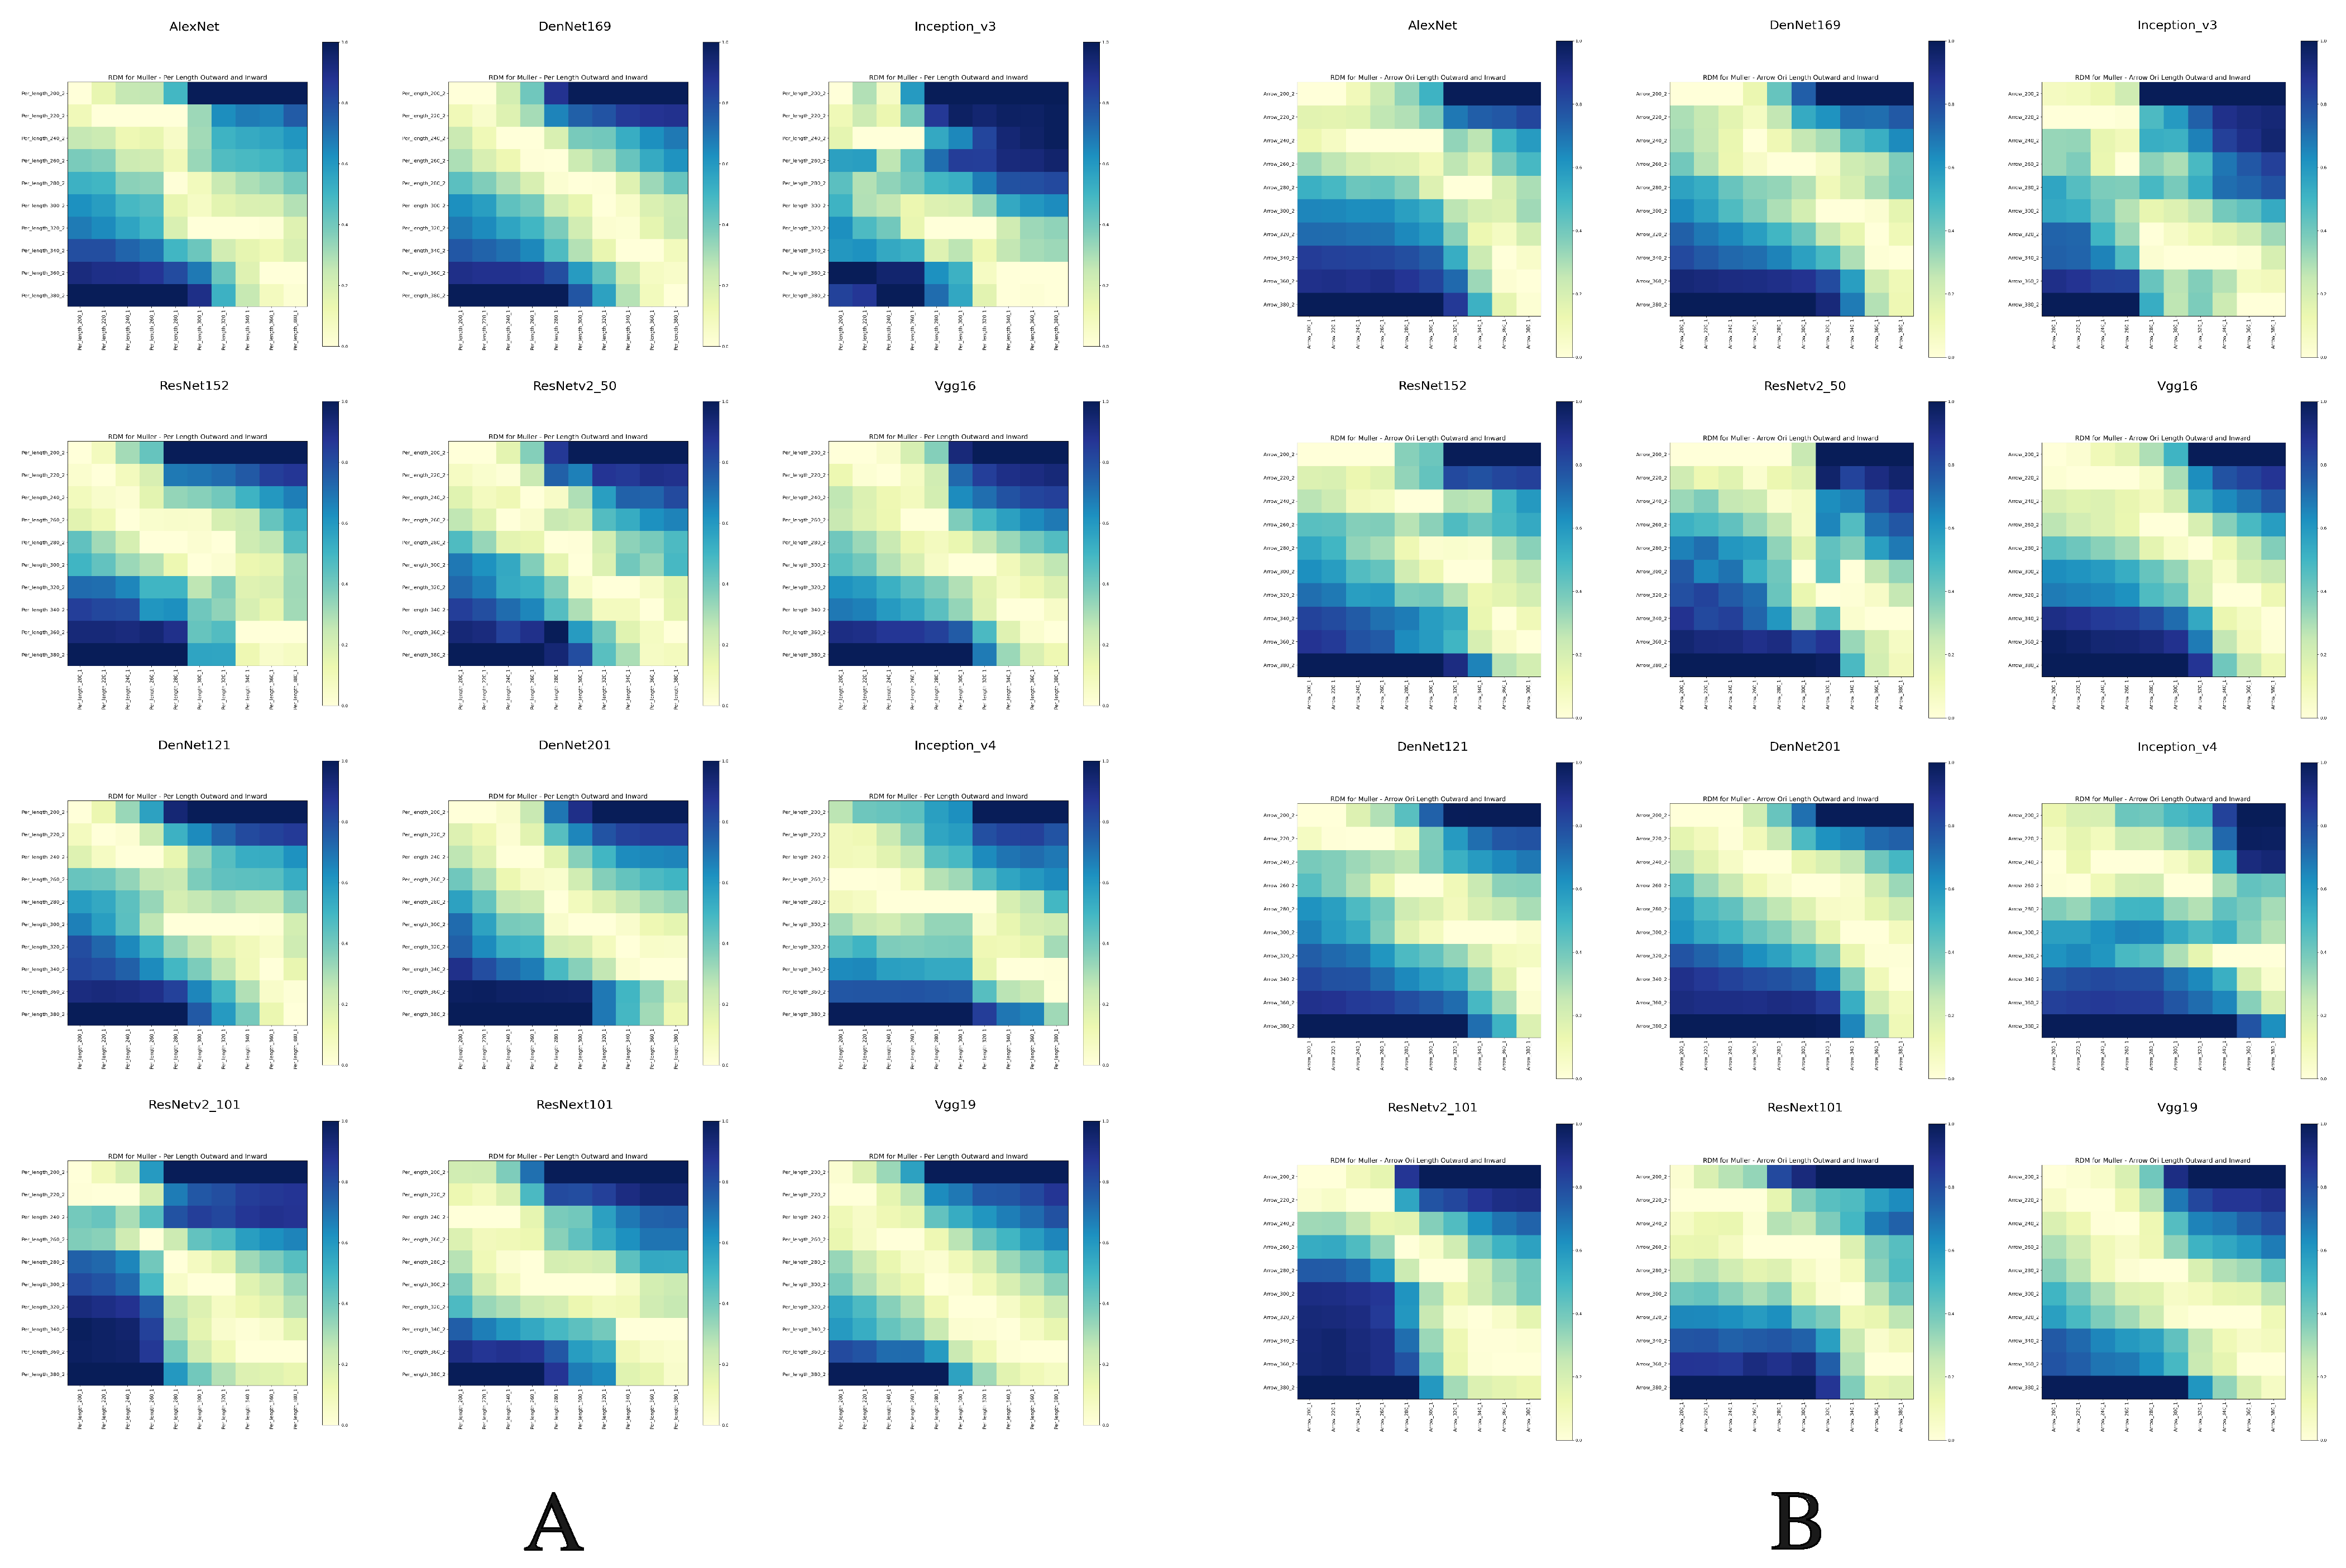
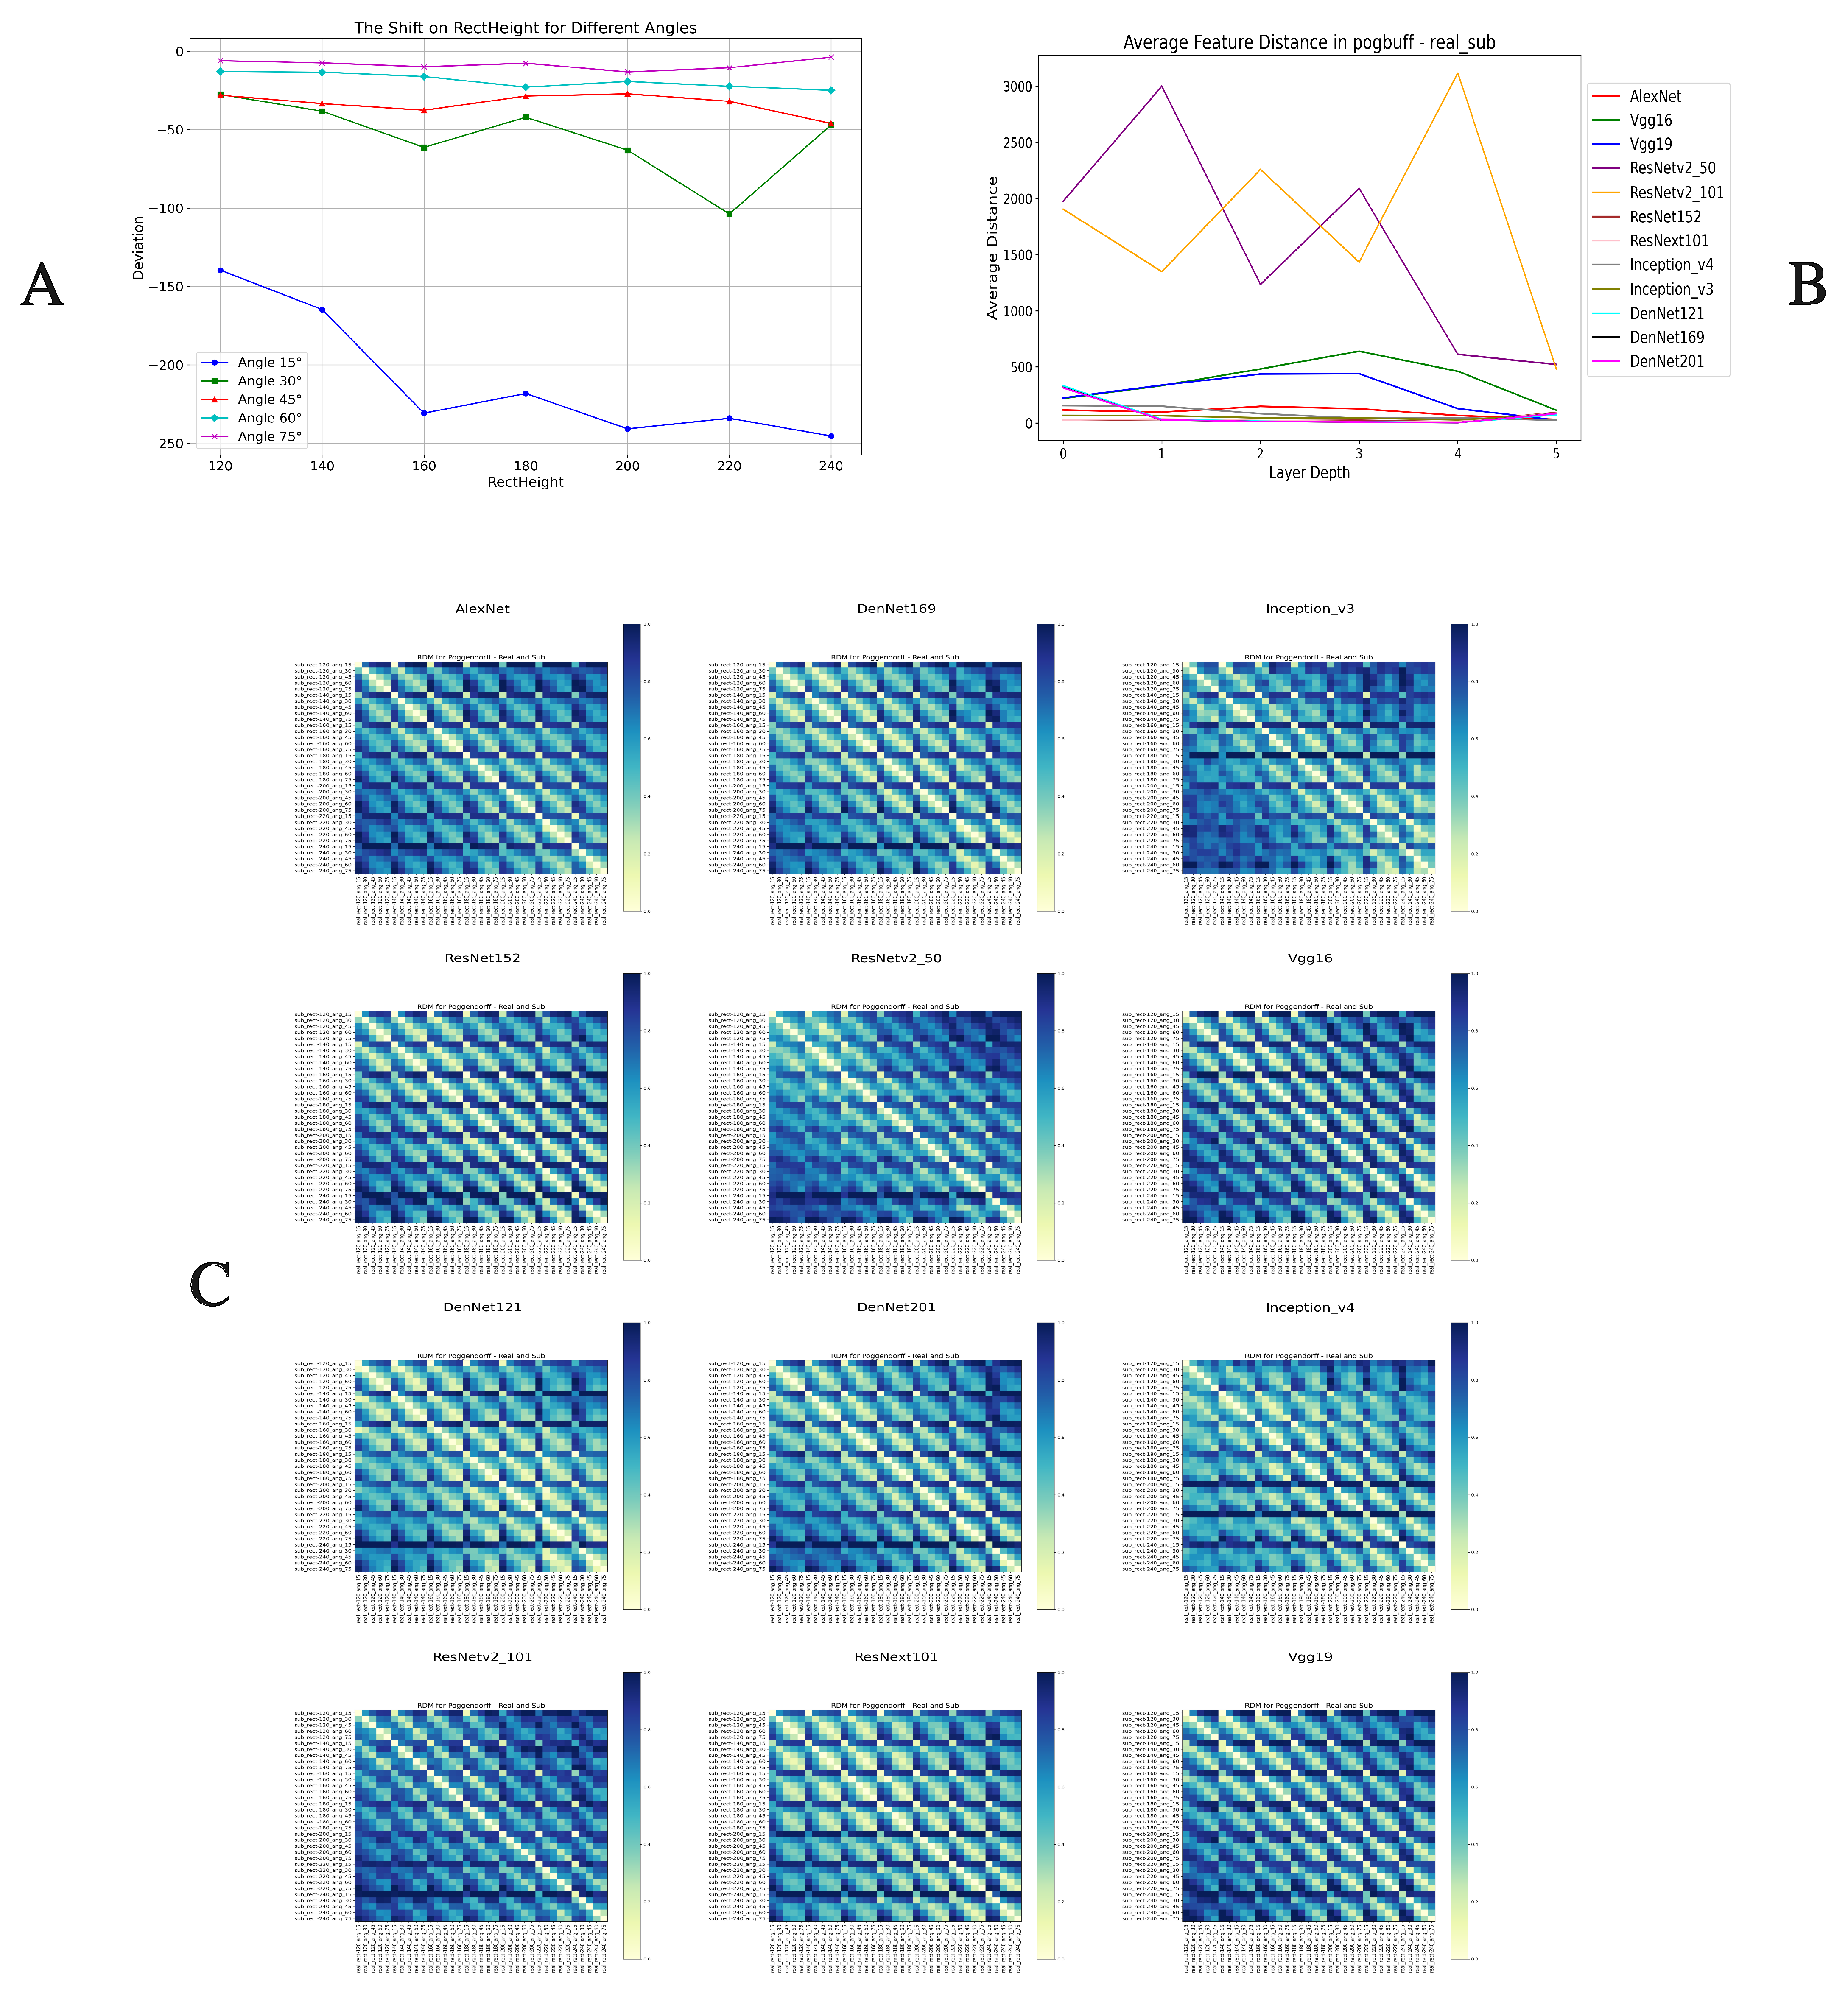
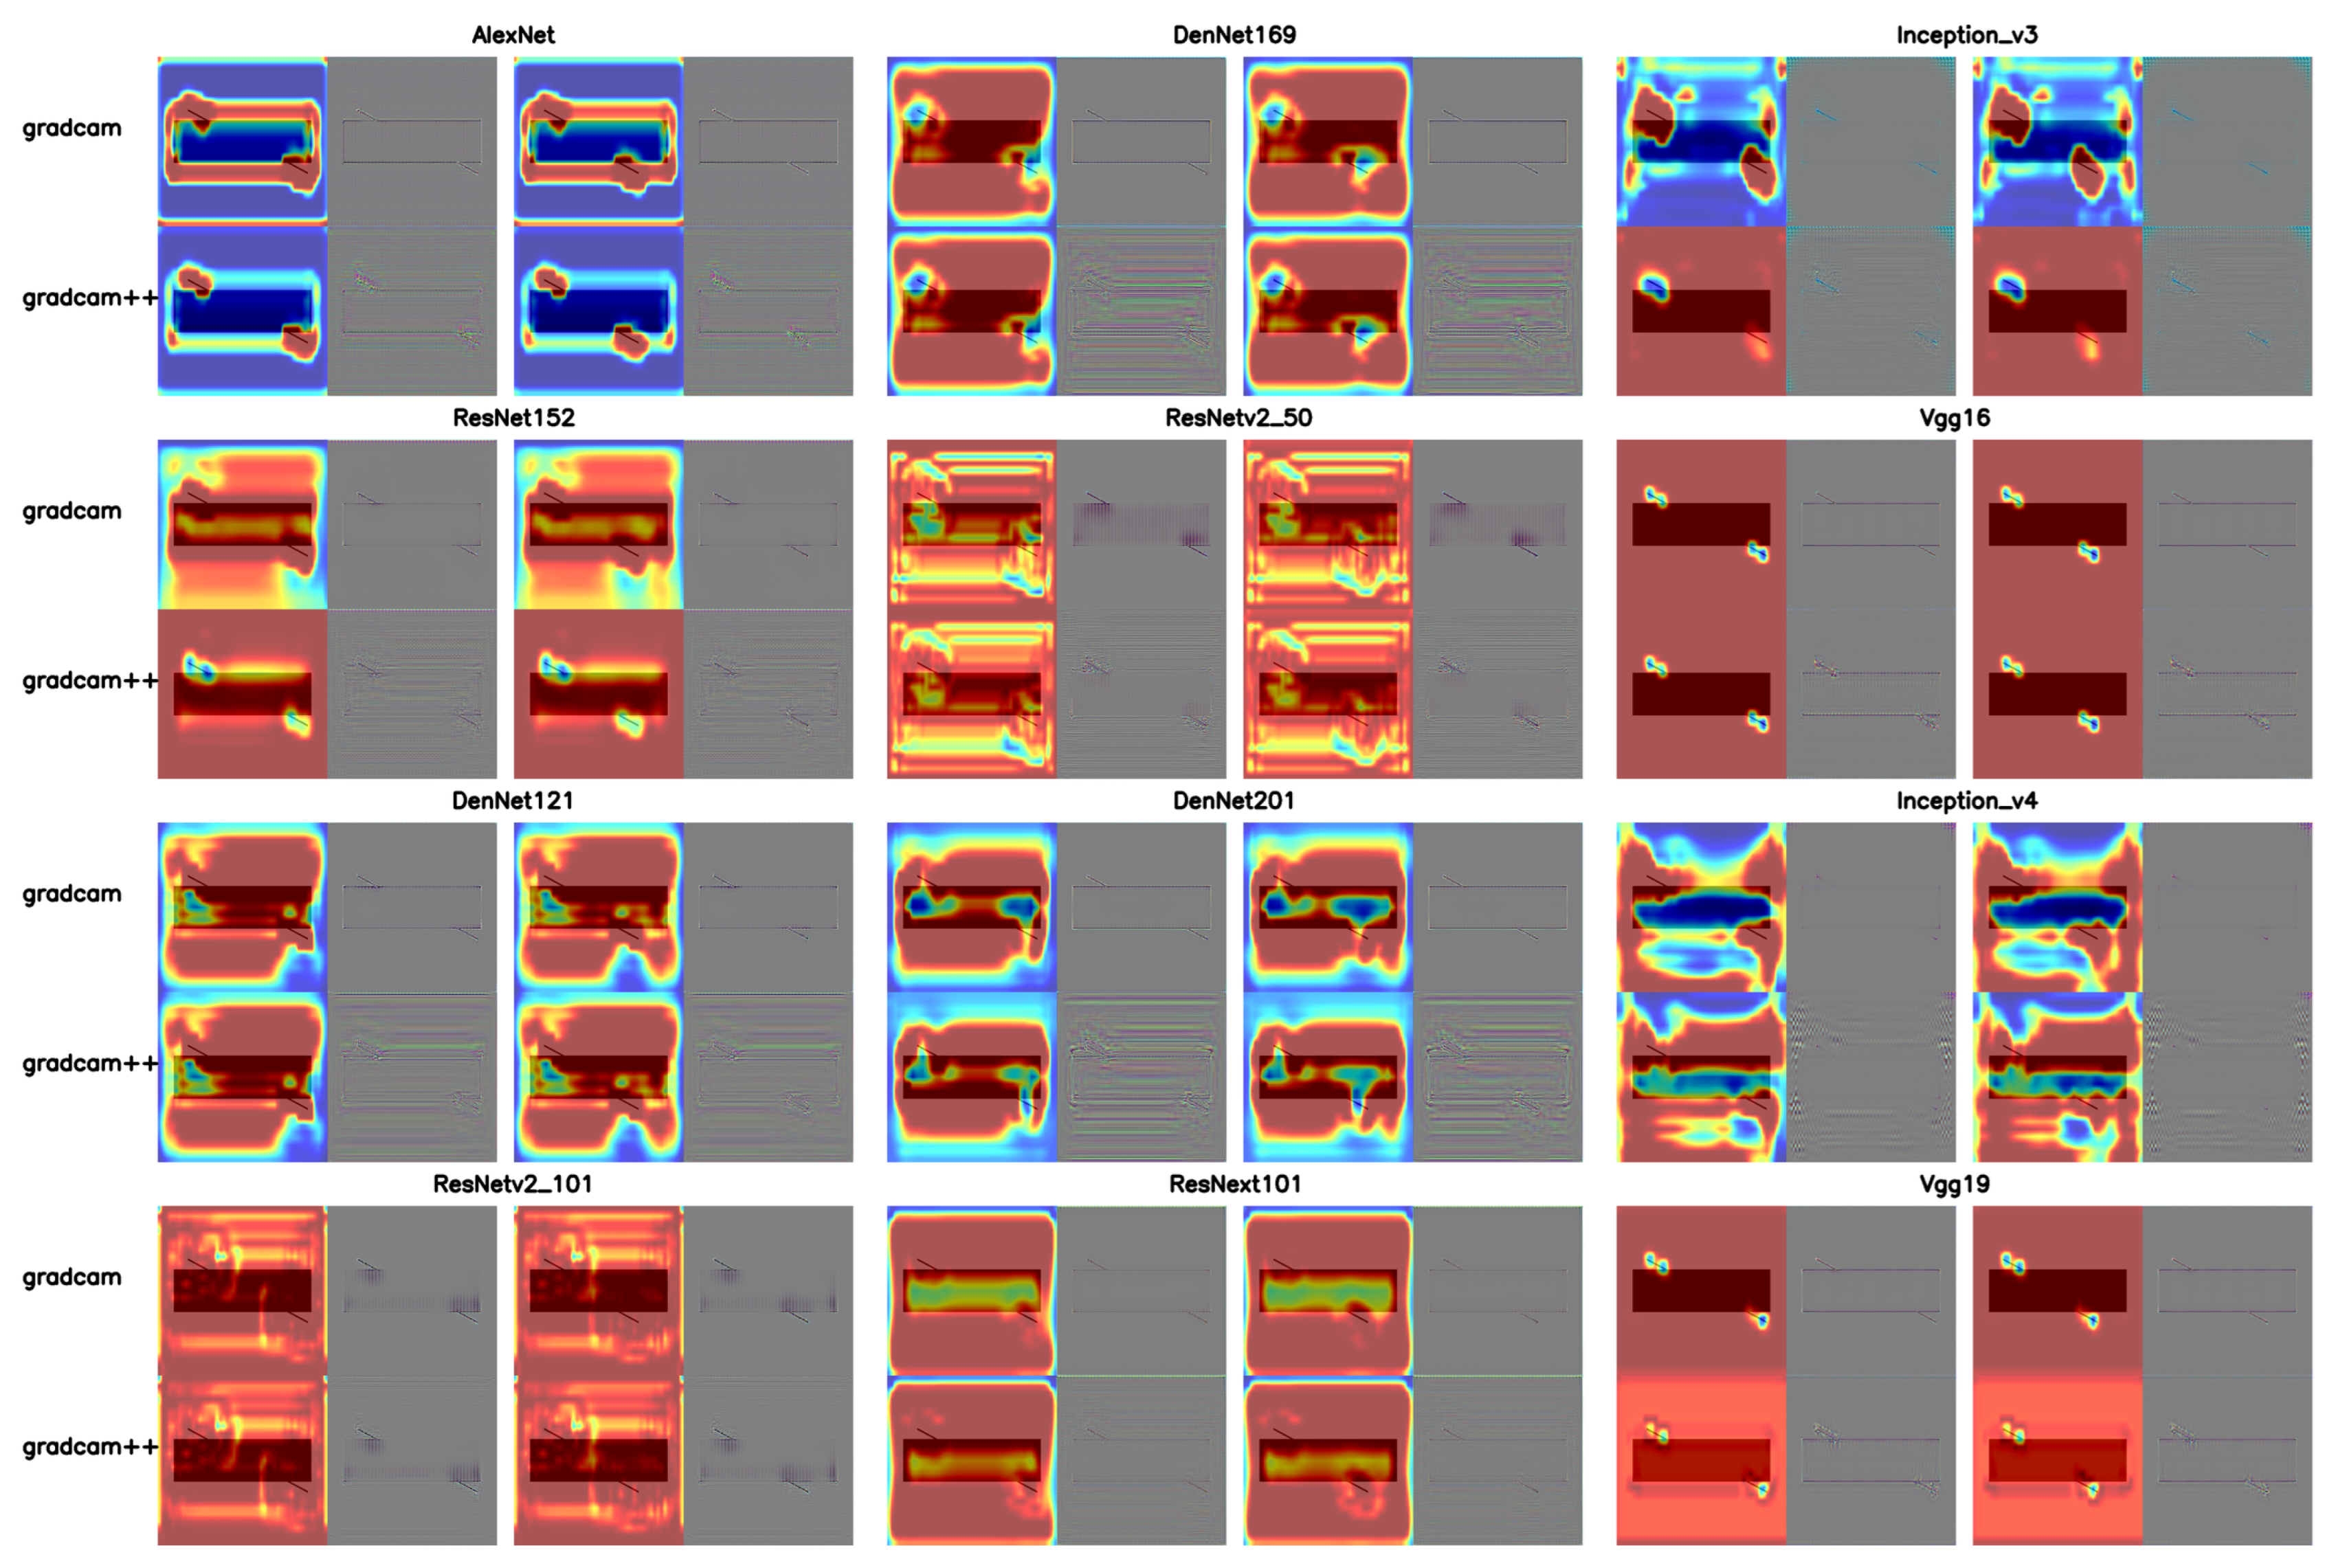
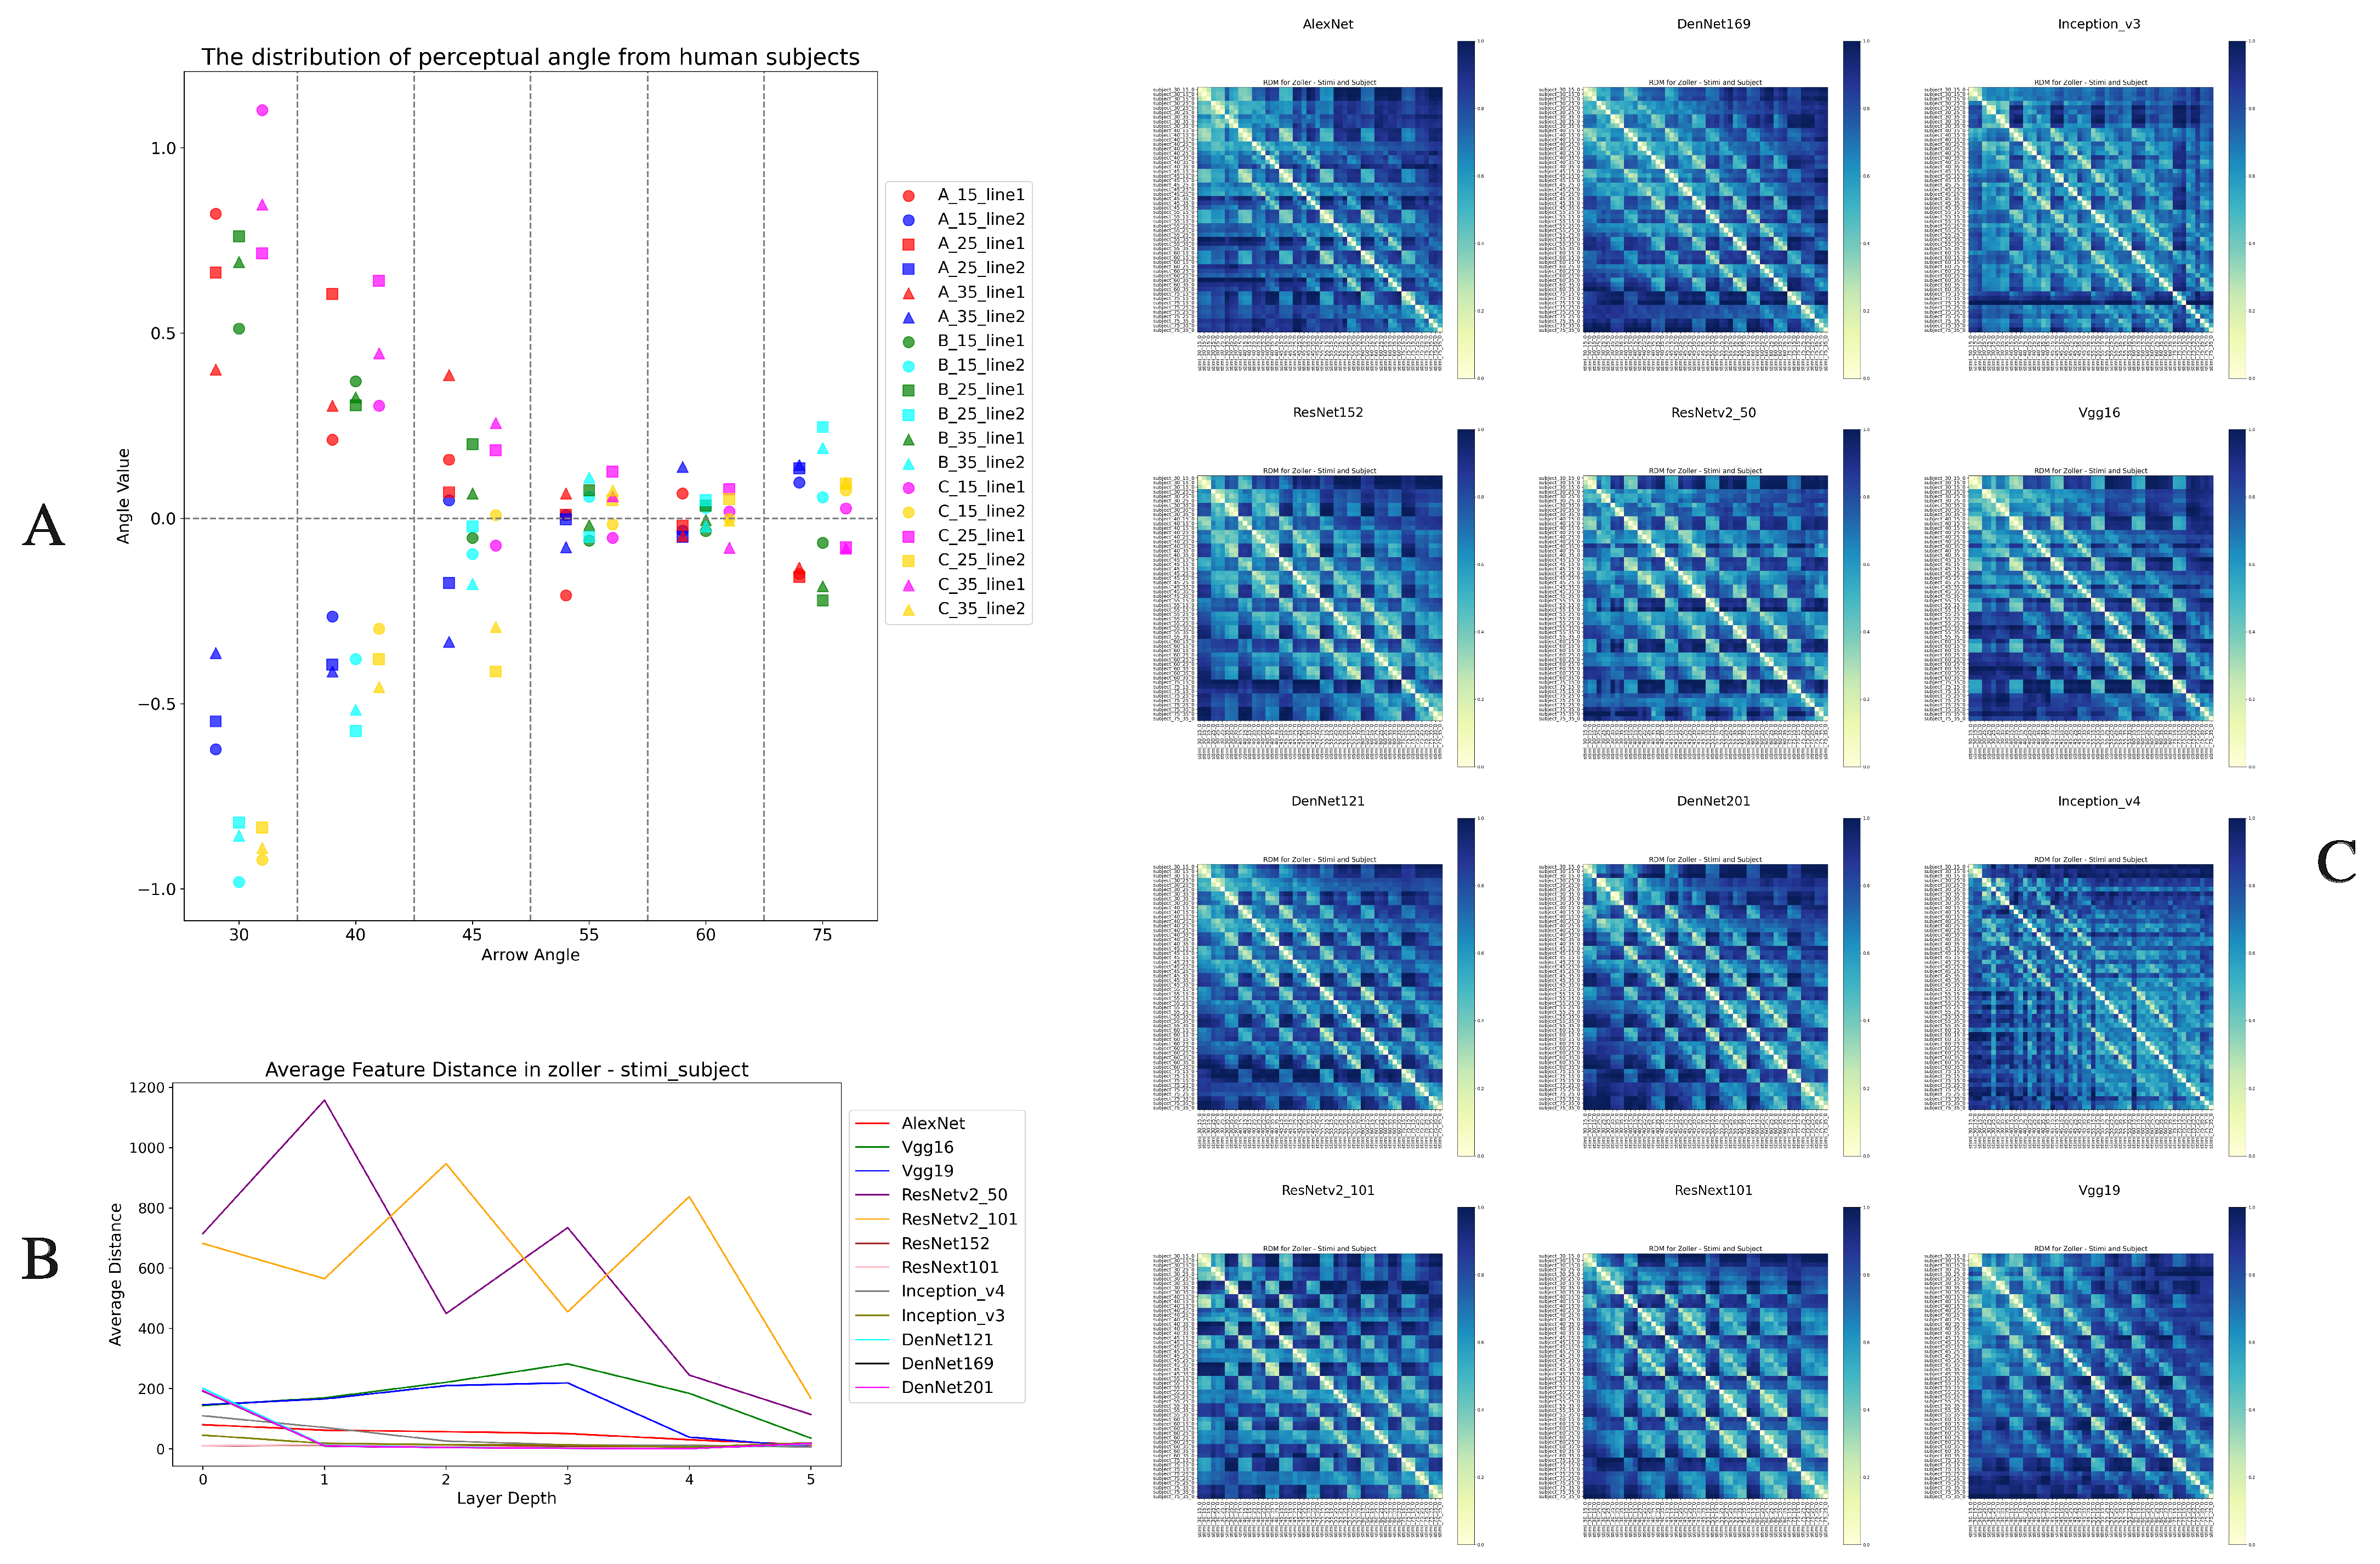
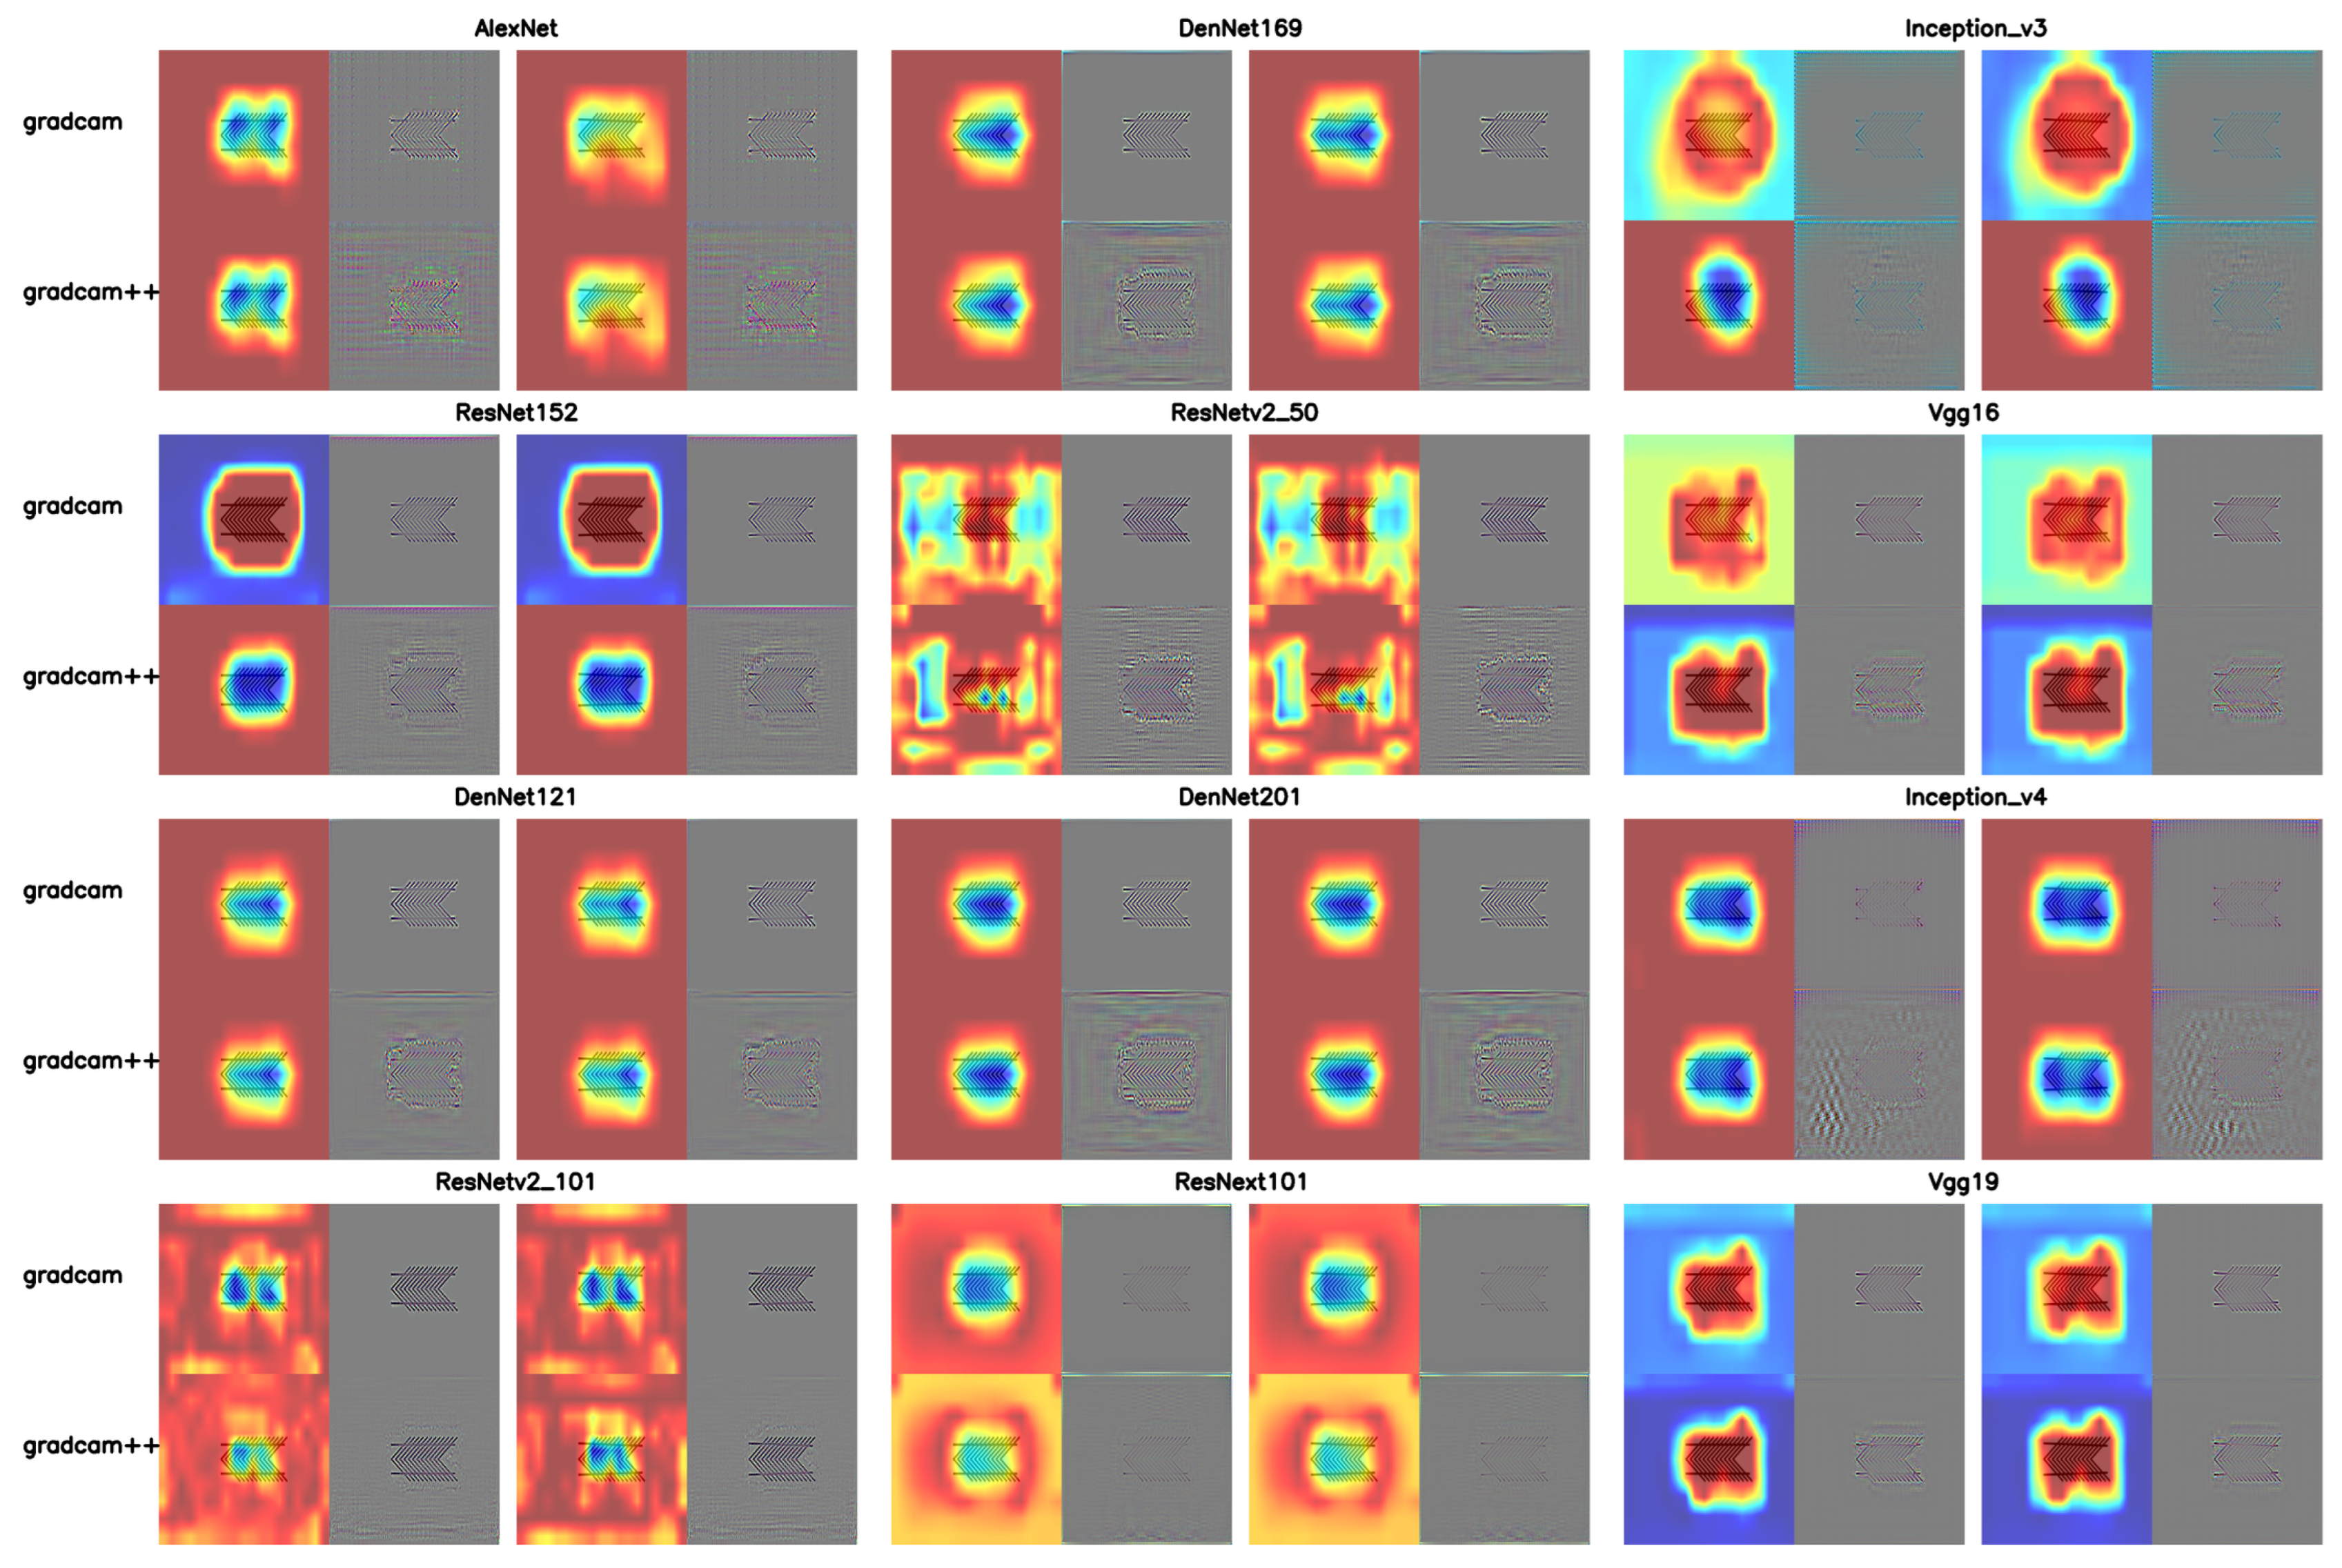
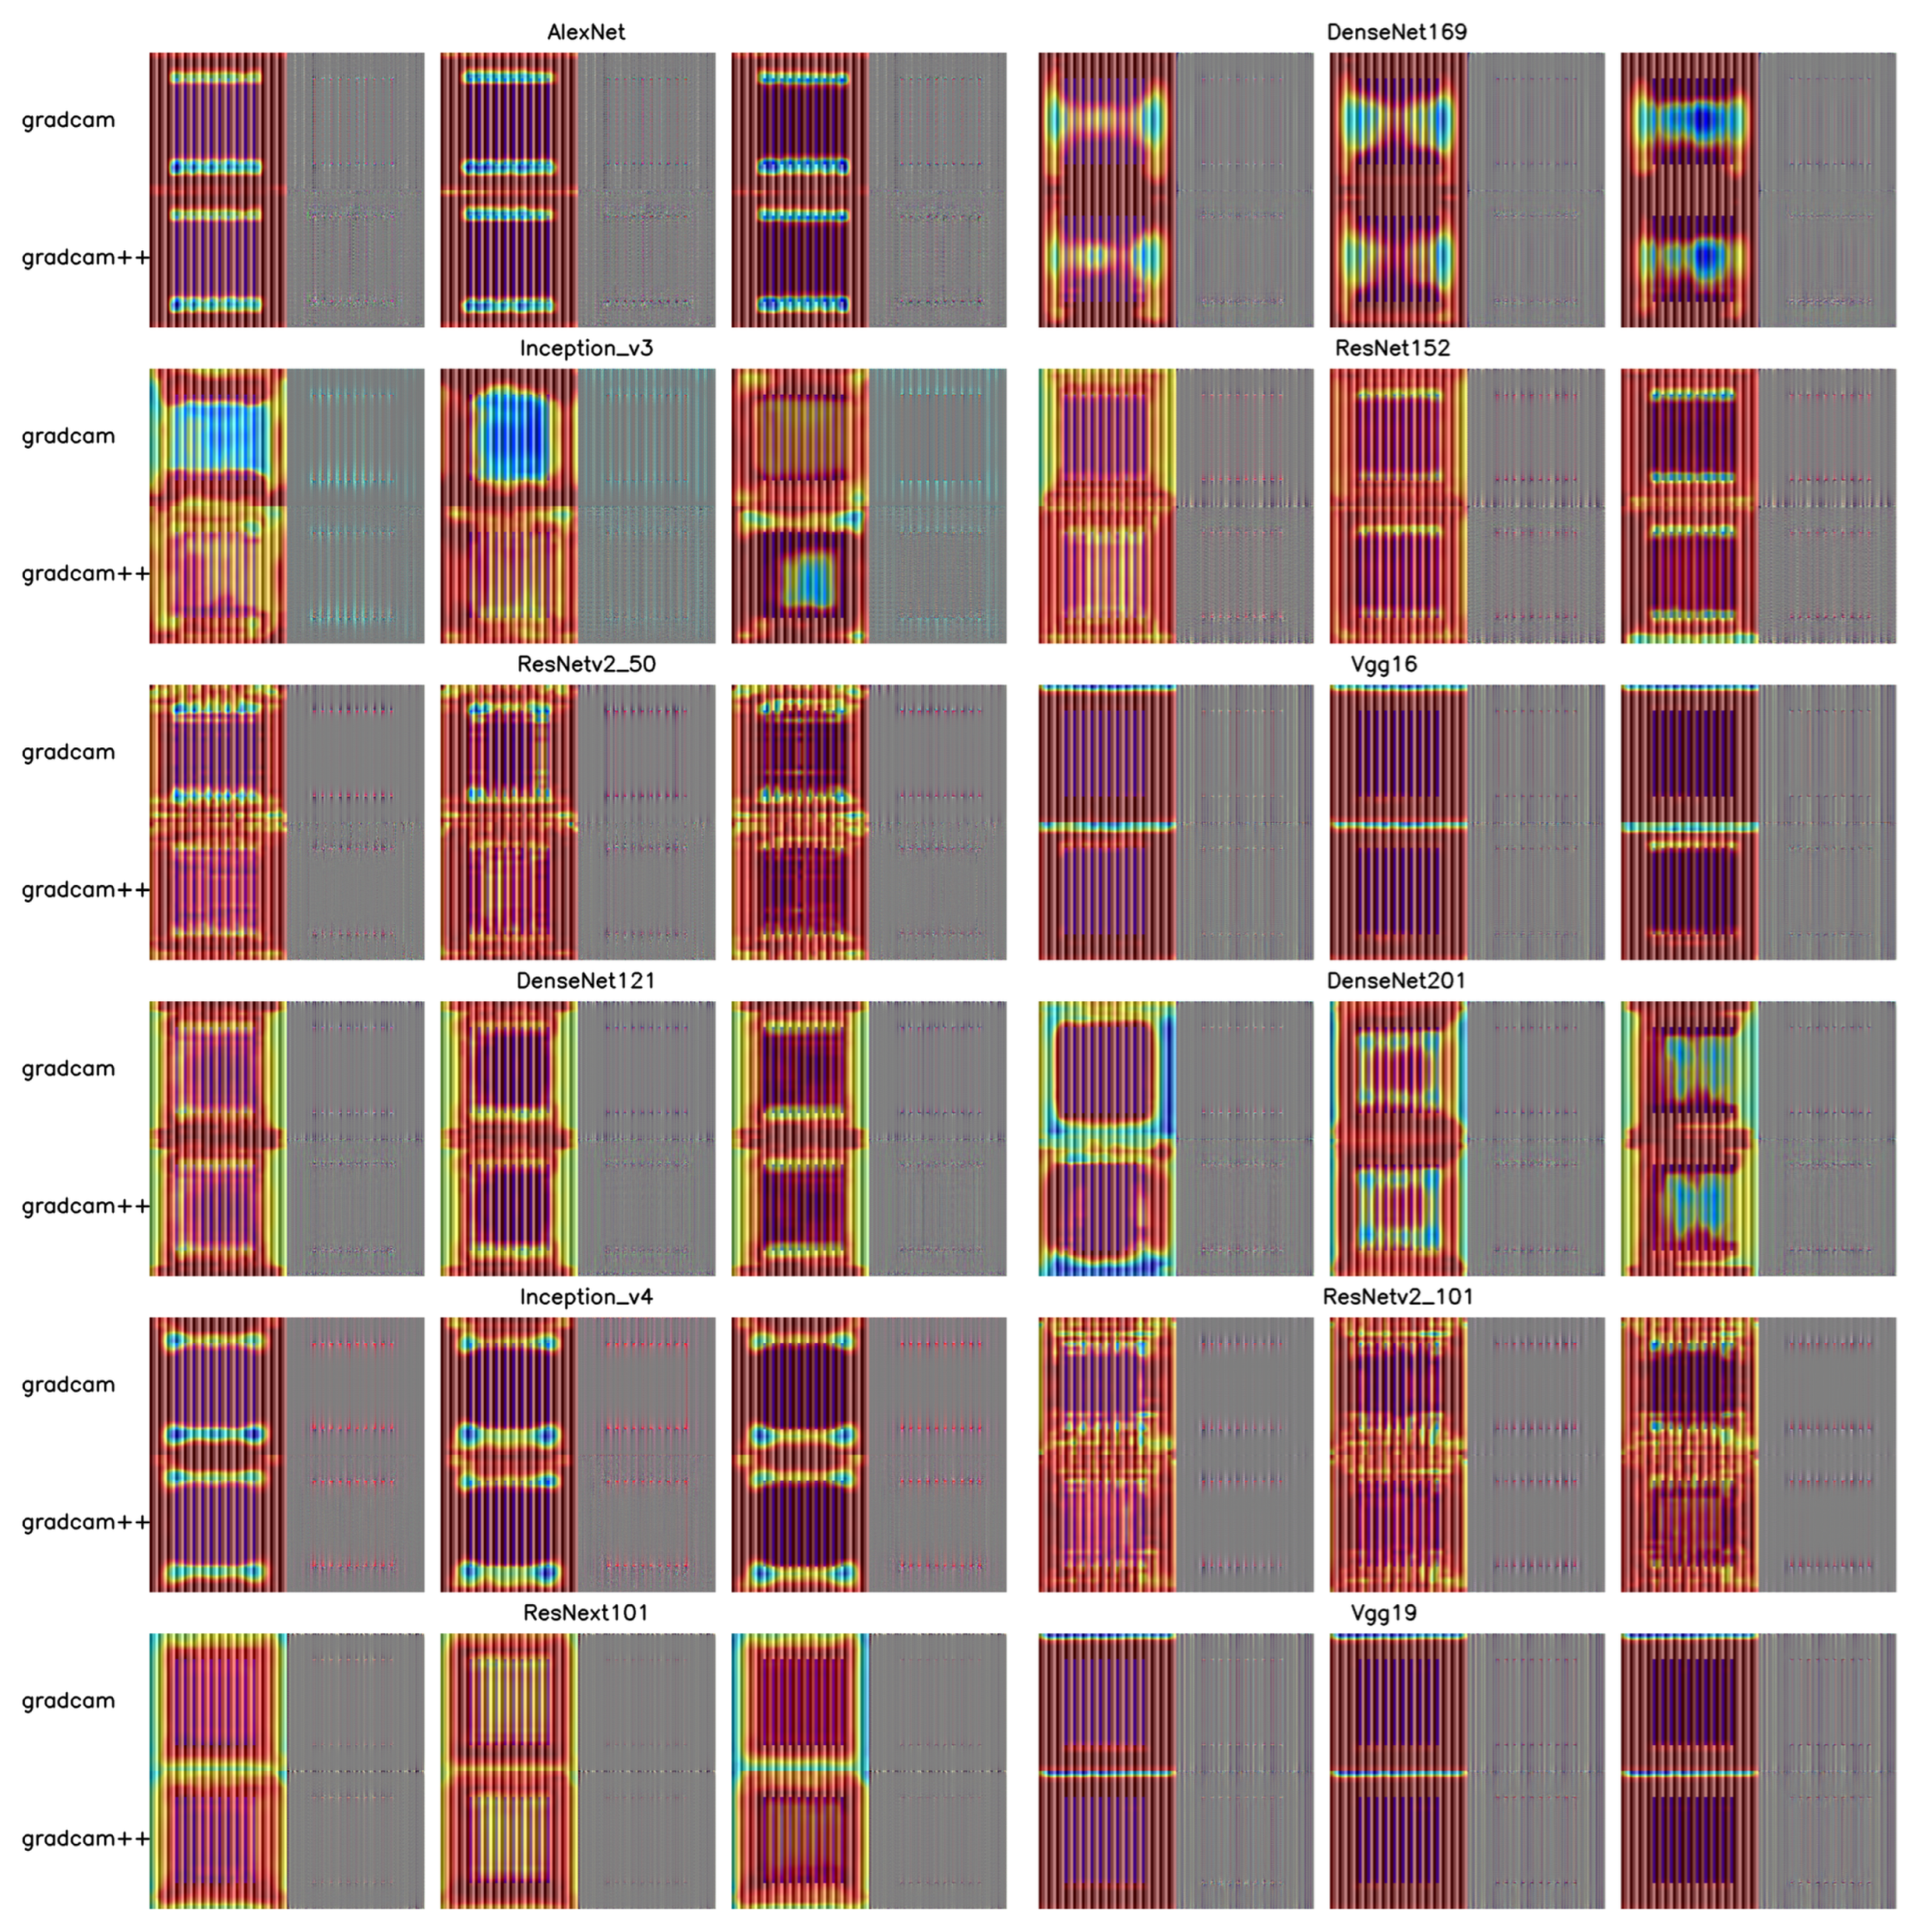
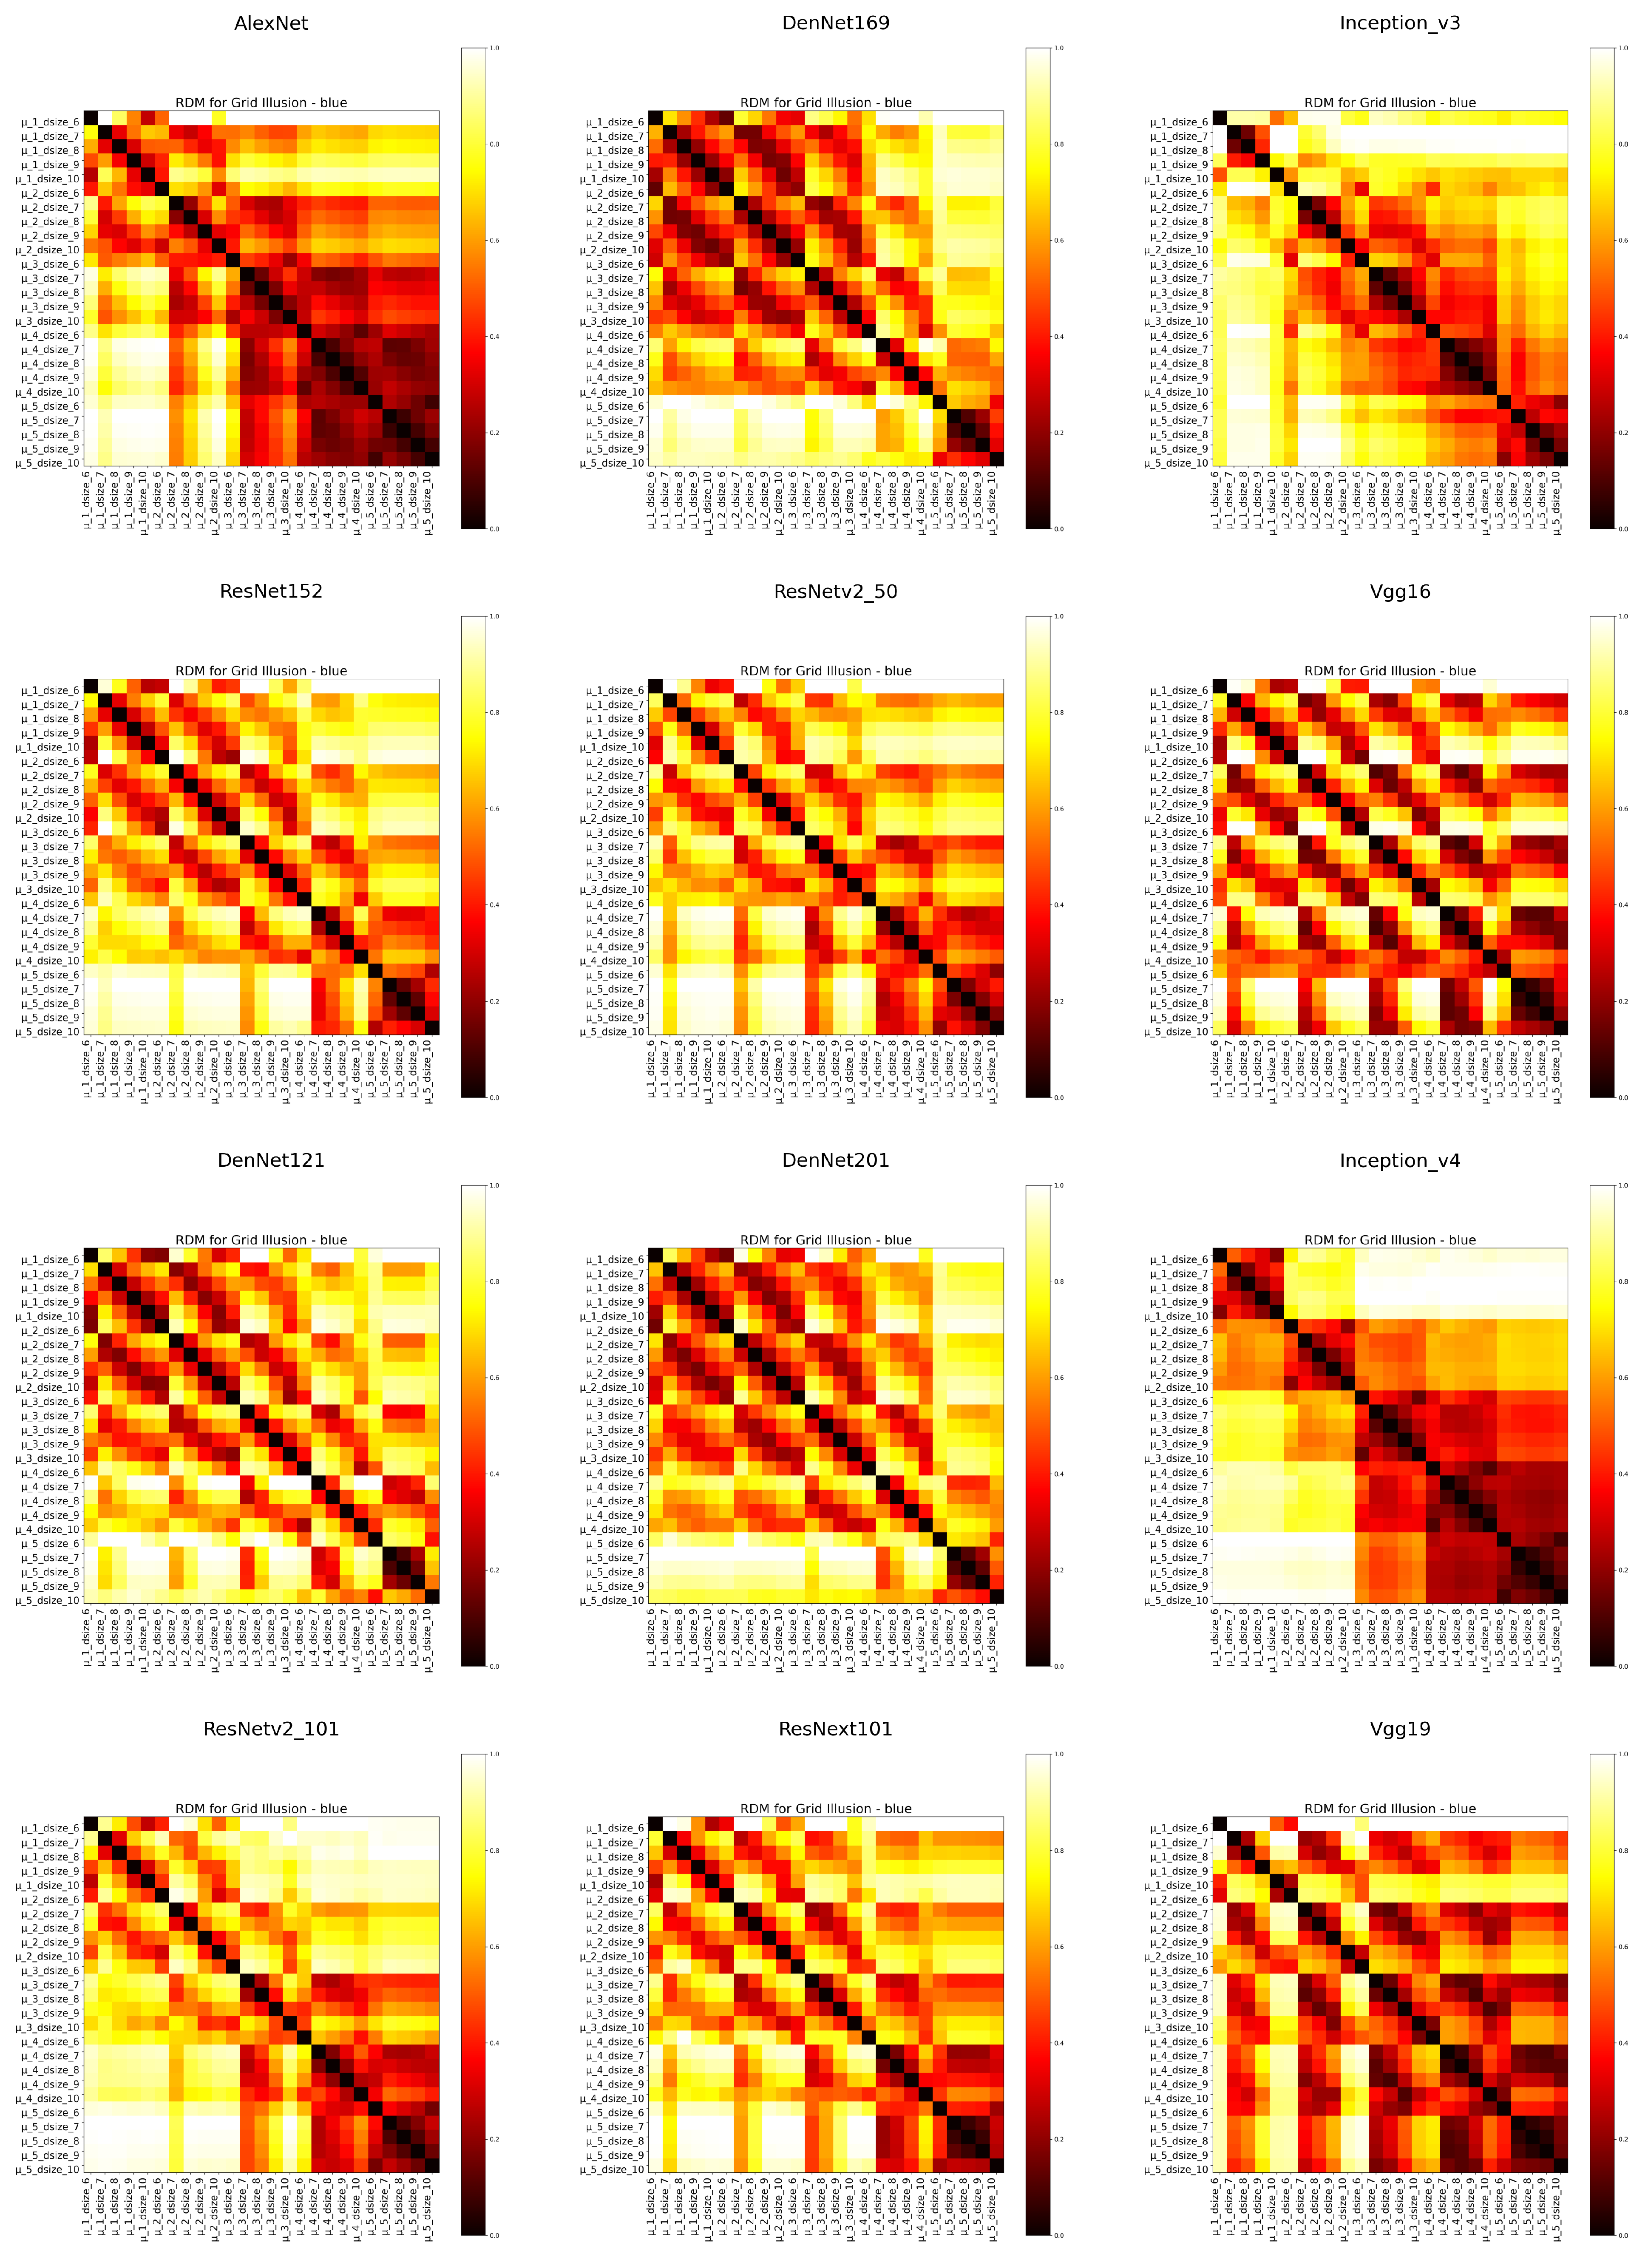
Table 1.
The setting of the illusion’s experiment.
| Illusion | Independent Variable | Perception | Total |
|---|---|---|---|
| Color Assimilation | Color(12)/Depth(3) | Ranking | 36 |
| Hermann-grid illusion | Color(4)/Dot_size(5)/Gradient_depth(5) | Option | 100 |
| Müller-Lyer illusion | Line_length(10) | Adjustment | 20 |
| Zöllner illusion | Angle(5)/Rectangle_width(7) | Adjustment | 35 |
| Poggendorff illusion | Angle(6)/Arrow_space(3)/Position(3) | Adjustment | 54 |
Table 2.
Models and Parameters.
| Models | Pre-Trained Dataset | Package | Parameters (Millions) |
|---|---|---|---|
| AlexNet | IMAGENET1K | Torchvision | 61.10 |
| VGG16 | IMAGENET1K | Torchvision | 138.36 |
| VGG19 | IMAGENET1K | Torchvision | 143.67 |
| ResNetv2_50 | IMAGENET1K | Timm | 25.55 |
| ResNetv2_101 | IMAGENET1K | Timm | 44.54 |
| ResNet152 | IMAGENET1K | Torchvision | 60.19 |
| ResNext101 | IMAGENET1K | Torchvision | 88.79 |
| Inception_v3 | IMAGENET1K | Timm | 23.83 |
| Inception_v4 | IMAGENET1K | Timm | 42.68 |
| DenNet121 | IMAGENET1K | Torchvision | 7.98 |
| DenNet169 | IMAGENET1K | Torchvision | 14.15 |
| DenNet201 | IMAGENET1K | Torchvision | 20.01 |
Disclaimer/Publisher’s Note: The statements, opinions and data contained in all publications are solely those of the individual author(s) and contributor(s) and not of MDPI and/or the editor(s). MDPI and/or the editor(s) disclaim responsibility for any injury to people or property resulting from any ideas, methods, instructions or products referred to in the content. |
© 2024 by the authors. Licensee MDPI, Basel, Switzerland. This article is an open access article distributed under the terms and conditions of the Creative Commons Attribution (CC BY) license (https://creativecommons.org/licenses/by/4.0/).
Share and Cite
MDPI and ACS Style
Zhang, H.; Yoshida, S. Exploring Deep Neural Networks in Simulating Human Vision through Five Optical Illusions. Appl. Sci. 2024, 14, 3429. https://doi.org/10.3390/app14083429
AMA Style
Zhang H, Yoshida S. Exploring Deep Neural Networks in Simulating Human Vision through Five Optical Illusions. Applied Sciences. 2024; 14(8):3429. https://doi.org/10.3390/app14083429
Chicago/Turabian StyleZhang, Hongtao, and Shinichi Yoshida. 2024. "Exploring Deep Neural Networks in Simulating Human Vision through Five Optical Illusions" Applied Sciences 14, no. 8: 3429. https://doi.org/10.3390/app14083429
Note that from the first issue of 2016, this journal uses article numbers instead of page numbers. See further details here.