Article

Investigation of Steep Waste Dump Slope Stability of Iron Ore Mine—A Case Study

1
School of Mines, China University of Mining and Technology, Xuzhou 221116, China
2
College of Environmental Science and Engineering, Liaoning Technical University, Fuxin 123000, China
3
State Key Laboratory of Coal Resources and Safe Mining, China University of Mining and Technology, Xuzhou 221116, China
4
Huzhou New Kaiyuan Gravel Co., Ltd., Huzhou 313000, China
5
High Tech Research Center for Open-Pit Mines, China University of Mining and Technology, Xuzhou 221116, China
6
Department of Sustainability and Planning, Aalborg University, 9000 Aalborg, Denmark
*
Author to whom correspondence should be addressed.
Appl. Sci. 2024, 14(8), 3430; https://doi.org/10.3390/app14083430
Submission received: 9 January 2024 / Revised: 18 March 2024 / Accepted: 11 April 2024 / Published: 18 April 2024

Abstract

:
Using a combination of experimental and numerical methods, this study examines the stability of the slope of Waste Dump#1 in Ziluoyi Iron Mine. We conducted direct shear tests on soil samples taken from the waste dump, which provided important insights into slope stability. The tests identified key mechanical parameters, including an average cohesion of 4.80 kPa and an internal friction angle of 25.63°. By implementing GEO-SLOPE software, we could determine that the slope stability factor is 1.047, which is far from the required safety standards. To address this issue, we proposed an appropriate rectification strategy including the construction of safety platforms and reconfiguration of the slope structure. This approach effectively improved the slope stability factor to 1.219 and met the safety criteria. In addition, particle flow code (PFC) simulations were methodically performed to model the slope morphology and particle displacement before and after rectification. The obtained results revealed a remarkable reduction in sliding areas and particle displacement post-rectification, enhancing mine safety and efficiency. Our findings provide valuable insights into the application of combined experimental and numerical methods to assess and improve slope stability in open-pit mines, which will substantially contribute to the field of geotechnical engineering and mining safety.

1. Introduction

As the scale of open-pit mining continues to expand and the depth of mining continues to increase, a large number of various forms of sunken waste are gradually formed, which inevitably results in mining slopes up to hundreds of meters high. The existence of such a mine dump slope seriously endangers the natural equilibrium of the initial ground stress [1], and in severe conditions, it leads to the deformation and failure of slopes or even geological disasters. These situations substantially affect the safety of mine operations and lead to significant economic losses. According to statistics, slope collapse accidents accounted for the majority of geological disasters in China in the past decade [2,3]. In addition, substantial life and property losses caused by the failure of man-made slopes and related hazards in Atlantic provinces [4], Japan [5], Canada [6], and Italy [7] among others were emphasized in the literature. The collapse of open-pit mines is also one of the main factors causing casualties. With the continuous expansion of the production capacity, the safety problem of open-pit mining areas is becoming more and more prominent, which seriously restricts the safe and efficient production of open-pit mines.
The methods employed in analyzing the stability of open-pit mine slopes mainly include limit equilibrium that satisfies static equilibrium [8], finite element method [9], finite difference method based on continuous media [10], and discrete element method [11]. For the mechanical calculation of discontinuous media, some investigators [12,13,14] summarized the stability research methods of high and steep slopes, suggesting that progressive damage of slope rock mass is a precursor of slope rock mass instability, and appropriately classified the damage modes of slopes into creep-slip-tension damage, and tension-slip damage. According to some scholars [15,16,17], analyzing the stability of high and steep slopes requires expertise from various disciplines. It cannot be solely based on mathematical and mechanical methods for computational representation and evaluation. Instead, it must consider the geological conditions of slopes and rely on sound judgment [18,19,20], and the characteristics of the rock mass itself, are the key to improving the stability of slopes. Chen [21] collected soil samples from the discharge field and performed direct shear tests to obtain the shear strength parameters of the soil body, which provided a theoretical basis for the structural design of the discharge field. Ding et al. [22] and Cai et al. [23] suggested that vertical load and shear rate are among the chief factors affecting the results of the direct shear test, the two levels should be separately considered, and the direct shear test should be arranged according to the orthogonal test plan. Dahri et al. [24] and Shen et al. [25] predicted the shear strength of granular materials via particle swarm optimization-radial basis function (PSO-RBF) neural network. The obtained results revealed that at 2% water, the shear strength of HL, QL, and calcite powders all exhibited a regular growth in shear strength, which reduced with increasing SL powder.
Tian and Jiao [26] and He et al. [27] reviewed the current status of PFC application from the perspective of mining engineering in four classifications. Gao et al. [28] and Peng et al. [29] carried out numerical simulations with discrete element software to examine the mechanical properties of intact rock and joints, developed a rock slope model containing dense joints, and discussed the influence of joint connectivity on the shape of slope damage. Tian et al. [30,31] proposed a coupled discrete and continuous calculation method, and the fine mechanical factors of the particle model were determined via the angle of repose test, triaxial compression test, and simulation. Zhang et al. [32] and Cong et al. [33] proposed a three-dimensional gain-based model (GBM) based on particle flow code (PFC), namely PFC3D-GBM, which is able to group mineral particles on a three-dimensional scale. Jiang et al. [34], Zhang et al. [35], and Ma LuJiang [36] investigated the law of the influence of rainfall on the safety and reliability of waste dump slopes. The obtained results indicated that rainwater infiltration makes the water content, the pore water pressure of the soil layer of the slope gradually becomes larger, the shear strength of the soil body weakens, the safety factor of the slope decreases, and the probability of the slope becoming unstable increases. Lin [37] and Lan [38] combined a variety of numerical analysis methods to perform a comprehensive analysis of the slope stability of the waste dump, adopted GeoStudio and FLAC3D software for further calculations and verifications, and proposed the corresponding slope stabilization measures. Based on numerical simulation methods and slope engineering samples, Zhang et al. [39], Wang [40], and Wang and Chen [41] analyzed the damage mode of the waste dump slope. The results indicated that the stability of the multi-stage earth waste dump slope is better than that of the single-stage slope, which represents the best solution for the stability of the open-pit mine and provides a reference for evaluating and controlling slopes in open-pit mines. In the presence of an inclined crack and parallel cracks in the body of rock, some research works have been also been devoted to mechanically examining the characteristics of fractures [42,43].
The main aim of this investigation is to improve the methodology used for slope stability analysis and develop a reliable slope construction plan for mining sites. Our approach includes in situ sampling and laboratory tests to determine soil mechanical parameters, which are then combined with geological information to simulate stability. The results of these simulations guide the development of a rectification plan. After that, the stability and displacement of the slope after rectification are rationally evaluated via the combined approaches of GEO-SLOPE and PFC. This comprehensive methodology is designed to ensure the safe and efficient operation of mining sites.

2. Materials and Methods

In the following subsections, first, the site location and soil sampling for obtaining the mechanical behavior of the soil through conducting direct shear tests are explained. The obtained crucial factors, including cohesion and internal friction angle, are effectively employed for evaluating the slope stability based on the Morgenstern–Price approach. In the following, the basic principles of the PFC numerical approach are introduced. This efficient numerical scheme enables us to predict three-dimensional displacements of granular materials of the understudy slope under various loading scenarios.

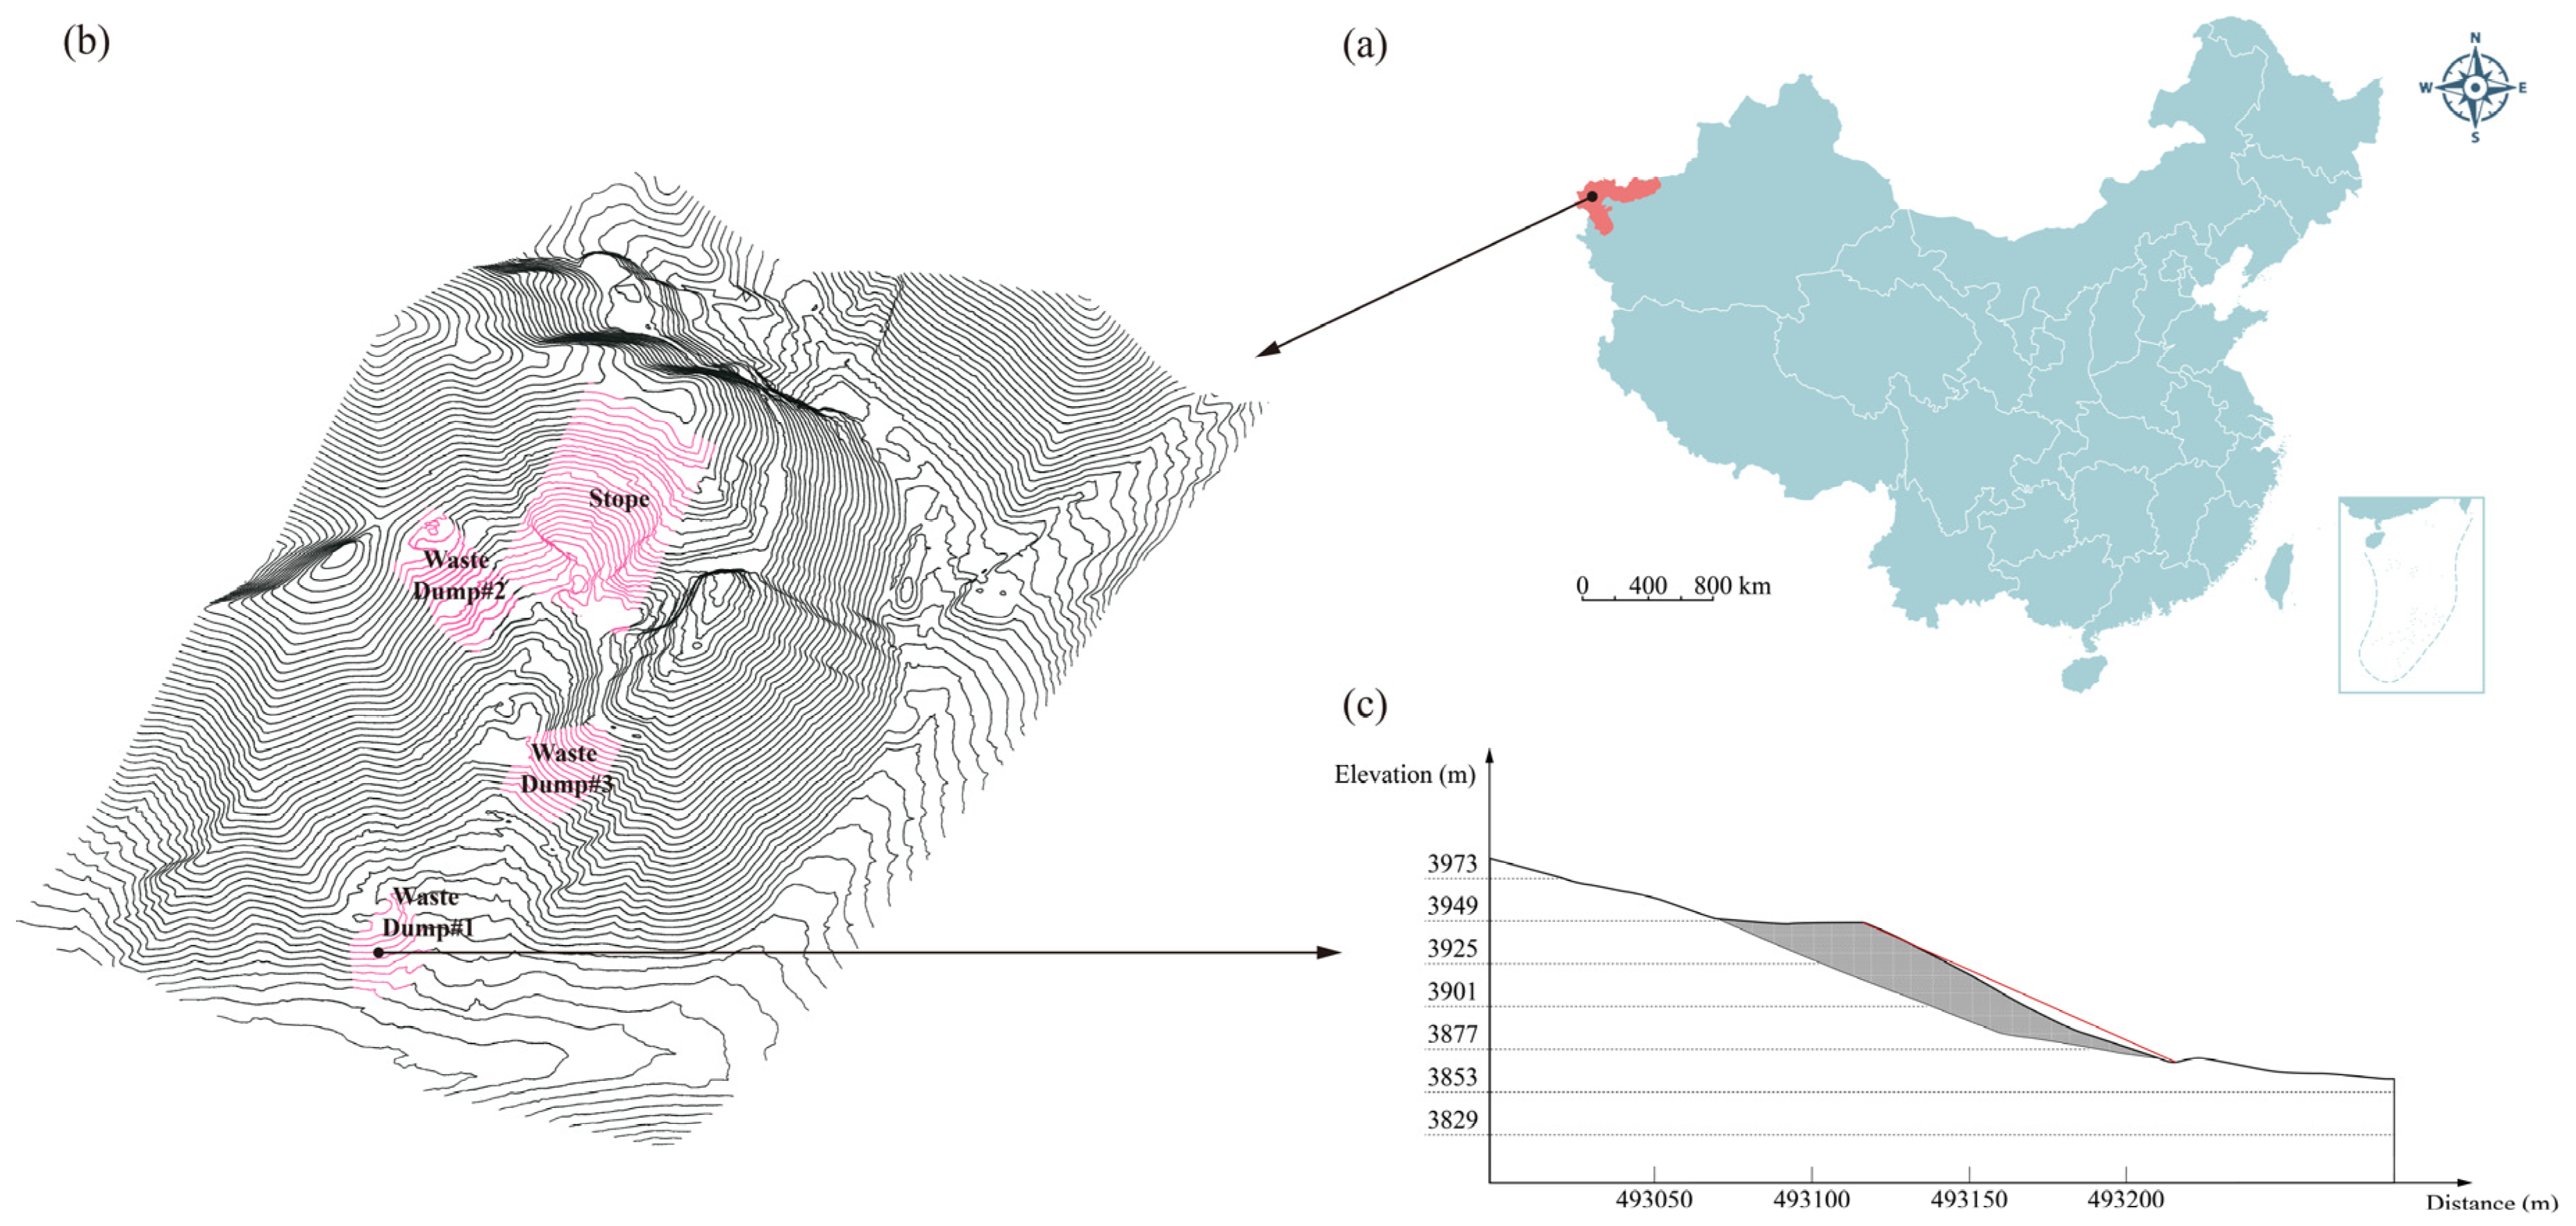
2.1. Iron Mine Location Data and Slope Morphology

Ziluoyi Iron Mine is located in Aketao County, 130 km southwest of 227 bearings, located between longitude 73°26′5″~76°43′31″ E and latitude 37°41′28″~39°29′55″ N. The mine area is located in the high mountainous area at the eastern edge of the Pamir Plateau. The mine is located in the alpine zone at the eastern edge of the Pamir Plateau, and the terrain is generally high in the west and low in the east, high in the south and low in the north. The topography is more undulating, the gullies are more developed, and it is a geomorphological type dominated by erosion tectonic alpine. The corresponding bedrock is better exposed, and most of the area is covered by the Quaternary System. The Kushan River, 1km northeast of the mine, is a perennial surface water flow, and the Ziluoi River, a small tributary in the Kushan River basin, is a seasonal surface water flow, with the main sources of water recharge from the spring glaciers, snow and ice meltwater, and atmospheric precipitation recharge.
The Ziluoyi Open-pit Iron Mine is currently in the early stages of open-pit construction, and the existing soil disposal areas lack unified planning. Based on the three-dimensional geological information of the Ziluoyi Open-pit Iron Mine, as illustrated in Figure 1, it is evident that the mine contains three dumps and one mining area. Among them, 2# and 3# are relatively stable, while 1# has potential hazards due to its steep slope. The slope height of Waste Dump#1 is less than 100 m, and there are problems such as a large base dip angle and large step height that need to be rectified. Therefore, this study primarily focuses on the stability analysis of Waste Dump#1 as well as the ways to enhance its stability and rationally mitigate its deformation. To begin with, the measurement lines were set in the direction of Waste Dump#1, and the topographic characteristics of this region were obtained. The layout of these measurement lines is illustrated in Figure 1.

2.2. Sample Collection and Preparation

Determining the mechanical properties and strength parameters of the soil is essential for the rational design of the slope. To understand the mechanical properties and strength of the soil in Waste Dump#1, including shear strength, internal friction angle, and cohesion, soil samples were collected at the site to test the mechanical properties.

2.2.1. Soil Sampling

To eliminate sample numbering bias, three sampling points were selected in Waste Dump#1 for collecting soil samples. Sampling Point 1 (labeled PTC-1-1), Sampling Point 2 (labeled PTC-1-2), and Sampling Point 3 (labeled PTC-1-3) represent the samples collected at the exit of the dry selection plant, at the top of the slope, and on the safety platform of the dump, respectively.

2.2.2. Soil Sample Preparation

The soil samples were appropriately collected and tested based on the standards outlined in ASTM (American Society for Testing and Materials). To determine grain size distribution and the relationships of various phases (porosity, dry unit weight) in the laboratory, we followed ASTM recommendations (ASTM D422–63 2007 [44], ASTM D2217–85 1998 [45], and ASTM D-4318 2010 [46]). For this purpose, the size of all soil particles should be less than 60 mm. The maximum allowable differences between the density, moisture content, and the counterparts of preparation standards in order were ±0.02 g·cm−3 and ±1%. The primary instruments used for sample preparation were the JYS200 soil sieve (Hebei Zhongyi Weichuang Testing Instrument Co., Ltd., Cangzhou, China) with a sieve hole size of 0.075 mm to 0.3 mm, and a high-precision YT2204 electronic balance (China) with a measuring range of 200–500 g and an accuracy of 0.1 mg. Initially, the field-obtained samples were sieved in stages, with a portion passing through a 2 mm sieve used for direct shear and consolidation mechanical property tests (ASTM D3080-11 [47]), as illustrated in Figure 2.

2.3. Direct Shear Test

2.3.1. Test Parameter Setting

The experiment utilized a ZJ strain-controlled direct shear apparatus (Nanjing Soil Instrument Factory Co., Ltd., Nanjing, China) to determine the soil shear strength. Typically, four specimens were sheared at various vertical stresses to calculate the shear stress at failure. The maximum vertical stress was set to 400 kPa with stress levels of 100, 200, 300, and 400 kPa. These stress conditions were chosen to represent the different stress conditions that soils typically encounter in an open-pit mining environment such as the Ziluoyi Iron Mine. We need various vertical stress levels to appropriately plot the curves of shear strength in terms of the vertical stress and then suitably extract the cohesion (c’) and internal friction angle (φ’) of the soil from variously plotted curves. The loading rates used in direct shear tests (i.e., 2.4, 0.8, 0.1, and 0.02 mm/min) are mainly based on standard geotechnical test methods. Such diversity of shear displacement rates ensures a comprehensive evaluation of soil behavior under different consolidation conditions, which is crucial for understanding soil response in dynamic mining operations i.e., the lower values of loading rates allow the pore water in the soil sample to be drained easily in the consolidation process (for example, consolidation of sandy soils or soils with higher levels of permeability), while the higher levels of loading rates represent the more likely undrained cases during consolidation (for example, consolidation of clay soils or in general, soils with low levels of permeability, or soil under high levels of loads with high gradients). This experimental approach follows Mohr–Coulomb’s law to determine the shear strength coefficient, internal friction angle, and cohesion. The key technical specifications were as follows:
  • Vertical (normal) stress: maximum 400 kPa;
  • Pressure levels: 100, 200, 300, and 400 kPa;
  • Bar ratio: 1:12;
  • Shear boxes: 4;
  • Horizontal shear force: maximum 1.2 kN;
  • Specimen size with square cross-sections: 30 cm2 × 2 cm (H);
  • Loading rates: 2.4, 0.8, 0.1, and 0.02 mm/min.

2.3.2. Experimental Procedure of Direct Shear Test

First, we weighed 1200 g of the soil sample that passed through a 2 mm sieve and measured the required amount per dry density requirements with an accuracy of 0.1 g.
We then aligned the top and bottom boxes, inserted the locking pins, and placed a clean and permeable plate inside the shear box.
Subsequently, we poured the prepared soil sample into the shear box, suitably leveled the surface, placed a hard wooden block on top, lightly taped it to achieve the desired dry density, and then removed the wooden block.
Four tests were conducted under various vertical stresses: 100, 200, 300, and 400 kPa. The vertical pressure can be gradually applied or in steps to prevent sample extrusion, especially if the soil is loose.
Let us rotate the handwheel until the steel ball at the front end of the upper box contacts the load sensor or load cell and then adjust the load sensor or load cell reading to zero. Then, we sequentially placed the pressure plate, steel balls, and pressure frame and installed the vertical displacement sensor to record the initial reading.
We then applied vertical pressure according to the specified steps. After exerting the vertical pressure, the locking pins are immediately removed. Let us then start the stopwatch, shear at a rate of 0.8–1.2 mm/min, and rotate the wheel at a uniform speed of 4–6 rpm to shear the sample in 3 to 5 min. When the shear stress reading stabilizes or declines significantly, it indicates failure of the specimen. If the shear stress reading increases, the shear deformation should reach 6 mm. The load sensor or load cell was measured with each rotation and, if necessary, the vertical displacement readings were recorded until failure.
After shearing, we removed accumulated water from the shear box, reversed the wheel, removed the vertical pressure, frame, steel balls, and pressure plate, and took out the sample. In continuing, we follow the following steps:
  • Sorting of the test results:
  • Calculate the shear stress and shear displacement for each sample per the following formulations:
    τ = CR,
    ΔL = ΔL’(nR)
    where τ denotes the shear stress in kPa, ΔL represents the shear displacement (unit: 0.01 mm), and C is the correction factor of the load cell (unit: kPa/0.01 mm). In addition, R denotes the load cell micrometer reading in 0.01 mm, ΔL′ represents the shear displacement for one revolution of the rotating wheel in 0.001 mm, and n is the number of rotations.
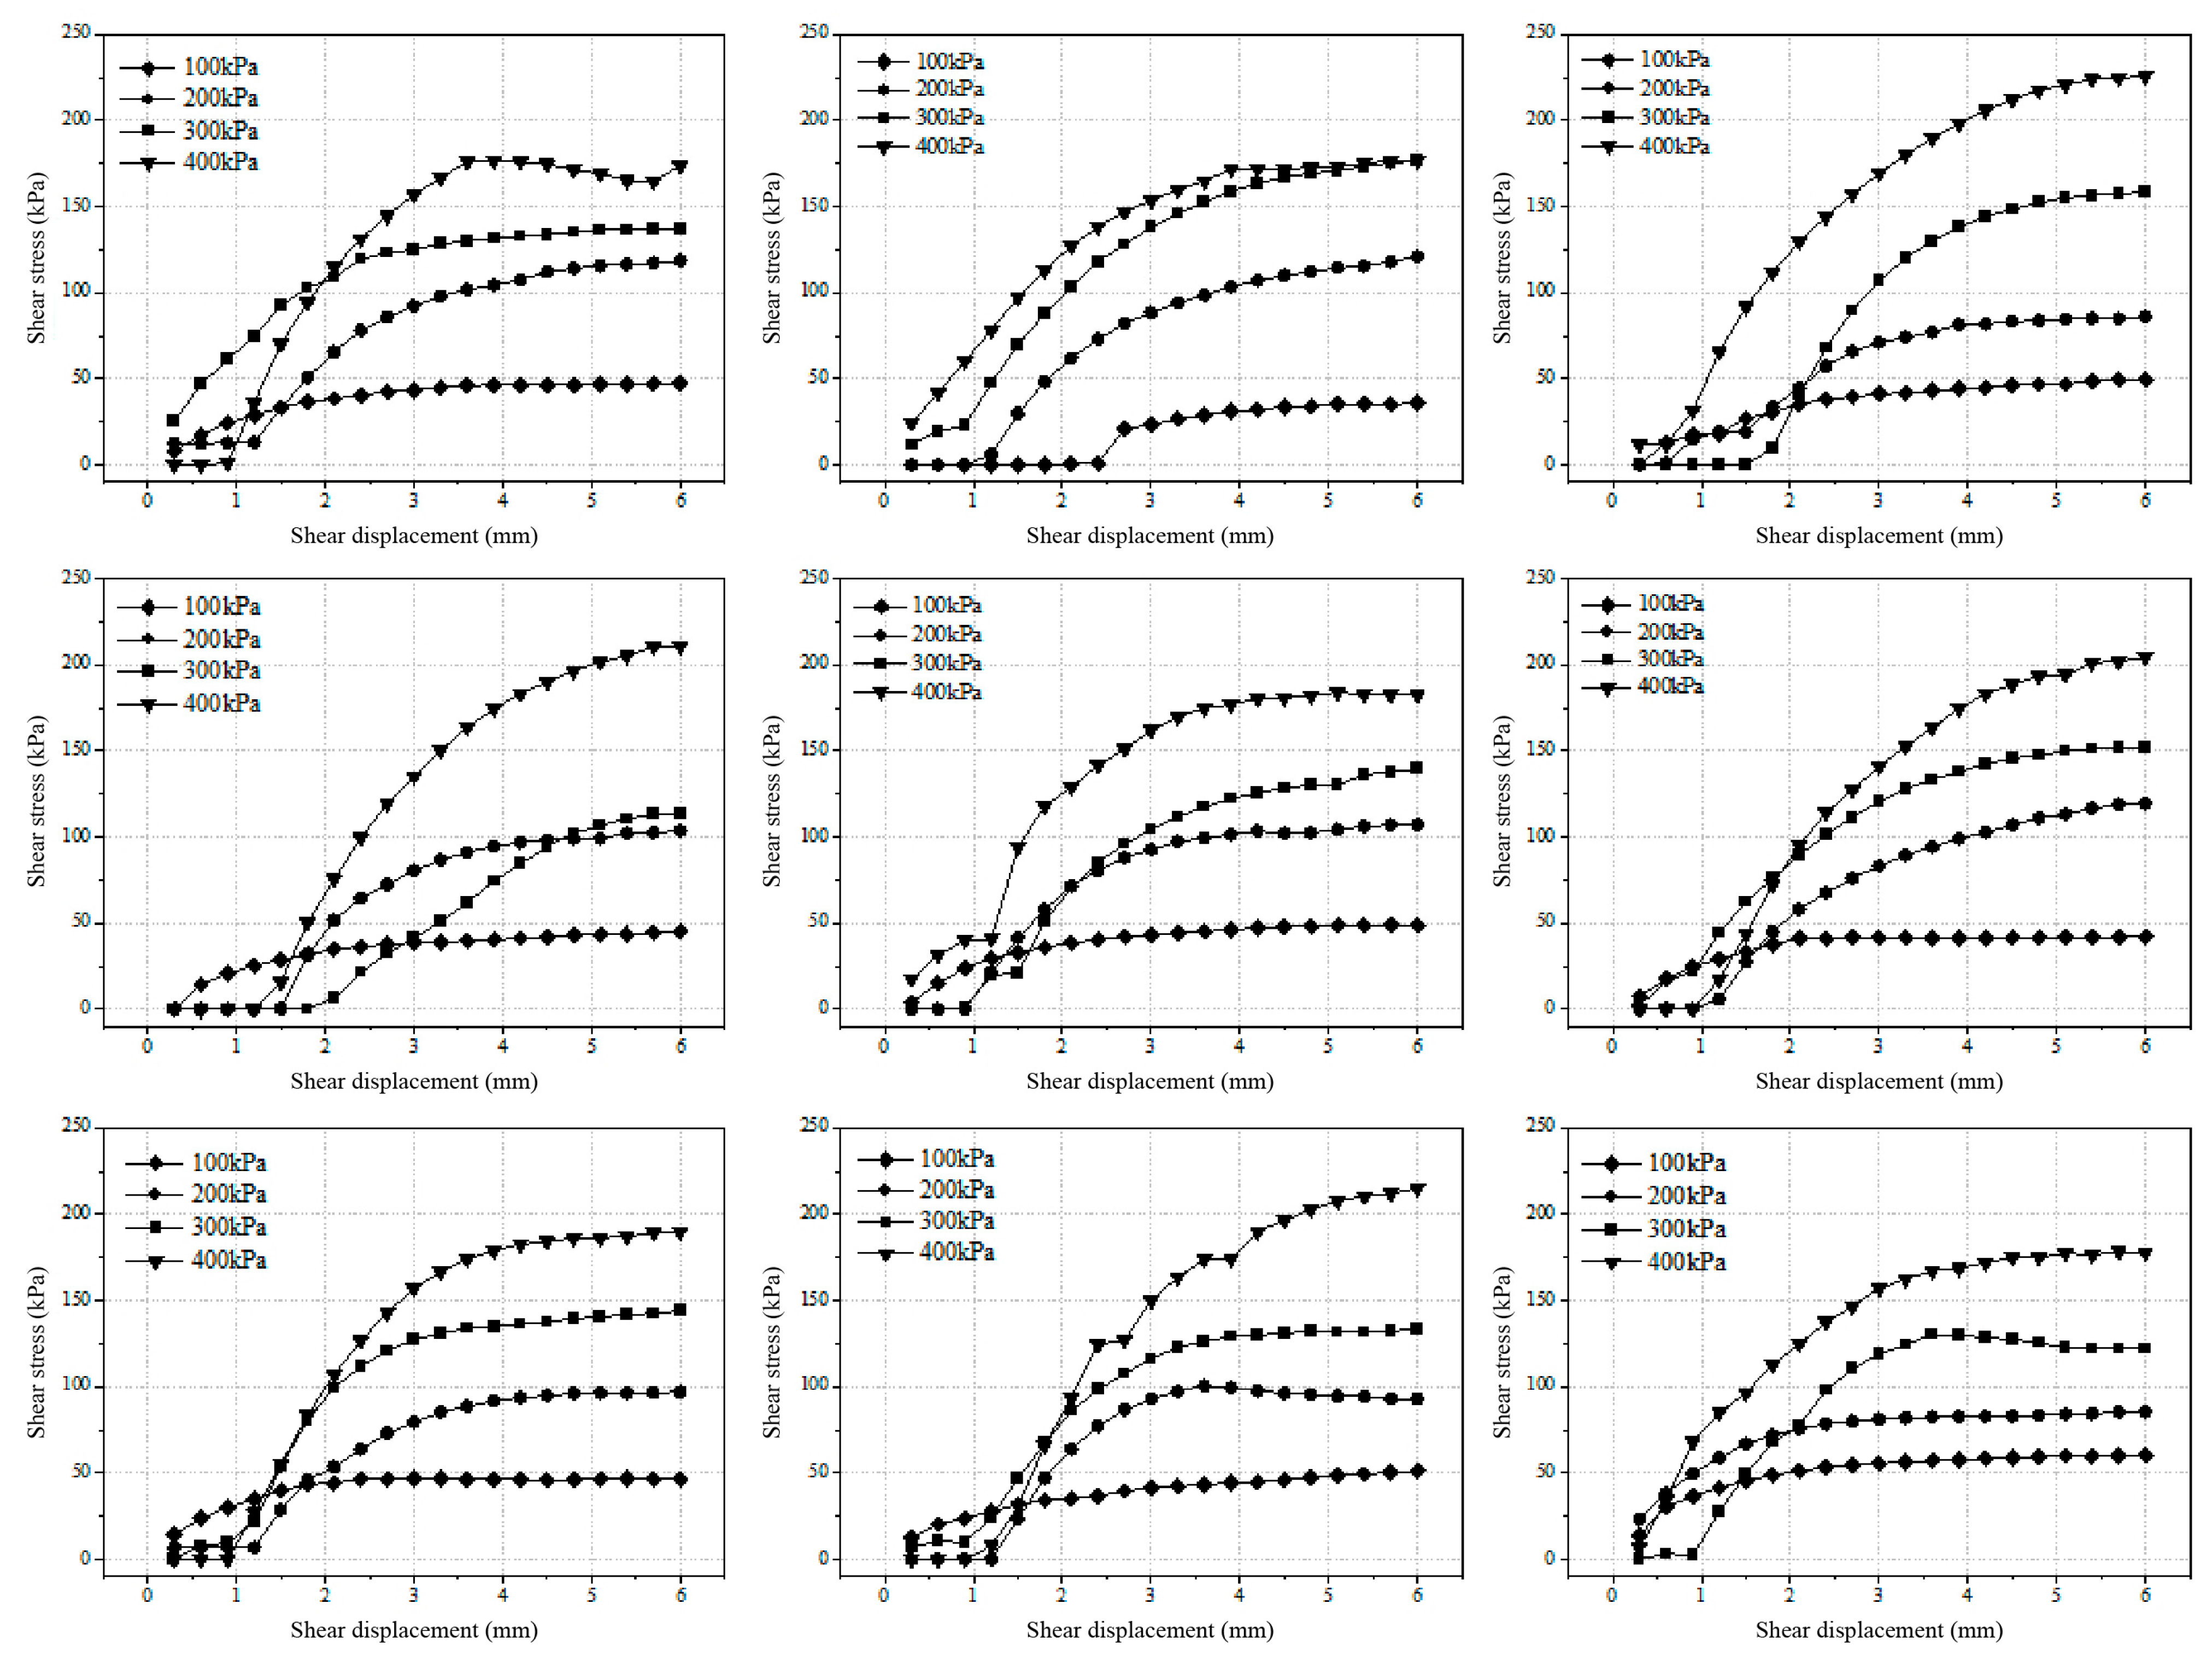
  • Plot the shear stress in terms of the shear displacement and then determine the peak or stable value on the relationship curve as the shear strength of the soil;
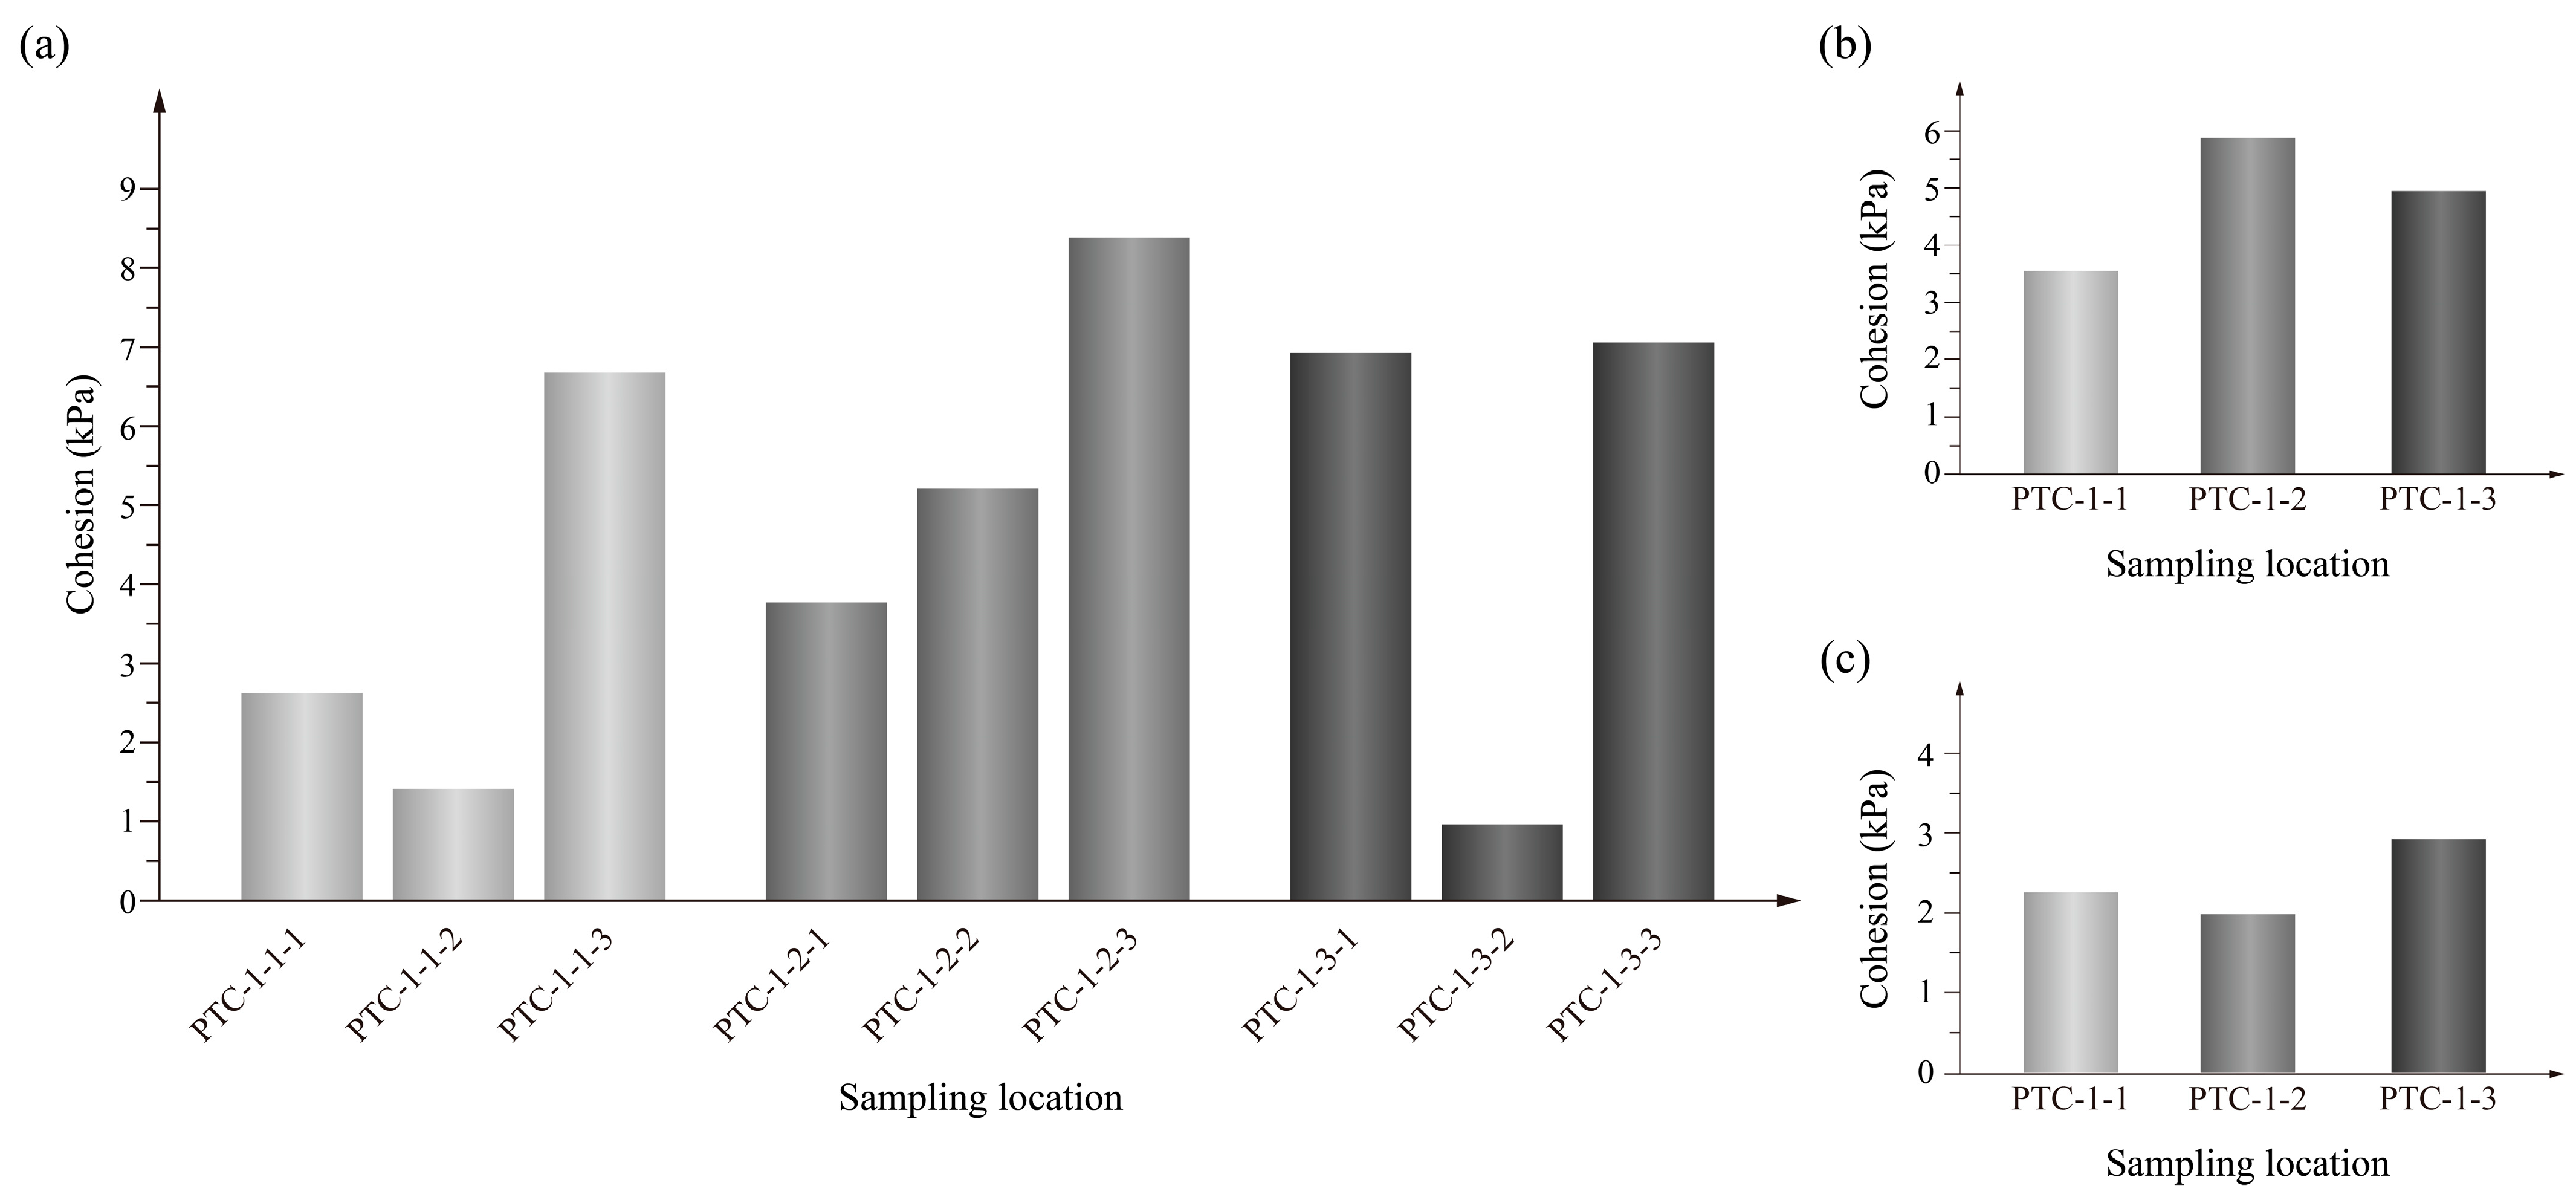
  • Calculate the cohesion and the internal friction angle of the soil using the relationship.
The experimental instruments and pieces of equipment for sample testing have been provided in Table 1.

2.4. Slope Stability Analysis

The limit equilibrium analysis method is one of the earliest and most extensively employed methods in the field of engineering analysis. Fellenius (1936) [48] and Taylor (1937) [49] proposed the method of sections (a Swedish approach) on the basis of the work of predecessors according to the principle of limit equilibrium. Since then, Bishop, Salma, Janbu, and others have put forward various assumptions and stability analysis methods. In this study, the Morgenstern–Price approach is implemented for the stability analysis and evaluation of the slope stability of Waste Dump#1 in the Ziluoyi Open-pit Iron Mine.
The main assumptions utilized in the stability analysis of the problem, which somehow reflects the limitations of the present study, are as follows:
  • The discharge material (in the present case study, Ziluoyi Iron Mine, Waste Dump#1) is both homogenous and isotropic;
  • No sizeable cracks exist in the main spatial domain of the discharge material;
  • In the mechanical modeling of the problem, the quartz schist medium underneath the discharge material is assumed to be rigid;
  • The mechanical strength of the discharge material obeys the Mohr–Coulomb criterion;
  • The failure surface entirely takes place inside the discharge material, which possesses a lower strength than the underlying quartz schist domain.

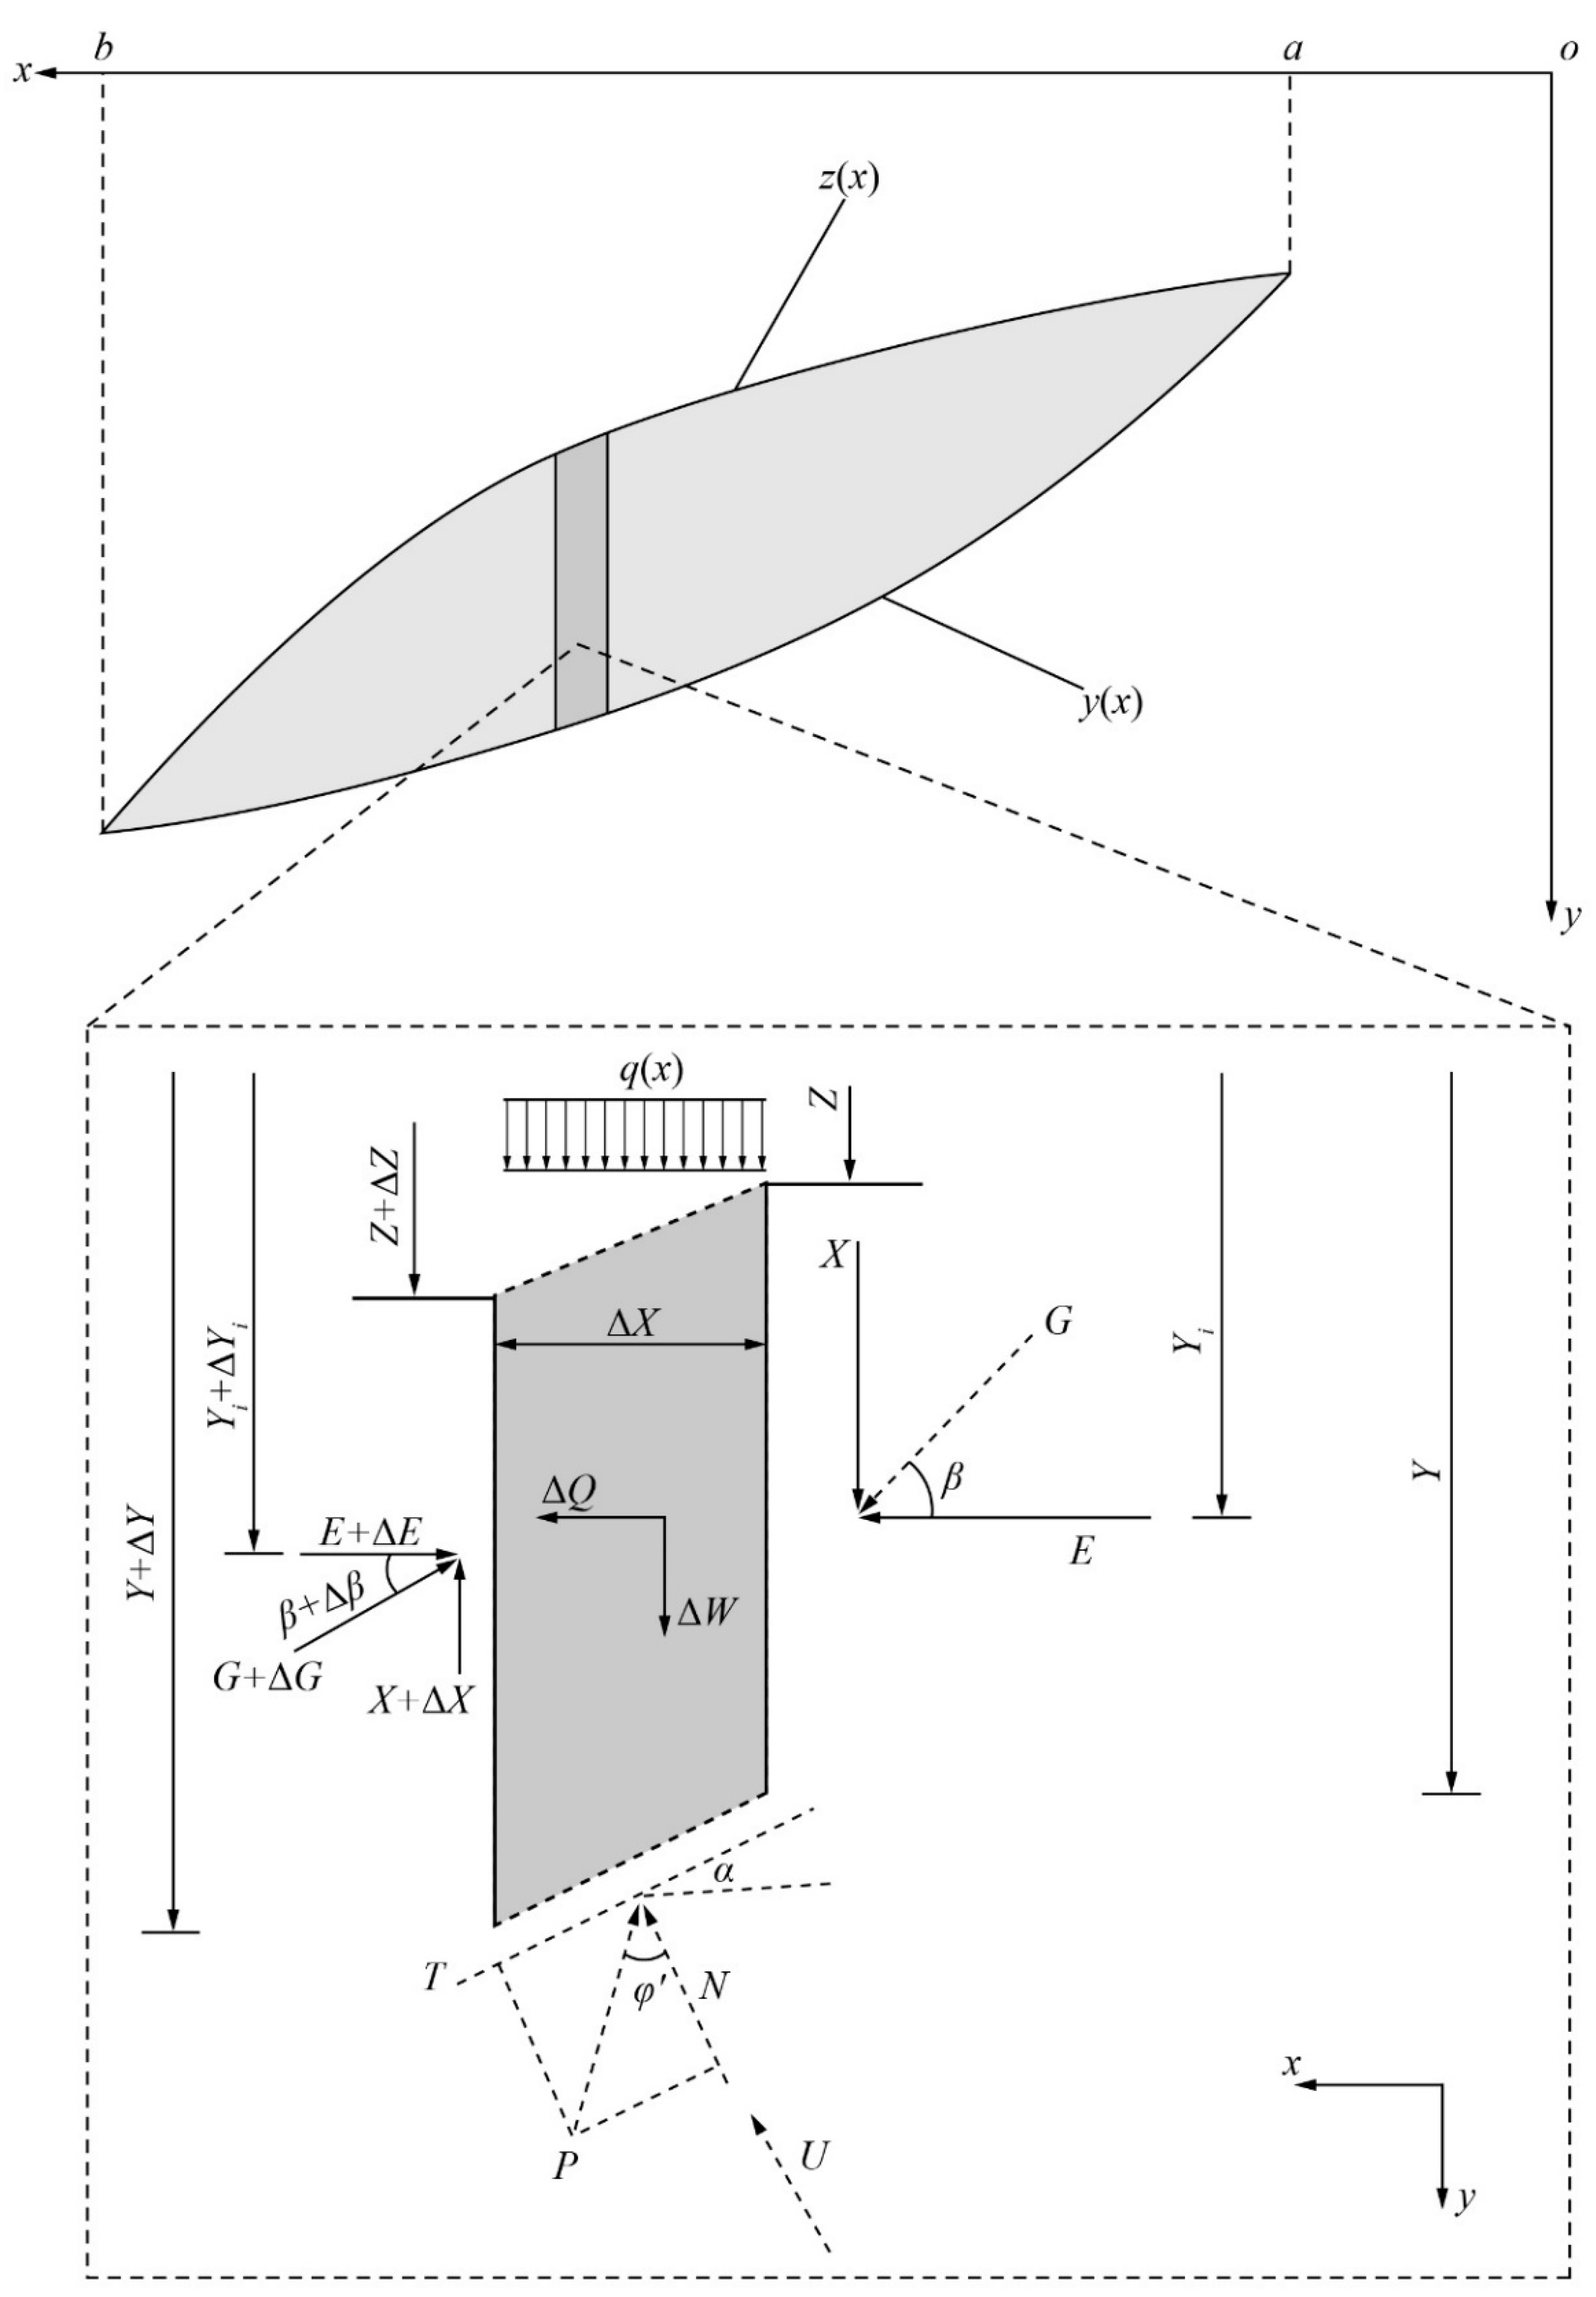
2.4.1. Morgenstern–Price Method

The Morgenstern–Price method is a sophisticated approach to limit equilibrium theory that is famous for its accuracy and comprehensiveness in slope stability analysis. The method is particularly adept at accommodating slip surfaces of arbitrary shape, which is a crucial feature for the realistic modeling of natural slopes. This requires that the setting of the unknown variables fully match the mechanical properties of the soil and rock, ensuring that the analysis is based on realistic physical properties.
Similar to many other limit equilibrium-based approaches, the Morgenstern–Price method does not employ Young’s modulus (E) in assessing the stability of the soil slope. This approach is mainly based on the effective parameters of the soil (effective cohesion (c’), effective internal friction angle (φ’), pore pressure (u)), as well as geometrical data of the slope. This method considers both normal and tangential equilibrium along with the moment equilibrium for each slice and is applicable to both circular and noncircular slip surfaces.
The main core of this approach is to establish differential equations of static equilibrium and equations of moment equilibrium for individual slices of the slope. This segmented approach allows for a detailed and accurate understanding of slope stability under different conditions. As depicted in Figure 3, it is essential that the shear stresses in the vertical plane along both sides of the divided soil strip do not exceed the shear capacity available in this plane. This constraint ensures that the analysis accurately represents the soil’s ability to resist the shear under applied loads.
Through this method, we are able to systematically describe slope stability and provide a comprehensive and reliable assessment of potential risks and failure mechanisms. The detailed structural system and implementation of the Morgenstern–Price approach, as adopted in our investigation, are illustrated in Figure 3. To this end, consider a slice with an infinitesimal length of Δx, and the slope angle of α. All exerted forces on the presented slice have been presented and defined in the following. In the presented subfigures, E and X in order stand for the normal and tangential interslice forces, G represents the resultant force of these two interslice forces with angle β with respect to the horizontal, ΔW is the self-weight of the soil strip, N and T in order are the normal force and tangential resistance force at the bottom of the soil slice, U is the normal component of the pore pressure force (=Δx ru sec(α), where ru is the pore pressure at the bottom of the slice), and ht is the height of the slice (=z(x)−y(x)).
The static equilibrium differential equation is given as follows:
cos φ e α + β d G d x sin φ e α + β d β d x G = P x
P x = d W d x + q sin φ e α r u d W d x sec α sin φ e + C e se c α cos φ e η d W d x cos φ e α
C e = C F
φ e = arctg tg φ F
The moment equilibrium equation reads:
G sin β = y d d x G cos β + d d x y t G cos β + η d W d x h t
and the boundary conditions of the problem are taken as follows:
G a = 0 G b = 0 y t a = y a y t b = y b
According to the differential forms of Equations (3), (4) and (7) and the boundary conditions given in Equation (8), the requirement of static equilibrium of the applied forces and moments reads:
a b P x S x d x = 0
a b P x S x t x d x = 0
S x = sec φ e α + β exp [ a x tg φ e α + β d x ]
t x = a x sin β cos β tg α exp [ a ζ tg ( φ e α + β ) d β d ζ ]
M e = a b η d W d x h t d x
where F represents the slope stability factor,   C   and   φ denote the effective rock and soil cohesive force and internal friction angle, r u is the pore pressure parameter, and W is the slide weight.
The static and moment equilibrium requirements of sliding soil are represented by Equations (9) and (10). In the two equations, the slope stability coefficient F and variable β x are included. If the distribution shape of the dip angle β x of the lateral force of the rock and soil strip is assumed to be f x , then:
tg β = λ f x
where λ represents an unknown value. It should be emphasized that for the special case of f(x) = 1 and λ = tan β , the Morgenstern–Price approach is reduced to the Spencer method.
If f x is determined, the stability analysis calculation is concretely reduced to simultaneously solving the two unknowns F and λ contained in Equation (14). In the numerical calculations, by setting f x and using the Newton–Raphson iterative method, the slope stability coefficient ( F ) and the unknown value ( λ ) can be appropriately determined.

2.4.2. Discrete Element-Based Numerical Simulation

PFC5.0 is a software used for numerical simulation based on the discrete element method. It calculates numerical values by generating a large number of particles that vary in size and shape and have different physical properties such as density, stiffness, and friction coefficients. These particles are then used to establish contact models and mesoscopic contact parameters. To simulate the macroscopic mechanical behavior of the model, suitable boundary conditions are applied.
Figure 4 illustrates the PFC3D model for simulating direct shear tests. The numerical simulation model is effectively employed to calibrate the micro-scale parameters. To coordinate the model size and the number of particles, the direct shear test model should be appropriately adjusted through a similar grading method to the size of the particles. Considering the calculation speed and simulation accuracy, the minimum particle size is 0.8 m. The dimensions of the direct shear simulation model are 50 m in length, width, and height, with vertical loads of 100, 200, 300, and 400 kPa. The scale parameters of the slope model are calibrated by fitting the results of the discrete element numerical simulation with those of indoor direct shear tests.

3. Results and Discussion

In the following parts, first, the slope domain and its assumed geometry used for further calculations are introduced. Then, the results of direct shear tests on the samples taken from the slope of Waste Dump#1 are presented, leading to the representative values of the cohesion and internal friction angle based on Mohr–Columb’s law. Based on these crucial factors, the application of GEO-SLOPE 2021.4 software in assessing slope stability and evaluating the safety factor is explained. In continuing, the capabilities of the PFC in capturing the mechanical behavior are revealed by comparing its predicted results with those of the experiments for various vertical stresses. After ensuring the effectiveness and accuracy of the PFC-based model used for justification of the direct shear test results, this model is employed for assessing the slope displacements of the understudied slope and then some suggestions are given for lowering the soil particles’ displacements.

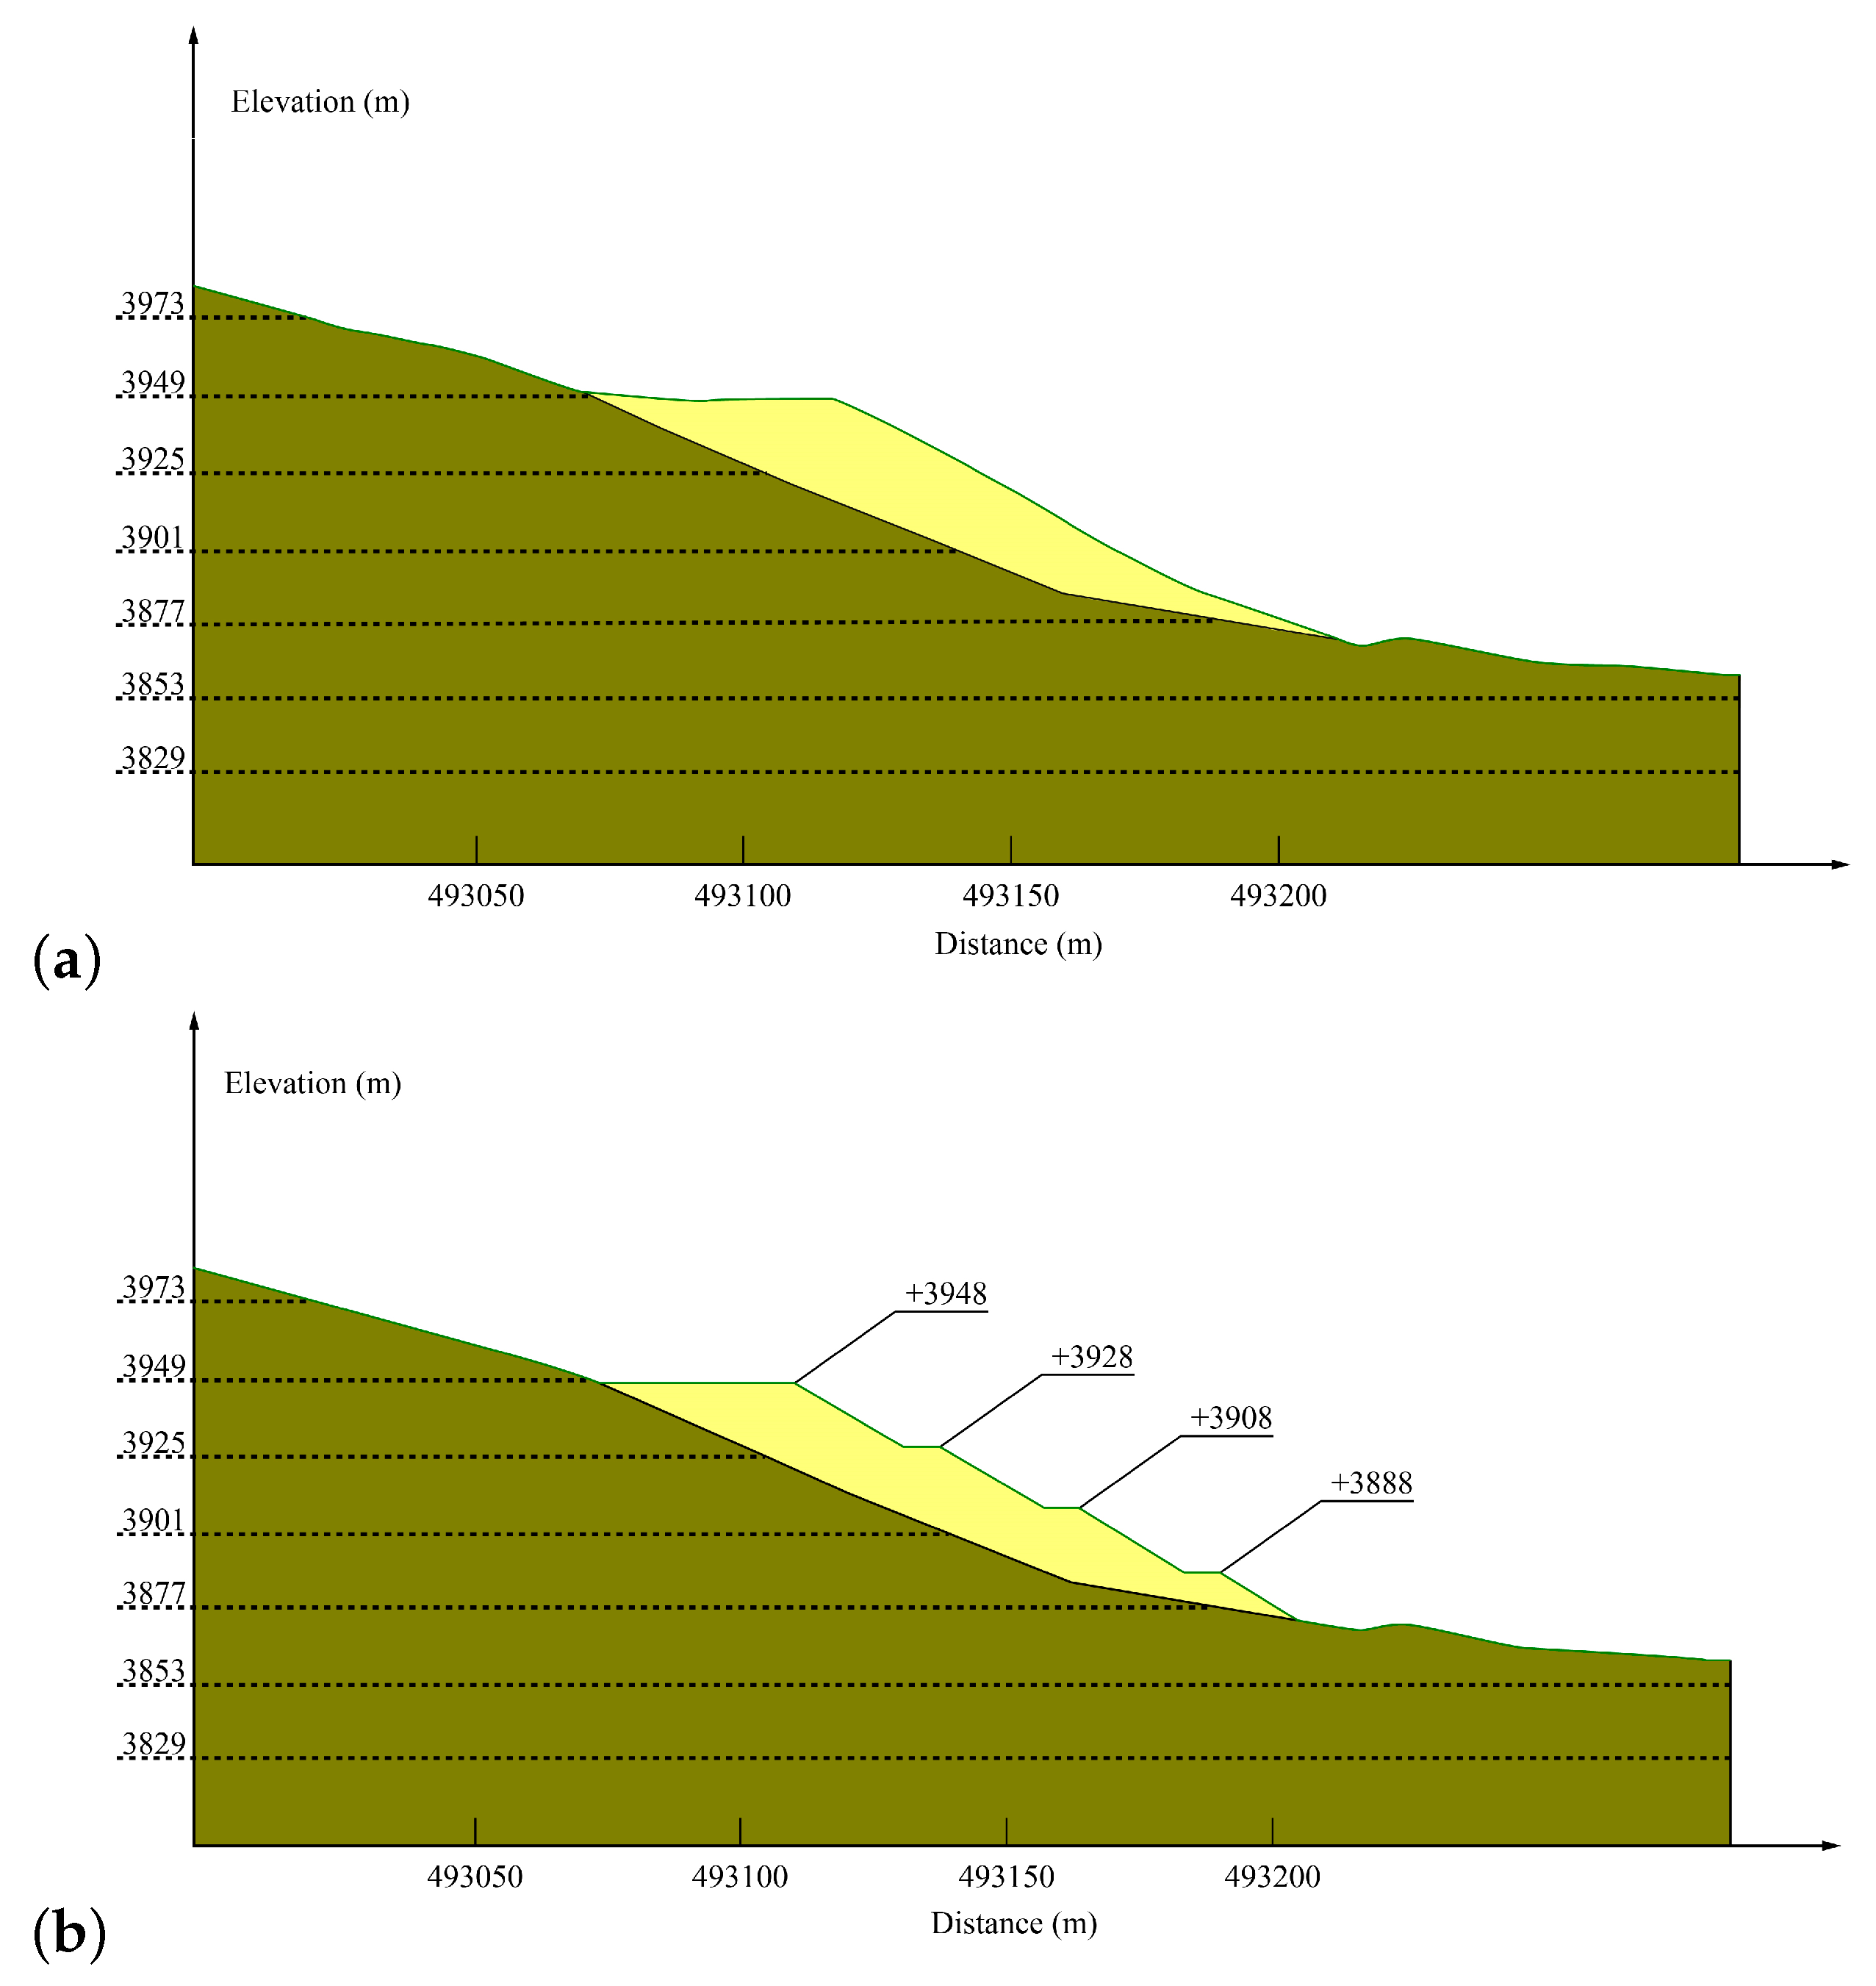
3.1. Slope Profile of Waste Dump#1

A detailed topographic profile of Waste Dump#1, as depicted in Figure 1c, reveals crucial aspects of its geometric structure that are essential to understanding its stability and associated risks. The profile shows that the slope has a significant height of 78 m and an average slope angle of 25°. The base slope of the slope is different and ranges from 9° to 22°. Notably, the slope includes a single and very large step, which contributes to its structural complexity.

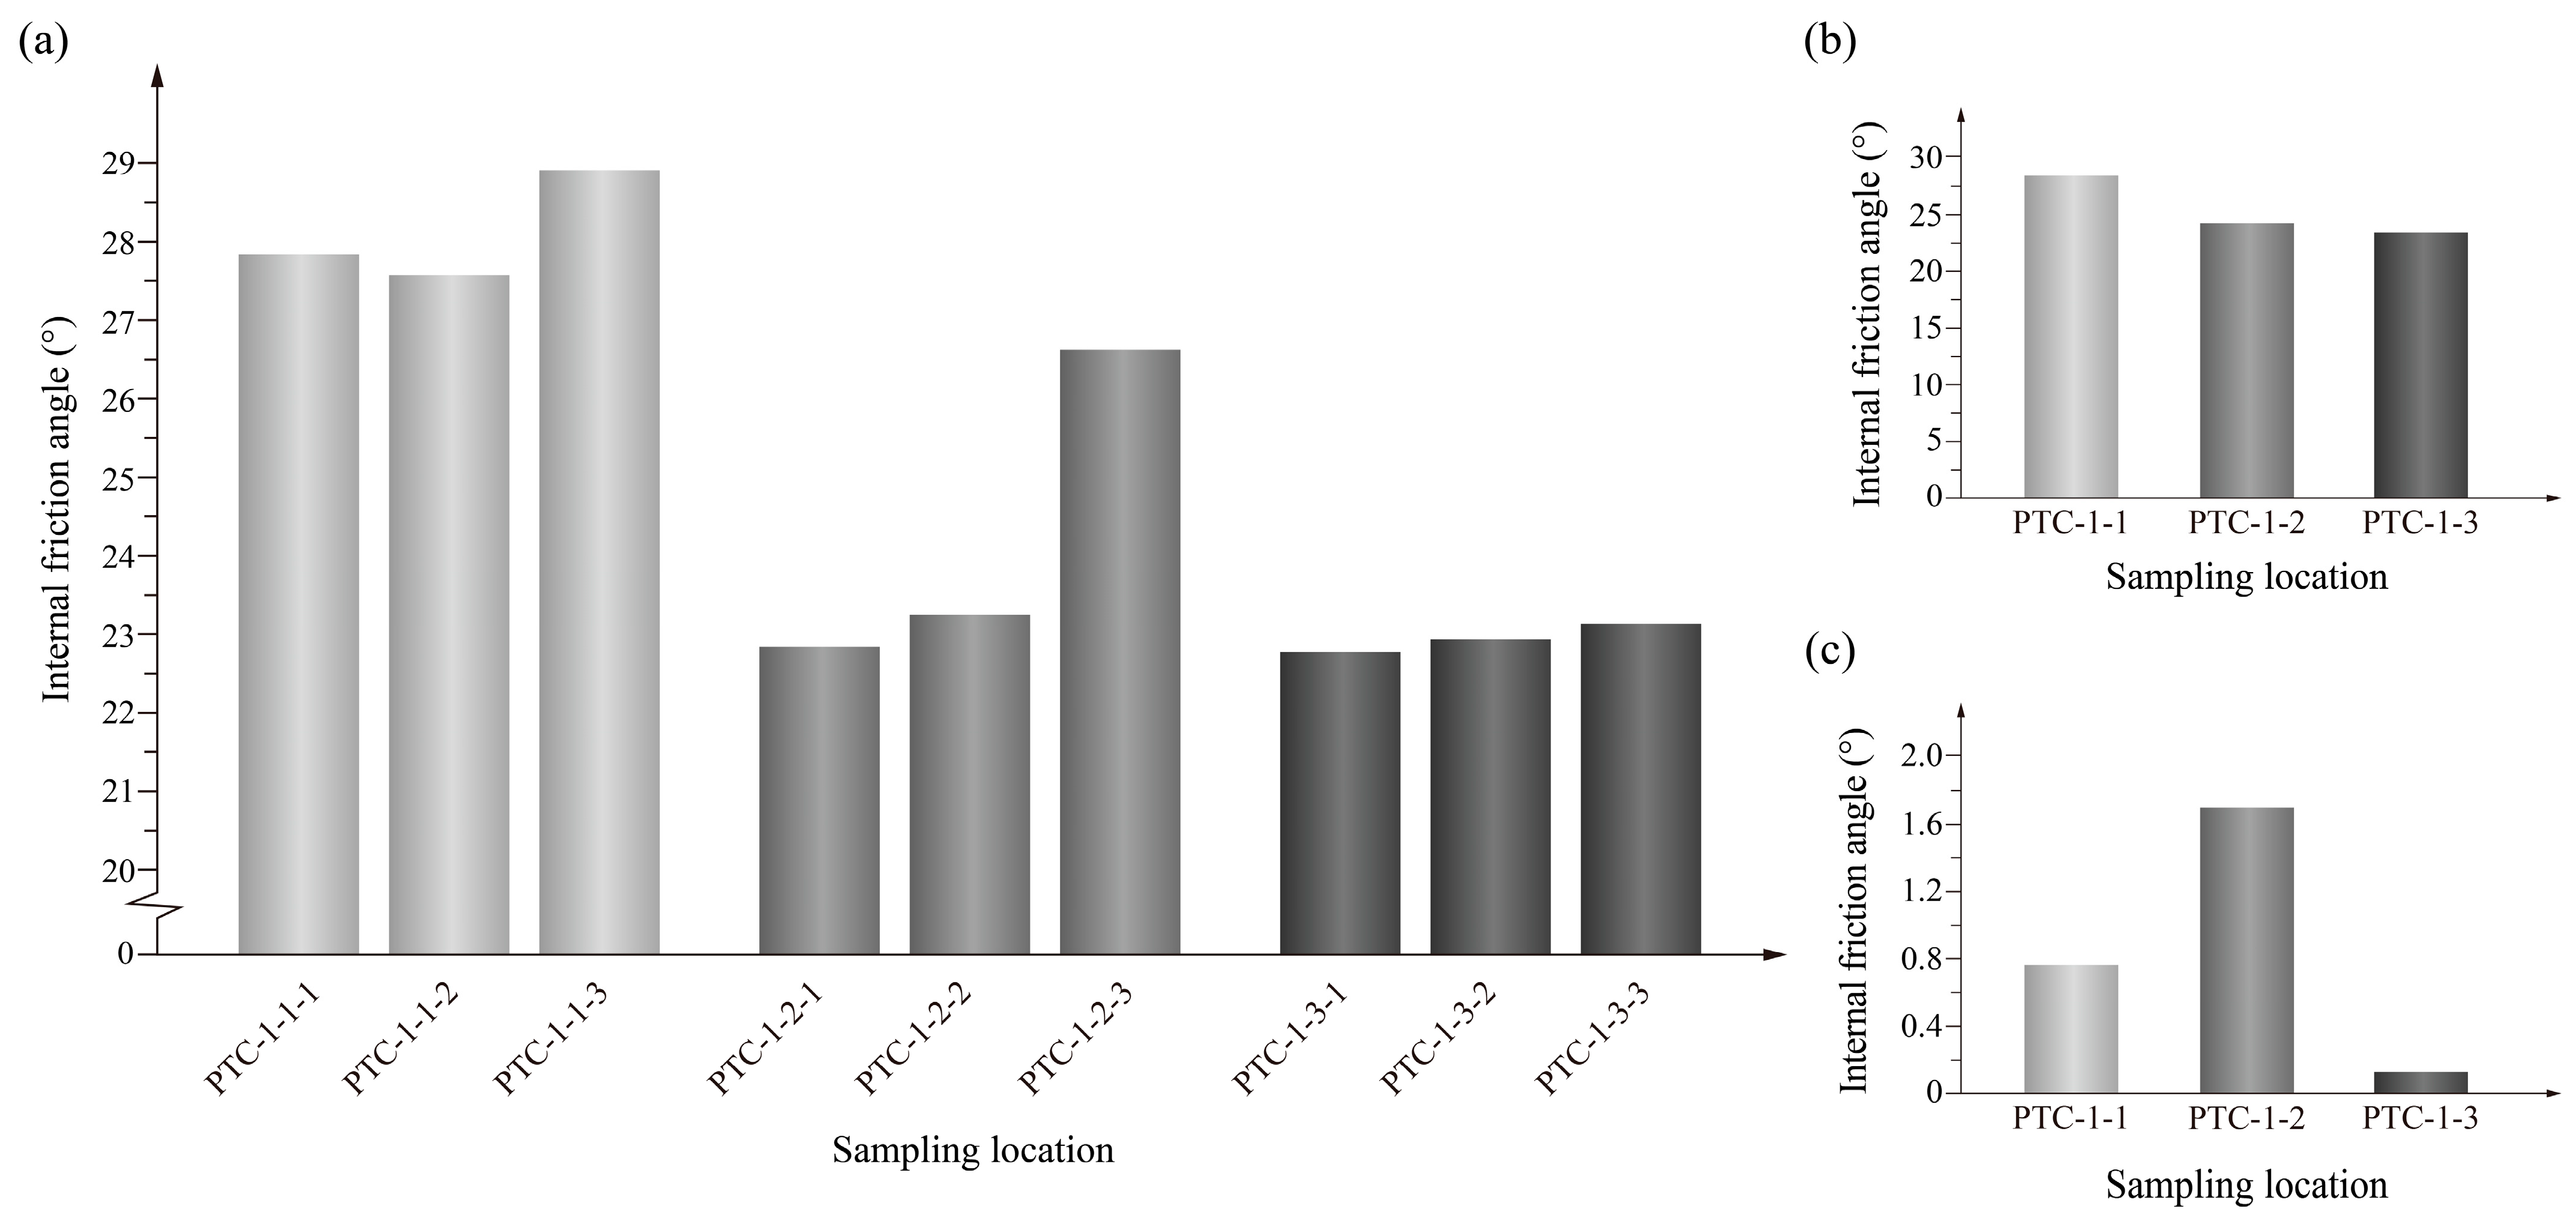
3.2. Experimental Findings

Three direct shear tests were conducted on soil samples taken from three different locations of Waste Dump#1. The plots of the shear stress as a function of the shear displacement for various samples are presented in Figure 5.
From the data illustrated in Figure 5, a clear trend emerges in the relationship between shear stress and shear displacement of soil samples taken from Waste Dump#1. As shear stress increases, there is a corresponding increase in shear displacement. This trend is more obvious when the vertical stress is at 100 kPa, where the shear displacement shows significant sensitivity to changes in shear stress.
However, as the vertical pressure grows beyond 100 kPa, the soil’s sensitivity to shear stress begins to diminish. These observations show that the soil reacts less to shear stress changes under higher vertical stresses. Such a fact is mainly attributed to the increased compression of soil particles under higher pressures, which reduces their ability to move or displace relative to each other.
In addition, it is observed that with the increase in vertical pressure, the total amount of shear displacement tends to decrease. This indicates that the ability of soil to displace is inversely proportional to the applied vertical pressure, representing a crucial feature in understanding the mechanical behavior of soil in the waste dump.
The peaks or stable values observed in the shear stress–displacement curves could be rationally identified as the points representing the shear strength of the soil samples. Using this approach, the relationship between the shear strength of soil samples from three different locations in the Waste Dump#1 area under four vertical stresses (i.e., 100, 200, 300, and 400 kPa) can be determined, as demonstrated in Figure 6.
It can be seen from Figure 6 that the shear strength of different samples almost exhibits a linear increase with the growth of the vertical stress. According to the relationship curves, the cohesion and internal friction angle of the soil samples could be appropriately determined based on the statistical analysis of the fitted curves (i.e., by fitting appropriate linear lines of the form: τ = c + σ tan φ ; Mohr–Coulomb’s model). Based on this reasonably linear relationship between the shear strength and the vertical stress of the soil samples at the three locations where the samples were taken from Waste Dump#1, we can evaluate the cohesion (c’) and internal friction angle ( φ ) of various samples, as illustrated via bar diagrams in Figure 7 and Figure 8.
In Figure 7a–c, the experimentally obtained cohesion values of various samples, their corresponding average values, and standard deviations (SDs) of these average values have been presented, respectively. As is seen, the average values for the three sampling locations are almost close to each other; however, their percentages of SDs are different such that the highest uniformity of the average cohesion values is detected for PTC-1-2, while PTC-1-3 exhibits the lowest uniformity of these data. In addition, the experimentally predicted internal friction angle for different samples, the corresponding average values obtained for the three sampling locations, and their SD values are provided in Figure 8a–c. The plotted results reveal that the average value of the internal friction angle gradually reduces as one goes from PTC-1-1 to PTC-1-2 and then to PTC-1-3; however, the variation rate is almost mild such that the corresponding average values of the internal friction angle obtained from the three sampling points are nearly close to each other. Another important issue is that the SDs of the average internal friction angles for PTC-1-3 and PTC-1-2 exhibit the lowest and highest levels, respectively. This indicates that the highest uniformity of the obtained results is detectable for the samples associated with PTC-1-3 such that their percentage SD for the internal friction angle is lower than 0.8%.
As is seen in Figure 7 and Figure 8, we obtained different cohesions and internal friction angles from different samples taken from the three locations of Waste Dump#1. This indicates that we at least confront three constitutive relations for the three zones of the understudy slope, indicating an inhomogeneous and anisotropic medium, which makes the geomechanical modeling of the problem so difficult. To overcome this dilemma, we assume that the main slope medium is both homogeneous and isotropic. Subsequently, for following up the homogenization approach for evaluating the mechanical parameters of the granular materials of the understudied waste dump, the average values of the reported vertical stresses and shear stresses of various samples in Figure 6 are taken into account. To this end, these average values for four levels of the vertical stresses are extracted. By appropriately fitting a straight line to these average values of the shear strength and the vertical stress for various samples, we can arrive at the following relation:
τ = 0.4804 σ + 4.7982
where σ and τ stand for the effective vertical stress and the shear stress, respectively.
According to Mohr–Coulomb’s model ( τ = c + σ tan φ ), in view of Equation (15), the cohesion and the internal friction angle of the granular materials of Waste Dump#1 can be obtained as follows: c’ = 4.8 kPa and φ = 25.63°, respectively. Please note that the above-given relation is specifically used for the mechanical behavior of granular materials and at the lubricated cam/roller interfaces, the shear stress possesses a more complex formula [50]. To suitably capture the mechanical response, the authors introduced a sophisticated numerical approach to determine the creep in the end pivoted-roller finger-follower valve train. The approach involved kinematic and dynamic analysis, lubrication analysis, and computation of tangential forces. The obtained results revealed that the creep is low at low camshaft speeds but substantially rises at higher speeds.
The result of the above analysis illustrates the direct correlation between shear strength and vertical stress for the soil samples collected from various locations of the waste dump based on the averaging of the experimentally observed data. This model reduction procedure is very crucial for fairly rational predicting of the stability of slopes in mining operations because it implies predictable changes in soil resistance with depth or loading conditions. In the following parts, we use the above-mentioned linear relationship for fairly precise modeling and assessment of slope stability and possibly enhancing the safety protocols in engineering design, especially for high-stress environments such as open-pit mining.

3.3. GEO-SLOPE Calculation Results

According to GB50421-2018 “Standard for Waste Dump Design of Nonferrous Metal Mines” [51], waste dumps could be classified into three levels. According to these standards, the safety factor reserve for the understudied Waste Dump#1 should ideally be between 1.15 and 1.20. However, the slope stability coefficient for Waste Dump#1, as calculated using the GEO-SLOPE software, was found to be 1.047. This value is somewhat (8.7%) lower than the predetermined safety range recommended by the above standard, indicating a potential hazard in the current configuration of the waste dump.
This issue indicates that the understudied slope structure could be somewhat prone to failure and instability according to the GB50421-2018 standard. Such a fact is firstly attributed to the specific geometry of Waste Dump#1 (i.e., the slope height of the waste dump #1 is somewhat lower than 100 m, and there are problems such as large base dip angle and high step height). Another important issue is that the SF = 1.047 is almost obtained for the most critical sliding surface of the slope, which is provided for us through GEO-SLOPE software based on the Morgenstern–Price approach as well as try-and-error procedure of various sliding surfaces, until arriving at the nearly most critical one (i.e., the lowest level of SF). However, the suggested SF range by GB50421-2018 is generally provided for the global stability of the whole slope, not the local one obtained here as the critical sliding surface, somehow interpreting the present stability of the Waste Dump#1′s slope.
The above analysis guides us to suitably enhance the stability of the slope through its appropriate rectification. Before that, in the upcoming part, the capabilities of the PFC-based model in predicting the deformation of the present slope are carefully examined. Then, the appropriate rectifications are applied to the surface, and again stability and deformations will be analyzed.

3.4. Capabilities of the PFC Particle Flow in Capturing Both Mechanical Behavior and Response

After obtaining the micro-scale parameters for the slope model through direct shear test simulation, the Waste Dump#1 slope model was imported into PFC3D. It is divided into geological base and slope morphology. A set of soil parameters of the waste dump was selected for simulation. The relationships between the average shear stress and the average shear displacement in laboratory tests and the numerical simulation results for various samples have been illustrated in Figure 9. The simulation and the experimental data represent a similarity of 94.55%. This clearly indicates that the proposed PFC-based model is an effectual numerical model for rational capturing of the soil material’s mechanical strength in the presence of various vertical stress levels.
First, both the particle size and model were determined to establish a three-dimensional direct shear model. Then, the simulation results were fitted with the experimental results to calibrate the micro-scale parameters. The effective contact modulus, stiffness ratio, friction coefficient between particles, friction coefficient between particles and walls, and tensile and shear strengths in order were determined as 0.2 GPa, 1.5, 0.5, 0.35, and 10 MPa. The boundary model for the waste dump was imported, particles were generated inside the region, and excess particles were removed. The slope model was established and a linear contact model and linear contact bonding model were assigned for simulation calculations. Figure 10 illustrates the morphology of the waste dump slope and particle displacement distributions in the x and y directions.
In the x direction, the particles have displaced up to 50% of the entire model with a maximum displacement of 0.45 m. The particles displaced in the y direction comprise 70% of the model with a maximum displacement of 0.4 m. Intercepted sections were employed to analyze the movement of particles in Waste Dump#1. Figure 11 displays the particle displacement distribution in a profile for the slope region before rectification.
Figure 11 also provides a top view of the slope, selected location, and particle displacement distribution in the x and y directions of the profile. From the results, the maximum displacement distance of particles in the x direction reaches 0.43 m and the maximum displacement distance of particles in the y direction reaches 0.35 m. The area where sliding occurred is marked in red, which includes 40% of the particle distribution in the entire slope.

3.5. Slope Rectification

The dump profile is mainly characterized by a single-step waste dump with a step height of 78 m, a slope angle of 25°, a soil material cohesion of 4.8 kPa, and an internal friction angle of 25.63°. The current calculation shows that the slope stability does not meet the design specification requirements, and the shape of the slope should be appropriately rectified. Therefore, a rectification scheme for slope morphology is proposed. The cost of reducing the step height or compressing the width of the platform above the slope is very high. Therefore, the present investigation suggests the following plan for the waste dump:
  • The safety platform is constructed in a top-down manner through controlled material dumping. Initially, level the dumpling line +3948 m within 10 m and clear the slope of any loose stones, large blocks, and other debris to ensure the safety of the excavation work.
  • Construct the safety platform +3938 moving from north to south. The width of the safety platform +3938 is 10 to 12 m. After that, remove unstable loose soil and debris at +3938 m and +3948 m slopes.
  • Gradually lower the safety platform +3938 to create the safety platform +3928 m, while adhering to a 30° slope angle. This is accomplished with leveling, resulting in a final 10 m wide +3928 m safety platform.
  • Construct the safety platform +3918 from north to south. Clear any unstable loose soil and debris on the slope from +3918 m to +3928 m.
  • Level the safety platform +3918 by lowering it to the safety platform +3908 m along the slope angle of 30°, thereby establishing a safety platform with a width of 10 m +3908 m.
  • Repeat the same procedure to form the +3898 m platform, which is subsequently lowered to form the +3888 m safety platform.
  • During the formation of safety platforms +3908 m and +3888 m, a part of the space may require additional tailings to fill any gaps. The decision on this matter will be made according to the actual conditions during construction on site.
Figure 12a illustrates the profile of Waste Dump#1 before rectification, with a slope height of 78.0 m and a steep slope angle of 25.43°. The angle of the lower part of the base is 9.14°, and that of the upper part is 22.67°. Figure 12b demonstrates the profile pattern of Waste Dump#1 with a side slope height of 75.3 m and a slope angle of 25.14°. The height of the lower step of the slope is 15.3 m, and the height of the remaining three steps is 20 m. The slope angle of the step is 30°, and the width of the platform is 10 m.

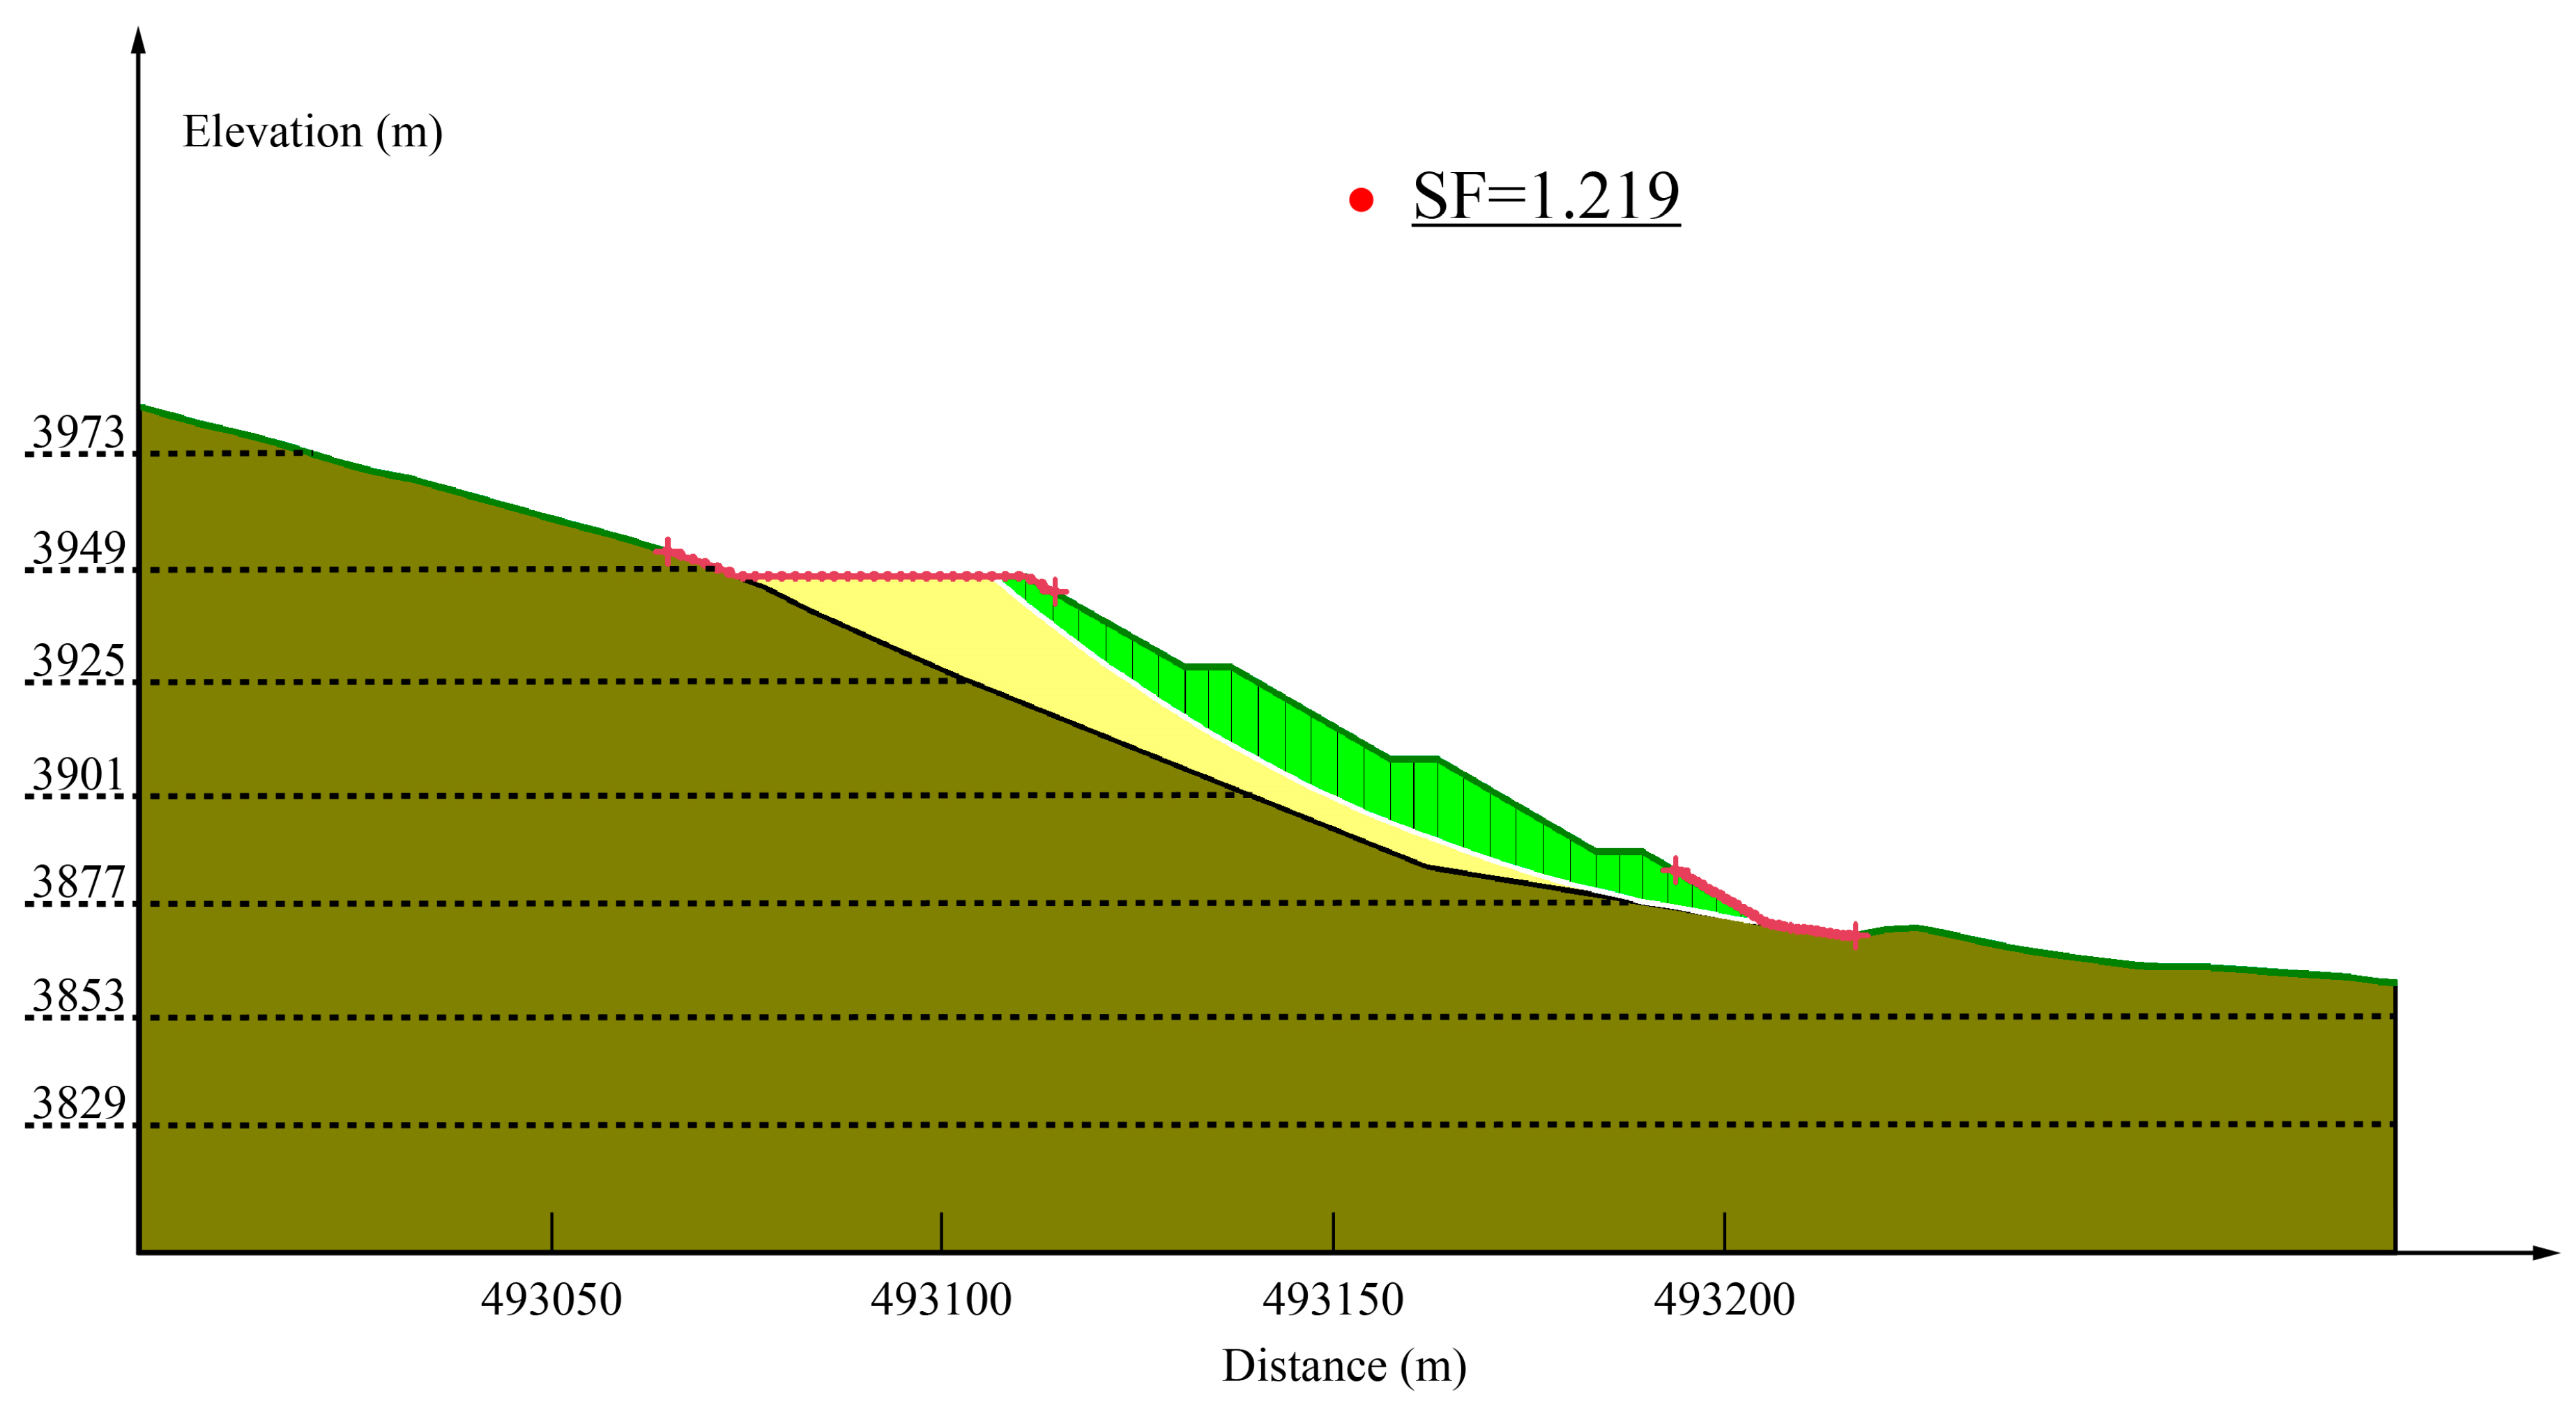
3.5.1. GEO-SLOPE Stability Calculation after Rectification

Following the rectification of Waste Dump#1, the slope stability calculated by GEO-SLOPE is presented in Figure 13. It indicates a slope safety stability factor of 1.219, which exceeds the standard requirements for safety reserve factors, which range from 1.15 to 1.20. This result is in line with the demands of safe production.

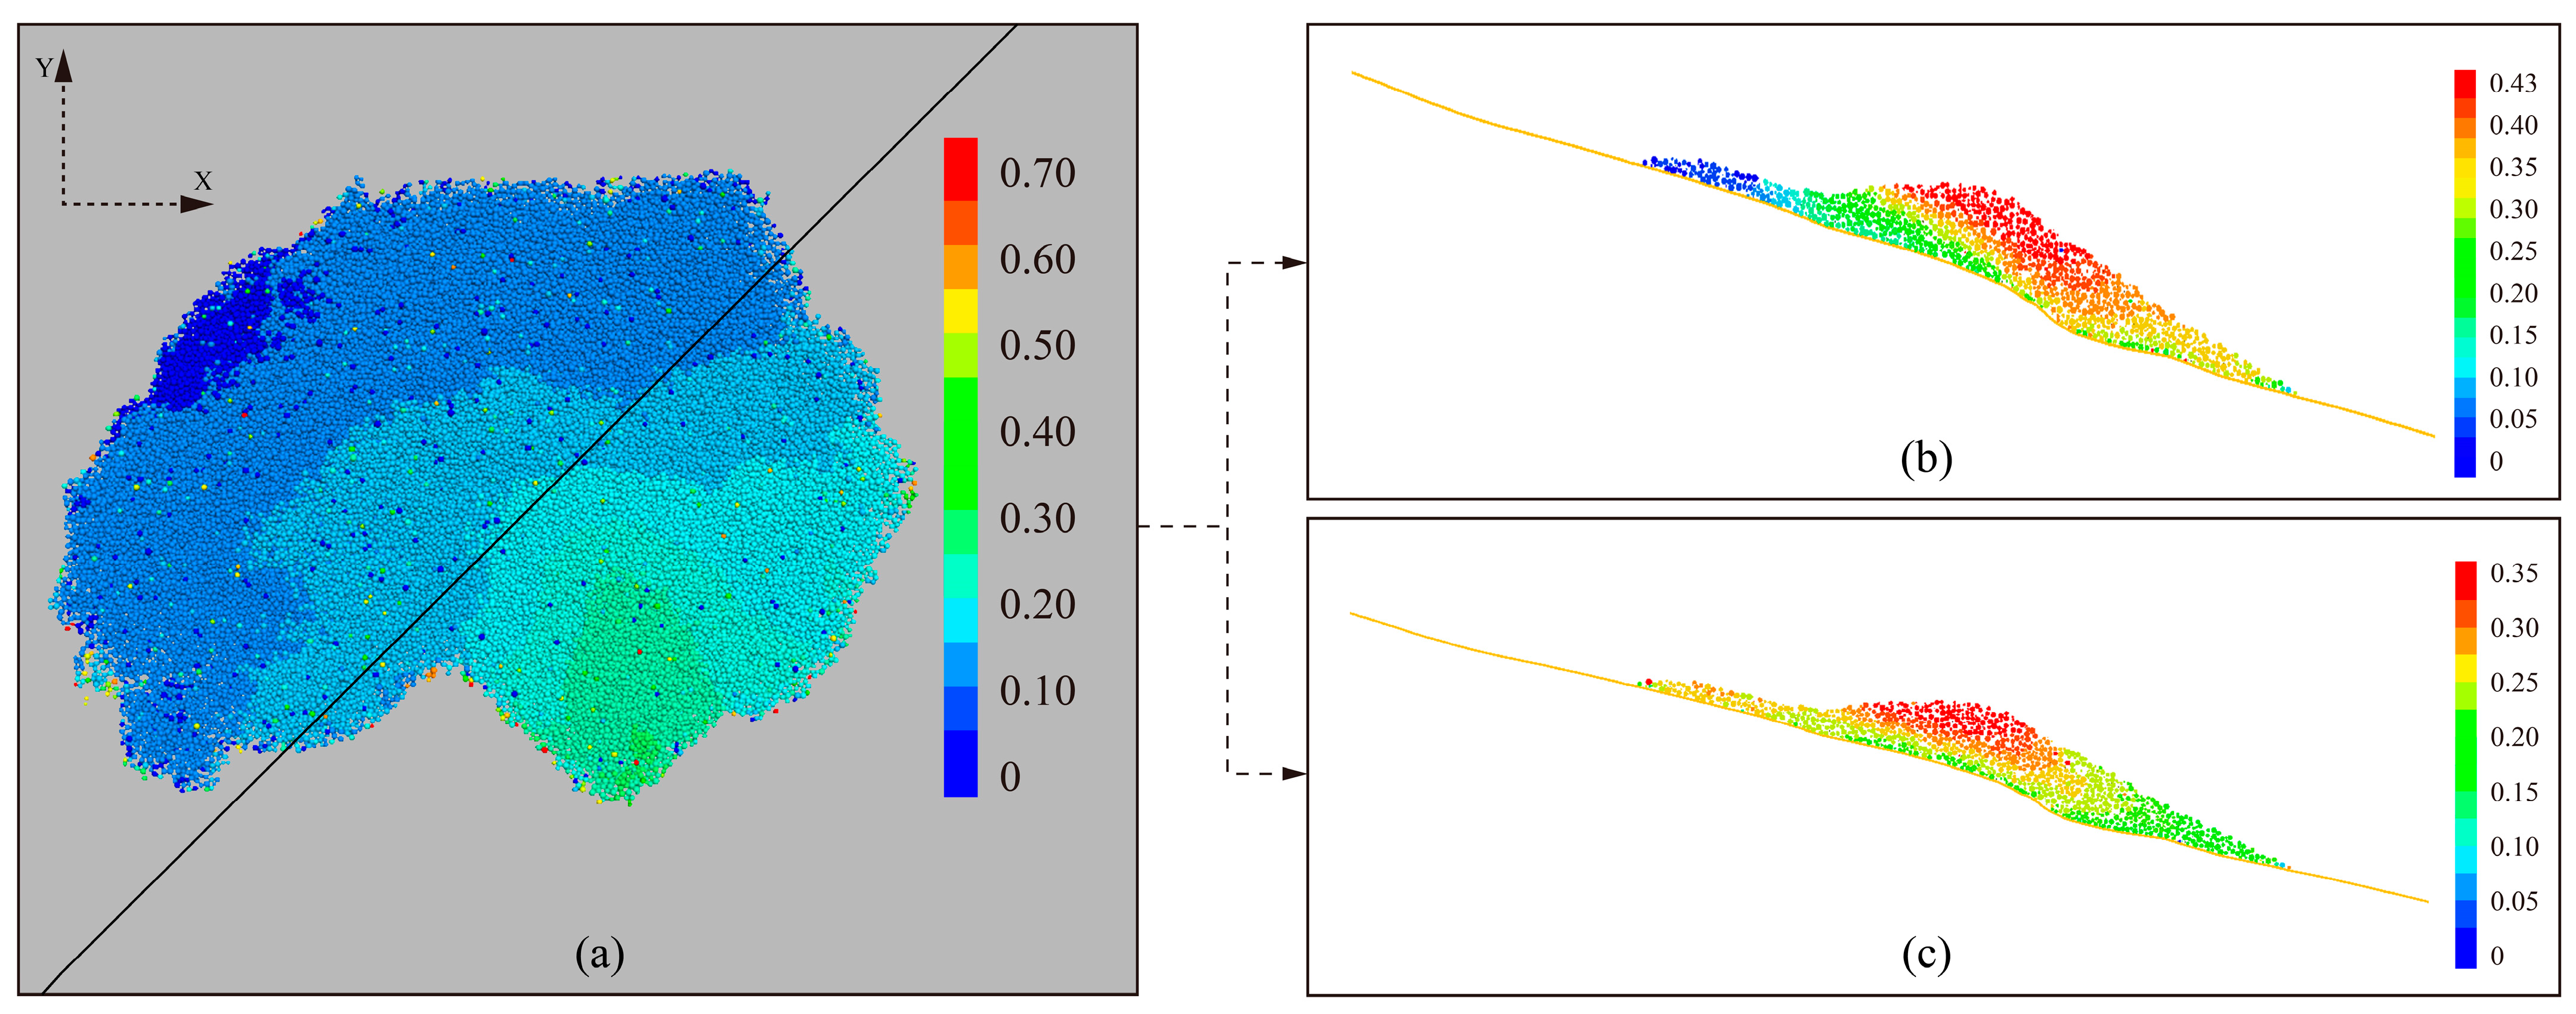
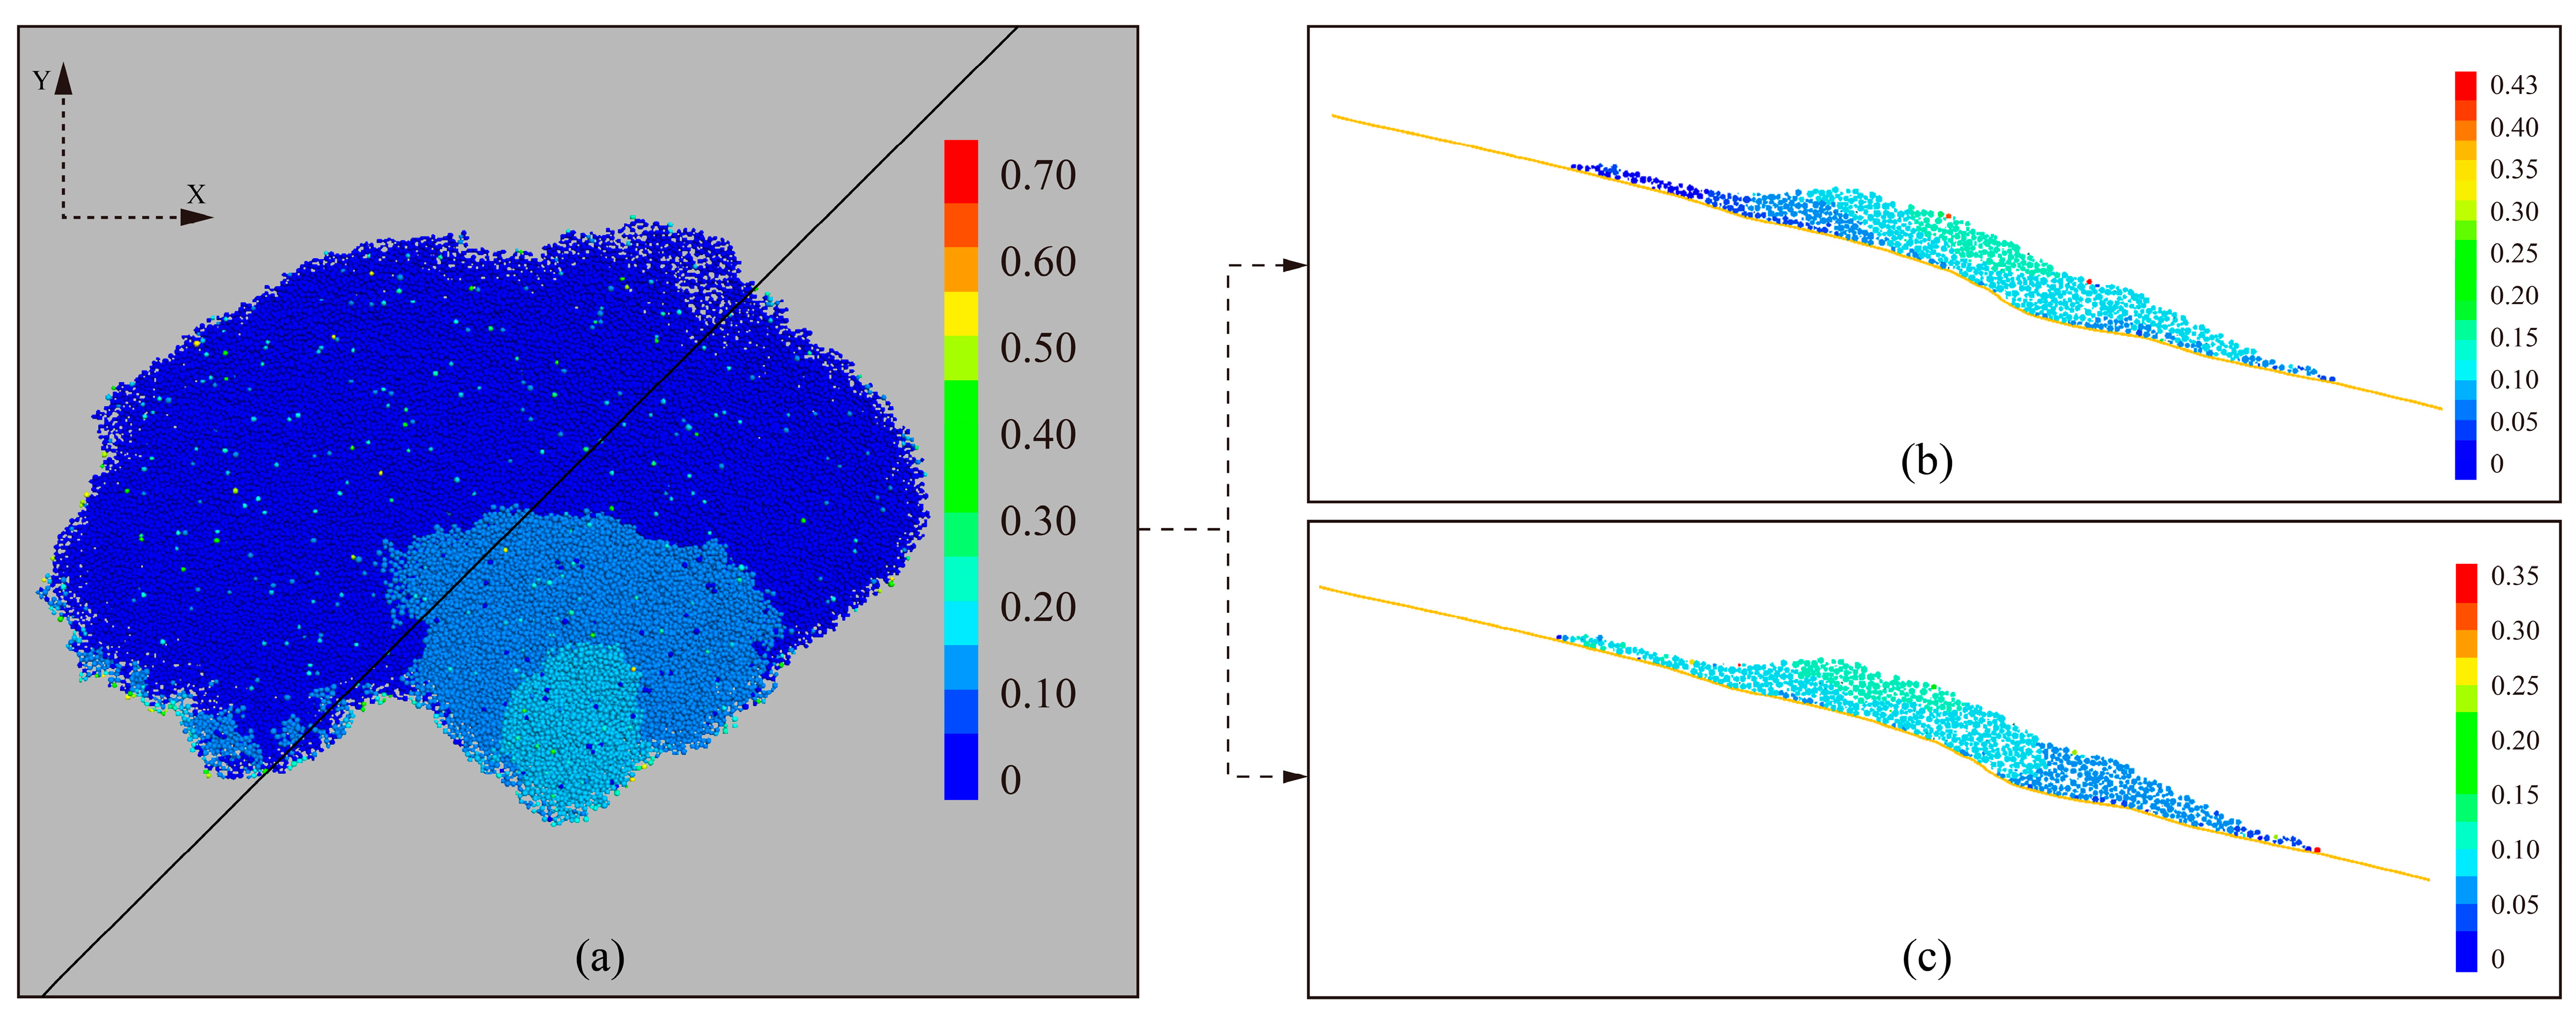
3.5.2. PFC Numerical Simulation of the Rectified Slope Displacement

Figure 14 illustrates the waste dump slope morphology and particle displacement distribution in the x and y directions after rectification. In the modified scenario, particle displacement occurs throughout the model. Approximately 30% of the particles exhibit displacement in the x direction with a maximum displacement of 0.25 m. In the y direction, the maximum displacement of 15% of the particles reaches 0.2 m. The intercepted profiles were used to analyze the movement of particles in Waste Dump#1.
Figure 15 shows the top view of the rectified waste dump slope showing the location of the selected cross-section and the particle displacement distribution in the x and y directions in the profile. The results show that after correction, the maximum particle displacement distance is 0.25 m in the x direction and 0.15 m in the y direction. The location of slope failure is indicated by a light blue area in the graph, which accounts for 15% of the total particle distribution.
By comparing the slope morphology and particle displacement before and after the rectification, the area where the slope slides after the rectification is substantially smaller than the area where the slope slides before the rectification, representing a 25% reduction. The distance of the particles’ displacements is noticeably reduced, and the reduction of the amount of sliding accounts for 41.8% of the total amount of sliding, and the rectification of the slopes has a substantial effect.

4. Conclusions

This research work presents a novel approach to analyzing the failure and deformation field of slopes, which has been validated in particular cases for Waste Dump#1, a specific highly steep slope at Ziluoyi Iron Mine. The present study draws conclusions from a combination of field data, laboratory direct shear tests, GEO-SLOPE stability calculations, and numerical simulations of PFC granular flow to evaluate the movement of the granular materials. The main obtained results can be summarized as follows:
  • The open-pit mine of Ziluoyi has a slope with a height of 78 m and an angle of 25°, with a base slope angle of 22°, and has a significant step. According to the GB50421-2018 “Standard for Waste Dump Design of Nonferrous Metal Mines”, this type of slope is classified as a Grade 3 waste dump. For such slopes, the safety factor ranges from 1.15 to 1.20, as per GB50421-2018;
  • The direct shear tests on soil samples taken from the dump site revealed the following key mechanical parameters: an average cohesion of 4.80 kPa and an average internal friction angle of 25.63°. However, the GEO-SLOPE calculations based on the Morgenstern–Price approach indicated that the actual slope stability factor of 1.047 does not meet the required stability criteria. To resolve this critical concern, appropriate rectification procedures including the construction of safety platforms, relocation, and removal of unstable soil were implemented. These modifications to the understudy slope improved the overall slope stability factor to 1.219 and were in line with safety standards;
  • The efficiency of the PFC-based model in rational capturing the mechanical strength behavior of soil in the presence of various vertical stresses was demonstrated by comparing it with the experimental results. The obtained results are indicative of the fact that such a mode is capable of fairly precise capturing of the experimentally observed shear stress-shear displacement with a relative error lower than 6% in most cases.
  • Subsequently, the PFC simulations were utilized to model the slope morphology and particle displacement before and after rectification. The obtained results reveal that through the application of the post-rectification, the area of sliding and the proportion of sliding particles were substantially reduced by 25%, with a 41.8% reduction in sliding volume. These results demonstrate the effectiveness of the slope remediation measures.
The results of this study highlight the importance of combining GEO-SLOPE numerical calculations with numerical simulation of PFC particle flow to accurately assess slope stability and the amount of slope failure. This approach offers a more precise way to prevent and manage slope stability in open-pit mines, which is essential for ensuring safe and efficient mining operations.
The stability of slopes is a critical concern for geotechnical engineers due to the potential for disasters associated with slope failure. With a wide range of geomechanical factors at play, it is essential to use effective machine-learning-based algorithms and intelligence algorithms [52,53,54,55,56,57,58,59,60] for rational predicting of the safety factor of a diverse range of slopes (with and without rectification) under various conditions (normal, rainfall, and seismic loadings). These algorithms will provide a suitable bed to appropriately optimize the slope design, leading to more economic and safe slope structures. The application of these efficient algorithms to the engineering problem studied here can be considered as a hot topic for future research works.

Author Contributions

Conceptualization, X.D. and Z.A.; methodology, W.Q., Z.Y., I.M.J. and Z.Z.; validation, X.D., Z.A., X.L. and Y.T.; formal analysis, Z.A.; investigation, B.X.; resources, A.W.; data curation, Z.Y.; writing—original draft preparation, X.D., Z.A. and Z.Y.; writing—review and editing, Y.T. and Z.Z.; visualization, Z.A. and Z.Y. All authors have read and agreed to the published version of the manuscript.

Funding

This paper was supported by the National Natural Science Foundation of China (52174131).

Institutional Review Board Statement

Not applicable.

Informed Consent Statement

Not applicable.

Data Availability Statement

The original contributions presented in the study are included in the article, further inquiries can be directed to the corresponding author.

Acknowledgments

The author would like to thank Ziluoyi Iron Open-pit Mine for providing an important test base for this paper.

Conflicts of Interest

Author Weimin Qian was employed by the company Huzhou New Kaiyuan Gravel Co., Ltd. The remaining authors declare that the research was conducted in the absence of any commercial or financial relationships that could be construed as a potential conflict of interest.

References

  1. Sazid, M.; Singh, T.N.; Saharan, M.R. Risk analysis of mine dump slope stability—A case study. Min. Eng. J. 2012, 12, 11–15. [Google Scholar]
  2. Xu, X.-Z.; Guo, W.-Z.; Liu, Y.-K.; Ma, J.-Z.; Wang, W.-L.; Zhang, H.-W.; Gao, H. Landslides on the Loess Plateau of China: A latest statistics together with a close look. Nat. Hazards 2017, 86, 1393–1403. [Google Scholar] [CrossRef]
  3. Juang, C.H.; Dijkstra, T.; Wasowski, J.; Meng, X. Loess geohazards research in China: Advances and challenges for mega engineering projects. Eng. Geol. 2019, 251, 1–10. [Google Scholar] [CrossRef]
  4. Spooner, I.; Batterson, M.; Catto, N.; Liverman, D.; Broster, B.; Kearns, K.; Isenor, F.; MacAskill, W. Slope failure hazard in the Atlantic provinces: A review. Atl. Geol. 2013, 49, 1–14. [Google Scholar] [CrossRef]
  5. Itoh, K.; Timpong, S.; Toyosawa, Y. Case history of labor accident due to slope failure during slope excavation and its countermeasure work. In Proceedings of the International Conference on Case Histories in Geotechnical Engineering, Chicago, IL, USA, 11–16 August 2008; Volume 15. Available online: https://scholarsmine.mst.edu/icchge/6icchge/session02/15 (accessed on 10 March 2024).
  6. Evans, S.G. Fatal landslides and landslide risk in Canada 1. In Landslide Risk Assessment; Routledge: London, UK, 2018; pp. 185–196. [Google Scholar]
  7. Guzzetti, F. Landslide fatalities and the evaluation of landslide risk in Italy. Eng. Geol. 2000, 58, 89–107. [Google Scholar] [CrossRef]
  8. Sarkar, K.; Sazid, M.; Khandelwal, M.; Singh, T.N. Stability analysis of soil slope in Luhri area, Himachal Pradesh. Min. Eng. J. 2009, 10, 21–27. [Google Scholar]
  9. Sazid, M. Finite element analysis of road cut slopes using Hoek & Brown failure criterion. Int. J. Earth Sci. Eng. 2012, 5, 1100–1109. [Google Scholar]
  10. Gupte, S.S. Optimisation of internal dump capacity and stability analysis in a coal mine—A case study. In Proceedings of the First Asia Pacific Slope Stability in Mining Conference, Brisbane, Australia, 6–8 September 2016; Australian Centre for Geomechanics: Crawley, Australia, 2016; pp. 557–570. [Google Scholar]
  11. Singh, P.K.; Kainthola, A.; Singh, T.N. A distinct element modeling approach towards rockfall analysis. J. Eng. Geol. 2015, 40, 119129. [Google Scholar]
  12. Yang, T.H.; Zhang, F.C.; Yu, Q.L.; Cai, M.F.; Li, H.Z. Research situation of open-pit mining high and steep slope stability and its developing trend. Rock Soil Mech. 2011, 32, 1437–1451. [Google Scholar]
  13. Liu, J.; Cheng, Z.H.; Ji, D.X.; Zhang, X.D.; Ma, P.C.; Li, M.Y. Damage mechanism research on high slope stability of open-pit mine based on strength reduction method. Met. Mine 2018, 9, 74–78. [Google Scholar]
  14. Huang, X.; Zhang, X.H.; Xue, L.; Niu, J.R.; Wang, Y.Y. Stability evaluation on the high slope at dumping site of Jinduicheng Open Pit mine. Chin. J. Geol. Hazard Control 2010, 21, 40–43. [Google Scholar]
  15. Du, X.; Chai, J. Stability evaluation of medium soft soil pile slope based on limit equilibrium method and finite element method. Mathematics 2022, 10, 3709. [Google Scholar] [CrossRef]
  16. Ji, Z.Y.; Zhang, H.S.; Wang, G.H. Review of characteristics of open-pit mines slope and landslide key control technology. Site Investig. Sci. Technol. 2011, 6, 24–28. [Google Scholar]
  17. Shen, L.; Wang, J.G.; Ji, Y.S.; Li, G.Z.; Zhang, T.W. Safety analysis and application of rock deformation for high slope. Coal Sci. Technol. 2005, 33, 64–67. [Google Scholar]
  18. Zi, J.P.; Zhu, L.Q.; Zhang, D.W.; Wang, H.F. Stability analysis of open-pit mining slope in Heishan Iron Mine. Express Inf. Min. Ind. 2008, 8, 74–76. [Google Scholar]
  19. Ao, Z.; Wang, Z.; Zhou, W.; Qiao, Y.; Wahab, A.; Yang, Z.; Nie, S.; Liu, Z.; Zhu, L. CFD simulation based ventilation and dust reduction strategy for large scale enclosed spaces in open pit coal mines—A case of coal shed. Sustainability 2023, 15, 11651. [Google Scholar] [CrossRef]
  20. Li, S.; Liu, J.; Jiang, Z. Study on the basic characteristics and mechanical model of toppling and sliding deformable. Hydrogeol. Eng. Geol. 2000, 2, 20–22. [Google Scholar]
  21. Chen, F. Application of direct shear test in stability analysis of tailings ponds. New Technol. New Prod. China 2019, 12, 80–81. [Google Scholar]
  22. Ding, X.; Ao, Z.; Li, X.; Xiao, S.; Wu, M.; Xing, B.; Ge, R.; Zhang, D. The mechanism of plugging open-pit mine cannon holes and the modification of plugging materials. Sustainability 2023, 15, 4257. [Google Scholar] [CrossRef]
  23. Cai, Y.J.; Pei, S.H.; Ding, R.F. The influence of direct fast shear test conditions on shear strength. West—China Explor. Eng. 2003, 12, 40–42. [Google Scholar]
  24. Dahri, M.W.; Zhou, M.; Liu, Z. Prediction of shear strength for granular material under the effect of liquid-powder binder using a PSO-RBF neural network model. Particul. Sci. Technol. 2023, 41, 896–903. [Google Scholar] [CrossRef]
  25. Shen, Z.; Ao, Z.; Wang, Z.; Yang, Y. Study on crust-shaped dust suppressant in non-disturbance area of open-pit coal mine—A case study. Int. J. Environ. Res. Public Health 2023, 20, 934. [Google Scholar] [CrossRef]
  26. Tian, R.X.; Jiao, H.G. Application status and analysis of discrete element software PFC in mining engineering. Min. Metall. 2011, 20, 79–82. [Google Scholar]
  27. He, X.W.; Liu, Z.; Liao, B.; Wang, C.C. Stability analysis of jointed rock slopes based on discrete element method. Rock Soil Mech. 2011, 32, 2199–2204. [Google Scholar]
  28. Gao, Z.; Wang, S.; Yin, H.; Zhao, Q.; Vladimr, P.; Li, Y. Estimation of Shear strength parameters considering joint roughness: A stability case analysis of bedding rock slopes in an open-pit mine. Appl. Sci. 2023, 13, 5730. [Google Scholar] [CrossRef]
  29. Peng, B.; Chen, Y.M.; Yuan, L.W. Stability analysis of slope stability of No. 2 open pit in Maanshan Iron Mine based on PFC2D. Min. Eng. 2014, 35, 37–40. [Google Scholar]
  30. Tian, Y.; Jiskani, I.M.; Lu, X.; Zhou, W.; Liu, F.; Zhang, C.; Cai, Q. Control mechanism of end-slope deformation in open pit mine based on discrete-continuous coupling method. Comput. Part. Mech. 2023, 10, 951–963. [Google Scholar] [CrossRef]
  31. Tian, Y.; Zhou, W.; Jiskani, I.M.; Cai, Q.; Li, Z.; Lu, X. Stability analysis of varying height waste dump in open-pit mine under particle size gradation and reconstruction effect of waste materials. Int. J. Min. Reclam. Environ. 2022, 36, 587–604. [Google Scholar] [CrossRef]
  32. Zhang, T.; Yu, L.; Peng, Y.; Jing, H.; Su, H.; Wei, J. Effect of the mineral spatial distribution heterogeneity on the tensile strength of granite: Insights from PFC3D-GBM numerical analysis. J. Rock Mech. Geotech. Eng. 2023, 15, 1144–1160. [Google Scholar] [CrossRef]
  33. Cong, Y.; Liu, H.; Wang, X.; Guo, D.; Han, L.; Zhao, Y.; Zou, L. The influence of cross-section shape on failure of rock surrounding the main tunnel in a water-sealed cavern. Sustainability 2023, 15, 424. [Google Scholar] [CrossRef]
  34. Jiang, S.; Li, J.; Zhang, S.; Gu, Q.; Lu, C.; Liu, H. Landslide risk prediction by using GBRT algorithm: Application of artificial intelligence in disaster prevention of energy mining. Process Saf. Environ. Prot. 2022, 166, 384–392. [Google Scholar] [CrossRef]
  35. Zhang, W.F.; Ren, F.H.; Guo, Q.F.; Pan, J.L.; Liu, W.S. Analysis on slope stability of inner dump in Heshangqiao iron mine under rainfall. Met. Mine 2022, 5, 205–211. [Google Scholar]
  36. Ma, L.J.; Sheng, J.L. Stability analysis and reliability study of dump slope under rainfall infiltration. Ind. Miner. Process. 2019, 48, 67–71. [Google Scholar]
  37. Lin, B.X. Stability analysis of dump slope: Taking Zijinshan open-pit mine as an example. Mob. Inf. Syst. 2022, 2022, 9009528. [Google Scholar] [CrossRef]
  38. Lan, Y. Stability analysis and treatment of high and steep slope in open-pit dump based on numerical simulation. Min. Res. Dev. 2023, 43, 77–82. [Google Scholar]
  39. Zhang, L.; Chen, Z.; Nian, G.; Bao, M.; Zhou, Z. Base friction testing methodology for the deformation of rock masses caused by mining in an open-pit slope. Measurement 2023, 206, 112235. [Google Scholar] [CrossRef]
  40. Wang, M.; Li, X.; Yang, S.; Teng, L.; Chen, Q.; Jiang, S. Research on deformation and fracture characteristics of the fractured rock mass under coupling of heavy rainfall infiltration and mining unloading. Front. Earth Sci. 2022, 9, 792038. [Google Scholar] [CrossRef]
  41. Wang, J.; Chen, C. Stability analysis of slope at a disused waste dump by two-wedge model. Int. J. Min. Reclam. Environ. 2017, 31, 575–588. [Google Scholar] [CrossRef]
  42. Ansari, T.A.; Singh, H.K.; Sazid, M.; Singh, H.O.; Singh, T.N.; Singh, K.H.; Zhou, H. Evaluation of various modes of fracture toughness (Mode I, II, and I + II) in Indian limestone based on ae parameters. In CAJG 2020: Selected Studies in Geotechnics, Geo-informatics and Remote Sensing, Proceedings of the 3rd Conference of the Arabian Journal of Geosciences, Sousse, Tunisia, 2–5 November 2020; Springer Nature: Cham, Switzerland, 2020; pp. 169–173. [Google Scholar] [CrossRef]
  43. Chen, Y.; Tang, Y.; Cao, R.; Sun, S.; Zha, W.; Lin, H. Failure mode of parallel-fractured rock-like sample with different inclinations. Theor. Appl. Fract. Mech. 2023, 127, 104053. [Google Scholar] [CrossRef]
  44. ASTM D422–63e2 2007; Standard Test Method for Particle-Size Analysis of Soils. ASTM International: West Conshohocken, PA, USA, 2007.
  45. ASTM D2217–85 1998; Standard Practice for Wet Preparation of Soil Samples for Particle-Size Analysis and Determination of Soil Constants (Withdrawn 2007). ASTM International: West Conshohocken, PA, USA, 1998.
  46. ASTM D4318–10e1 2010; Standard Test Methods for Liquid Limit, Plastic Limit, and Plasticity Index of Soils. ASTM International: West Conshohocken, PA, USA, 2010.
  47. ASTM D3080-11 2011; Standard for Test Method for Direct Shear Test of Soils under Consolidated Drained Conditions. ASTM International: West Conshohocken, PA, USA, 2011.
  48. Fellenius, W. Calculation of the stability of earth dams. In Transactions 2nd Congress on Large Dams; U.S. Government Printing Office: Washington, DC, USA, 1936; Volume 4, pp. 445–462. [Google Scholar]
  49. Taylor, D.W. Stability of earth slopes. J. Boston Soc. Civ. Eng. 1937, 24, 197–246. [Google Scholar]
  50. Khurram, M.; Mufti, R.A.; Bhutta, M.U.; Habib, Y.; Ahmed, A.; Afzal, N. A numerical approach to calculate creep in roller follower valve train basing on friction and lubrication modeling. Trans. Can. Soc. Mech. Eng. 2015, 39, 805–818. [Google Scholar] [CrossRef]
  51. GB50421-2018; Standard for Waste Dump Design of Nonferrous Metal Mines. China National Standard: Beijing, China, 2018.
  52. Nanehkaran, Y.A.; Licai, Z.; Chengyong, J.; Chen, J.; Anwar, S.; Azarafza, M.; Derakhshani, R. Comparative analysis for slope stability by using machine learning methods. Appl. Sci. 2023, 13, 1555. [Google Scholar] [CrossRef]
  53. Du, H.; Du, S.; Li, W. Probabilistic time series forecasting with deep non-linear state space models. CAAI Trans. Intell. Technol. 2023, 8, 3–13. [Google Scholar] [CrossRef]
  54. Cao, H.; Wu, Y.; Bao, Y.; Feng, X.; Wan, S.; Qian, C. UTrans-Net: A model for short-term precipitation prediction. Artif. Intell. Appl. 2023, 1, 106–113. [Google Scholar] [CrossRef]
  55. Zhang, Y.; Hu, Y.; Gao, X.; Gong, D.; Guo, Y.; Gao, K.; Zhang, W. An embedded vertical-federated feature selection algorithm based on particle swarm optimisation. CAAI Trans. Intell. Technol. 2023, 8, 734–754. [Google Scholar] [CrossRef]
  56. Katkade, S.N.; Bagal, V.C.; Manza, R.R.; Yannawar, P.L. Advances in real-time object detection and information retrieval: A Review. Artif. Intell. Appl. 2023, 1, 139–144. [Google Scholar] [CrossRef]
  57. Ahangari Nanehkaran, Y.; Pusatli, T.; Chengyong, J.; Chen, J.; Cemiloglu, A.; Azarafza, M.; Derakhshani, R. Application of machine learning techniques for the estimation of the safety factor in slope stability analysis. Water 2022, 14, 3743. [Google Scholar] [CrossRef]
  58. Remmelzwaal, L. An AI-based early fire detection system utilizing HD cameras and real-time image analysis. Artif. Intell. Appl. 2023. [Google Scholar] [CrossRef]
  59. Wang, W.; Sun, Y.; Li, K.; Wang, J.; He, C.; Sun, D. Fully Bayesian analysis of the relevance vector machine classification for imbalanced data problem. CAAI Trans. Intell. Technol. 2023, 8, 192–205. [Google Scholar] [CrossRef]
  60. Moayedi, H.; Tien Bui, D.; Kalantar, B.; Kok Foong, L. Machine-learning-based classification approaches toward recognizing slope stability failure. Appl. Sci. 2019, 9, 4638. [Google Scholar] [CrossRef]
Figure 1. (a) Mining location in the mainland map, (b) three-dimensional topographical map of the Ziluoyi Open-pit Iron Mine and its main dumps, and (c) side view of the main slope pertinent to Waste Dump#1.
Applsci 14 03430 g001
Figure 2. Sample preparation process from three points as well as some basic geotechnical tests (note: PTC-1-1, PTC-1-2, and PTC-1-3 in order to denote the samples collected at the dry selection plant exit, top of the slope, and waste dump’s safety platform).
Applsci 14 03430 g002
Figure 3. Schematic representation of a portion of the slope profile, and an infinitesimal slice element of length Δ x with the exerted forces used in the Morgenstern–Price approach.
Applsci 14 03430 g003
Figure 4. Discrete element modeling of the granular materials: (a) surrounding walls of the soil sample in the test, (b) PFC3D-based modeling of the soil sample in the direct shear test.
Applsci 14 03430 g004
Figure 5. Shear stress–shear displacement curves for various soil samples under four levels of vertical loadings.
Applsci 14 03430 g005
Figure 6. Shear strength in terms of the vertical stress for various soil samples.
Applsci 14 03430 g006
Figure 7. Experimentally obtained cohesion values of various soil samples: (a) cohesion, (b) corresponding average values for the three sampling locations, and (c) SDs of the average cohesion values.
Applsci 14 03430 g007
Figure 8. Experimentally obtained internal friction angle values of various soil samples: (a) internal friction angle, (b) corresponding average values for the three sampling locations, and (c) SD values of the average internal friction angles.
Applsci 14 03430 g008
Figure 9. Average shear stress in terms of the average shear displacement for various soil samples in tests and simulations.
Applsci 14 03430 g009
Figure 10. Waste dump model and particle displacements (m) in the x and y directions: (a) Slope model before rectification, (b) slope displacement in the x direction, and (c) slope displacement in the y direction.
Applsci 14 03430 g010
Figure 11. Particle displacement distribution before rectification: (a) top view of the two-dimensional displacement, (b) side view of the slope displacement in the x direction, and (c) side view of the slope displacement in the y direction.
Applsci 14 03430 g011
Figure 12. Profiles of Waste Dump#1 slope before and after rectification: (a) before rectification, (b) after rectification (note: the domains with dark-green and yellow colors in order represent the quartz schist and discharged material).
Applsci 14 03430 g012
Figure 13. Stability analysis after rectification of the slope (note: the domains with dark-green, yellow, and light-green colors in order represent the quartz schist, discharged material, and slope prone to failure).
Applsci 14 03430 g013
Figure 14. Particle displacement distributions in the x and y directions after rectification: (a) slope model after rectification, (b) slope displacement in the x direction, and (c) slope displacement in the y direction.
Applsci 14 03430 g014
Figure 15. Particle displacement distribution in the modified section: (a) top view of the two-dimensional displacement, (b) side view of the slope displacement in the x direction, and (c) side view of the slope displacement in the y direction.
Applsci 14 03430 g015
Table 1. Experimental instruments and pieces of equipment.
InstrumentModel and Main
Parameter
Manufacturer
JYS200 Soil SieveJYS200Hebei Zhongyi Weichuang Testing Instrument Co., Ltd., Cangzhou, China
Electronic BalanceYT2204Shenzhen Xinlangpu Electronic Technology Co., Ltd., Shenzhen, China
ZJ Strain-controlled Direct Shear ApparatusZJNanjing Soil Instrument Factory Co., Ltd., Nanjing, China
Disclaimer/Publisher’s Note: The statements, opinions and data contained in all publications are solely those of the individual author(s) and contributor(s) and not of MDPI and/or the editor(s). MDPI and/or the editor(s) disclaim responsibility for any injury to people or property resulting from any ideas, methods, instructions or products referred to in the content.

