
Research on the Vehicle-Behavior Boundary of Intersection Traffic Based on Naturalistic Driving Data Study

1
School of Automotive Studies, Tongji University, Shanghai 201804, China
2
Shanghai Jinqiao Intelligent Connected Automobile Development Limited Company, Shanghai 201206, China
*
Author to whom correspondence should be addressed.
Appl. Sci. 2024, 14(8), 3432; https://doi.org/10.3390/app14083432
Submission received: 5 March 2024
/
Revised: 9 April 2024
/
Accepted: 12 April 2024
/
Published: 18 April 2024
Abstract
:With the development and application of vehicle-infrastructure cooperative technology, the traffic regional safety related to intelligent connected vehicles (ICVs) has become the hotspot of the intelligent transportation system (ITS), and the integration of mixed autonomous and non-autonomous vehicles that are not cooperative in intersection areas has become a significant challenge due to the rapid advancement of autonomous vehicle technology. Autonomous vehicles in intersections with strong-structure and weak-rule characteristics pose a potential hazard in complex traffic situations. Studying the driving behavior of vehicles in intersections is of great significance due to the complex traffic environment, frequent traffic signals, and traffic violations, which can optimize the vehicle driving behavior and improve the safety and efficiency of intersection traffic. By using naturalistic driving data from the DAIR V2X-Seq dataset and general vehicle dynamic parameters, it is possible to obtain the joint-probability-density distribution of the bivariate dynamic parameters of a vehicle. This distribution represents the driving characteristics of vehicles in intersection traffic. The three vehicle dynamic parameters that have an impact on vehicles driving through the intersection area are velocity, angular velocity, and acceleration. The driving behavior characteristics of human-driven vehicles (HVs) and autonomous vehicles (AVs) were analyzed using the multivariate kernel density estimation (MKDE) method to establish the vehicle-behavior boundary. The assessment of the boundary model showed that it accurately characterizes the driving characteristics of HVs and AVs. This boundary can be used to improve the safety detection of intersection areas, enhancing the performance of autonomous vehicles and optimizing intersection traffic.
1. Introduction
Autonomous vehicle technology has become a highly involved focus in intelligent transportation systems [1]. With the rapid development of intelligent and connected technology, people have high expectations for the high-level autonomous vehicle, which can be used to build a more intelligent, efficient and safe road-traffic system [2,3]. However, scaling the distribution of automated vehicles requires handling various unexpected and possibly dangerous scenarios, such as ramp merge in and out, autonomous parking and intersection crossing. The road facilities, traffic environment, and weather conditions in the above scenarios are complex and changeable, such as roundabouts, unexpected pedestrians, and running the red light, which puts high demands on the perception, decision-making, and planning capabilities of the automatic driving system [4,5].
Currently, research, development, and verification of autonomous vehicles primarily focus on highway sections and straight urban roads [6]. However, intersections are widely recognized as the most hazardous sections of road due to their complex traffic environment, frequent traffic signals, and prevalence of traffic violations [7]. Therefore, it is necessary to explore vehicle safety in intersection traffic more extensively. Statistics from the United States indicate that over 30% of reported crashes and 50% of fatal and injury-causing crashes occur at intersections [8].
Implementing autonomous driving functions in intersection areas presents greater challenges compared to highway and urban straight-road sections [9]. In straight road sections, the autonomous driving system can achieve comprehensive scenario recognition and the development and testing of corresponding safety functions based on its intelligent perception system and the path-planning algorithm with lane-lines assistance [10]. Furthermore, on straight road sections, road traffic participants typically travel in the same or opposite directions, and the level of traffic flow complexity is relatively low.
Due to the shared driving feature of the intersection area, vehicle intersection traffic faces four major challenges: firstly, it is impossible to set physical lane lines for the traffic participant trajectory [11]; secondly, the autonomous vehicle will highly rely on single-vehicle sensing capabilities in the intersection, which is limited by the field of view (FOV) of its own perception system, especially when obstacles are present, and therefore, the collected environmental information has limitations, making it difficult to ensure high reliability and traffic safety for intersection traffic [12]; thirdly, the probability of unpredictable traffic behavior and violation of traffic regulations in the intersection area is high, especially for pedestrians and non-motorized vehicles [13]; fourthly, the number of incoming road lanes is inconsistent with that of outgoing road lanes in an intersection section, and the multitude of trajectory choices poses a crucial consideration for the automated vehicle, presenting further challenges in decision planning capabilities [14]. The above problems make it more dangerous for traffic participants to perform hazardous and unpredictable maneuvers at intersections, especially in traffic congestion.
In this paper, a proposed method was evaluated using the naturalistic driving dataset DAIR V2X, which is the first large-scale, real-world, and sequential V2X dataset. Furthermore, the effects of various factors on vehicle dynamic-behavior parameters were used to represent driving behavior characteristics and establish vehicle driving-behavior boundaries for intersection traffic optimization. The test and evaluation of the vehicle driving-behavior boundary have been carried out using real-life naturalistic driving data.
The paper is organized as follows: firstly, a brief review of typical intersection-traffic research methods is introduced in Section 2. Then, Section 3 explains the naturalistic driving dataset and presents the research method of the vehicle driving behavior. Section 4 provides vehicle driving-behavior characters and compares the vehicle-behavior boundary of the human vehicle and the autonomous vehicle. Finally, Section 5 presents the main conclusions of this paper.
2. Related Work
In the field of traffic transportation management, researchers have explored various traffic management methods to reduce potential accidents at intersections, including the introduction of vehicle speed guidance, variable and reversible lanes, and the optimization of traffic signal configurations [15,16,17,18].
To address issues with autonomous vehicles, many countries have conducted studies on driving behavior using a naturalistic driving study (NDS). NDS is the current standard in traffic- and vehicle-safety research, which provides insight into driver behavior during everyday trips by recording details of the driver, vehicle, and surroundings through unobtrusive data gathering equipment without experimental control [19]. In an NDS, vehicles are equipped with small cameras and sensors. For a period ranging from several months to several years, these devices continuously and inconspicuously record vehicle maneuvers such as speed, acceleration/deceleration, and direction, as well as driver behavior such as eye, head, and hand movements, and external conditions such as road, traffic, and weather characteristics during normal driving [20]. The NDS approach enables the observation and analysis of interrelationships between the driver, vehicle, road, and other traffic in normal, conflict, and crash situations. This information is valuable not only for reducing road transport casualties but also for lessening the environmental impact of road transport and alleviating congestion [21]. NDS has several advantages for studying normal traffic behavior in everyday situations. Participants are not involved in an experiment, and there is no experimenter present, nor are there any experimental interventions or aims that participants can guess and act accordingly. Additionally, NDS offers the possibility to observe conflicts, near crashes, or even actual crashes in real-time without the potential biases of post hoc reports [22]. The National Highway Traffic Safety Administration (NHTSA) identified 37 pre-crash scenarios based on accident location and driver behavior characteristics [23]. The report discusses the classification of scenes, including six major categories and thirteen subdivision categories of dangerous scenes, as obtained from sources [24]. The report also mentions the Waymo large-scale real-vehicle road test program launched by Google, which aims to promote the mass production of high-level autonomous driving. Using naturalistic driving data, we obtained relevant scenarios to verify the system response, behavioral features, collision safety, and functional safety. These scenarios were used to create a verification benchmark for autonomous vehicles [25,26].
Domestic and international scholars have investigated hazardous scenarios at intersections by utilizing methods such as traffic accident databases and clustering algorithms. The focus has been on the elemental characteristics of vehicle behaviors [27,28]. For example, the study utilized almost 500 motor vehicle accident data from the NAIS accident database between 2011 and 2017 to identify key elements of intersection test scenarios, including intersection types, signal light variations, and driving environment factors [29,30]. The study employed a hierarchical clustering algorithm to examine eight distinct types of hazardous scenarios to guide the verification of autonomous emergency braking (AEB) intersection functions. Similarly, the study analyzed 582 intersection motor vehicle accidents from the NAIS database between 2011 and 2019. The aim was to identify the characteristics of intersection vehicle accidents, such as the primary vehicle movement direction, target vehicle movement direction, and weather conditions [31]. The researchers included collision locations and angles between target and host vehicles by considering the relative direction of the target vehicle in relation to the host vehicle. This resulted in the identification of 17 AEB system-intersection test scenarios. To obtain the four types of dangerous accident scenarios for T-junction intersections, accident data were clustered. Additionally, dangerous collision domains were identified for passenger vehicles and commercial vehicles turning at T-junction intersections [32].
Scholars have proposed various methods for classifying intersection scenarios and evaluating indicators using naturalistic driving data and dynamic parameters. Intersection conflict types are divided into three categories and seven dangerous scenarios based on classification methods such as SHRP2, NHTSA, and InteractIVe. Factors such as road density, surrounding environmental impact, visual-field obstruction, and insufficient information were found to account for a high proportion of the factors inducing intersection accidents, according to the Driving Reliability and Error Analysis Method (DREAM) induction analysis of the logical relationship of factors [33]. Researchers proposed indicators, such as the intrusion area, estimated passing-time difference, and estimated collision time, based on the movement trajectory of vehicles passing through intersections. They analyzed common scenarios at intersections, such as Host Vehicle go Straight, Remote Vehicle turn Left in the Opposite direction (HVS/RVLO), to evaluate the potential risk of intersection vehicle traffic [34]. The features of the scenario are summarized based on 277 normal scenarios and 780 dangerous scenarios from the natural driving database. The intersection scenarios are classified based on geometric type, lane composition, and signal control. A logistic regression model was used to determine that road type, lane composition, and vehicle density significantly affect illegal driving [35].
The concept of a dynamic dilemma zone (DDZ) road segment is used in car-following theory to describe vehicle driver behavior at four-quadrant gate high-rail intersections [36]. In addition, researchers have studied three machine learning techniques to model drivers’ speed in intersection scenarios during the vehicle’s braking stage. The goal is to estimate a safe, comfortable, and human-like speed at the minimum distance for autonomous vehicles [37,38]. A microsimulation platform was created to evaluate the improved intersection car-following model and simulate the influenced saturation flow rate, based on an enhanced intelligent driver model [39].
To measure traffic conflicts in intersection areas, several indicators are proposed, including post-encroachment time (PET) and time to collision (TTC) [40]. In general, the study found that TTC and PET are the most accurate measures for analyzing intersection safety, considering ease of measurement and application to different conflict types [41]. TTC is recommended for rear-end conflicts, while PET is recommended for angle conflicts. Additionally, PET is proposed as a measure for safety performance during intergreen intervals, also known as change intervals [42]. Intergreen interval refers to the combined duration of the yellow and all-red intervals between phases. In general, PET is defined as the time difference between two successive vehicles, where the first vehicle clears the conflict area and the second arrives at the conflict area. During a change of phases, PET is defined as the elapsed time from when the last clearing vehicle in the previous phase passes the conflict point until the first entering vehicle of the subsequent phase arrives there. The study uses PET to estimate the number of conflicts, which are defined as encroachments between two vehicles with a PET of less than critical time [43].
While these indicators successfully model the possibility of a collision, they cannot directly measure conflict severity, which is defined by the outcome of the collision in terms of vehicle damage, injuries, and fatalities. PET cannot fully assess the safety of angle collisions. For example, safety assessments based on PET may not align with those based on vehicle speeds at conflict points. This is because it does not take into account the impulse of the vehicles involved in the conflict, which is a significant factor in determining the probability of a collision.
Therefore, the analysis of vehicle driving-behavior characteristics, such as velocity, acceleration, and angular velocity, should be the basis for intersection traffic research, and elements such as the distribution of conflicting vehicles speed, conflict angle, and acceleration have been used to evaluate the severity of a potential conflict. The driver-behavior features of intersection car-following scenarios were constructed using the probability-density distribution of velocity and acceleration parameters, based on a naturalistic driving behavior study [44]. Relying on different indicators independently can lead to contradictions. Overall, a single reliable index that reflects the overall safety performance, including crash frequency and severity, is still lacking. Research should investigate the significance of considering the dynamic parameter of the vehicles involved, in order to assessment the hazard risk [45].
Our motivation are the following: (1) the need for a comprehensive study on constructing driving behavior characteristics for intersection traffic in a more general manner, (2) the fact that the representation of driving behavior characteristics is often diverse and complex. What method can better represent the real driving behavior characteristics of vehicles in intersection traffic? And (3) the vehicles must adhere to traffic principles when crossing intersection areas. Is there a behavior boundary for vehicle driving behaviors that can improve the performance of autonomous vehicles?
3. Materials and Methods
3.1. Collection of Naturalistic Driving Data
Intelligent transportation systems (ITSs) can be pushed forward by V2X communications with cooperative operations. Vehicle-to-everything (V2X) communication technology, which encompasses vehicle-to-vehicle (V2V), vehicle-to-pedestrian (V2P), and vehicle-to-infrastructure (V2I) communication, is widely recognized as the fundamental building block for the development of intelligent vehicle infrastructure cooperative systems (IVICSs), because it has great potential to enhance road safety and optimize traffic efficiency [46].
To accelerate research on how to better utilize V2X information for autonomous vehicle, DAIR V2X datasets are jointly built by Tsinghua AIR and Baidu Apollo. The DAIR-V2X datasets consist of a series of real-world vehicle-infrastructure cooperative datasets, including the following: DAIR-V2X, a large-scale multi-modal multi-view 3D object detection dataset for research on vehicle-infrastructure cooperative autonomous driving, which comprises a total of 71,254 frames of image data and 71,254 frames of point cloud data; Rope3D, focusing more on roadside pure-vision monocular 3D target-detection tasks, which includes a total of 50,009 frames of image data; and V2X-Seq, a large-scale sequential vehicle-infrastructure cooperative dataset, which include the sequential perception dataset and the trajectory prediction dataset [47].
To push forward the cooperative sequential perception and forecasting, a large-scale sequential V2X dataset, V2X-Seq, was created. All elements of this dataset were captured and generated from real-world scenarios. V2X-Seq is the first sequential V2X dataset that includes such a large-scale scenario, making it an ideal resource for developing and testing cooperative perception and forecasting algorithms.
The V2X-Seq trajectory forecasting dataset (V2X-Seq TFD) comprises 210,000 scenarios, including 50,000 cooperative-view scenarios, all trajectories, and traffic lights, which are captured and generated from naturalistic driving scenarios [48].
- This dataset contains 80,000 infrastructure-view scenarios, 100,000 vehicle-view scenarios, and 50,000 cooperative-view scenarios mined from 672 h of data from 28 intelligent perception intersections in the Beijing High-Level Automated Driving Demonstration Area.
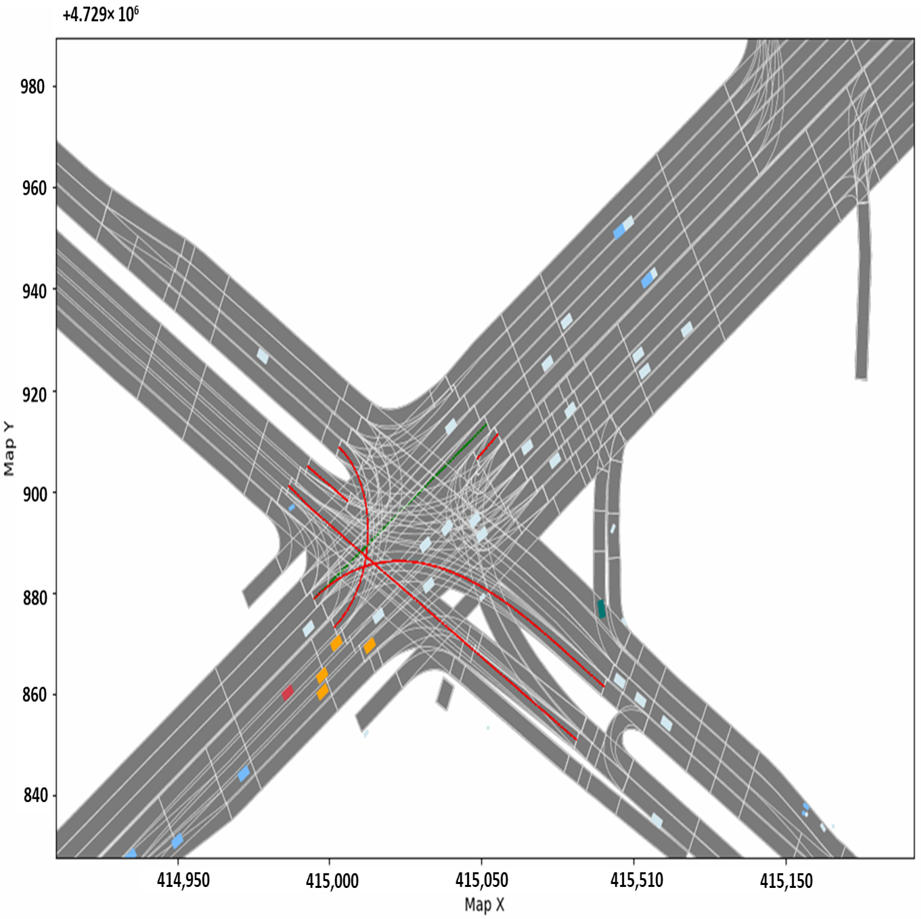
- For research convenience and privacy protection, all trajectories, and traffic lights are uniformly transformed to a virtual-world coordinate system, and the origin of the virtual-world coordinate system is located at a random point on earth, with the x–y plane parallel to the ground plane, and the z axis positive in the upward direction, shown in Figure 1.
- Each scenario contains 10 s with 10 Hz from 8 classes of object tracks generated automatically from raw sensor data, which includes Car, Truck, Van, Bus, Pedestrian, Cyclist, Tricyclist and Motorcyclist.
3.2. Selection of Intersection Traffic Data
According to the demand for comparative analysis of vehicle driving-behavior characteristics, the DAIR V2X-Seq cooperative-vehicle-infrastructure dataset is used in our search. This dataset contains the time-series trajectories of the level 4 high-driving autonomous vehicle (AV) and human vehicle (HV), which can be used to analyze the similarities and differences in the behavioral characteristics of AV cars and HVs from the macro-statistic and micro-dynamic dimensions.
The data set is organized and classified based on the intersection number to obtain the data collection duration, and the intersection data which are statistically significant are selected based on the data collection duration (T > 10 min). The selected intersection data are indicated in Table 1.
3.3. Extraction of Vehicle Dynamic Parameters
After selection and sorting of the DAIR V2X-Seq dataset, the vehicle-driving dynamic parameters are obtained. Based on initial parameters such as position, x-direction velocity, y-direction velocity, timestamp and angle, extended parameters such as velocity, angular velocity, and acceleration are calculated, as indicated in Table 2.
In traffic safety research, it is often necessary to determine the velocity, acceleration, and angular velocity of a vehicle at an intersection to analyze time–space relationships related to a potential collision [49]. Similarly, it is necessary to determine the above vehicle dynamic parameters to estimate driver response time, which is defined as important and critical for the research and development of the autonomous vehicle [50,51]. Therefore, this study analyzes the driving behavior characteristics of vehicles in intersection areas by using velocity, acceleration, and angular velocity.
3.4. Kernel Density Estimation
To research vehicle driving-behavior characteristics of intersection areas, studying the statistical distribution of bivariate parameters is essential. Because of the two-dimensional joint distribution features, probability-density function (PDF) is unsuitable for this study. Instead, non-parametric methods, including the Gaussian mixture model (GMM) [52] and kernel density estimation (KDE) [53], can estimate the joint distribution. For this research, multivariate kernel density estimation (MKDE) is chosen. Let be a set of d-dimensional observation vectors, and MKDE is defined as follows:
The value for the bandwidth of the kernel-smoothing is specified as a scalar value or d-element vector. The Silverman’s rule of thumb for the bandwidth is
where is the number of dimensions, is the number of observations, and is the standard deviation of the variate.
4. Results
After selection and processing of the DAIR V2X-Seq dataset, the statistical results show that the research data contain a total of 5591 vehicles’ trajectories, include 4457 HV trajectories and 1134 AV trajectories. The above vehicle trajectory will be utilized to study the bivariate distribution of vehicle driving-behavior parameters. For each vehicle trajectory, the two-dimensional scatter plot of vehicle driving parameters (velocity, angular velocity, acceleration) can be achieved, as shown in Figure 2.
4.1. Probability Distribution of Vehicle Driving Parameters
The univariate parameters of velocity, angular velocity and acceleration are used to obtain the probability by using the normal distribution-fitting method. The comparison of velocity, angular velocity, and acceleration probability distribution for the HV and AV of intersection traffic is shown in Figure 3.
Figure 3a indicates that the HV maximum velocity is 30% larger than the AV maximum velocity, and the probability of HV velocity is larger than the probability of AV velocity when the velocity is under 7 m/s. The maximum acceleration and angular velocity of HV are nearly 50% larger than that of the AV, as shown in Figure 3b,c. The result indicates that the driving behavior characteristic of the AV is more conservative than that of the HV.
4.2. Joint Probability-Density Distribution of Vehicle Driving Parameters
According to the statistical analysis of vehicle trajectories in intersection areas, the gathered data of velocity and angular distribution area is divided into many 0.1 × 0.1 small squares. The data points which are in the squares that contain fewer than or equal to two data points are regarded as abnormal data, and these data points are not considered in this study. Hence, the percentile contour of the data density can be obtained.
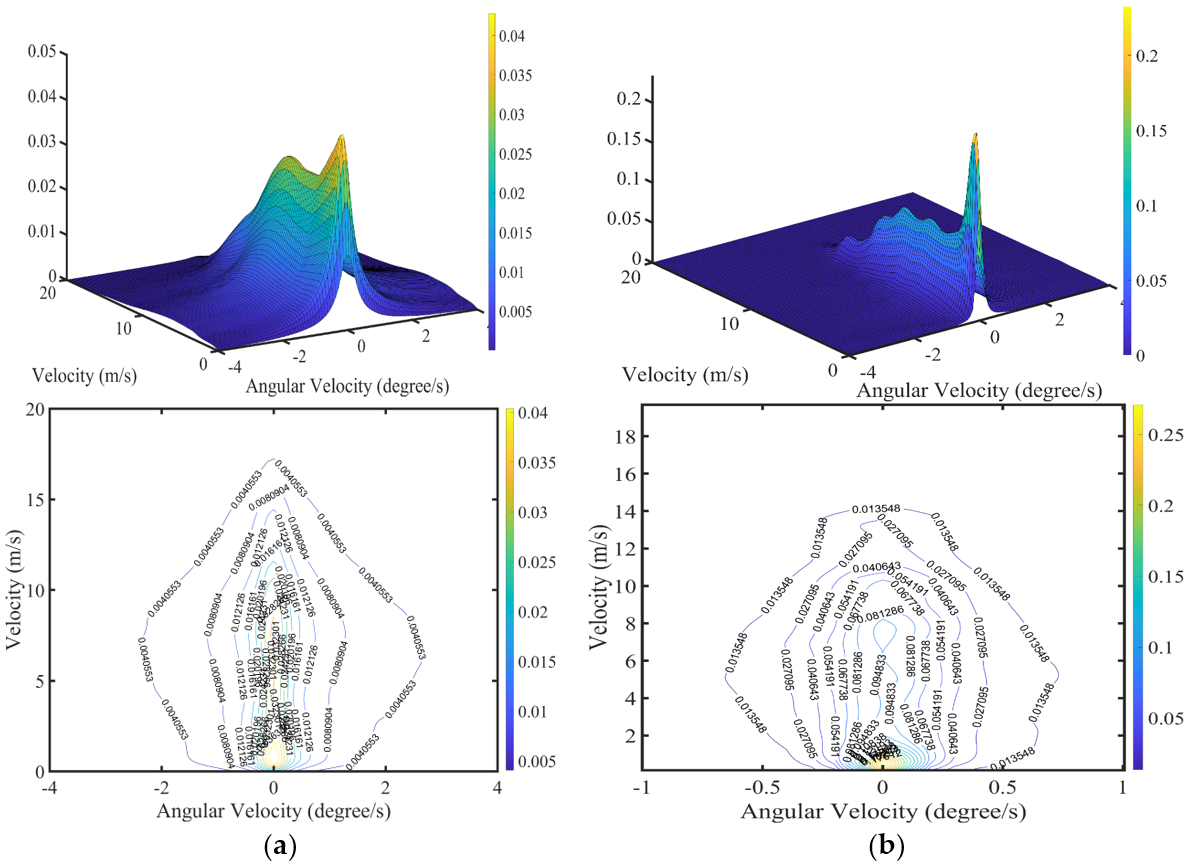
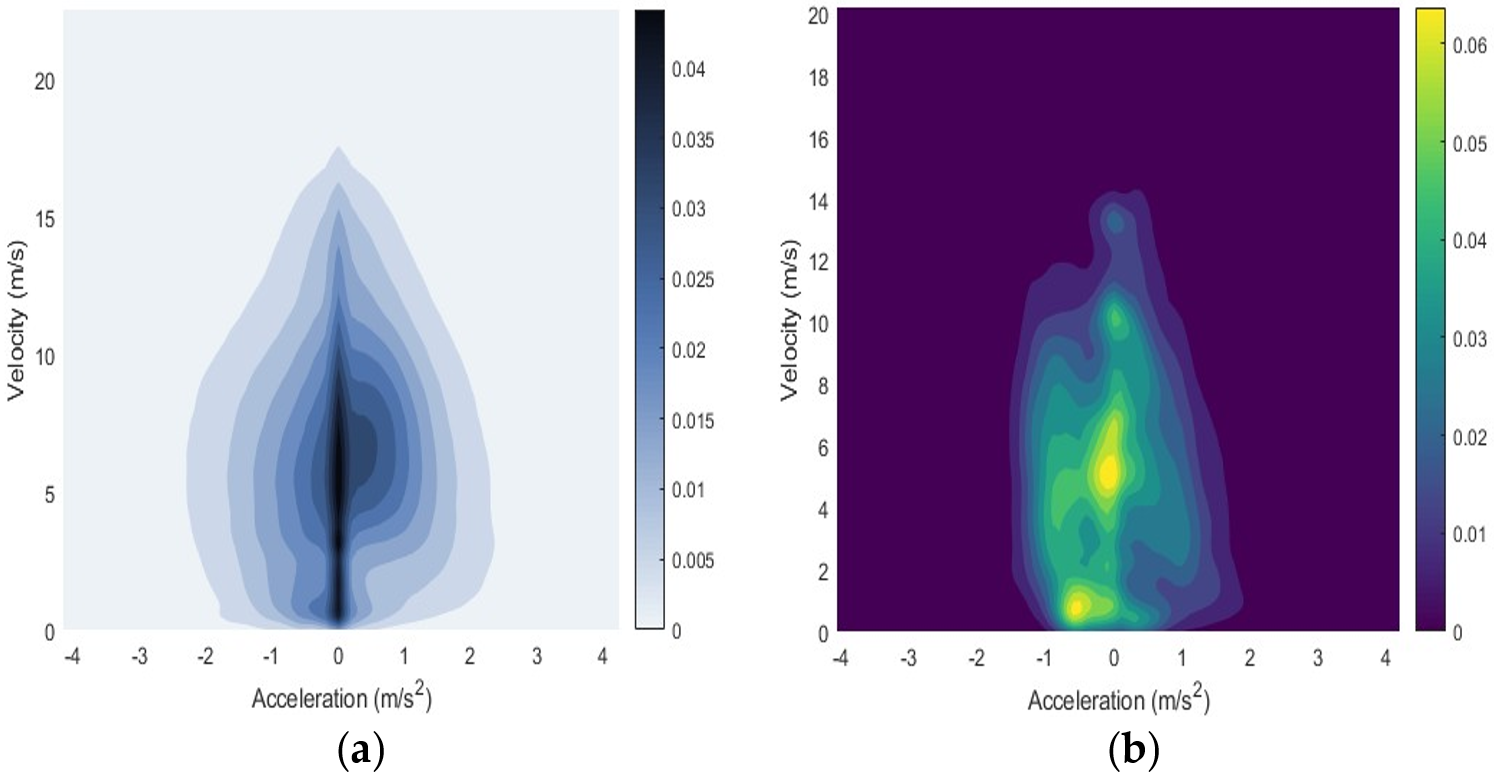
For the HV and AV, the joint-probability-density distribution and the contour line of the vehicle dynamic parameters are shown in Figure 4, Figure 5 and Figure 6. From Figure 4, Figure 5 and Figure 6, it can be seen that the vehicle dynamic-parameter distribution of the HV is more scattered than that of the AV. From Figure 4a, it can be seen that the HV velocity in intersection areas ranges from 0 m/s to 18 m/s, which is larger than the AV velocity range. However, the angular velocity of most HVs and AVs in intersection areas lies between −0.6 degree/s and degree/s, as shown in Figure 5b. For joint-probability-density distribution of velocity and acceleration, most HV accelerations lie between −3 m/s2 and 3 m/s2, and most AV accelerations lie between −1.5 m/s2 and 2 m/s2, which means that human driving behavior is more aggressive, as shown in Figure 6a,b.
4.3. Behavior Boundary of Vehicle-Behavior Charateristic
Based on the consideration of the statistics of the behavior characteristics in the intersection area, the value of the vehicle dynamic parameters should be kept within a reasonable range, because abnormal vehicle-driving behaviors occur in intersection areas. Therefore, according to the statistical analysis of joint-probability distribution of vehicle dynamic parameters, the data will be processed based on the above velocity, angular velocity, and acceleration ranges and utilized to obtain the vehicle driving-behavior boundary-fitting curve, as shown in Figure 7, Figure 8 and Figure 9.
According to the contour line of 99% joint-probability distribution of vehicle driving parameters, the behavior boundary equations of velocity (V), angular velocity (AGV), and acceleration (ACC) for the HV and AV are fitted as below:
To prove the accuracy of the vehicle-behavior boundary, the data from the remaining data were selected for test and evaluation. The results showed that the accuracy of the HV and AV was 83.7% and 89.2%, indicating that the vehicle-behavior boundary can accurately characterize the driving behavior characteristics of the HV and AV.
5. Conclusions
In this paper, a detailed study of the vehicle driving-behavior characteristics in inter-section areas is conducted. For that, V2X-Seq TFD data were processed to analyze the vehicles’ naturalistic driving behaviors, which are collected from 28 intelligent-vehicle infrastructure cooperative-intersection areas in the Beijing High-Level Automated Driving Demonstration Area. Evaluating safety performance by estimating crash indicators (e.g., TTC, PET) may lead to inconsistent results in some cases. Furthermore, it is concluded that the dynamic parameter distribution of the conflicting vehicles and their relative motion is a good indicator of conflict severity.
Therefore, an assessment approach for the vehicle-behavior boundary of intersection traffic based on the naturalistic driving study is proposed. Using naturalistic driving data and general vehicle dynamic parameters, we represent vehicle driving behavior characteristic of intersection area and analyses the driving behavior features of Human Vehicle (HV) and Autonomous Vehicle (AV) with probability statistics method. we propose an MKDE method that can obtain the counter line of joint-probability density with velocity, angular velocity and acceleration, which is used to establish the behavior boundary of vehicle driving behavior.
As a result of the comparison analysis, it is found that the proposed vehicle-behavior boundary of the HV and AV is successful in providing the real and accurate driving behavior characteristics of different signalized-intersection vehicle traffic, and that the driving behavior characteristic of the AV is more conservative than that of the HV. This vehicle-behavior boundary can improve the capability of the autonomous vehicle and optimize the safety and efficiency of intersection traffic under and intelligent-connected-traffic environment. The test for the vehicle-behavior boundary indicates that the vehicle-behavior boundary can accurately represent the driving characteristics of the HV and AV. In the future, our method can be further extended to intersection areas with different traffic participants, and help us to carry out prospective research on the vehicle-infrastructure cooperative safety of an intelligent-transportation system.
Author Contributions
Conceptualization, B.W. and X.Z.; methodology, B.W. and X.Z.; validation, B.W. and Z.M.; formal analysis, B.W. and Y.L.; investigation, B.W. and Y.L.; data curation, Y.L.; writing—original draft preparation, B.W.; writing—review and editing, B.W. and Z.M.; project administration, X.Z. and Z.M. All authors have read and agreed to the published version of the manuscript.
Funding
Research supported by National Key Research and Development Plan of China (2022YFB2503404).
Institutional Review Board Statement
Not applicable.
Informed Consent Statement
Not applicable.
Data Availability Statement
The raw data that support the findings of this study are available from FAIR-V2X datasets at https://thudair.baai.ac.cn/cooplocus.
Conflicts of Interest
Yu Lin was employed by Shanghai Jinqiao Intelligent Connected Automobile Development Limited Company. The remaining authors declare that the research was conducted in the absence of any commercial or financial relationships that could be construed as a potential conflict of interest.
References
- Agafonov; Yumaganov, A. 3D Objects Detection in an Autonomous Car Driving Problem. In Proceedings of the 2020 International Conference on Information Technology and Nanotechnology (ITNT), Samara, Russia, 26–29 May 2020; pp. 1–5. [Google Scholar]
- Zumd, J.; Sener, I.N.; Wagner, J. Revolutionizing Our Roadways Consumer Acceptance and Travel Behavior Impacts of Automated Vehicles; Texas A&M Transportation Institute: College Station, TX, USA, 2016. [Google Scholar]
- Duan, X.; Jiang, H.; Tian, D.; Zou, T.; Zhou, J.; Cao, Y. V2I based environment perception for autonomous vehicles at intersections. China Commun. 2021, 18, 1–12. [Google Scholar] [CrossRef]
- Guneshka, S.; Daniel, B.; Zöllner, J.M. One ontology to rule them all: Corner case scenarios for autonomous driving. In Proceedings of the European Conference on Computer Vision; Tel Aviv, Israel, 23–27 October 2022, Springer Nature: Cham, Switzerland, 2022. [Google Scholar]
- Bogdoll, D.; Breitenstein, J.; Heidecker, F.; Bieshaar, M.; Sick, B.; Fingscheidt, T.; Zöllner, J.M. Description of corner cases in automated driving: Goals and challenges. In Proceedings of the IEEE/CVF International Conference on Computer Vision, Montreal, BC, Canada, 11–17 October 2021. [Google Scholar]
- Biao, W.; Xichan, Z.; Maozhu, L.; Rui, L. Safety boundary condition model based on vehicle intersection conflict and collision. J. Tianjin Norm. Univ. 2019, 39, 62–66. [Google Scholar]
- Federal Highway Administration. About Intersection Safety. Available online: https://safety.fhwa.dot.gov/intersection/about/index.cfm (accessed on 18 August 2020).
- United States Department of Transportation. Intersection Safety. Available online: https://highways.dot.gov/research/research-programs/safety/intersection-safety (accessed on 2 May 2023).
- National Highway Traffic Safety Administration. National Automotive Sampling System (NASS) General Estimates System (GES) Analytical User’s Manual 1988–2015; National Highway Traffic Safety Administration (NHTSA): Washington, DC, USA, 2016. [Google Scholar]
- China Automotive Technology and Research Center Co., Ltd. (CATARC). White Paper on Traffic Safety of Autonomous Vehicles; China Automotive Technology and Research Center Co., Ltd. (CATARC): Tianjin, China, 2021. [Google Scholar]
- Insurance Institute for Highway Safety, Highway Loss Data, Fatality Facts 2018 Urban/rural Comparison. Available online: https://www.iihs.org/topics/fatality-statistics/detail/urban-rural-comparison (accessed on 1 May 2019).
- ISO/PAS 21448; 2019 Road Vehicles—Safety of the Intended Functionality. The International Organization for Standardization: Geneva, Switzerland, 2019.
- ECE TRANS WP.29 GRVA. Proposal for the Future Certification of Automated/Autonomous Driving Systems [EB/OL]. Available online: https://www.unece.org/trans/main/wp29/wp29wgs/wp29grva/grva2019.html (accessed on 1 September 2019).
- Rinaldi, G.; Menon, P.P.; Edwards, C. Suboptimal Sliding Mode-based Heading and Speed Guidance Scheme for Boundary Tracking with Autonomous Vehicle. In Proceedings of the 2021 American Control Conference, Virtual, 25–28 May 2021. [Google Scholar]
- Mao, L.; Li, W.; Hu, P.; Zhou, G.; Zhang, H.; Dai, J. Design of Real-Time Dynamic Reversible Lane in Intelligent Cooperative Vehicle Infrastructure System. J. Adv. Transp. 2020, 2, 8838896. [Google Scholar] [CrossRef]
- Cai, J.; Huang, R.; Huang, Z. Optimization of variable lane considering reduction of capacity. J. Cent. South Univ. Sci. Technol. 2018, 49, 1838–1844. [Google Scholar]
- Ma, D.; Xiao, J.; Song, X.; Ma, X.; Jin, S. A Back-Pressure-Based Model with Fixed Phase Sequences for Traffic Signal Optimization Under Oversaturated Networks. IEEE Trans. Intell. Transp. Syst. 2020, 99, 5577–5588. [Google Scholar] [CrossRef]
- Zhou, X. Design and Development of Vehicle Navigation System Based on Intersection Safety. Master’s Thesis, Shandong University of Technology, Zibo, China, 2013. [Google Scholar]
- Van Schagen, I.; Welsh, R.; Backer-Grøndahl, A.; Sagberg, F.; Tsippy, L.; Hoedemae, M.; Morris, A. Towards a Large-Scale European Naturalistic Driving study: Main Findings of PROLOGUE. PROLOGUE Deliverable D4.2; SWOV Institute for Road Safety Research: Leidschendam, The Netherlands, 2011. [Google Scholar]
- Welsh, R.; Reed, S.; Talbot, R.; Morris, A. Data collection, analysis methods and equipment for naturalistic studies and requirements for the different application areas. In PROLOGUE Deliverable D2.1; Loughborough University: Loughborough, UK, 2010. [Google Scholar]
- Backer, G.; Lotan, T.; Van, I. Summary and integration of a series of Naturalistic Driving field trials. In PROLOGUE Deliverable D3.7; TOI Institute of Transport Economics: Oslo, Norway, 2011. [Google Scholar]
- Ingrid, S.; Fridulv, S. The Potential Benefits of Naturalistic Driving for Road Safety Research: Theoretical and Empirical Considerations and Challenges for the Future. Procedia—Soc. Behav. Sci. 2012, 48, 692–701. [Google Scholar]
- Liu, L.; Zhu, X.; Chen, M.; Ma, Z. A Systematic Scenario Typology for Automated Vehicles Based on China-FOT. In WCX World Congress Experience; SAE International: Warrendale, PA, USA, 2018. [Google Scholar]
- Najm, W.G.; Smith, J.D.; Yanagisawa, M. Pre-Crash Scenario Typology for Crash Avoidance Research; United States National Highway Traffic Safety Administration: Washington, DC, USA, 2007. [Google Scholar]
- Google. Waymo [EB/OL]. Available online: www.waymo.com (accessed on 1 December 2023).
- Carmen, R.; Joris, D.; Felix, F.; AdaptIVe subprojects. AdaptIVe Final Report Deliverable D1.0. AdaptIVe Consortium. Available online: https://www.adaptive-ip.eu/files/adaptive/content/downloads/AdaptIVe-SP1-v1-0-DL-D1-0-Final_Report.pdf (accessed on 1 May 2017).
- Jensen, M.B.; Møgelmose, A.; Moeslund, T.B. Presenting the multi-view traffic intersection dataset (MTID): A detailed traffic-surveillance dataset. In Proceedings of the IEEE 23rd International Conference on Intelligent Transportation Systems (ITSC), Rhodes, Greece, 20–23 September 2020; pp. 1–6. [Google Scholar]
- Schuldt, F.; Reschka, A.; Maurer, M. A method for an efficient, systematic test case generation for advanced driver assistance systems in virtual environments. In Automotive Systems Engineering II; Springer: Cham, Switzerland, 2008; pp. 147–175. [Google Scholar]
- Xu, X.; Zhou, Z.; Hu, W.; Xiao, L.; Li, W.; Wang, S. AEB intersection test scenario based on accident data mining. J. Beijing Univ. Aeronaut. Astronaut. 2020, 46, 1817–1825. [Google Scholar]
- Xiangyang, X.; Wenhao, H.; Honglei, D. A review of key technologies for constructing autonomous vehicle test scenarios. Automot. Eng. 2021, 43, 610–619. [Google Scholar]
- Zhang, S.; He, Z.; Liao, J.; Li, P.; Xiao, L.; Xu, Q. Research on intersection test scenarios of AEB system based on NAIS. Traffic Inf. Saf. 2021, 39, 87–96. [Google Scholar]
- Liao, J.; Zhang, D.; Gao, L.; Liao, W. Research on dangerous scenarios at T-intersections based on NAIS accident data clustering. J. Automot. Saf. Energy 2021, 12, 336–345. [Google Scholar]
- Sun, X.; Zhu, X.; Zhang, K.; Li, L.; Ma, Z.; Wang, D. Automatic detection method research of incidents in China-FOT database. In Proceedings of the 2016 IEEE 19th International Conference of the Intelligent Transportation Systems (ITSC), Rio de Janeiro, Brazil, 1–4 November 2016; IEEE: Piscataway, NJ, USA, 2016; pp. 754–759. [Google Scholar]
- Yan, Y.; Zhu, X.; Liao, M.; Ma, Z. Danger Degree Evaluation Method of Crossroad Scenario Based on Naturalistic Driving Analysis. In Proceedings of the 2018 IEEE Intelligent Transportation Systems Conference (ITSC), Maui, HI, USA, 4–7 November 2018. [Google Scholar]
- Xuehan, M.; Xichan, Z.; Zhixiong, M. Analysis of intersection traffic classification and violation behavior in natural driving research. In Proceedings of the 14th International Forum of Automotive Traffic Safety, Geneva, Switzerland, 1 December 2017. [Google Scholar]
- Moon, Y.J.; Coleman, F., III. Dynamic dilemma zone based on driver behavior and car-following model at highway–rail intersections. Transp. Res. Part B 2003, 37, 323–344. [Google Scholar] [CrossRef]
- Tawfeek, M.H.; El-Basyouny, K. Location-Based Analysis of Car-Following Behavior During Braking Using Naturalistic Driving Data. Can. J. Civ. Eng. 2019, 47, 498–505. [Google Scholar] [CrossRef]
- Tawfeek, M.H. Human-like Speed Modelling for Autonomous Vehicles during Car-Following at Intersections. Can. J. Civ. Eng. 2021, 49, 255–264. [Google Scholar] [CrossRef]
- Kondoh, T.; Yamamura, T.; Kitazaki, S.; Kuge, N.; Boer, E.R. Identification of Visual Cues and Quantification of Drivers’ Perception of Proximity Risk to the Lead Vehicle in Car-Following Situations. J. Mech. Syst. Transp. Logist. 2008, 1, 170–180. [Google Scholar] [CrossRef]
- Gettman, D.; Head, L. Surrogate Safety Measures from Traffic Simulation Models; FHWA/RD-03-050; Federal Highway Administration, Department of Transportation, U.S.: Washington, DC, USA, 2003. [Google Scholar]
- Allen, B.L.; Shin, B.T.; Cooper, P.J. Analysis of traffic conflicts and collisions. Transp. Res. Rec. J. Transp. Res. 1978, 667, 67–74. [Google Scholar]
- Tang, K.; Nakamura, H. Safety evaluation for intergreen intervals at signalized intersections based on probabilistic methodology. Transp. Res. Rec. J. Transp. Res. 2009, 2128, 226–235. [Google Scholar] [CrossRef]
- Autey, J.; Sayed, T.; Zaki, M. Safety evaluation of right-turn smart channels using automated traffic conflict analysis. Accid. Anal. 2012, 45, 120–130. [Google Scholar] [CrossRef] [PubMed]
- Wu, B.; Ma, Z.; Wei, X.; Zhou, X. Research on The Safety Boundary of Intersection Car-Following Scenarios Based on Naturalistic Driving Behavior Study. In SAE Technical Paper; SAE International: Warrendale, PA, USA, 2022. [Google Scholar]
- Alhajyaseen, W.K.M. The Integration of Conflict Probability and Severity for the Safety Assessment of Intersections. Arab. J. Sci. Eng. 2015, 40, 421–430. [Google Scholar] [CrossRef]
- Chen, S.; Hu, J.; Shi, Y.; Peng, Y.; Fang, J.; Zhao, R.; Zhao, L. Vehicle-to-everything (V2X) services supported by LTE-based systems and 5G. IEEE Commun. Stand. Mag. 2017, 1, 70–76. [Google Scholar] [CrossRef]
- Yu, H.; Luo, Y.; Shu, M.; Huo, Y.; Yang, Z.; Shi, Y.; Guo, Z.; Li, H.; Hu, X.; Yuan, J.; et al. DAIR-V2X: A Large-Scale Dataset for Vehicle-Infrastructure Cooperative 3D Object Detection. In Proceedings of the IEEE/CVF Conference on Computer Vision and Pattern Recognition, New Orleans, LA, USA, 19–24 June 2022. [Google Scholar]
- Yu, H.; Yang, W.; Ruan, H.; Yang, Z.; Tang, Y.; Gao, X.; Hao, X.; Shi, Y.; Pan, Y.; Sun, N.; et al. V2X-Seq: A Large-Scale Sequential Dataset for Vehicle-Infrastructure Cooperative Perception and Forecasting. In Proceedings of the IEEE/CVF Conference on Computer Vision and Pattern Recognition, Vancouver, BC, Canada, 17–24 June 2023. [Google Scholar]
- Danaher, D.; McDonough, S.; Donaldson, D.; Cochran, R. A Naturalistic Study of Vehicle Acceleration and Deceleration at an Intersection. SAE Int. J. Adv. Curr. Pract. Mobil. 2023, 5, 473–484. [Google Scholar] [CrossRef]
- Ziraldo, E.; Attalla, S.; Kodsi, S.; Oliver, M. Driver Response to Right Turning Path Intrusions at Signalized Intersections. SAE Int. J. Adv. Curr. Pract. Mobil. 2020, 2, 1623–1632. [Google Scholar] [CrossRef]
- Ziraldo, E.; Attalla, S.; Kodsi, S.; Oliver, M. Driver Response to Left Incurring Path Intrusions at Sign-Controlled Intersections. In Proceedings of the WCX SAE World Congress Experience, Detroit, MI, USA, 21–24 April 2020. [Google Scholar]
- Butakov, V.A.; Ioannou, P. Personalized Driver/Vehicle Lane Change Models for ADAS. IEEE Trans. Veh. Technol. 2015, 64, 4422–4431. [Google Scholar] [CrossRef]
- Bishop, C.M. Pattern Recognition and Machine Learning; Springer: New York, NY, USA, 2006. [Google Scholar]
Figure 1.
Example of vehicle trajectories (red lines) of DAIR V2X-Seq dataset.

Figure 2.
Scatter plot of velocity-angular velocity (a), velocity-acceleration (b), and acceleration-angular velocity (c) for HV and AV.
Figure 2.
Scatter plot of velocity-angular velocity (a), velocity-acceleration (b), and acceleration-angular velocity (c) for HV and AV.
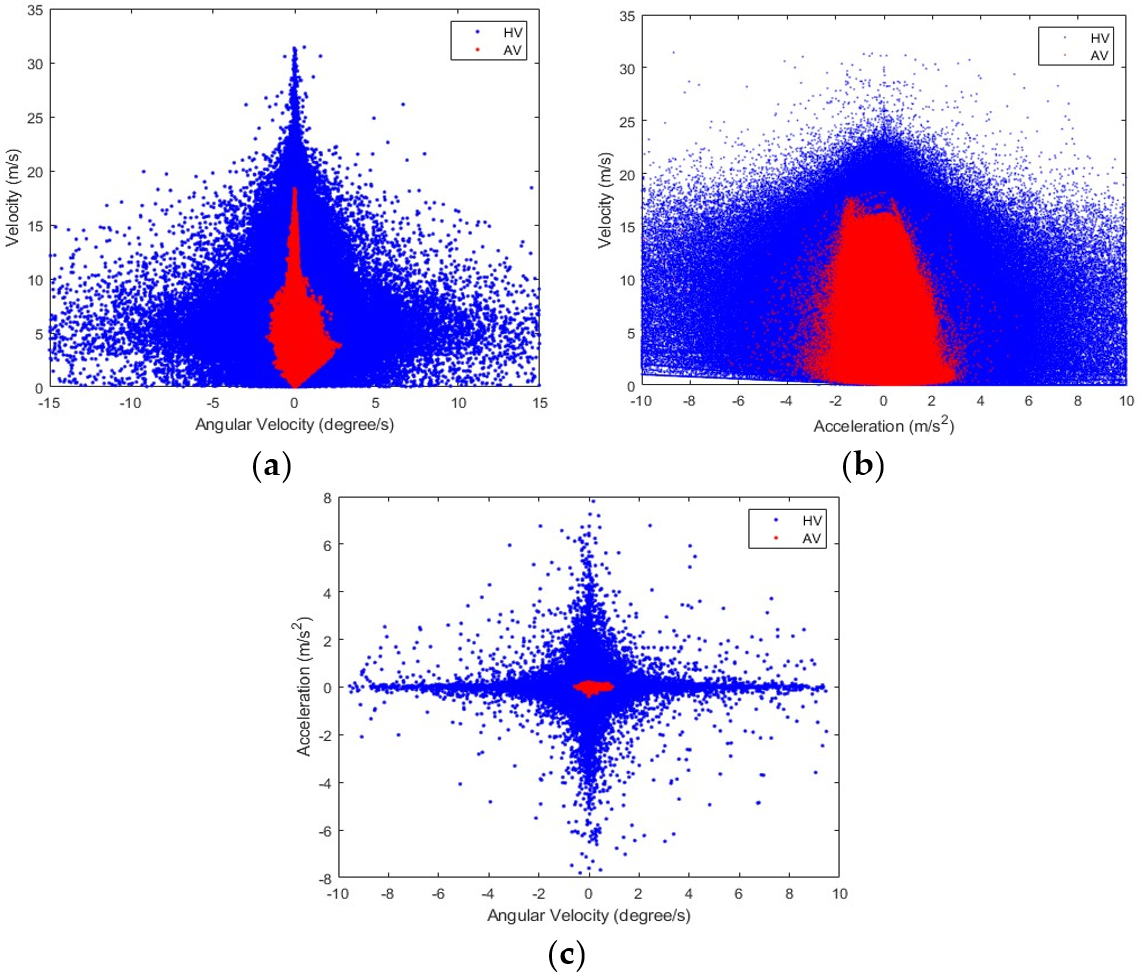
Figure 3.
Comparison of vehicle driving-behavior parameter probability distribution, velocity (a), acceleration (b), and angular velocity (c) for HV and AV.
Figure 3.
Comparison of vehicle driving-behavior parameter probability distribution, velocity (a), acceleration (b), and angular velocity (c) for HV and AV.
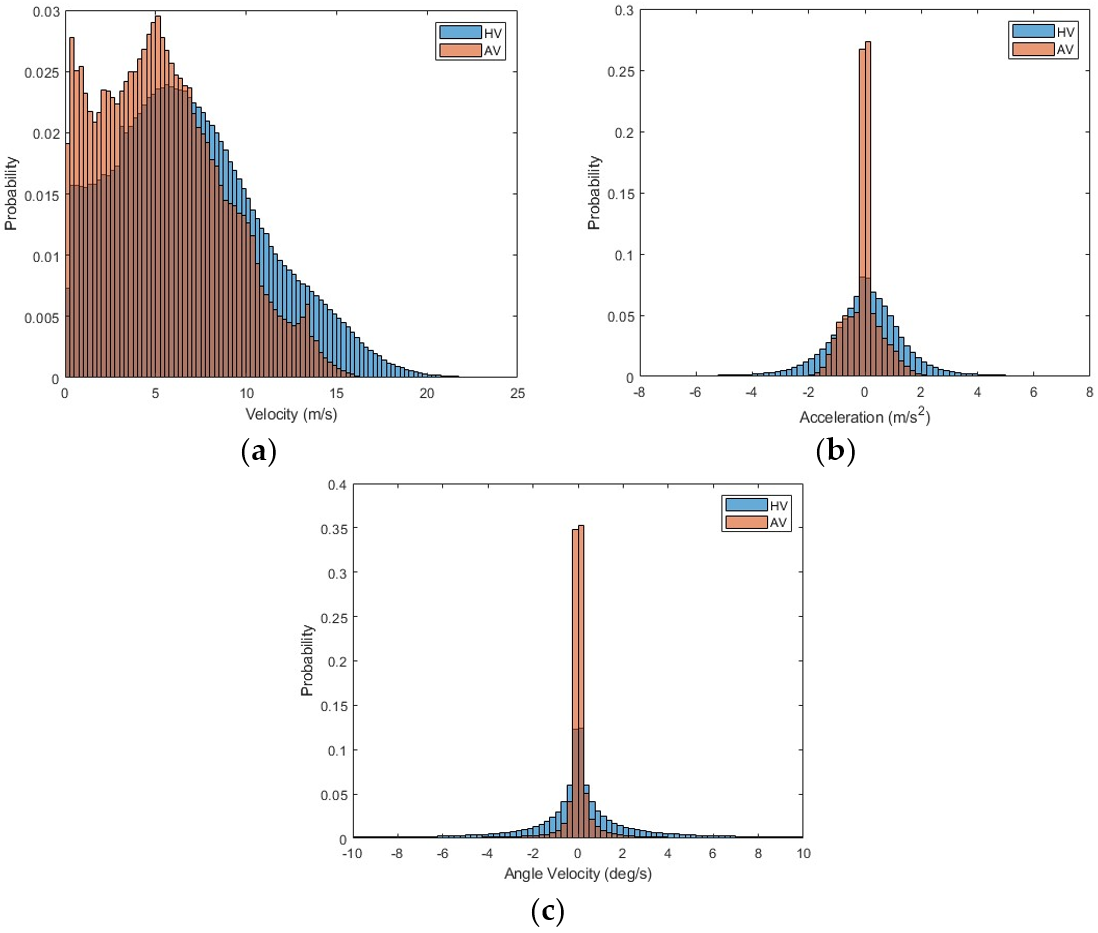
Figure 4.
Probability-density distribution and contour line of angular velocity and velocity. ((a) HV, (b) AV).
Figure 4.
Probability-density distribution and contour line of angular velocity and velocity. ((a) HV, (b) AV).

Figure 5.
Probability-density distribution and contour line of acceleration and velocity. ((a) HV, (b) AV).
Figure 5.
Probability-density distribution and contour line of acceleration and velocity. ((a) HV, (b) AV).


Figure 6.
Probability-density distribution and contour line of angular velocity and acceleration. ((a) HV, (b) AV).
Figure 6.
Probability-density distribution and contour line of angular velocity and acceleration. ((a) HV, (b) AV).
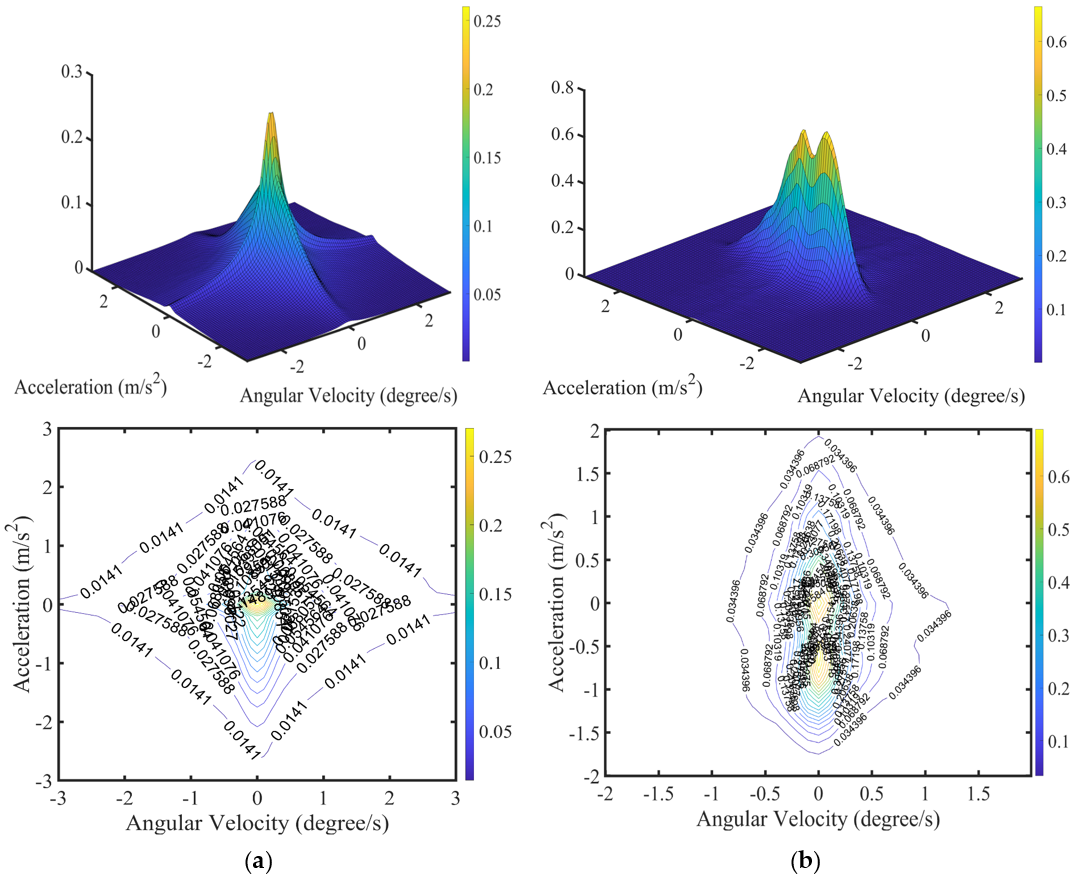
Figure 7.
Behavior boundary of angular velocity and velocity. ((a) HV, (b) AV.)
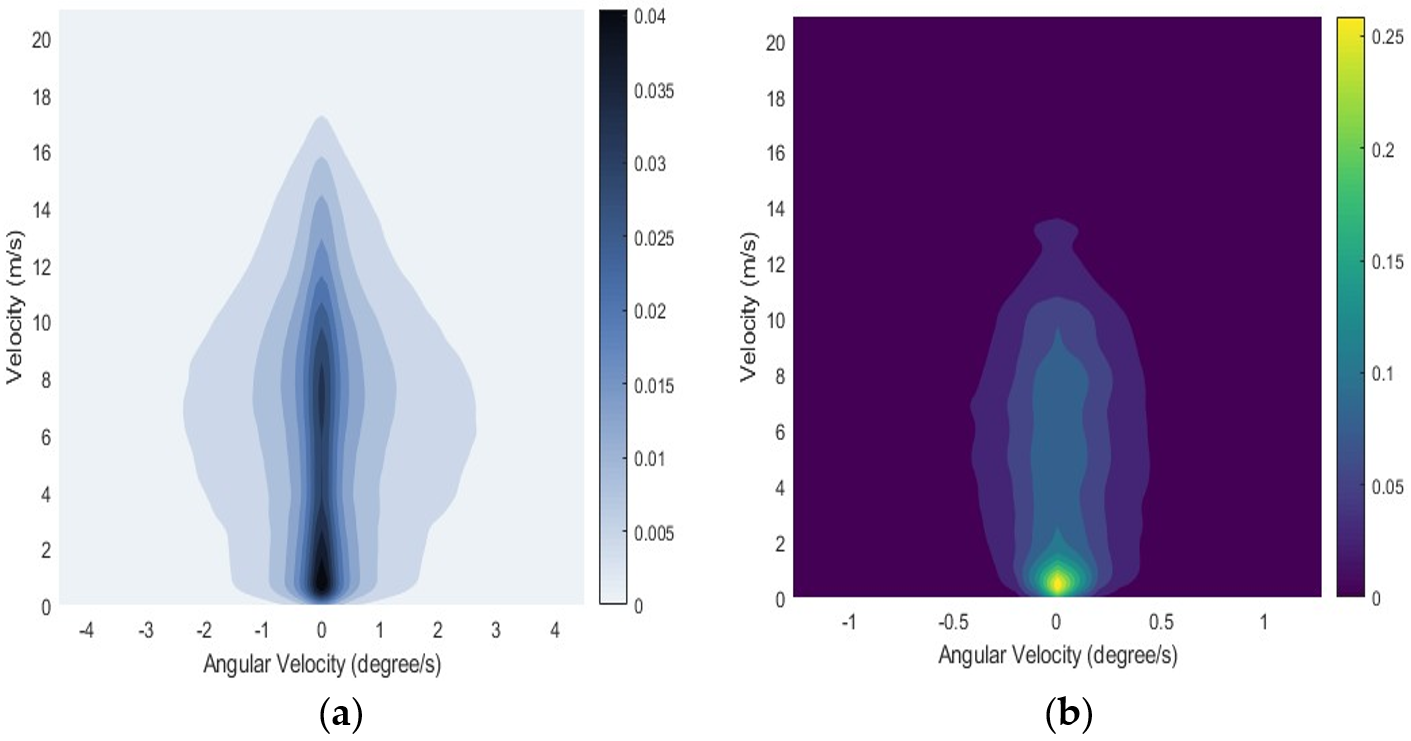
Figure 8.
Behavior boundary of acceleration and velocity. ((a) HV, (b) AV).

Figure 9.
Behavior boundary of angular velocity and acceleration. ((a) HV, (b) AV).


Table 1.
Intersection data-collection duration.
| Intersection ID Number | Data Collection Duration (min) | Intersection ID Number | Data Collection Duration (min) |
|---|---|---|---|
| 4 | 1819 | 28 | 135 |
| 20 | 1453 | 27 | 133 |
| 12 | 552 | 25 | 123 |
| 13 | 453 | 1 | 62 |
| 14 | 339 | 19 | 49 |
| 7 | 316 | 81 | 27 |
| 11 | 247 | 5 | 22 |
| 2 | 175 | 9 | 10 |
Table 2.
Parameters of vehicle driving behavior.
| Parameter | Description |
|---|---|
| ID | Vehicle identification number |
| Time | Elapsed time in milliseconds since 1 January 1970 |
| Intersection_ID | Current intersection position of vehicle |
| X | X Coordinate of the front center of the vehicle based on DAIR-V2X coordinate system |
| Y | Y Coordinate of the front center of the vehicle based on DAIR-V2X coordinate system |
| Angle | Angle between vehicle driving direction and X Coordinate based on DAIR-V2X coordinate system |
| V_X | Vehicle’s instantaneous velocity based on X direction of DAIR-V2X coordinate system |
| V_Y | Vehicle’s instantaneous velocity based on Y direction of DAIR-V2X coordinate system |
| V | Vehicle’s instantaneous velocity in m/s |
| Acceleration | Vehicle’s instantaneous velocity in m/s2 |
| Angular Velocity | Vehicle’s instantaneous angular velocity in degree/s |
Disclaimer/Publisher’s Note: The statements, opinions and data contained in all publications are solely those of the individual author(s) and contributor(s) and not of MDPI and/or the editor(s). MDPI and/or the editor(s) disclaim responsibility for any injury to people or property resulting from any ideas, methods, instructions or products referred to in the content. |
© 2024 by the authors. Licensee MDPI, Basel, Switzerland. This article is an open access article distributed under the terms and conditions of the Creative Commons Attribution (CC BY) license (https://creativecommons.org/licenses/by/4.0/).
Share and Cite
MDPI and ACS Style
Wu, B.; Ma, Z.; Zhu, X.; Lin, Y. Research on the Vehicle-Behavior Boundary of Intersection Traffic Based on Naturalistic Driving Data Study. Appl. Sci. 2024, 14, 3432. https://doi.org/10.3390/app14083432
AMA Style
Wu B, Ma Z, Zhu X, Lin Y. Research on the Vehicle-Behavior Boundary of Intersection Traffic Based on Naturalistic Driving Data Study. Applied Sciences. 2024; 14(8):3432. https://doi.org/10.3390/app14083432
Chicago/Turabian StyleWu, Biao, Zhixiong Ma, Xichan Zhu, and Yu Lin. 2024. "Research on the Vehicle-Behavior Boundary of Intersection Traffic Based on Naturalistic Driving Data Study" Applied Sciences 14, no. 8: 3432. https://doi.org/10.3390/app14083432
Note that from the first issue of 2016, this journal uses article numbers instead of page numbers. See further details here.