
A New Training Method for VR Sickness Reduction


1
BioComputing Lab, Department of Computer Science and Engineering, Korea University of Technology and Education (KOREATECH), Cheonan 31253, Republic of Korea
2
BioComputing Lab, Institute for Bio-Engineering Application Technology, Department of Computer Science and Engineering, Korea University of Technology and Education (KOREATECH), Cheonan 31253, Republic of Korea
*
Author to whom correspondence should be addressed.
Appl. Sci. 2024, 14(8), 3485; https://doi.org/10.3390/app14083485
Submission received: 13 March 2024
/
Revised: 15 April 2024
/
Accepted: 17 April 2024
/
Published: 20 April 2024
Abstract
:In this paper, we propose a training method to reduce the VR sickness that occurs while viewing VR content with an HMD on. The proposed approach is a new method that involves pre-exposing users to VR sickness to enable them to adapt to VR sickness. In the proposed method, the training process was designed based on the features of existing studies related to exposure and adaptation to motion sickness and simulator sickness. The effectiveness of the proposed method was evaluated through experiments with 15 subjects (SSQ and VR sickness response were used in the analysis). As a result of the experiment, nausea was significantly decreased by 47%, and oculomotor discomfort was significantly decreased by 34% after the proposed training method. The VR sickness response decreased by 31%; however, this difference was not statistically significant. Furthermore, we analyzed the VR sickness response in two groups: those whose sickness decreased and those whose sickness increased. We confirmed that the decrease group (pre-experiment mean: 1.34 times, post-experiment mean: 0.58 times) had a larger change than the increase group (pre-experiment mean: 0.31 times, post-experiment mean: 0.42 times). Therefore, from the experimental results, it was confirmed that the proposed method is effective in reducing VR sickness.
1. Introduction
Virtual reality (VR) is a technology that can provide experiences that transcend limited time and space; thus, it is being used in various fields. In virtual reality, a head-mounted display (HMD) is used to completely separate the user’s gaze from the external environment, thereby increasing immersion. Interactions with the virtual environment are performed through controllers and sensors. However, virtual reality induces symptoms of motion sickness, referred to as cybersickness or VR sickness. Currently, there are no clear guidelines on how to overcome VR sickness.
VR sickness is commonly described in sensory conflict theory and postural instability theory. Sensory conflict theory explains that a discrepancy between the vestibular and visual organs results in perceptual conflict, which causes motion sickness [1]. Postural instability theory explains that motion sickness is caused by an unstable posture [2]. Therefore, VR beginners may experience more VR sickness because they are unable to maintain a stable posture.
The negative experience associated with VR sickness (e.g., dizziness, headache, and nausea) is one of the factors preventing the spread of VR technology. Various studies have been conducted to solve this problem.
The first aspect of these studies focuses on how to measure VR sickness. VR sickness measurement methods can be classified into subjective measurement, which involves receiving a questionnaire from a user, and objective measurement, which uses physiological signals. Subjective evaluation questionnaires commonly include the simulator sickness questionnaire (SSQ) [3], motion sickness susceptibility questionnaire (MSSQ) [4], and game experience questionnaire (GEQ) [5]. Common physiological signals used in objective measurements include an electrocardiogram (ECG), electrodermal activity (EDA), and an electrooculogram (EOG).
The second focus is on how to reduce VR sickness. VR sickness reduction methods can be classified as hardware and software approaches.
First, by examining the hardware approach, Singla et al. (2017) compared VR sickness based on two HMDs (HTC Vive and Oculus Rift) and reported that HTC Vive provided better quality to reduce VR sickness than Oculus Rift [6]. This suggests that a higher-performing HMD can reduce VR sickness. However, this hardware-focused approach can create a dependency on a specific HMD, and with the annual release of higher-performance HMDs, there is the problem of users having to constantly change their HMD.
Accordingly, several studies have been conducted to reduce VR sickness using a software approach. First, there are studies that have used visual effects. Groth et al. (2021) applied peripheral blurring and field-of-view reduction effects to the content to decrease VR sickness and confirmed the effectiveness of this approach from experimental results [7]. Nie et al. (2019) applied a dynamically changing blur effect to first-person games and confirmed from experimental results that this approach reduced the level of VR sickness in users [8]. Jang et al. (2024) proposed a content design method (methods of movement, panel position, laser, background panel) to reduce cybersickness occurring in XR environments [9].
Additionally, studies have been conducted to reduce VR sickness by providing specific objects in VR content. Josupeit et al. (2023) placed fixed objects (virtual nose) on VR content to reduce VR sickness and confirmed their effectiveness from experimental results [10]. Won and Kim (2021) proposed visual guides of various sizes and positions to reduce VR sickness and identified the optimal visual guide from experimental results [11]. Duh et al. (2004) applied grid pattern independent visual background (IVB) to the background of the content and confirmed from experimental results that this approach reduced VR sickness [12].
These software approaches are mainly provided by manipulating the content when the user experiences VR sickness or by applying VR sickness reduction methods to the content from the beginning. However, these approaches have the following limitations: (1) they are applied after the user has already experienced VR sickness and (2) they may compromise the immersion of the content.
Therefore, in this paper, we propose a method to train users to adapt to VR sickness in advance (hereafter, VR sickness reduction training).
2. Materials and Methods
This section describes the proposed VR sickness reduction training process (including VR training content) and experiment.
2.1. Proposed VR Sickness Reduction Training Method
The VR sickness reduction training is designed based on elements that are derived from features related to motion sickness exposure and adaptation [13,14,15,16,17]. The features used in this design are shown in Table 1.
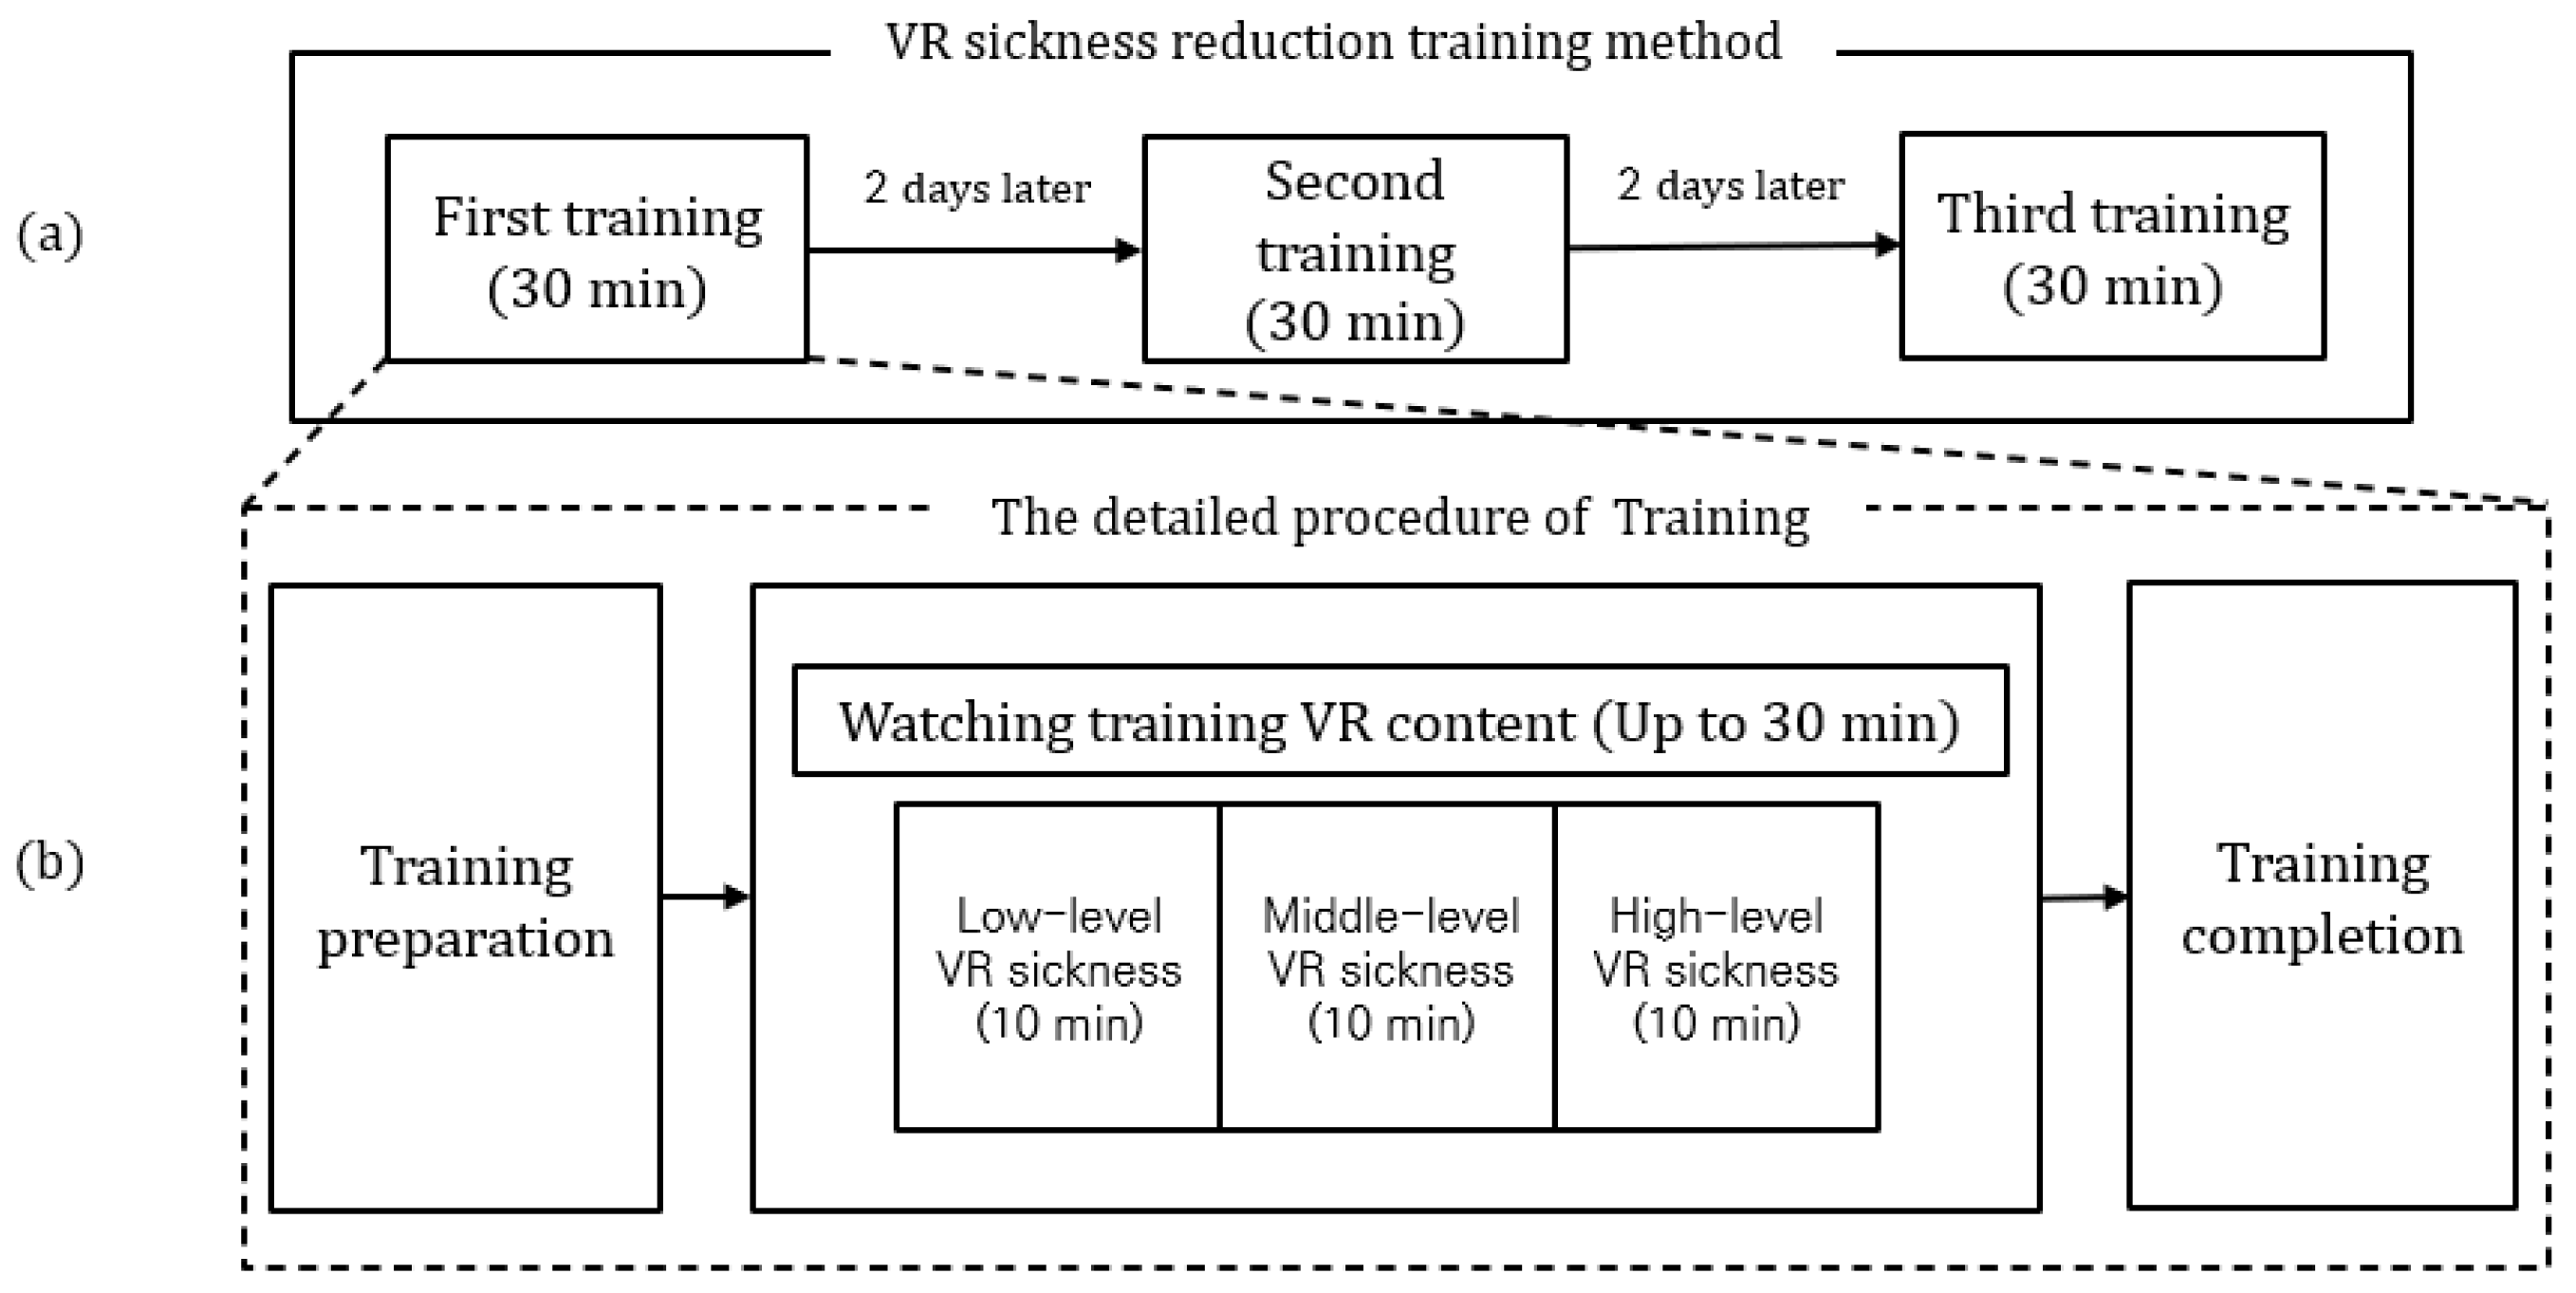
Based on the these features, the design of the VR sickness reduction training is as follows: (1) the entire training is structured to be repeated three times at 48 h intervals (Features A and B), (2) to avoid adaptation only to specific stimulus conditions, various stimulus conditions are provided (Feature C), (3) individuals are gradually exposed to VR sickness from low to high levels (Feature D), and (4) following the safety guidelines presented by the Ministry of Science and ICT in 2019 [18], the duration of VR content viewing for a single training session should be less than 30 min.
Therefore, the final VR sickness reduction training design consists of three sessions (training), as shown in Figure 1a. The detailed procedure for each training stage is shown in Figure 1b.
Next, we developed VR content for the VR sickness reduction training (hereafter, VR training content). The VR training content is developed to induce VR sickness in users, incorporating the VR sickness factors outlined in Table 2.
The VR training content is developed by separating the VR sickness-inducing levels (low, middle, high) for gradual exposure to VR sickness. The detailed values with respect to the level of sickness induction were set with reference to the IEEE standard document [21] and previous studies [6,19,20,21,22,23,24,25], while the others that were not specified were determined heuristically. The factors inducing VR sickness and their corresponding levels are given in Table 3.
At a low level, the VR training content is designed to induce low-level VR sickness by moving the camera at a constant velocity and limiting the number of objects within the user’s FoV to 40. The user’s gaze is directed through a visual guide [11], and the FoV is limited to 90 degrees.
At the middle level, in comparison to the low level, the camera speed increases, and the number of objects within the user’s FoV increases by a factor of 1.5. Additionally, from the middle level onwards, the objects are no longer limited to stationary ones but also include moving objects. The visual guide is removed, and the FoV, which was initially limited to 90 degrees, is expanded to the standard FoV.
At a high level, the camera moves with high acceleration, and the number of objects included in a scene increases by a factor of 1.5 compared to the middle level. Additionally, both the number and speed of moving objects increase, and the movement latency becomes longer than that at the middle level. Finally, filters are applied to the content to artificially degrade the quality of the content, thereby inducing the highest intensity of VR sickness in users.
The VR training content is developed in a 3D virtual environment using the Unity engine and lasts a total of 30 min. The camera within the content moves repeatedly along a predetermined path and the camera rotation changes based on the user’s head rotation. At intervals of 10 min, the VR sickness levels automatically shift from low to middle to high. The developed VR training content is shown in Figure 2.
2.2. Experiment
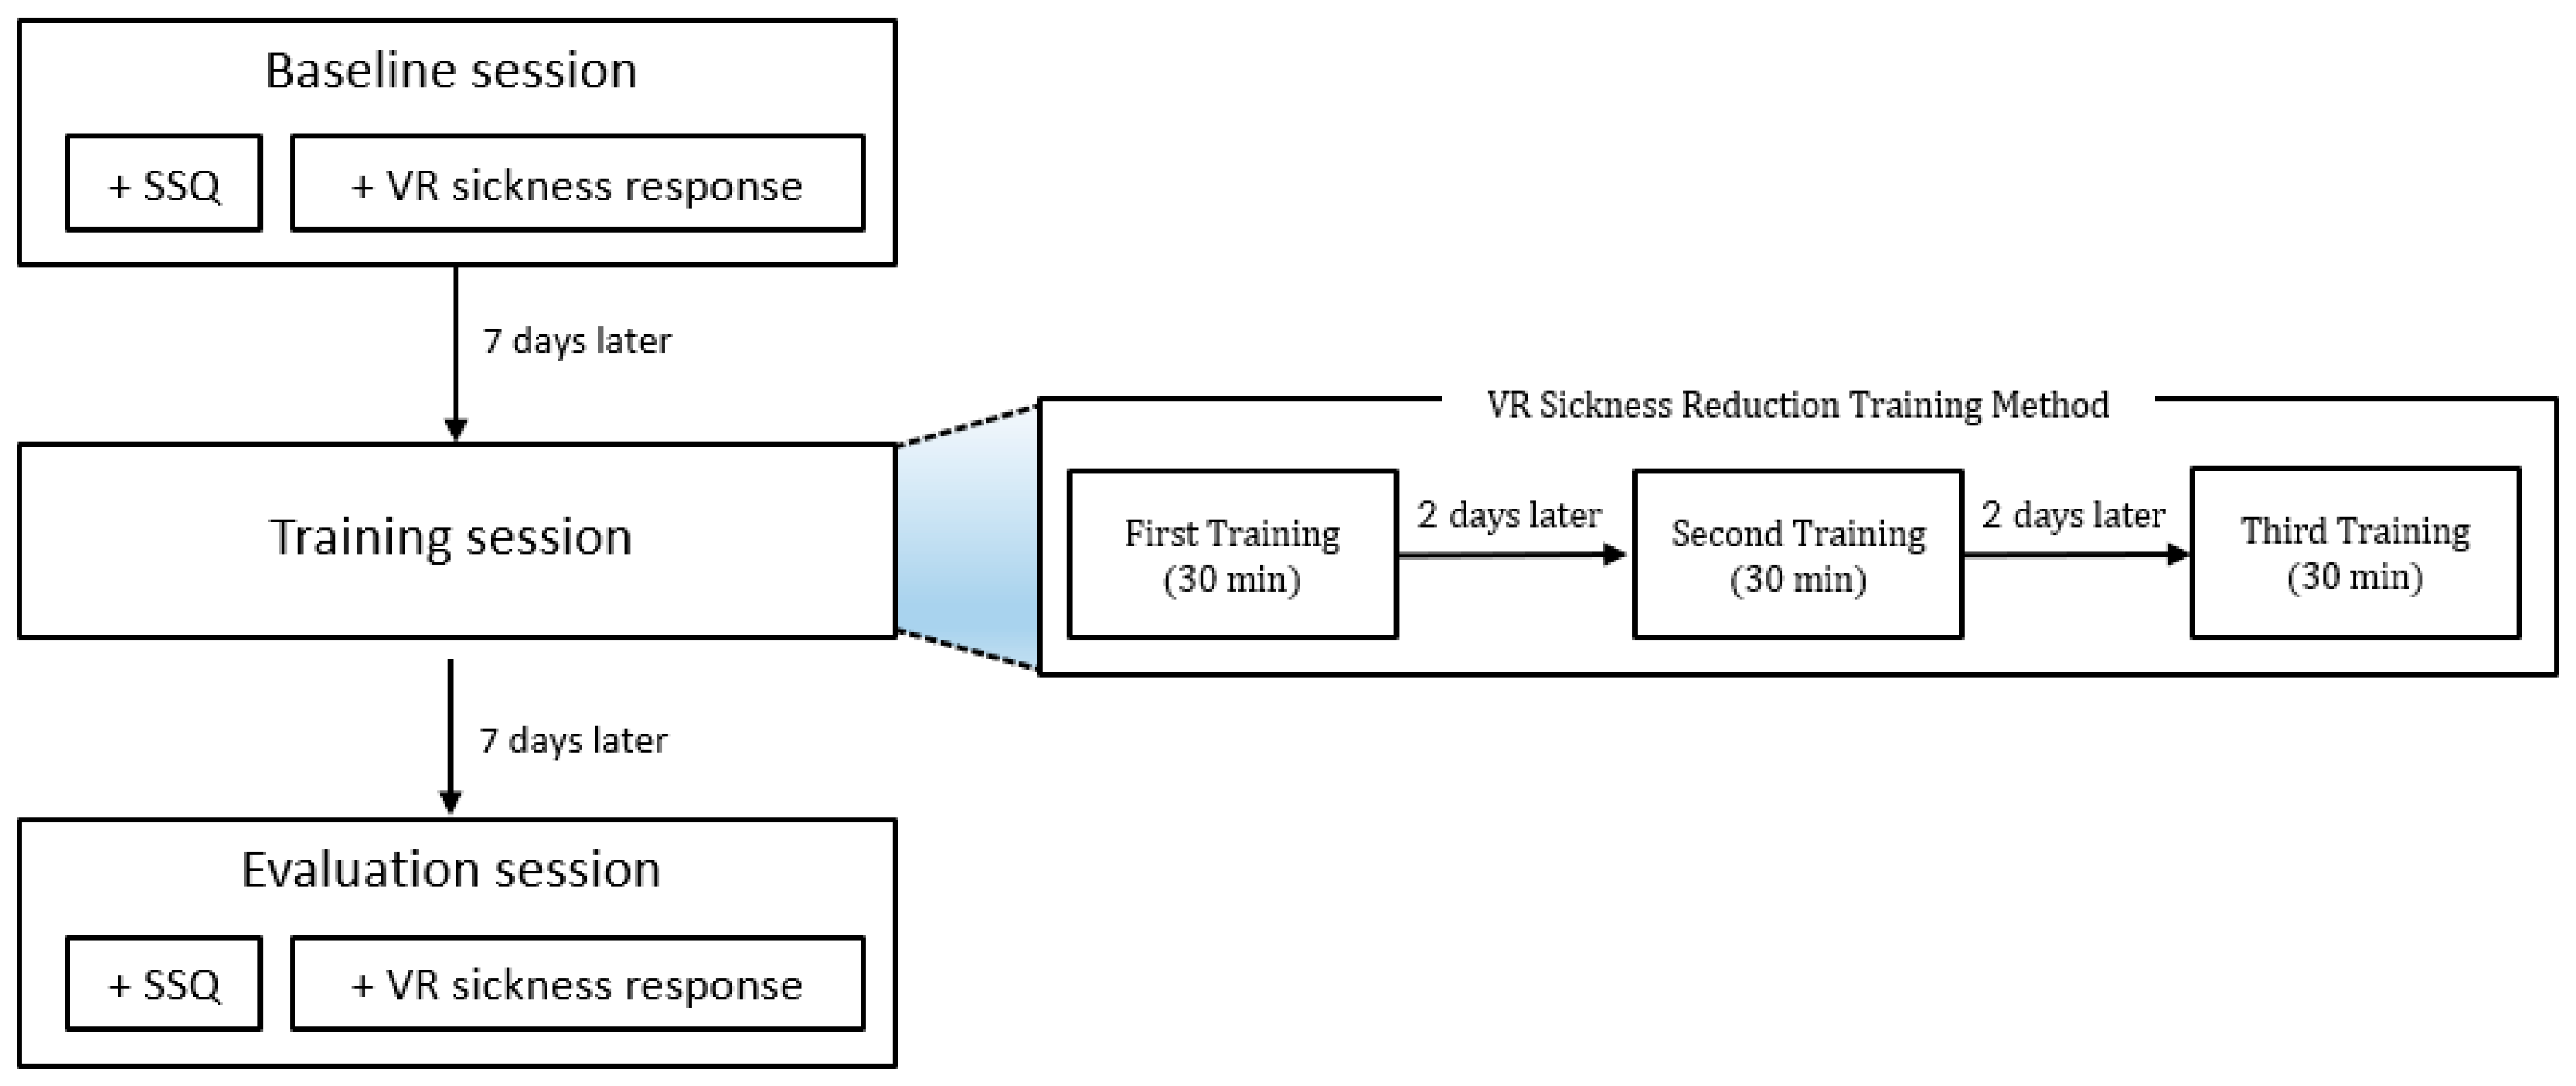
The experiment to examine the feasibility of the proposed VR sickness reduction training was conducted in three steps as follows: (1) baseline session, (2) training session, and (3) evaluation session. Each session was conducted with a one-week interval to minimize mutual influence, as depicted in Figure 3. The baseline session was a pre-experiment stage conducted before the proposed training, measuring the subjects’ usual degree of VR sickness. In the training session, the VR sickness reduction training was performed. The evaluation session was a post-experiment stage conducted after the proposed training, measuring the subjects’ changed degree of VR sickness (the baseline and evaluation session are the experimental ones to measure the user’s VR sickness, and the training one is a session where a VR sickness reduction training is conducted in the proposed manner). The effectiveness of the VR sickness reduction training and the VR training content was evaluated through the difference in VR sickness levels between the baseline session and the evaluation session.
In both the baseline and evaluation sessions, the subjects’ levels of VR sickness were measured using the SSQ and VR sickness responses. The SSQ is a widely used questionnaire for evaluating VR sickness and consists of 16 symptoms with responses ranging from 0 to 3 points. The SSQ questionnaire used in this experiment is shown in Figure 4, and the method for calculating the SSQ scores is shown in Table 4. The SSQ scores were measured before and after viewing the VR content. The difference between these two SSQ scores was recorded as the level of VR sickness induced by viewing the VR content. Additionally, the difference in the SSQ results between the baseline and evaluation sessions was recorded as the change in the level of VR sickness after the VR sickness reduction training.
The VR sickness response is defined as the number of times subjects click a controller button when they experience the symptoms of VR sickness during the experiment. A higher value means that the subject experienced VR sickness more frequently. The procedure for calculating the VR sickness response is shown in Figure 5.
Next, we developed experimental VR content to be used in the baseline and evaluation sessions. To ensure uniformity in the experiment, the same VR experiment content was used in both sessions. Therefore, upon reviewing recent HMD-based VR applications, it was observed that they are primarily offered in the form of a screen within a virtual space for activities such as content viewing or document work. Accordingly, the VR experiment content was also developed as a screen type, and the content played on the screen was chosen as a swarm game content, which includes enough factors (such as sudden camera rotations and fast movements) to induce VR sickness. The VR experiment content, identical to the VR training content, was played for 30 min and was developed using Unity. The experimental environment is shown in Figure 6: the VR experiment content and the HTC Vive pro [26] are used as shown in Figure 6a,b, respectively.
3. Results
The experiment was conducted with a total of 15 participants recruited through the IRB of Korea University of Technology and Education (Approval No: 21052602). Two of these subjects were unable to participate in the post-experiment stage for health reasons and were excluded from the analysis. The experiment proceeded only after providing the subjects with a thorough explanation of the experiment and obtaining their consent, and it was conducted after the subjects were informed that they could stop the experiment at any time. As a result, a total of 11 subjects completed all the experiments, and 2 subjects discontinued watching the VR content due to severe VR sickness during the pre- and post-experiment stages. Finally, data from 13 subjects (10 males and 3 females, average age = 23) were used in the analysis. The effectiveness of the proposed VR sickness adaptation training was examined by analyzing the two scores (SSQ and VR sickness response scores) measured at the pre- and post-experiment stages (baseline and evaluation session). Additionally, the viewing times were compared for the two subjects who did not complete both the pre- and post-experiment stages.
3.1. SSQ
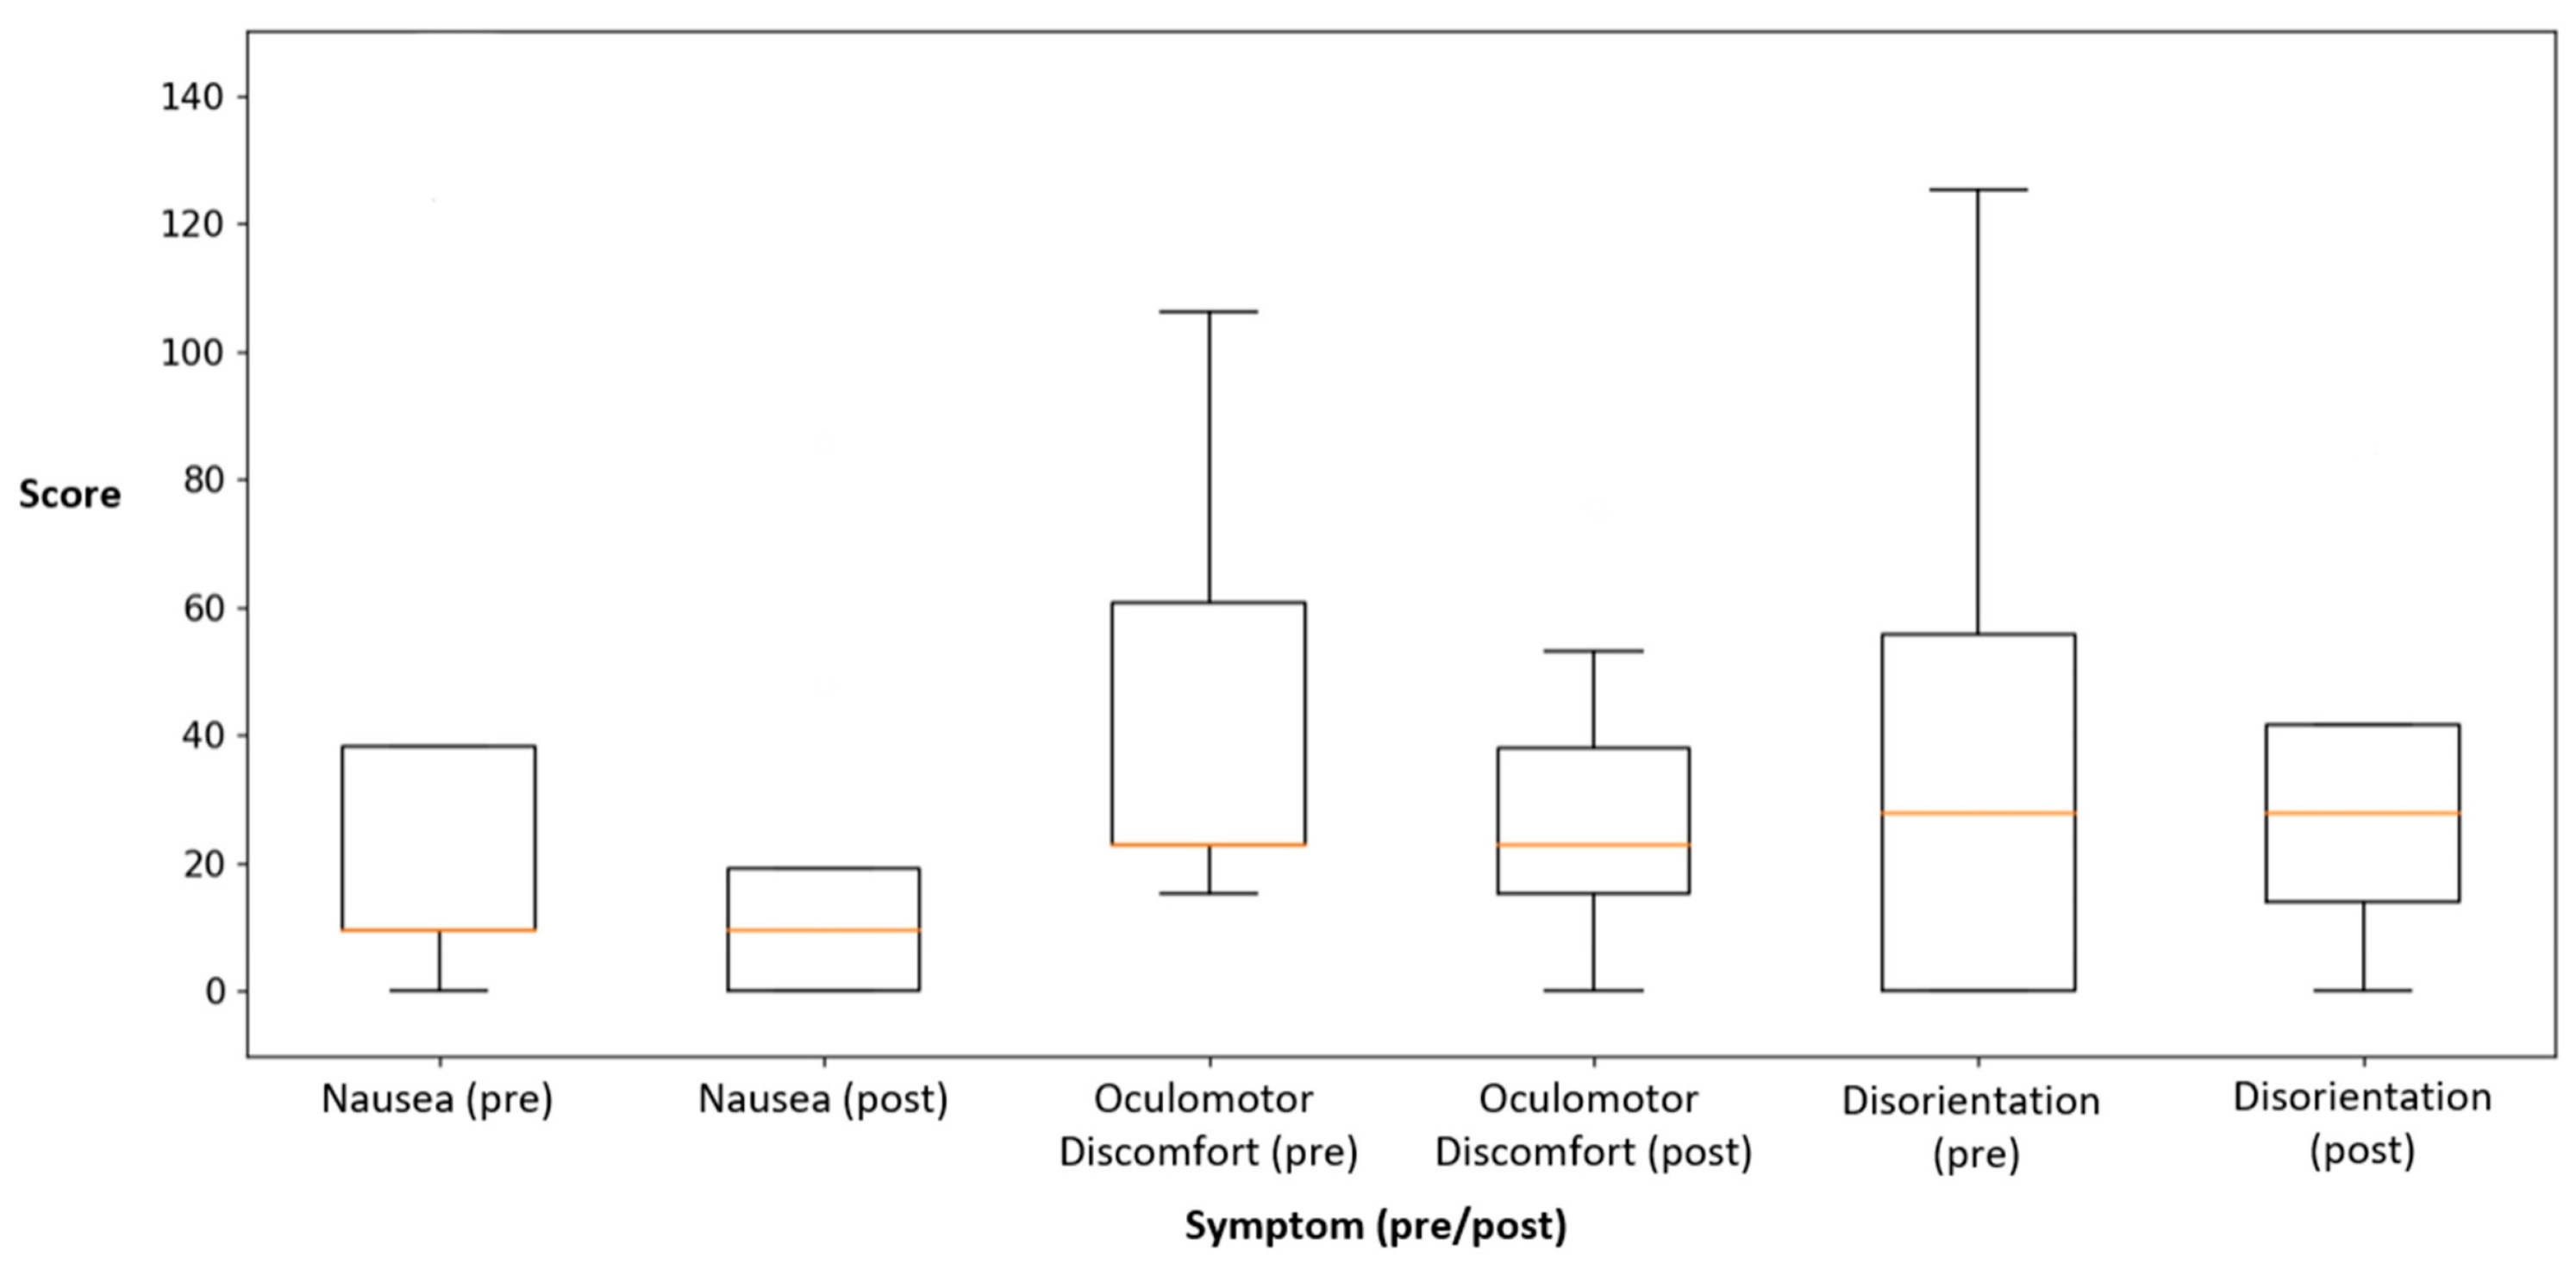
We performed a normality test using the Shapiro–Wilk test because the sample size was less than 30. As a result, it was confirmed that none of the data groups followed a normal distribution. Therefore, the Wilcoxon signed-rank test was used in the analysis to compare the mean of the SSQ scores between the pre- and post-experiment sessions. At this time, the confidence interval was set at 95%, and a p-value of less than 0.05 was considered significant. As a result of the comparison, the nausea score significantly decreased by 47.83% in the post-experiment stage compared to the pre-experiment stage (p = 0.04). The oculomotor discomfort score also significantly decreased by 34.29% in the post-experiment stage compared to the pre-experiment stage (p = 0.02). The disorientation score decreased by 19.98% in the post-experiment stage, but this difference was not statistically significant (p = 0.47). The total SSQ scores also decreased by 32.40% in the post-experiment stage, but this difference was not statistically significant (p = 0.12). The SSQ scores measured in the experiment are shown in Table 5. Visualization of the SSQ details (Figure 7) showed that the subjects’ nausea and oculomotor discomfort decreased overall in the post-experiment stage.
The scores for all four categories of the SSQ decreased by at least 20%, with the score for nausea showing the greatest reduction at 47.93%. However, only nausea and oculomotor discomfort showed statistically significant differences. Therefore, to further analyze the non-significant disorientation and total score, the subjects were divided into increase and decrease groups, and trends were identified by comparing the pre- and post-experiment session results for each subject (Table 6).
Of the 13 subjects, 4 subjects remained unchanged, 5 subjects increased their scores, and 4 subjects decreased their scores. The decrease group demonstrated a change of 69.6, while the increase group demonstrated a change of 30.06, with a larger change observed in the decrease group. In addition, the pre-experiment disorientation score was 93.96 for the decrease group and 41.76 for the increase group. This suggests that the greater the initial disorientation, the greater the reduction in VR sickness. In the total score, one subject remained unchanged, four subjects increased their scores, and eight subjects decreased. The score changes in the decrease and increase groups were 285.24 and 84.01, respectively, indicating a more significant change in the decrease group. The pre-experiment total scores were 646.60 for the decrease group and 165.70 for the increase group. The above analysis results confirmed that the subjects who felt more symptoms of VR sickness could experience a greater reduction in the level of VR sickness by the proposed VR sickness reduction training.
3.2. VR Sickness Response
To confirm the normality of the VR sickness response, the Shapiro–Wilk test was conducted. The test results confirmed non-normality. Therefore, the Wilcoxon signed-rank test was used in the analysis to compare the mean VR sickness response scores pre- and post-experiment. Considering the two subjects who did not complete the pre- and post-experiment sessions, the VR sickness response scores were used as the input per minute. As a result of the comparison, the VR sickness response decreased by 31.03% in the post-experiment stage compared to the pre-experiment stage, but this difference was not statistically significant. Table 7 shows the pre-experiment and post-experiment VR sickness response results, respectively. Additionally, the subjects were divided into an increase group and a decrease group to analyze trends. Out of the total of 13 subjects, 2 maintained their VR sickness responses, 7 showed an increase, and 4 showed a decrease. The pre-experiment VR sickness response averaged 1.34 times for the decrease group and 0.31 times for the increase group. The mean change from the pre- to the post-experiment stage of the decrease group was 0.76 times, while that of the increase group was 0.11 times. The visualization of VR sickness responses divided into the increase and decrease groups (Figure 8) revealed that the increase group showed little difference pre- and post-experiment, while the decrease group demonstrated a large reduction in VR sickness response through the training. This means that subjects who frequently experienced VR sickness experienced less VR sickness through the proposed training.
We compared the viewing times of the experimental content between the pre- and post-experiment sessions for the two subjects who were unable to watch the content until the end due to VR sickness. In the pre-experiment session, the first subject watched for 16 min and the second subject watched for 10 min. In the post-experiment session, both subjects watched the VR content for 25 min. The VR content viewing time of the first subject increased by 9 min, and the viewing time of the second subject increased by 15 min. The difference in viewing times for the subjects who dropped out are shown in Table 8.
4. Conclusions
In this paper, a new approach for reducing VR sickness, a user training method, was proposed. The proposed method trains users for VR sickness in advance, unlike existing methods that apply reduction methods to VR content. To achieve this, the VR sickness reduction training and VR training content were developed by analyzing existing studies related to VR sickness and motion sickness. The VR sickness reduction training is conducted three times at 48 h intervals, and the VR training content was developed with separate levels to provide users with gradual VR sickness stimulation. In addition, a total of seven VR sickness factors (camera movement speed, scene complexity, fixed objects, moving objects, FoV, movement latency, screen resolution) were included in the VR training content to enable users to adapt to various stimuli.
An experiment was conducted with 13 subjects to examine the feasibility of the proposed training. The subjects’ VR sickness was measured using an SSQ questionnaire and VR sickness response. Out of the 13 subjects, 2 subjects could not complete both the pre- and post-experiment sessions due to VR sickness. Therefore, data from these two subjects were included up to the point where they stopped.
As a result, we confirmed a decrease of at least 20% in all four categories of the SSQ in the post-experiment session. The nausea score (47.83%, p = 0.04) and oculomotor discomfort score (34.29%, p = 0.02) significantly decreased, while the disorientation score (19.98%, p = 0.47) and total score (32.40%, p = 0.12) did not show significance.
The proposed training content provided a view based on the user’s head movements, whereas the experimental one included intentional camera rotations to sufficiently induce VR sickness in users. Therefore, it is considered that the disorientation score was not significant because the subjects were not trained for unexpected changes in view due to intentional camera rotation. Additionally, to further analyze the two non-significant categories (disorientation and total score), we compared the pre- and post-experiment results for each subject individually. Through this, it was confirmed that the subjects with higher disorientation and total scores in the pre-experiment demonstrated a greater reduction in VR sickness following the proposed training.
The VR sickness response decreased by 31.03% from the pre- to the post-experiment stages; however, this was not statistically significant. Therefore, we divided the subjects into decrease and increase groups to analyze the trends. The pre-experiment VR sickness response in the decrease group was 1.03 times higher than that in the increase group. As a result of the post-experiment session, it was confirmed that the decrease group had decrease in VR sickness response by an average of 0.76 times and the increase group increased by an average of 0.11 times. This means that the subjects who frequently experienced VR sickness experienced less VR sickness through the proposed training.
Furthermore, we compared the viewing time of the two subjects who discontinued the pre- and post-experiment stages and confirmed that both subjects increased their viewing time of VR content after the proposed training (Δp1 = 9 min, Δp2 = 15 min). From these experimental results, we confirmed that VR sickness reduction training can reduce VR sickness when users watch VR content on HMDs.
The contributions of this study are summarized as follows. First, while existing methods for reducing VR sickness have focused on content modification or hardware improvements, this study proposed a new approach that trains users to adapt to VR sickness. Second, characteristics related to motion sickness (including adaptation and exposure) were analyzed, which can thus be used as a guideline for the design of new training models. Finally, from the experimental results, it was confirmed that the proposed training reduced the VR sickness, thereby verifying the potential of VR sickness reduction training.
However, this study has several limitations, even though it provides a significant finding that the proposed method (VR sickness reduction training) can reduce VR sickness in users. First, the number of subjects was 13, which thus has a limitation for generalizing our results. Second, individual differences among the subjects (such as sensitivity, physiological and psychological characteristics, and previous experiences) were not considered. Therefore, our future works include increasing the number of subjects and analyzing the individual differences among subjects in various manners.
Author Contributions
Conceptualization, Y.S.K.; methodology, Y.S.K. and J.-h.W.; software, J.-h.W.; validation, Y.S.K. and H.C.N.; formal analysis, J.-h.W. and H.C.N.; investigation, Y.S.K. and J.-h.W.; resources, J.-h.W.; data curation, J.-h.W.; writing—original draft preparation, J.-h.W. and H.C.N.; writing—review and editing, Y.S.K.; visualization, H.C.N.; supervision, Y.S.K.; project administration, Y.S.K.; funding acquisition, Y.S.K. All authors have read and agreed to the published version of the manuscript.
Funding
This research received no external funding.
Institutional Review Board Statement
The study was conducted according to the guidelines of the Declaration of Helsinki, and approved by the Institutional Review Board of Korea University of Technology and Education (approval 21052602: 26 May 2021).
Informed Consent Statement
Informed consent was obtained from all subjects involved in the study.
Data Availability Statement
The data presented in this study are available on request from the corresponding author. The data are not publicly available due to the significant investment of time and money involved in the data acquisition.
Acknowledgments
This work was supported by the National Research Foundation of Korea (NRF) grant funded by the Korea government (MSIT) (No. 2020R1F1A1076114). Also, this work was partially supported by the National Research Foundation of Korea (NRF) grant funded by the Korea government (MSIT) (No. 2023R1A2C2002838).
Conflicts of Interest
The authors declare no conflicts of interest.
References
- LaViola, J.J.; Joseph, J. A discussion of cybersickness in virtual environments. ACM Sigchi Bull. 2000, 32, 47–56. [Google Scholar] [CrossRef]
- Riccio, G.E.; Stoffregen, T.A. An ecological theory of motion sickness and postural instability. Ecol. Psychol. 1991, 3, 195–240. [Google Scholar] [CrossRef]
- Kennedy, R.S.; Lane, N.E.; Berbaum, K.S.; Lilienthal, M.G. Simulator sickness questionnaire: An enhanced method for quantifying simulator sickness. Int. J. Aviat. Psychol. 1993, 3, 203–220. [Google Scholar] [CrossRef]
- Golding, J.F. Motion sickness susceptibility questionnaire revised and its relationship to other forms of sickness. Brain Res. Bull. 1998, 47, 507–516. [Google Scholar] [CrossRef] [PubMed]
- Stanney, K.M.; Hale, K.S.; Nahmens, I.; Kennedy, R.S. What to expect from immersive virtual environment exposure: Influences of gender, body mass index, and past experience. Hum. Factors 2003, 45, 504–520. [Google Scholar] [CrossRef] [PubMed]
- Singla, A.; Fremerey, S.; Robitza, W.; Raake, A. Measuring and comparing QoE and 46 simulator sickness of omnidirectional videos in different head mounted displays. In Proceedings of the 2017 Ninth International Conference on Quality of Multimedia Experience, Erfurt, Germany, 31 May–2 June 2017; pp. 1–6. [Google Scholar]
- Groth, C.; Tauscher, J.P.; Heesen, N.; Castillo, S.; Magnor, M. Visual techniques to reduce cybersickness in virtual reality. In Proceedings of the 2021 IEEE Conference on Virtual Reality and 3D User Interfaces Abstracts and Workshops, Lisbon, Portugal, 27 March–1 April 2021; pp. 486–487. [Google Scholar] [CrossRef]
- Nie, G.Y.; Duh, H.B.L.; Liu, Y.; Wang, Y. Analysis on mitigation of visually induced motion sickness by applying dynamical blurring on a user’s retina. IEEE Trans. Vis. Comput. Graph. 2019, 26, 2535–2545. [Google Scholar] [CrossRef] [PubMed]
- Jang, W.J.; Bae, J.H.; You, H.B.; Bak, S.H. Content Design Research to Improve Motion Sickness in Extended Reality (XR). Digit. Contents Soc. 2024, 25, 49–55. [Google Scholar] [CrossRef]
- Josupeit, J. Does pinocchio get cybersickness?-the mitigating effect of a virtual nose on cybersickness. In Proceedings of the AHFE International Conference, San Francisco, CA, USA, 20–24 July 2023; pp. 99–109. [Google Scholar] [CrossRef]
- Won, J.H.; Kim, Y.S. A study on visually induced VR reduction method for virtual reality sickness. Appl. Sci. 2021, 11, 6339. [Google Scholar] [CrossRef]
- Duh, H.B.L.; Parker, D.E.; Furness, T.A. An independent visual background reduced simulator sickness in a driving simulator. Presence Teleoperators Virtual Environ. 2004, 13, 578–588. [Google Scholar] [CrossRef]
- McIntosh, I.B. Motion sickness--questions and answers. J. Travel Med. 1998, 5, 89–91. [Google Scholar] [CrossRef] [PubMed]
- Ruckenstein, M.J.; Harrison, R.V. Motion sickness: Helping patients tolerate the ups and downs. Postgrad. Med. 1991, 89, 139–144. [Google Scholar] [CrossRef] [PubMed]
- Schmäl, F. Neuronal mechanisms and the treatment of motion sickness. Pharmacology 2013, 91, 229–241. [Google Scholar] [CrossRef] [PubMed]
- Hu, S.; Stern, R.M. The retention of adaptation to motion sickness eliciting stimulation. Aviat. Space Environ. Med. 1999, 70, 766–768. [Google Scholar] [PubMed]
- Stern, R.M.; Hu, S.Q.; Vasey, M.W.; Koch, K.L. Adaptation to vection-induced symptoms of motion sickness. Aviat. Space Environ. Med. 1989, 60, 566–572. [Google Scholar] [PubMed]
- Ministry of Science and ICT. VR·AR Device Production and Use Guidelines. Available online: https://www.nipa.kr/home/2-7-1-1/8150 (accessed on 27 July 2023).
- Chen, W.; Chen, J.Z.; So, R.H.Y. Visually induced motion sickness: Effects of translational visual motion along different axes. In Proceedings of the International Conference on Ergonomics & Human Factors, Lincolnshire, UK, 12–14 April 2011; pp. 281–287. [Google Scholar]
- Lubeck, A.J.; Bos, J.E.; Stins, J.F. Motion in images is essential to cause motion sickness symptoms, but not to increase postural sway. Displays 2015, 38, 55–61. [Google Scholar] [CrossRef]
- IEEE Std 3079-2020; IEEE Standard for Head-Mounted Display (HMD)-Based Virtual Reality (VR) Sickness Reduction Technology. IEEE: Piscataway, NJ, USA, 2021. [CrossRef]
- Hanslo, M.; Hanslo, R. Lowering the Effects of Virtual Reality Cybersickness: A Systematic Review. In Proceedings of the EMERGING 2023: The Fifteenth International Conference on Emerging Networks and Systems Intelligence, Porto, Portugal, 25–29 September 2023. [Google Scholar]
- DiZio, P.; Lackner, J.R. Circumventing side effects of immersive virtual environments. Adv. Hum. Factors/Ergon. 1997, 21, 893–896. [Google Scholar]
- Draper, M.H.; Viirre, E.S.; Furness, T.A.; Gawron, V.J. Effects of image scale and system time delay on simulator sickness within head-coupled virtual environments. Hum. Factors 2001, 43, 129–146. [Google Scholar] [CrossRef] [PubMed]
- Palmisano, S.; Allison, R.S.; Davies, R.G.; Wagner, P.; Kim, J. Effects of Constant and Time-Varying Display Lag on DVP and Cybersickness When Making Head-Movements in Virtual Reality. Int. J. Hum.–Comput. Interact. 2023, 1–18. [Google Scholar] [CrossRef]
- HTC Vive Pro Eye. Available online: https://www.vive.com/kr/product/vive-pro-eye/specs/ (accessed on 3 June 2023).
Figure 1.
The proposed VR sickness reduction training method: (a) The proposed method is composed of three training sessions; (b) The detailed procedure of each training session.
Figure 1.
The proposed VR sickness reduction training method: (a) The proposed method is composed of three training sessions; (b) The detailed procedure of each training session.

Figure 2.
The VR content developed for training: (a) low level; (b) middle level; (c) high level.

Figure 3.
Experimental process to verify the effectiveness of VR sickness reduction training.

Figure 4.
Simulator sickness questionnaire (SSQ) used in the experiment [3].
Figure 4.
Simulator sickness questionnaire (SSQ) used in the experiment [3].

Figure 5.
The procedure for the VR sickness response calculation.

Figure 6.
Experiment environment: (a) VR experiment content; (b) The HTC Vive pro as a device.

Figure 7.
The pre-experiment and post-experiment results for each category of the SSQ (outliers are excluded from this figure).
Figure 7.
The pre-experiment and post-experiment results for each category of the SSQ (outliers are excluded from this figure).

Figure 8.
The analysis results with respect to VR sickness responses between two groups (increase and decrease groups).
Figure 8.
The analysis results with respect to VR sickness responses between two groups (increase and decrease groups).


Table 1.
Features used for the design of VR sickness reduction training.
| No. | Feature |
|---|---|
| A | Increasing the exposure time in a single session increases simulator sickness, and frequent sickness exposure decreases simulator sickness levels. |
| B | Motion sickness decreases with three repetitions at 48 h intervals for a specific stimulus. |
| C | Motion sickness is influenced by specific stimulus conditions, and the adaptation effect to motion sickness decreases when deviating from the adapted stimulus conditions. |
| D | Gradual stimulation, rather than a single abrupt stimulus, is more effective for adapting to motion sickness. |
Table 2.
VR sickness factors included in the VR training content.
| Factor | Description |
|---|---|
| Camera movement speed [19,20] | VR sickness increases when the camera movement within the content rapidly changes. |
| Scene complexity [21] | VR sickness increases when the number of objects within the user’s FoV increases. |
| Fixed objects [21] | VR sickness decreases when objects such as fixed frames are present within the user’s FoV |
| Moving objects [20,21] | VR sickness increases when there are moving objects in the user’s FoV. |
| FoV [22,23,24] | VR sickness decreases when the content FoV is smaller. |
| Movement latency [22,23,25] | VR sickness increases when there is a delay in when the user’s movements are reflected within the content. |
| Screen resolution [6] | VR sickness increases when the screen resolution is lower. |
Table 3.
The factors inducing VR sickness and their corresponding levels.
| VR Sickness- Inducing Factor | VR Sickness-Inducing Levels | ||
|---|---|---|---|
| Low | Middle | High | |
| Camera movement speed | Constant velocity motion | Add acceleration | Add acceleration |
| Scene complexity | 40 objects in the FoV | 1.5 × more than low level | 1.5 × more than middle level |
| Fixed objects | True | False | False |
| Moving objects | Stationary object | Add 3 moving objects to the FoV | 1.5 × more than middle level |
| FoV | 90 degree limit | No limit | No limit |
| Movement latency | None | Add 0.5 s | Add 1.0 s |
| Screen resolution | Default resolution | Default resolution | Low resolution |
Table 4.
Weights for SSQ scores.
| SSQ Symptoms | Weight | ||
|---|---|---|---|
| Nausea | Oculomotor Discomfort | Disorientation | |
| General Discomfort | 1 | 1 | |
| Fatigue | 1 | ||
| Headache | 1 | ||
| Eyestrain | 1 | ||
| Difficulty Focusing | 1 | 1 | |
| Salivation Increasing | 1 | ||
| Sweating | 1 | ||
| Nausea | 1 | 1 | |
| Difficulty Concentrating | 1 | 1 | |
| Fullness of the Head | 1 | ||
| Blurred Vision | 1 | 1 | |
| Dizziness with Eyes Open | 1 | ||
| Dizziness with Eyes Closed | 1 | ||
| Vertigo | 1 | ||
| Stomach Awareness | 1 | ||
| Burping | 1 | ||
| (1) | (2) | (3) | |
| N = (1) × 9.54 | O = (2) × 7.58 | D = (3) × 13.92 | |
| Total Score (TS) = ((1) + (2) + (3)) × 3.74 | |||
Table 5.
The pre-experiment and post-experiment score results for each category of the SSQ.
| Subject | SSQ | |||||||
|---|---|---|---|---|---|---|---|---|
| Nausea (N) | Oculomotor Discomfort (O) | Disorientation (D) | Total Score (T) | |||||
| Pre- Experiment | Post- Experiment | Pre- Experiment | Post- Experiment | Pre- Experiment | Post- Experiment | Pre- Experiment | Post- Experiment | |
| Score | Score | Score | Score | Score | Score | Score | Score | |
| S1 | 124.02 | 85.86 | 83.38 | 75.80 | 125.28 | 167.04 | 1244.22 | 1229.33 |
| S2 | 9.54 | 47.70 | 22.74 | 22.74 | 27.84 | 27.84 | 224.84 | 367.56 |
| S3 | 9.54 | 0.00 | 22.74 | 22.74 | 0.00 | 41.76 | 120.72 | 241.23 |
| S4 | 38.16 | 19.08 | 60.64 | 53.06 | 41.76 | 0.00 | 525.69 | 269.80 |
| S5 | 19.08 | 0.00 | 22.74 | 37.90 | 27.84 | 41.76 | 260.52 | 297.92 |
| S6 | 0.00 | 0.00 | 22.74 | 22.74 | 13.92 | 13.92 | 137.10 | 137.10 |
| S7 | 38.16 | 19.08 | 22.74 | 30.32 | 41.76 | 27.84 | 383.94 | 288.87 |
| S8 | 0.00 | 0.00 | 15.16 | 0.00 | 0.00 | 27.84 | 56.69 | 104.12 |
| S9 | 9.54 | 0.00 | 15.16 | 0.00 | 0.00 | 0.00 | 92.37 | 0.00 |
| S10 | 0.00 | 9.54 | 15.16 | 0.00 | 0.00 | 0.00 | 56.69 | 35.67 |
| S11 | 9.54 | 9.54 | 53.06 | 15.16 | 69.60 | 27.84 | 494.42 | 196.49 |
| S12 | 38.16 | 19.08 | 68.22 | 37.90 | 55.68 | 83.52 | 606.10 | 525.47 |
| S13 | 143.10 | 19.08 | 106.12 | 30.32 | 222.72 | 41.76 | 1765.05 | 340.93 |
| Average | 33.76 | 17.61 | 40.82 | 26.82 | 48.18 | 38.55 | 459.10 | 310.35 |
| Rate (p-Value) | −47.83% (0.04 *) | −34.29% (0.02 *) | −19.98% (0.47) | −32.40% (0.12) | ||||
* p < 0.05.
Table 6.
The results of the increase or decrease by subjects: disorientation and total score.
| Subject | Disorientation (D) | Total Score (T) | ||||
|---|---|---|---|---|---|---|
| Pre- Experiment | Post- Experiment | Increase/ Decrease | Pre- Experiment | Post- Experiment | Increase/ Decrease | |
| S1 | 125.28 | 167.04 | Increase | 1244.22 | 1229.33 | Decrease |
| S2 | 27.84 | 27.84 | Maintain | 224.84 | 367.56 | Increase |
| S3 | 0.00 | 41.76 | Increase | 120.72 | 241.23 | Increase |
| S4 | 41.76 | 0.00 | Decrease | 525.69 | 269.80 | Decrease |
| S5 | 27.84 | 41.76 | Increase | 260.52 | 297.92 | Increase |
| S6 | 13.92 | 13.92 | Maintain | 137.10 | 137.10 | Maintain |
| S7 | 41.76 | 27.84 | Decrease | 383.94 | 288.87 | Decrease |
| S8 | 0.00 | 27.84 | Increase | 56.69 | 104.12 | Increase |
| S9 | 0.00 | 0.00 | Maintain | 92.37 | 0.00 | Decrease |
| S10 | 0.00 | 0.00 | Maintain | 56.69 | 35.67 | Decrease |
| S11 | 69.60 | 27.84 | Decrease | 494.42 | 196.49 | Decrease |
| S12 | 55.68 | 83.52 | Increase | 606.10 | 525.47 | Decrease |
| S13 | 222.72 | 41.76 | Decrease | 1765.05 | 340.93 | Decrease |
Table 7.
Pre-experiment and post-experiment VR sickness response results.
| Subject | VR Sickness Response | ||
|---|---|---|---|
| Pre-Experiment | Post-Experiment | Increase and Decrease | |
| S1 | 0.62 | 0.56 | Decrease |
| S2 | 0.00 | 0.13 | Increase |
| S3 | 0.03 | 0.07 | Increase |
| S4 | 0.90 | 1.23 | Increase |
| S5 | 0.37 | 0.43 | Increase |
| S6 | 0.00 | 0.00 | Maintain |
| S7 | 1.50 | 0.88 | Decrease |
| S8 | 2.47 | 0.37 | Decrease |
| S9 | 0.00 | 0.00 | Maintain |
| S10 | 0.00 | 0.03 | Increase |
| S11 | 0.13 | 0.17 | Increase |
| S12 | 0.77 | 0.87 | Increase |
| S13 | 0.77 | 0.50 | Decrease |
| Average | 0.58 | 0.40 | - |
| Rate (p-Value) | −31.03% (0.48) | - | |
Table 8.
The differences in viewing time for the subjects.
| Subject | VR Content Viewing Time | ||
|---|---|---|---|
| Pre-Experiment | Post-Experiment | Increase Time | |
| P1 | 16 min | 25 min | 9 min |
| P2 | 10 min | 25 min | 15 min |
Disclaimer/Publisher’s Note: The statements, opinions and data contained in all publications are solely those of the individual author(s) and contributor(s) and not of MDPI and/or the editor(s). MDPI and/or the editor(s) disclaim responsibility for any injury to people or property resulting from any ideas, methods, instructions or products referred to in the content. |
© 2024 by the authors. Licensee MDPI, Basel, Switzerland. This article is an open access article distributed under the terms and conditions of the Creative Commons Attribution (CC BY) license (https://creativecommons.org/licenses/by/4.0/).
Share and Cite
MDPI and ACS Style
Won, J.-h.; Na, H.C.; Kim, Y.S. A New Training Method for VR Sickness Reduction. Appl. Sci. 2024, 14, 3485. https://doi.org/10.3390/app14083485
AMA Style
Won J-h, Na HC, Kim YS. A New Training Method for VR Sickness Reduction. Applied Sciences. 2024; 14(8):3485. https://doi.org/10.3390/app14083485
Chicago/Turabian StyleWon, Ju-hye, Hae Chan Na, and Yoon Sang Kim. 2024. "A New Training Method for VR Sickness Reduction" Applied Sciences 14, no. 8: 3485. https://doi.org/10.3390/app14083485
Note that from the first issue of 2016, this journal uses article numbers instead of page numbers. See further details here.