Article

Insight into Adsorption Kinetics of Cs+, Rb+, Co2+, and Sr2+ on a Zeolites-Based Composite: Comprehensive Diffusional Explanation and Modelling

1
Université de Lille, Faculté des Sciences, CNRS, UMR 8516-LASIRE, Laboratoire Avancé de Spectroscopie pour les Interactions, la Réactivité et l’Environnement, F-59000 Lille, France
2
Université de Bangui, Faculté des Sciences, Chaire Unesco «Sur la Gestion de l’eau», Laboratoire Hydrosciences Lavoisier, B.P. 908, Bangui, Central African Republic
*
Author to whom correspondence should be addressed.
Appl. Sci. 2024, 14(8), 3511; https://doi.org/10.3390/app14083511
Submission received: 21 March 2024 / Revised: 15 April 2024 / Accepted: 16 April 2024 / Published: 22 April 2024
(This article belongs to the Special Issue Novel Ceramic Materials: Processes, Properties and Applications)

Abstract

:
Kaolinite-rich soils were used to prepare zeolite-based composites via alkaline activation. The porous material was characterized by conducting XRD and microporosity measurements, as well as ESEM microscopy. The Weber and Morris (W-M) model was used for studying adsorption kinetics of radioactive cations on synthesized alkali-activated material. These investigations evidenced the effects of pore structure and the importance of the intrinsic characteristics of hydrated cations (ionic potential; hydrated radius; B-viscosity parameter; molar Gibbs energy of hydration of cation) on W-M kinetic rate constants. The application of diffusion-based models permitted us to assess the key diffusion parameters controlling successive diffusion regimes, and to reveal strong contributions of surface diffusion to adsorption kinetics during the course of the second and third kinetics stages of the W-M model. The magnitude of the surface diffusion coefficient was related to the capacity of hydrated cationic species to lose water molecules when penetrating brick pores. The HSDM model were tested for predicting radionuclide adsorption in a fixed-bed column. A breakthrough curve simulation indicated the predominance of the surface diffusion regime, which was in agreement with mathematical analysis of (batch) adsorption kinetics data. Ionic diffusion was linked to the characteristics of capillary porosity and connectivity of capillary pores in the composite, suggesting the generation of hydrated nuclides and their immobilization in the form of outer-sphere complexes.

1. Introduction

In order to decrease greenhouse gas emissions, it is becoming more and more imperative (i) to preserve/control natural resources by attempting to reuse/recycle them; (ii) to decrease industrial wastes/by-products by transforming them into innovative materials for new applications; (iii) and above all, to limit, at best, energy consumption derived from fossil combustibles. It has, therefore, been necessary to rapidly develop more sustainable alternatives to certain industrial products, like cement materials, which are currently recognized to be responsible for about 8% of anthropogenic CO2 emissions worldwide [1]. In this view, aluminosilicate geopolymer materials have attracted research on their use not only as construction materials, but also as ion exchangers in effective water remediation processes [2,3], since their synthesis is easy and low-cost, necessitating natural and available (waste) materials. They are obtained through alkali activation: (i) either directly from natural minerals (such as kaolin [3] and metakaolin [4,5,6]), or (ii) from industrial products/wastes (such as fly ash and blast furnace slag [7,8,9], red mud [10], and brick [11,12]).
Aluminosilicate geopolymers are considered to be innovative inorganic structures for environmental and industrial applications. They have been employed as (i) sustainable, eco-friendly materials, since their production necessitates a much lower degree of release of CO2 gas than that of Portland cement fabrication [9]; (ii) gas (CO2 and CH4) adsorbents [13,14,15]; (iii) oxygen carriers [16,17,18]; (iv) organic/inorganic adsorbents [19,20]; (v) pH buffers [21,22]; (vi) radio-element immobilizers [9,23,24]; (vii) self-supporting membranes [25,26,27]; (viii) catalysts for cost-effective environmental governance [28,29,30,31]; and (ix) photo-catalysts for the degradation of organic pollutants [32].
Structurally, aluminosilicate geopolymers are amorphous to semi-crystalline materials. Their three-dimensional networks constitute cross-linked tetrahedral silica and alumina units, forming rings comparable to those in zeolites. These rings contain “negatively charged” aluminium ([AlO4]5−) charge-balanced by cations such as Na+ or K+, facilitating the ion exchange with “positively charged” counter-ions (such as hazardous/toxic heavy metals) in the aqueous phase through electrostatic attraction, and thereby enabling metal(s) immobilization. Furthermore, aluminosilicate geopolymer materials provide relatively good mechanical properties and thermal stability [33,34], but they possess a weak surface area and a low number of active surface sites in comparison with crystalline aluminosilicates such as zeolites.
Some of the zeolite types have great importance in heavy metal removal [35], dye removal [36], or even in agricultural area like soil amending [37]. In pure zeolites like NaA and NaP, their frameworks contain the highest atomic Al/Si ratio and thereby possess the highest negative-charge density. However, because of their small pore sizes, the ion-exchange kinetics of radioactive cations with large diameters (like Cs+ and Sr2+, with 4.5 Å and 8.2 Å, respectively) take place more slowly on zeolites [38]. In this context, as natural zeolites possess micropores with weak interconnection, their surfaces could be easily obstructed by adsorbed (ionic, gaseous or neutral) species, and hence become inactive with time when they are used as catalysts, ion-exchangers, or adsorbents. Conversely, the use of hierarchical structuring of zeolite or Al-rich zeolites with larger pores sizes should allow for the improvement of “large” cation/Na+ exchanges and adsorptive capacity [38,39,40,41]. These are obtained with zeolites synthesized via conversion of geopolymers [42,43,44]. Indeed, the use of geopolymeric zeolites has been found to be more adapted for practical applications because they possess pores with larger sizes and that are interconnected. These pore characteristics confer geopolyparticularly better adsorptive properties towards larger adsorbates to geopolymeric zeolites, and more generally, they enhance the adsorption of toxic materials such as heavy metal ions, dyes, herbicides, and drugs [42,43,44].
Currently, more emphasis is being given to the synthesis of zeolitic materials from low-cost industrial wastes with the aim to reduce preparation costs, as well as to valorise and recycle industrial by-products [45,46,47,48,49]. Among these, brick was recently proposed by our research group as an interesting (green) material, mostly owing to the following reasons: (i) the facile and low-cost production of zeolitic/-geopolymic aluminosilicate brick composites; and (ii) the introduction of meso-porosity in generated zeolites NaA and NaP during chemical activation, enabling better ion-exchange kinetics and higher adsorption capacity toward hydrated (radioactive) cations with large sizes [12,50]. In addition, for industrial applications, it is imperative that adsorptive mixtures like “zeolites + geopolymers” be supported and shaped in sufficiently large particles in order to avoid high pressure drops and weak permeability during the filtration procedure. In order to overcome this issue, the use of brick presents another notable advantage: the possibility of grinding, granulating, and sieving this material into suitable particle sizes. The technical capacity for producing approximately cylindrical granules with adequate sizes would facilitate the implementation of large-scale filtration systems in which the inlet liquid would flow more easily through adsorbent-grain interstices (thereby ensuring low pressure drops and better permeability) [11,12]. In the lab, brick aggregates were activated with sodium hydroxide with the aim of generating a low-cost, mesopore-rich composite according to a one-step process. Preliminary investigations revealed that the obtained material was a good adsorbent for the removal and immobilization of the Cs+ and Rb+ radionuclides from water, and was well-adapted for column experiments and future large-scale (industrial) applications owing to the facile granulation of the material [11,12]. In the present work, caesium, strontium, and cobalt were chosen because their isotopes, 137Cs, 90Sr and 60Co, are among the most frequent radionuclides encountered in liquid radioactive wastes that can lead to dangerous releases of radioactivity to the environment following nuclear incidents or accidents. These radioactive metals are known to be relatively stable at the human scale, and decay at half-life times of a few years: 60Co, 5.27 years [51]; 137Cs, 30.17 years [52]; and 90Sr, 28.7 years [52]. Rubidium was also studied in this article because it was recognized first to have great potential to trace various geological processes [53], and second to be useful as a conservative tracer for effluent pollution/impact diagnostics of municipal wastewater by considering the ratio of Rb concentration to that of strontium in highly urbanized, anthropogenically impacted freshwater systems [54]. The Rb element possesses two naturally occurring isotopes: the stable isotope 85Rb (72.17%) and the radioactive isotope 87Rb (27.83%). The 87Rb isotope is very stable, with a half-life of 4.97 × 10¹⁰ years, and it decays into 87Sr [55]. If the isotopes 137Cs, 87Rb, 60Co, and/or 90Sr were to contaminate soils and water streams, they would be capable, with time, of passing through food chains, and thus would pose relevant risks to human beings. Furthermore, as these radioactive elements are high-energy beta-ray or gamma-ray emitters, it is urgent to remove them from radioactive wastewaters using an effective material and an efficient method [56].
The first objective of this research was to characterize the brick-based composite by conducting X-ray diffraction (XRD) and micro-porosity measurements, as well as environmental scanning electron microscopy (ESEM).
In the lab, the aqueous adsorptive characteristics of the brick composite towards some cations (Cs+, Rb+, Co2+, and Sr2+) were examined, with special emphasis on the implication of surface properties on ionic motion within composite frameworks as well as on adsorption advancement. For this purpose, it was necessary to estimate preliminary equilibrium adsorption data and adsorption kinetics parameters: (i) for providing insight into the underlying mechanism; (ii) for predicting the reaction time to accomplish adequately specific radioactive wastewater treatment; and (iii) for optimizing the design of (future) industrial batch/column adsorption systems. These objectives could be accomplished by imperatively identifying and modelling heterogeneous reactions involved in the the brick composite/water interface. However, by applying pseudo-first- and -second-order models, the adsorption kinetics process was over-simplified because intra-particle diffusion and external mass transfer were not taken into consideration in the adsorption kinetics. The knowledge and evidencing of intra-particle diffusion and mass-transfer phenomena at the water–solid interface were essential for us to better understand the heterogeneous kinetics process being studied. Thereby, the second objective of this research was to apply to our system the kinetics-based model proposed by Weber and Morris [57] to reveal reaction pathways and rate-controlling steps. In this step, the effects of pore distribution and the importance of intrinsic properties of hydrated cations on diffusion kinetics were also studied.
The Weber–Morris model is, nevertheless, considered more as a descriptive model than a predictive/theoretical model for quantifying diffusion/mass transfer phenomena. The third objective was, therefore, to use diffusion-based models, enabling the estimation of diffusion or mass transfer parameters, which are essential for designing adsorption processes under static (batch) and dynamic (fixed-bed column) conditions. In these modelling approaches, adsorption kinetics were investigated by assuming the occurrence of the following sequential steps: (i) film diffusion/mass transfer; (ii) intra-particle diffusion/mass transfer; and (iii) adsorption on the pore surface of the adsorbent (surface reaction). The corresponding mathematical equations were applied to our heterogeneous system for the purpose of modelling/interpreting the adsorption kinetics process and evidencing/quantifying rate-limiting steps.
Should obtained (batch) information about diffusion kinetics and thermodynamic (interfacial) equilibria be relevant and valuable for predicting the removal performance of the brick composite towards Cs+, Rb+, Co2+, and Sr2+ cations in fixed-bed columns? To verify this, our fourth objective was to use a mass-transfer model to describe the dynamics of the cation/Na+-exchange process in packed-bed columns. Breakthrough curves were experimentally determined and modelled using the homogeneous surface diffusion model (HSDM). The FAST 2.1 program [58] was used for simulating breakthrough curves and solving HSDM calculations. The involved mass-transfer mechanism was investigated in detail by modelling the adsorptive and diffusional behaviour of the elements (Cs, Rb, Sr, and Co) through the porous frameworks of the brick composite. In this part, the dimensionless analysis of the involved diffusional regimes and the implication of the connectivity of pores on ion diffusivity were also examined.
The originality of this work was that it rationally interpreted the effects of hierarchically mesoporous “zeolitic” structures appearing at the surface of an activated brick on the adsorption kinetics of Cs+, Rb+, Co2+, and Sr2+ cations, which were studied individually, and to distinguish/quantify different diffusion regimes taking place at the solid–water interface under static and dynamic operational conditions.

2. Materials and Methods

2.1. Preparation of Zeolite-Based Composite

Kaolinite-rich soils from Bangui (Central African Republic) were used for making brick. Briefly, the extracted soils were mixed with water, and the obtained mud was shaped manually. The resulting air-dried (48 h) bricks were placed in efficient stackings with air flows in order to constitute a basic oven (that was built simply on ground). They were then heat-treated with dry wood for a period of about three days at temperatures ranging from 500 °C to 800 °C, and finally cooled progressively up to ambient temperature for two/three days. In order to increase the surface area of the brick material, it was broken into grains manually using a hammer. Brick particles were sieved with mechanical sieves afterwards, and the fraction of particles with sizes varying from 0.7 to 1.0 mm was kept for our experiments. This fraction was washed with Milli-Q water and then decanted; after settling, the water was eliminated and the brick grains were dried at 105 °C. This brick contained mainly quartz (60–65 w%) and metakaolinite (20–26 w%), and, to a lesser extent, iron oxide/hydroxide, illite, and titanium dioxide [59]. Afterwards, brick pellets were treated with sodium hydroxide according to the following optimized synthesis conditions [60]: 10 g of Bangui brick reacted in 40 mL of a diluted NaOH solution (0.6 mol·L−1) at room temperature for 24 h under slow shaking at a speed of 120 rpm. This procedure was followed by a fixed-temperature increase in the mixture at 90 °C for a constant reaction time of six days. Finally, the recovered grains were rinsed several times with MilliQ water and dried at 90 °C for 24 h.

2.2. Chemicals

All chemicals employed in the experiments were of analytical grade. Sodium hydroxide, Co(NO3)2.6H2O, Sr(NO3)2, Cs(NO3), and Rb(NO3) were supplied by DISLAB (Paris, France). It is worth noting that only salts of non-radioactive isotopes were used as model substances for the kinetics experiments.

2.3. ICP-AES Analyses

During batch and column studies, the recovered solutions were analysed for most of their element contents using an inductively coupled plasma optical emission spectrometer (ICP–OES, model 5110 VDV, Agilent Technologies, Paris, France). As for caesium, because of the low emission intensity detected by ICP-OES, Cs contents in recovered solutions were determined by means of an ICP-MS spectrometer (Agilent Technologies model 7850).

2.4. Kinetics (Batch) Experiments

All kinetics experiments, excluding the pH effect tests, were carried out at the natural pH of the suspension initially measured, i.e., 7.74 for Cs+; 7.42 for Rb+; 7.37 for Sr2+; and 7.29 for Co2+. These experiments were conducted at 298 K. For this, with a a thermostat, we used a double-walled cell into which water maintained at a constant temperature flowed (model Thermofisher Polystat 71; Paris, France). A temperature sensor (Pt 1000 Metrohm, Paris, France) and a pH Methrom electrode (Metrohm 6.0262.100, Paris, France) were employed to accurately measure the temperature and pH of the suspension. These sensors were connected to an automatic titrator (model Metrohm Titrando 888, Paris, France), and the measuring device was controlled by the software Tiamo (version 2.3).
Kinetics tests were performed at the minimum shaking speed above which the kinetics were independent of the degree of agitation, and therefore not influenced by film diffusion. The synthetic solutions which were employed for kinetics experiments were prepared by diluting 1000 mg·L−1 stock solutions of cations with distilled water. The course of the kinetics process was appraised by following the decrease in adsorbate with time in the liquid phase. For this, an element solution of 100 mL (2 mmol·L−1) was put into contact with 0.5 g of alkali-activated brick in a 200 mL glass reactor until an equilibrium state was attained (~240 mn). Then, 0.5 mL of suspension solution was collected at different time intervals (ranged from 0.5 to 240 mn) and diluted with distilled water with the aim to determine the element concentration using either ICP-OES or ICP-MS.
It is worth noting that the effects of element concentration (in the aqueous phase) on cation adsorption (on the brick) ought to be attributable preliminarily to the number of active sites of alkali-activated brick interacting with cationic species (i.e., the mass of brick grains in contact with solution). However, the extent of cationic removal ought also to be related to the affinity, reactivity, and diffusional/complexing characters of the adsorbate towards the brick surface.
Note that the adsorptive behaviour of raw brick was studied in the lab, and data were afterwards compared to those obtained with brick activated either by acidic or basic treatment. Our investigations clearly showed the weak adsorption capacity of raw brick towards cations such as Fe2+ and Pb2+ because of the absence or negligible presence of negatively charged sites associated with extra-framework ions [59].

2.5. Fixed-Bed Column Experiments

The continuous flow adsorption experiment was conducted in a fixed-bed glass column with an inner diameter of 12.5 mm, a height of 25 cm, and a porosity of 160–250 µm, with a sintered pyrex disk at its bottom to prevent any loss of material. A bed depth of 8.6 cm (10 g) was investigated at a constant flow rate of 5 mL/min. Before being used in the experiments, at least 500 mL of Milli-Q water was passed through the column. The schematic diagram of the fixed-bed column reactor used was previously illustrated [61].
In a single-component system (Co2+, Sr2+, Cs+, and Rb+), the concentration of cations in the influent was fixed at about 1 mmol·L−1. The cation solution was pumped through the column at the desired flow rate using a peristaltic pump (LaboModerne France Type KD1170, Paris, France) in up-flow mode. During the column experiment, the effluent pH was measured continuously using a pH meter that was connected to a computer, and effluent samples exiting the bottom of the column were collected at different time intervals and analysed for element contents using ICP-OES or ICP-MS. The flow to the column continued until the effluent metal concentration at time t (Ct) reached the influent metal concentration (Co): Ct/Co ≈ 0.99. The performance of the packed bed is described in the present work using the concept of the breakthrough curve.

2.6. Electron Microscopy

Micrographs of representative specimens of the brick composite were recorded using an environmental scanning electron microscope equipped with an Energy-Dispersive X-Ray Spectrometer EDS X flash 3001 (Thermo Fisher Scientific, Courtaboeuf, France). EDS measurements were carried out at 20 kV at low vacuum (1.00 Torr), and the maximum pulse throughput was 20 kcps. Different surface areas ranging from 0.12 to 0.50 mm2 were targeted on alkali-brick grains and examined by ESEM/EDS. For this, a narrow beam scanned selected areas of brick pellets for chemical analysis. Atomic quantifications and mathematical treatments were undertaken using QUANTA-400 software (elaborated by Bruker) in order to determine the averaged elemental composition of the surface brick and to detect chemical/elemental variability.

2.7. X-ray Diffraction (XRD)

XRD analysis was conducted at room temperature in a Bruker D8 Advance diffractometer (Evry, France) using Ni-filtered CuKα radiation (40 kV, 40 mA). Brick composite samples were scanned with a step size of 0.02° and a counting time of 0.5 s per step.

2.8. Nitrogen Adsorption–Desorption Isotherms

The textural characterization of the activated-brick samples was determined from the N2 adsorption desorption isotherm at 77 K using the micrometrics model Tristar II 3820. Before analysis, the brick material was heated at 373 K and degassed for 2 h under primary vacuum conditions (pressure: 10 Pa).
The specific superficial area was assessed using the Brunauer–Emmet–Teller (BET) method. The pore volume was estimated using the α-plot method. The total pore volume was evaluated from the desorption isotherm branch at P/Po = 0.98, assuming complete pore saturation. Pore size distribution was calculated using non-local density functional theory (NLDFT) and the Berrett–Joyner–Halenda (BJH) method.

2.9. Theoretical Approach of Adsorption Kinetics

Under static (batch) experimental conditions, the Weber–Morris model allowed us to gain evidence and follow up with time film mass transfer and pore/surface diffusion phenomena over the course of the kinetics process. Moreover, the combined use of the Weber–Morris model and diffusion-based models (as described in Section 3.3) allowed us to quantify the different diffusional regimes taking place on the brick surface during the adsorption process.
Pore surface diffusion modelling of the cations’ breakthrough curves was performed using the dynamic packed-bed model HSDM (homogeneous surface diffusion model). Using this model, two subsequent steps were performed: (i) the mass transport from the solution bulk to the brick’s external surface (which was represented here by a mass transport coefficient, kf); and (ii) the intra-particle diffusion (which was attributable to both pore volume diffusion, Dp, and surface diffusion, Ds). On the basis of one-dimensional solute transport in the fixed bed, a series of fundamental differential convective–diffusive equations for a packed-bed setup was established to quantify interfacial phenomena, and hence, to explain the adsorber dynamics. In the presently discussed work, HSDM simulations were undertaken by means of the FAST 2.1 software developed by Schimmelpfennig and Sperlich [58].
On the other hand, a dimensionless analysis of the HDSM model and its application for the simulation of breakthrough curves of modified brick was undertaken by considering the dimensionless parameters: Biot, Stanton, and solute distribution.
Adsorption kinetics models: Experimental data were described using the following adsorption kinetics equations (Weber–Morris adsorption kinetics model [62]):
Q t = k i p d t 1 / 2 + C
where Qt (in µmol·g−1) is the adsorption capacity at any time t; kipd (in µmol·g−1·mn−1) corresponds to the intra-particle diffusion rate constant; and C (in µmol·g−1) is a coefficient indicative of the film thickness (film–surface diffusion model [63]).
r o = ( d Q t d t ) t = 0 = 3 k f C o R b ρ b
where ro represents the initial adsorption rate; kf is the film mass transfer coefficient; Co is the initial concentration of adsorbate; Rb is the brick-grain radius; and ρb is the brick density. Knowing the ro value, the kf coefficient can then be determined from the following equation:
k f = R b ρ b r o 3 C o
According to Yao and Chen [63], at the early stage of the adsorption process, kinetic data can be fitted with an equation equivalent to that used for pseudo-second-order kinetics:
Q t = r o t 1 + a t
or
t Q t = 1 r o + a t r o
where “ro” and “a” represent two fitting parameters.
Pore diffusion coefficient: The pore diffusion coefficient (Dp) was estimated from the ionic diffusivity of the radioactive cation in water (D) using the following equation [64]:
D p = D ε b c τ
where τ is the tortuosity factor, which is defined as:
τ = ( 2 ε b c ) ε b c
Note that in all kinetics experiments, we used nitrate salts. The ionic diffusivity of each cation could then be calculated from the following equation [65]:
1 D = z 1 D 1 o + z 2 D 2 o D 1 o D 2 o ( z 1 + z 2 )
where D1° and D2° represent the infinite dilution diffusion coefficients for radioactive cations and anions (NO3), respectively.
Dimensionless (fixed-bed column) parameters: The Biot number (Bi) corresponds to the ratio between the film mass-transfer rate and the intra-particle surface diffusion, and is defined as:
B i = k f d p C o 2 D e f f ρ p Q e q
The Stanton number (St) is the dimensionless liquid-phase mass transfer coefficient, which is defined as:
S t = 2 k f m d p ρ p F
where m is the mass of the adsorbent and F represents the flow rate. The St parameter is considered as a good indicator of the influence of film diffusion on the shape of the breakthrough curve. As for the solute distribution parameter (Dg), it is defined as the ratio of cationic species adsorbed onto brick particles to those in the liquid phase:
D g = ρ B Q o ε B C o
where ρB and εB are the bed density and bed porosity, respectively; Co is the influent concentration; and Qo is the equilibrium solid-phase concentration corresponding to the influent concentration, Co (Qo is determined using the Freundlich equation: Qo = KF·Con, where KF and n represent Freundlich isotherm coefficients).

3. Results

3.1. Characterization of Brick Composite

3.1.1. XRD Analysis

The XRD patterns of raw brick and alkali-activated brick presented in Figure 1a,b revealed that quartz was the major crystalline phase, as were, to a lesser extent, illite and rutile. In the XRD patterns of alkali-activated brick (see Figure 1b), additional peaks with lower intensities appeared in the diffractogram.
Their positions revealed the occurrence of zeolitic crystals: Na-A (or LTA; an abbreviation meaning Linde type A), and Na-P. The characteristic peaks observed for LTA crystals were 2θ = 7.2°, 10.2°, 12.5°, and 21.7°, which correspond to lattice plans of (200), (220), (222), and (600 and 442), respectively [66]. The characteristic peaks observed for Na-P crystals were 2θ = 12.5°, 17.7°, 21.7°, 28.1°, 33.4°, and 46.1°, which correspond to lattice plans of (101 and 110), (200 and 002), (211, 112 and 121), (310, 301, and 103), (132, 123, 231, 213, 312, and 321), and (134), respectively [66].
It is worth noting that the micro-porosity technique used herein did permit us to assess the pore size contributions provided by LTA and Na-P zeolites to the overall surface area. Indeed, the dimension for nitrogen gas to penetrate the pores at 77 K is limited to 5 Å [67], whereas for pore sizes in the LTA zeolite, it is ≤4.1 Å [68], and dimensions of intersecting channels in the Na-P zeolite (i.e., 0.31 nm × 0.44 nm and 0.26 nm × 0.49 nm) are too weak [69,70,71].
Overall, XRD characterizations performed on alkali-activated brick revealed the appearance of new reflections, which were ascribed to two crystalline zeolitic phases: zeolite Na-A and zeolite Na-P. This study confirmed the occurrence of crystal nucleation of the amorphous geopolymeric (aluminosilicate) gel phase (knowing that this gel was intermediately generated through brick–metakaolinite dehydroxylation under fixed thermal/alkaline conditions).

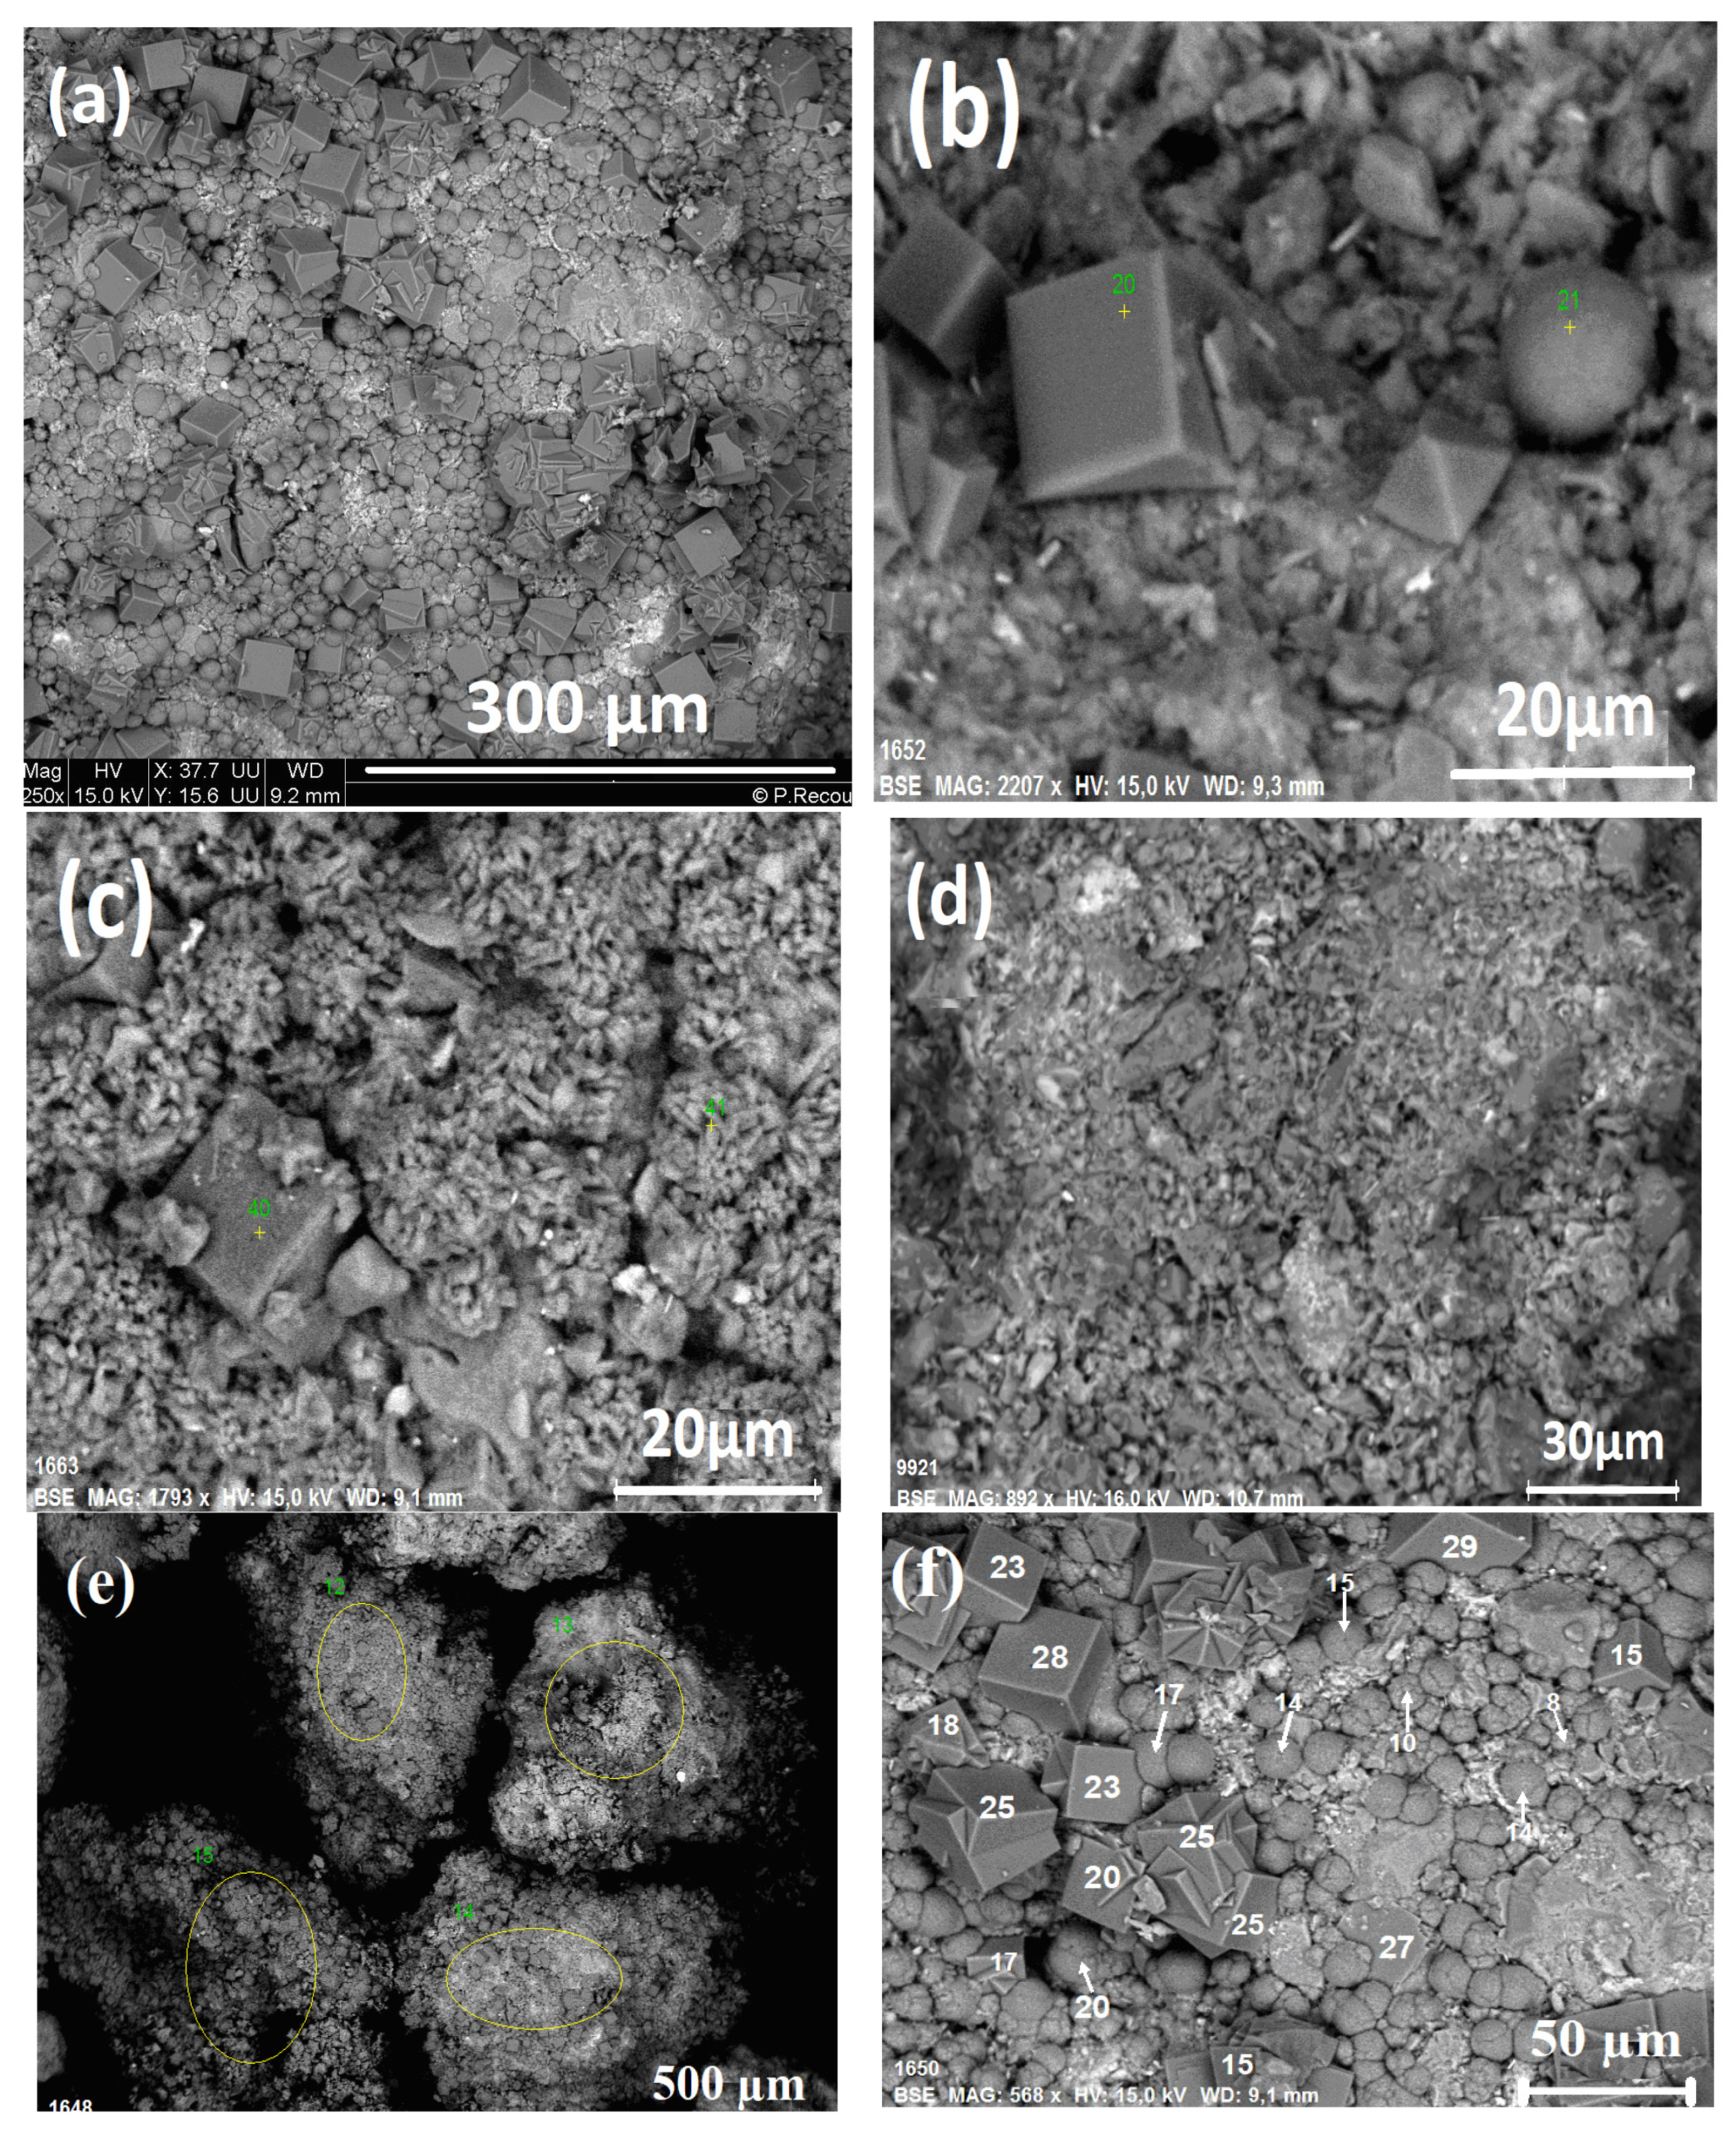
3.1.2. ESEM/EDS Analysis

ESEM micrographs of the treated brick pellets are shown in Figure 2a–c. As can be seen in these ESEM micrographs, the morphological aspects of this material were evidenced at two magnifications. The ESEM micrograph of raw brick is displayed in Figure 2d. Elemental (ESEM/EDS) analysis of alkali-activated brick permitted us to detect the following elements: (i) silicon (Si), aluminum (Al), and oxygen (O) as major elements; and (ii) iron (Fe), titanium (Ti), magnesium (Mg), potassium (K), and calcium (Ca) as minor elements. In order to determine their atomic surface contents, several spherical and ellipsoidal surface zones were targeted and analyzed using ESM/ED, as shown in Figure 2e. The averaged atomic percentages of elements constituting the alkali-activated brick surface were estimated: 19.00 ± 1.24 at.% for silicon; 10.44 ± 0.76 at.% for aluminium; 60.57 ± 1.22 at.% for oxygen; 0.92 ± 0.33 at.% for iron; 0.42 ± 0.36 at.% for titanium; 0.60 ± 0.03 at.% for magnesium; 0.97 ± 0.49 at.% for potassium; and 0.09 ± 0.02 at.% for calcium. Some of these elements were found to be better localized across the brick surfaces, evidencing the presence of SiO2 (as quartz); alumino-silicates; and, to a lesser extent, iron oxides/hydroxides and titanium oxide [11,12]. Aluminosilicates present in alkali-activated brick were detected as aggregates with either spherical or cubic shapes. Their sizes varied from 8 µm to 20 µm for spherical particles and from 15 µm to 29 µm for cubic particles, as shown in Figure 2f.
Detailed ESEM/EDS analysis was performed on several cubic and spherical specimens targeted hazardously on alkali-activated brick samples, and the atomic percentages of Al, Si, and Na were determined and averaged. As metakaolinite-derived zeolites ought to belong to the GIS family, the chemical formula (based on the crystalline unit cell) should correspond to the crystalline phases: (M)x/m(Al)x(Si)32−x(O)32·nH2O, where m is the valence of alkali ions and n represents the number of water molecules per unit cell. Hence, it was possible to establish structural and chemical formulas and calculate standard deviations after averaging ESEM/EDS analysis data. We found:
(Na)13.86±1.25(?)z(Al)16.43±0.99(Si)15.89±0.98(O)32·nH2O (for cubic particles)
(Na)12.57±1.05(?)z(Al)14.92±1.14(Si)15.58±1.45(O)32·nH2O (for spherical particles)
In these formulas, the Si/Al atomic ratios are close enough to 1 (0.97 for cubic specimens and 1.04 for spherical specimens). Note that the atomic deficit for sodium in the formulas is represented by (?)z. This deficit was assumed to be compensated for by other cations, like K+, Ca2+, and/or Mg2+, which were detected at trace levels on zeolitic frameworks.
The spherically shaped specimens were morphologically similar to those reported in the literature for zeolite Na-P [72,73,74,75], while the cubic-shaped specimens were comparable with those observed previously for the A-type zeolite [76,77]. Note the presence of zeolitic (Na-P) aggregates with “sponge” shapes (see Figure 2c). The occurrence of Na-A and Na-P “zeolitic” crystals in the brick composite was confirmed using XRD, as described in Section 3.1.1 (see Figure 1).
Overall, ESEM/EDS characterizations performed on alkali-activated brick revealed the presence of numerous spherical and cubic (sponge) zeolitic crystalline specimens. Their specific macro-, meso-, and microporous characteristics and negatively charged surfaces make it possible to use this brick material as an adsorbent for the elimination of ionic pollutants.

3.1.3. Porosity and Specific Surface Area

To characterize the specific surface area and porosity of the brick-based composite, N2 adsorption analysis was carried out. Figure 3 displays the N2 adsorption–desorption isotherm and the corresponding pore size distribution curve for the studied material.
The obtained N2 adsorption–desorption isotherm corresponded to a type-IV isothermal profile, according to the International Union of Pure and Applied Chemistry (IUPAC) classification [78]. The adsorption of P/P0 increased abruptly between 0 and 0.01 (Figure 3a), which confirmed the existence of micropores in the modified brick. The appearance of the hysteresis loop at the medium pressure area (0.2 < P/P0 < 0.8; see Figure 3a) proved the abundance of mesopores, and the steep increase in the N2 capacity in the high-pressure area (P/P0 > 0.8; see Figure 3a) indicated the presence of macropores. The shape of this hysteresis loop resembled an H3-type hysteresis loop [78], indicating that the brick composite was mainly composed of mesopores and macropores [79,80]. The pore size distribution shown in Figure 3(b1) agreed with the analysis described above, and revealed that the final composite had hierarchical pores with micropores, mesopores, and macropores.
The analysis of N2 adsorption–desorption isotherms was undertaken in the following range of pore sizes: 17–3100 Å. This analysis permitted us to determine the average pore diameter (94.5–112.4 Å), BET surface area (19.3 m2·g−1), and pore volume (0.036 cm3·g−1). Overall, the porosity analysis revealed the generation of hierarchical mesopores with “bimodal” pore size distribution at 29 Å and ~70–150 Å.
Compared to the pore distribution of raw brick (see Figure 3(b2)), the profile changes in the pore size distribution of the treated brick were intimately related to the significant increase in mesopores, which appeared mostly at low diameters, <50 Å, and reached a maximum pore volume for pore diameters around 28 ± 1 Å. New mesopores were generated through zeolitization of brick-metakaolinite by alkaline treatment. Disordered hollow-like mesoporous frameworks were created by aggregated zeolitic crystals. As for the macroporous structure of the brick (i.e., pores with diameters of about ≥500 Å), it could be directly observed from the ESEM images of a raw brick sample (see Figure 2d), and above all, on ESEM images of treated brick samples taken at higher magnifications (Figure 2b,c), particularly revealing numerous macropores on the surfaces of zeolitic aggregates (Na-P) with “sponge” morphologies (see Figure 2c).
Although the values of average pore diameter, BET surface area, and pore volume obtained for the activated brick were somewhat low, our recent research has revealed that the generated “hierarchical” mesoporous structure of activated brick was well suited for adsorbing inorganic pollutants into the interior space of the alkaline brick under large-scale dynamic conditions [12,81,82]. Thus, our previous investigations, which were performed by our research group at Bangui University (Central African Republic), had permitted us to show that the brick-based composite could be an interesting adsorbent in the conception of a pilot associated with an iron(II)-contaminated drilling [83,84]. Hence, by considering the macro-/mesoporous structure of brick grains and optimizing their sizes to improve flow rates, one could anticipate that such porous characteristics ought to be beneficial to enhance the adsorption efficiency of cationic adsorbates.

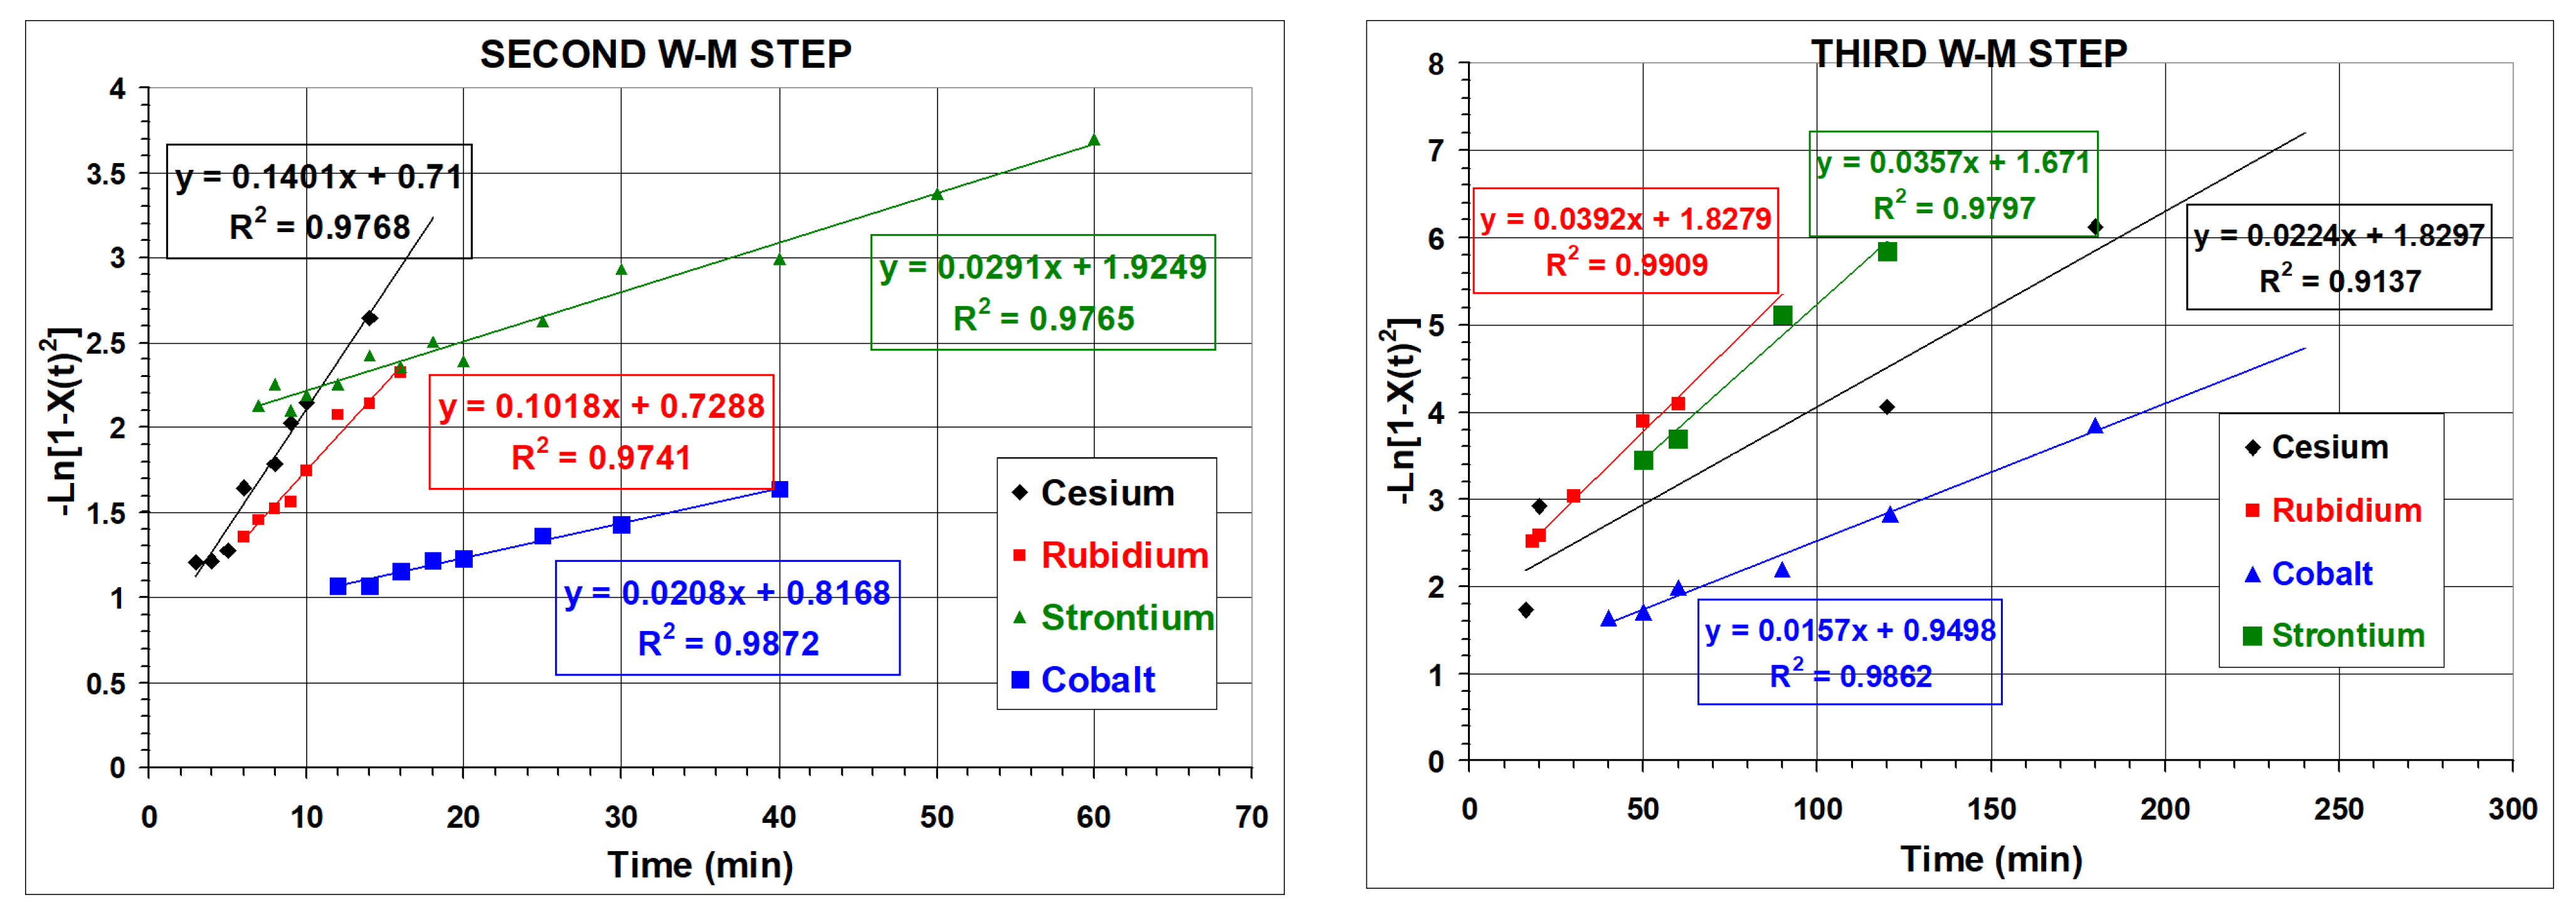
3.2. Weber–Morris (W-M) Model

In order to evidence and differentiate diffusion regions in adsorption kinetics, we decided to test Weber–Morris equation to qualitatively reveal the effects of the heterogeneous and porous nature of alkali-activated brick on the diffusivity of Cs+, Rb+, Co2+, and Sr2+ ions inside adsorbent frameworks.
It has previously been stated that the Weber–Morris (W-M) model is useful for identifying reaction pathways and predicting rate-controlling steps in porous matrices [85]. The model proposed by Weber and Morris [62] was applied in this work to gain deeper knowledge regarding the mechanism of nuclide adsorption onto the porous brick composite in aqueous solutions (see Section 2.9). For each element, the plot of Qt vs. t1/2 was found to be divided into three stages by two break points (Figure 4). As suggested in previous works regarding adsorption kinetics in relation to the adsorbent pore structures and surface properties of adsorbents [86,87,88,89], it was assumed here that the multi-linearity observed for cation adsorption was due to the effects of the adsorbent porosity on cations. The observed multi-linear plot would then result from the broad pore size distribution of the brick composite, including, essentially, macropores and mesopores and, to a lesser extent, meso/micropores of “hierarchical” zeolites (Figure 3b). The higher value of kipd(1) in the first stage of the Weber–Morris model compared to kipd(2) and kipd(3) revealed the importance of external liquid film diffusion (Table 1).
The first linear plot represented the fastest adsorption stage. In connection with the porous structure properties of the brick composite (as shown in Figure 3b), the liquid film diffusion occurred not only on the external brick surface, but also inside macropores and even wider mesopores. This indicates that, in the first W-M stage, the ions Cs+, Rb+, Co2+, and Sr2+ were easily transported into the broader pores of the brick without significant hindrance. As for the second stage of the Weber–Morris model, the lower slopes of the second linear W-M plots (kipd(2) < kipd(1); see Table 1) showed that cationic species diffused more slowly into smaller brick pores. The higher correlation coefficient (R2) obtained in the second W-M stage (see Figure 4) suggests, a priori, that intra-particle diffusion was the rate-limiting step of the adsorption process. But, because none of the second linear W-M plots drawn passed through the origin in Figure 4, it can be concluded that neither the liquid film diffusion nor the intra-particle diffusion was the only rate-controlling step. Finally, in the third stage of the Weber–Morris model, the adsorption process slowed down significantly ((kipd(3) << kipd(2)< kipd(1); see Table 1) due to two features: (i) diffusion through smaller meso/micropores of “hierarchical” zeolites generated during brick activation and (ii) establishment of adsorption equilibrium. The film diffusion rate constants, kipd(1), were 54.322, 46.860, 15.127, and 7.209 µmol·g−1·min−1/2 for Cs+, Rb+, Sr2+, and Co2+, respectively, while the intra-particle diffusion rate constants, kipd(2), were lower: 20.715, 21.597, 4.192, and 4.600 µmol·g−1·min−1/2. Overall, these values indicate that Cs+ and Rb+ ions diffused similarly into the composite frameworks, while Sr2+ and Co2+ ions diffused more slowly through brick pores before being adsorbed by the material.
In the following section, we attempt to identify the various determining factors which both controlled the adsorption of cationic elements onto alkali brick pellets and regulated the interfacial diffusion kinetics. For this purpose, we compiled data from the literature on the thermodynamic and physical properties of the ions Cs+, Rb+, Co2+, and Sr2+ (as well as other metallic cations) in water and correlated them with the experimental results. The W-M kinetics curves obtained for the metallic cations were drawn and are shown in Figure S1 (see Supplementary Materials), and the calculated intra-particle diffusion rate constants, kipd(1) and kipd(2), are listed in Table S1 (see Supplementary Materials). Note that the values of ionic potential, Jones–Dole viscosity coefficient (B), and hydrated radius used in the present work are also given in Table S1.
Ionic potential is known to be an indicator of the electrostatic properties of an ion when interacting with other ions, either of similar charge (yielding electrostatic repulsion forces) or of opposite charge (yielding electrostatic attraction forces). Ionic potential is defined as the ratio of the electrical charge of an ion (Z) to its radius (R). It was previously considered as an important criterion for the choice of efficient adsorbents for toxic elements [90]. In order to calculate the ionic potential, we fixed Z = +1 for monovalent ions and +2 for divalent ions and took the values of hydrated radii (RH) proposed in Marcus’ works [91]. According to this author, a cation with an ionic radius, Ri, is surrounded with water in a spherical shell, ΔRH2O, in which several H20 molecules are immobilized by the electrostatic field of the cationic entity. The total distance from the centre of the cation to the edge of the shell is then given by RTotal = RH = Ri + ΔRH2O. Figure 5 displays the evolution of the intra-particle diffusion rate constants, kipd(1) and kipd(2), as a function of the ratio Z/RH.
The kipd(1) rate constant exhibited a relatively good correlation with the ratio Z/RH, at least for divalent cations (R2 = 0.9365), indicating a noticeable contribution of electrostatic forces to external liquid film diffusion. Conversely, the weak correlation of the kipd(2) rate constant with the ratio Z/RH (R2 = 0.2176) seemed to show a less important electrostatic contribution to intra-particle diffusion in comparison to that observed in the first stage of the Weber–Morris model (Figure 5).
Figure 5 displays the change in the hydrated radius (RH) in relation to the intra-particle diffusion rate constants kipd(1) and kipd(2) for the first and second stages of the Weber–Morris model, respectively. As can be seen in this figure, the kipd(1) and kipd(2) rate constants exhibited relatively good correlations with RH (R2 = 0.9649 and 0.9735, respectively). The observed hydrated radius (RH) dependence on diffusion rate constants suggested that the size of the hydrated ion ought to be taken into consideration as a noticeable factor in the diffusional approach of the studied adsorption process.
In the diffusion adsorption mechanism, the mobility of the cationic species first toward brick surfaces and second through zeolitic pores/channels should depend on the viscosity of the interfacial medium. The viscosity of the hydrated cation solution (η) was referred to that of the pure water (ηo), and could be determined from the Jones–Dole expression [92]:
η η o = 1 + A · C 1 / 2 + B · C
where C (in mol·L−1) is the solute concentration and A (in L1/2·mol−1/2) and B (in L·mol−1) are coefficients depending on the solute, the solvent, and the temperature [92]. Here, we consider the Jones–Dole viscosity coefficient (B) as a potential indicator of the degree of water structures around the cationic entity, and thereby of the bonding strength of hydration shells covering the element. The B-coefficients of aqueous inorganic ions at 25 °C in L.mol−1 were previously reported by Jenkins and Marcus [92]. Thus, by plotting the intra-particle diffusion rate constants kipd(1) and kipd(2) against the B “viscosity” parameter (Figure 5), we noticed that the increase in the medium viscosity contributed to a significant inhibition of cationic adsorption kinetics. This suggests that the B-coefficient also had to be taken into account as a determining parameter regulating cationic diffusion into brick surfaces.
In water, the complexation of a cation with H2O molecules results in the formation of a hydration shell. This reaction is exothermic, releasing a certain hydration free energy noted here as “ΔGH”. To evaluate the contribution of the molar Gibbs energy of hydration of the cation M+ or M2+ (as defined and determined by Marcus [91]) to the diffusion behaviour of cationic species inside composite frameworks, we plotted the intra-particle diffusion rate constants, kipd(1) and kipd(2), against “ΔGH” (Figure 5). The values of molar Gibbs energy of hydration used for plotting are listed in Table S3. As can be seen in Figure 5, the kipd(1) and kipd(2) constants exhibited good correlations with the molar Gibbs energy of hydration (R2 = 0.9923 and 0.9852, respectively). These findings suggest that, for Cs+ and Rb+, which have much softer hydration shells than those of Ni2+, Cu2+, Co2+, Sr2+, and Zn2+, the easier rearrangement and loss of the water molecules of hydration around these cations contributed to an enhancement of diffusion kinetics.
Globally, the facile kinetic exchange between Na+ ions on the brick surface and Cs+ or Rb+ ions in the solution could be explained in part by the low differences in the ion hydration energies (−385 kJ·mol−1 for Na+, −285 kJ·mol−1 for Rb+, and −245 kJ·mol−1 for Cs+ [91]). These differences were substantially smaller in magnitude than those calculated for the ion exchanges between Na+ ions and the cationic metals Sr2+ and Co2+ (−385 kJ·mol−1 for Na+, −1468 kJ·mol−1 for Sr2+, and −2003 kJ·mol−1 for Co2+ [91]). But the larger barrier to adsorption kinetics for the more strongly hydrated cations (Co2+ and Sr2+) could not be understood simply by the very high differences in ion hydration energies. Indeed, partial losses of water molecules in cation hydration shells and in oxygen atoms on the brick surface should be responsible for energy barriers to adsorption and, hence, for the magnitude of diffusion kinetic constants observed. On this view, it could be reasonably stated that the H2O losses in the coordinating structures of the cations involved in Cs+ and Rb+ adsorption and Na+ desorption were thermodynamically easier and thereby kinetically more favourable than those in the coordinating structures of Sr2+ and Co2+ ions.
To summarize, this study clearly shows that adsorption kinetics took place initially with internal film diffusion involving macropores and wider mesopores, followed by intra-particle diffusion involving smaller mesopores and zeolitic micropores. The Weber–Morris model [62] was used here as a first approach for describing the interfacial diffusion aspects of the adsorption kinetics on the brick composite. However, although the application of the Weber–Morris model evidenced the implication of distinctive diffusion regimes in connection with the porous properties of the adsorbent, it did not allow for the measurement of ionic diffusivities of cations, either in the bulk solution (towards the solid surface) or in the solution confined inside the porous brick matrix.
In the following section, the restricted diffusion of cations in the adsorption on the brick composite is analysed and quantified by relating the successive diffusional regimes observed in W-M adsorption kinetics to the specific pore size distribution of the adsorbent.

3.3. Diffusion-Based Models

In this section, different diffusion models were used for determining the key diffusion parameters governing the diffusion kinetics of the adsorption of elements onto the brick composite.

3.3.1. Evaluation of Film Mass Transfer Coefficient

W-M studies permitted us to show that the external film diffusion took place only at the early stage of the adsorption kinetics.
Considering the film–surface diffusion model proposed by Yao and Chen [63], the initial adsorption rate ro could be determined (see Section 2.9). Plotting t/Qt against time, good straight lines were obtained with correlation coefficients ranging from 0.9988 to 0.9996 for the different ion exchange reactions studied (Figure 6). From the slope and intercept values, the “ro” and “a” constants were determined, and results are listed in Table 2. The kf value was then determined and is given in Table 2.
To summarize, Equation (3) permitted us to estimate the film mass transfer coefficient (kf) through the initial adsorption rate (ro). This latter was determined at the early adsorption stage (i.e., for a short adsorption time of less than 10 min for Cs+, Rb+, and Sr2+ and 14 min for Co2+, as shown in Figure 6). The kf values will be used in Section 3.4 for modelling breakthrough curves obtained under dynamic (fixed-bed column) operational conditions.

3.3.2. Evaluation of Pore and Surface Diffusion Coefficients

In the second steps of the Weber–Morris plots, the (single) diffusion of the cations Cs+, Rb+, Sr2+, and Co2+ through the brick slowed down because the adsorption process became more restricted by brick pores with lower diameters. Under this condition, Fick’s law might be applied to diffusion kinetics:
C t = 1 r 2 r ( r 2 D e f f C r )
where C is the concentration of the adsorbate; Deff is the effective diffusion coefficient of the cation; and r represents the radial coordinate. Assuming that the adsorbent particles are spherical and that the pores are identical and homogeneously distributed on the solid surface, Equation (13) could be solved to Equation (14) [93] and applied to our system.
X ( t ) = 1 6 π 2 z = 1 α ( 1 / z 2 ) · exp ( z 2 π 2 D e f f t R b 2 )
where X(t) = Qt/Qe is the fractional attainment at time t; Qe and Qt represent the amounts of cation adsorbed on brick composite at equilibrium and time t (mg·g−1), respectively; Deff is the effective diffusion coefficient of the cation in the composite exchanger phase (m2·s−1); Rb is the radius of brick grains, which are assumed to be spherical (m); and “z” is an integer. The following equation (valid for X(t) varying from 0 to 1) was used here as an approximation of Equation (14):
X ( t ) = [ 1 exp ( π 2 D e f f t R b 2 ) ] 1.2
This equation can be transformed into:
ln [ 1 X ( t ) 2 ] = π 2 D e f f t R b 2 + C s t
In this equation, it was necessary to introduce a constant (noted “Cst”) in order to take into account the reaction time to when the adsorption kinetics process began to be controlled by surface diffusion according to the Weber–Morris model. This constant could be determined from the following formula: Cst = -ln(1-X(to)2) -π2Deff.(to)/Rb2. It should be noted that the “Cst” value differed for each cation studied. Hence, Equation (16) ought to cover only the kinetic data points which were used for determining the Weber–Morris rate constant kipd(2). Its use permitted us to reach the effective particle diffusivity as follows. By plotting −ln [1 − X(t)2] against time, we obtained relatively good straight lines with correlation coefficients varying from 0.9741 to 0.9872 for the different adsorption reactions studied. See Figure 7.
The slope values of these linear relations were employed to assess the effective diffusion coefficients, and the Deff values are listed in Table 3.
Likewise, from the coordinates of kinetic data points representative of the third W-M stage, we plotted −ln [1 − X(t)2] against time and estimated the effective particle diffusivity for each element by employing the same calculation procedure as that described for the second W-M stage (see Figure 7 and Table 3). In this case, Equation (16) ought to cover only the kinetic data points which were used for determining the Weber–Morris rate constant kipd(3).
To interpret the results of the diffusion (Deff) measurements of the mass-transfer kinetics involved in the second Weber–Morris step, it was assumed in this work that both pore diffusion and surface diffusion might be responsible for the mass transfer resistance. Hence, in order to better model diffusion in the brick composite based on the step diffusion through mesopores and micropores, we decided to apply a heterogeneous model in which both pore diffusion and surface diffusion were considered [94,95,96]. By taking into account the pore diffusion and surface diffusion intrinsically involved in the second Weber–Morris step and by using Fick’ theories, the total diffusion flux (J) could be expressed as [97,98,99,100]:
J = ( 1 ε b c ) · D s C s r ε b c D p C r
where Dp and Ds are the pore diffusion coefficient and solid-phase diffusion coefficient, respectively; C and Cs are the concentrations of adsorbate in bulk external liquid and on the adsorbent surface per unit volume, respectively; and r represents the radial coordinate. We considered the transport of cations and mass balance equation within the pores of a spherical adsorbent by using the following expression [100]:
( 1 / r 2 ) r ( r 2 J ) + ε b c C t + ( 1 ε b c ) C s t = 0
By describing diffusion kinetics from Fick’s law according to Equation (13), one could establish a mathematical expression evidencing both solid-phase diffusion contribution and pore diffusion contribution according to [100]:
ρ b c ( 1 ε b c ) Q t + ε b c C t = ε b c D p [ 2 C 2 r 2 + ( 2 / r ) C r ] + ρ b c ( 1 ε b c ) D s [ 2 Q 2 r 2 + ( 2 / r ) Q r ]
where εbc is the internal porosity of the brick composite; ρbc is the density of the porous support; C is the liquid-phase concentration of the cation per unit volume of the liquid phase; and Q represents the solid-phase concentration per unit mass of brick. As suggested by Zhu and his co-workers [100], under favourable (and ideal) adsorption conditions, it could be assumed that: (i) the concentration of adsorbates on the surface of the adsorbent (Cs) was close to the product “Q·ρbc”; and (ii) as the examined diffusion region tended to attain thermodynamic equilibrium, the ∂Q/∂C derivative could be assimilated to the derivative at the equilibrium state, (∂Q/∂C)eq. By taking into consideration these hypotheses and according to some authors [98,100], Equation (19) could be rearranged, and the effective diffusion coefficient could be deduced and expressed as a function of both the pore diffusion coefficient (Dp) and the surface diffusion coefficient (Ds) as:
D e f f = ε b c D p + ( 1 ε b c ) ρ b c D s ( Q C ) e q ε b c + ( 1 ε b c ) ρ b c ( Q C ) e q
On the other hand, from batch experiments carried out on the adsorption of ions (Cs+, Rb+, Sr2+, and Co2+) on to the brick composite, the Langmuir [101] and Freundlich [102] isotherm models were fitted to the experimental data. Both models described the equilibrium data quite well, with relatively good correlation coefficients (R2 > 0.98). However, the Langmuir model provided lower standard errors with higher R2 coefficients, evidencing preferential monolayer adsorption of cations on brick surfaces. The derivation of the Langmuir equation permitted us to deduce it (∂Q/∂C) and replace it with the following expression:
( Q C ) = K L Q max ( 1 + K L C ) 2
From this equation, and by considering the following calculation as a first approximation, (∂Qt/∂Ct) was determined at the reaction time values of the different experimental points representative of the second stage of the Weber–Morris kinetics model. These calculations permitted us to show that, for each element, the (∂Qt/∂Ct) values remained close enough to (∂Q/∂C)eq, which enabled the application of Equation (20) to the delimited intra-particle diffusion zone (second step) revealed by Weber–Morris kinetics curve.
On the other hand, as shown in Section 2.9, the ionic diffusivity of each cation could be attained by using the values of the infinite dilution diffusion coefficients D1° for cations (Cs+, Rb+, Co2+, or Sr2+) and D2° for anions (NO3) (D1° and D2° values are given in Table S2) in Equation (8). The values of D are listed in Table S2. From Equations (6) and (7), it was then possible to calculate the Dp coefficient for each cation studied. The data are listed in Table 3.
Afterwards, the determination of Dp and Deff allowed us to estimate the surface diffusion coefficients (Ds) for cation adsorption on brick composites from aqueous solutions at 298 K using Equations (20) and (21) (Table 3). As seen in this table, the values of the surface diffusion coefficients ranged globally from 3.89 × 10⁻¹² m2·s−1 to 4.22 × 10⁻¹¹ m2·s−1, indicating that they were in the same order of magnitude as those of the effective diffusion coefficients (4.79 × 10⁻¹² < Deff < 1.18 × 10⁻¹¹ m2·s−1; see Table 3); however, they were lower than the pore diffusion coefficients (8.77 × 10⁻¹¹ < Dp < 1.40 × 10⁻¹⁰ m2·s−1; see Table 3). These findings seemed to reveal a predominance of surface diffusion on the (intra-particle diffusion) adsorption kinetics.
The mathematical method described above for the determination of Dp, Defff, and Ds relative to the second Weber–Morris stage, was also used for the experimental points of the third W-M stage. By plotting −ln [1 − X(t)2] against time, we obtained relatively good straight lines with correlation coefficients varying from 0.9137 to 0.9909 for the different adsorption reactions studied (see Figure 7).
In this case, from the kinetic data points used for determining the Weber–Morris rate constant, kipd(3), it was noticed that, except for caesium, the Deff value was found to be closer to the Ds one for each element studied (see Table 3). Moreover, for long adsorption times, one could approximate Equation (14) by retaining only the first term in the series, which led to the following equation [93]:
ln [ ( 1 X ( t ) ) · ( π 2 6 ) ] = π 2 D e f f R b 2 t + C s t
As explained above for Equation (16), it was also necessary to take into account a constant Cst’ in Equation (22). This Cst’ constant could be assessed from the formula Cst’ = -ln[(1-X(to’).(π2/6)]-π2Deff.(to’)/Rb2, where the reaction time to’ must be taken at the beginning of the third W-M stage. As for plot calculation, Equation (22) ought to cover only the kinetic data points which were used for determining the Weber–Morris rate constant kipd(3).
Hence, considering the experimental points of the third W-M stage, the term –Ln(1 − X(t).(π2/6) was plotted against the time t (Figure 8), and the value of the slope permitted us to attain the Deff coefficient. All the Deff values evaluated from Equation (22) were found to be comparable enough with those calculated from Equation (16) (see Table 3). Particularly, for each element, the Deff value was closer to the Ds one, suggesting that the pore diffusion contribution was negligible at the end of the kinetics process.
On the other hand, in order to evidence the importance of ion dehydration for the diffusivity of cationic species inside composite frameworks, the surface diffusion coefficient (Ds) was plotted against the molar Gibbs energy of hydration of the cation M+ or M2+GH). See Figure 9 (data used for plotting Figure 9 are given in Table S3).
As seen in this figure, Sr2+ and Co2+ ions (and, more generally, heavy metal cations) diffused more slowly through the brick pores, not only because of hindered or restricted effects caused by their larger radius sizes (as shown in Figure 5), but also due to their elevated free energy of dehydration (as also shown in Figure 5).
In the next paragraph, we use batch adsorption data to achieve the modelling of breakthrough profiles for lab-scale fixed-bed adsorption columns by considering a simplified mathematical approach involving interfacial diffusion phenomena.

3.4. Use of HSDM Formulation for Interpreting Dynamic Adsorption

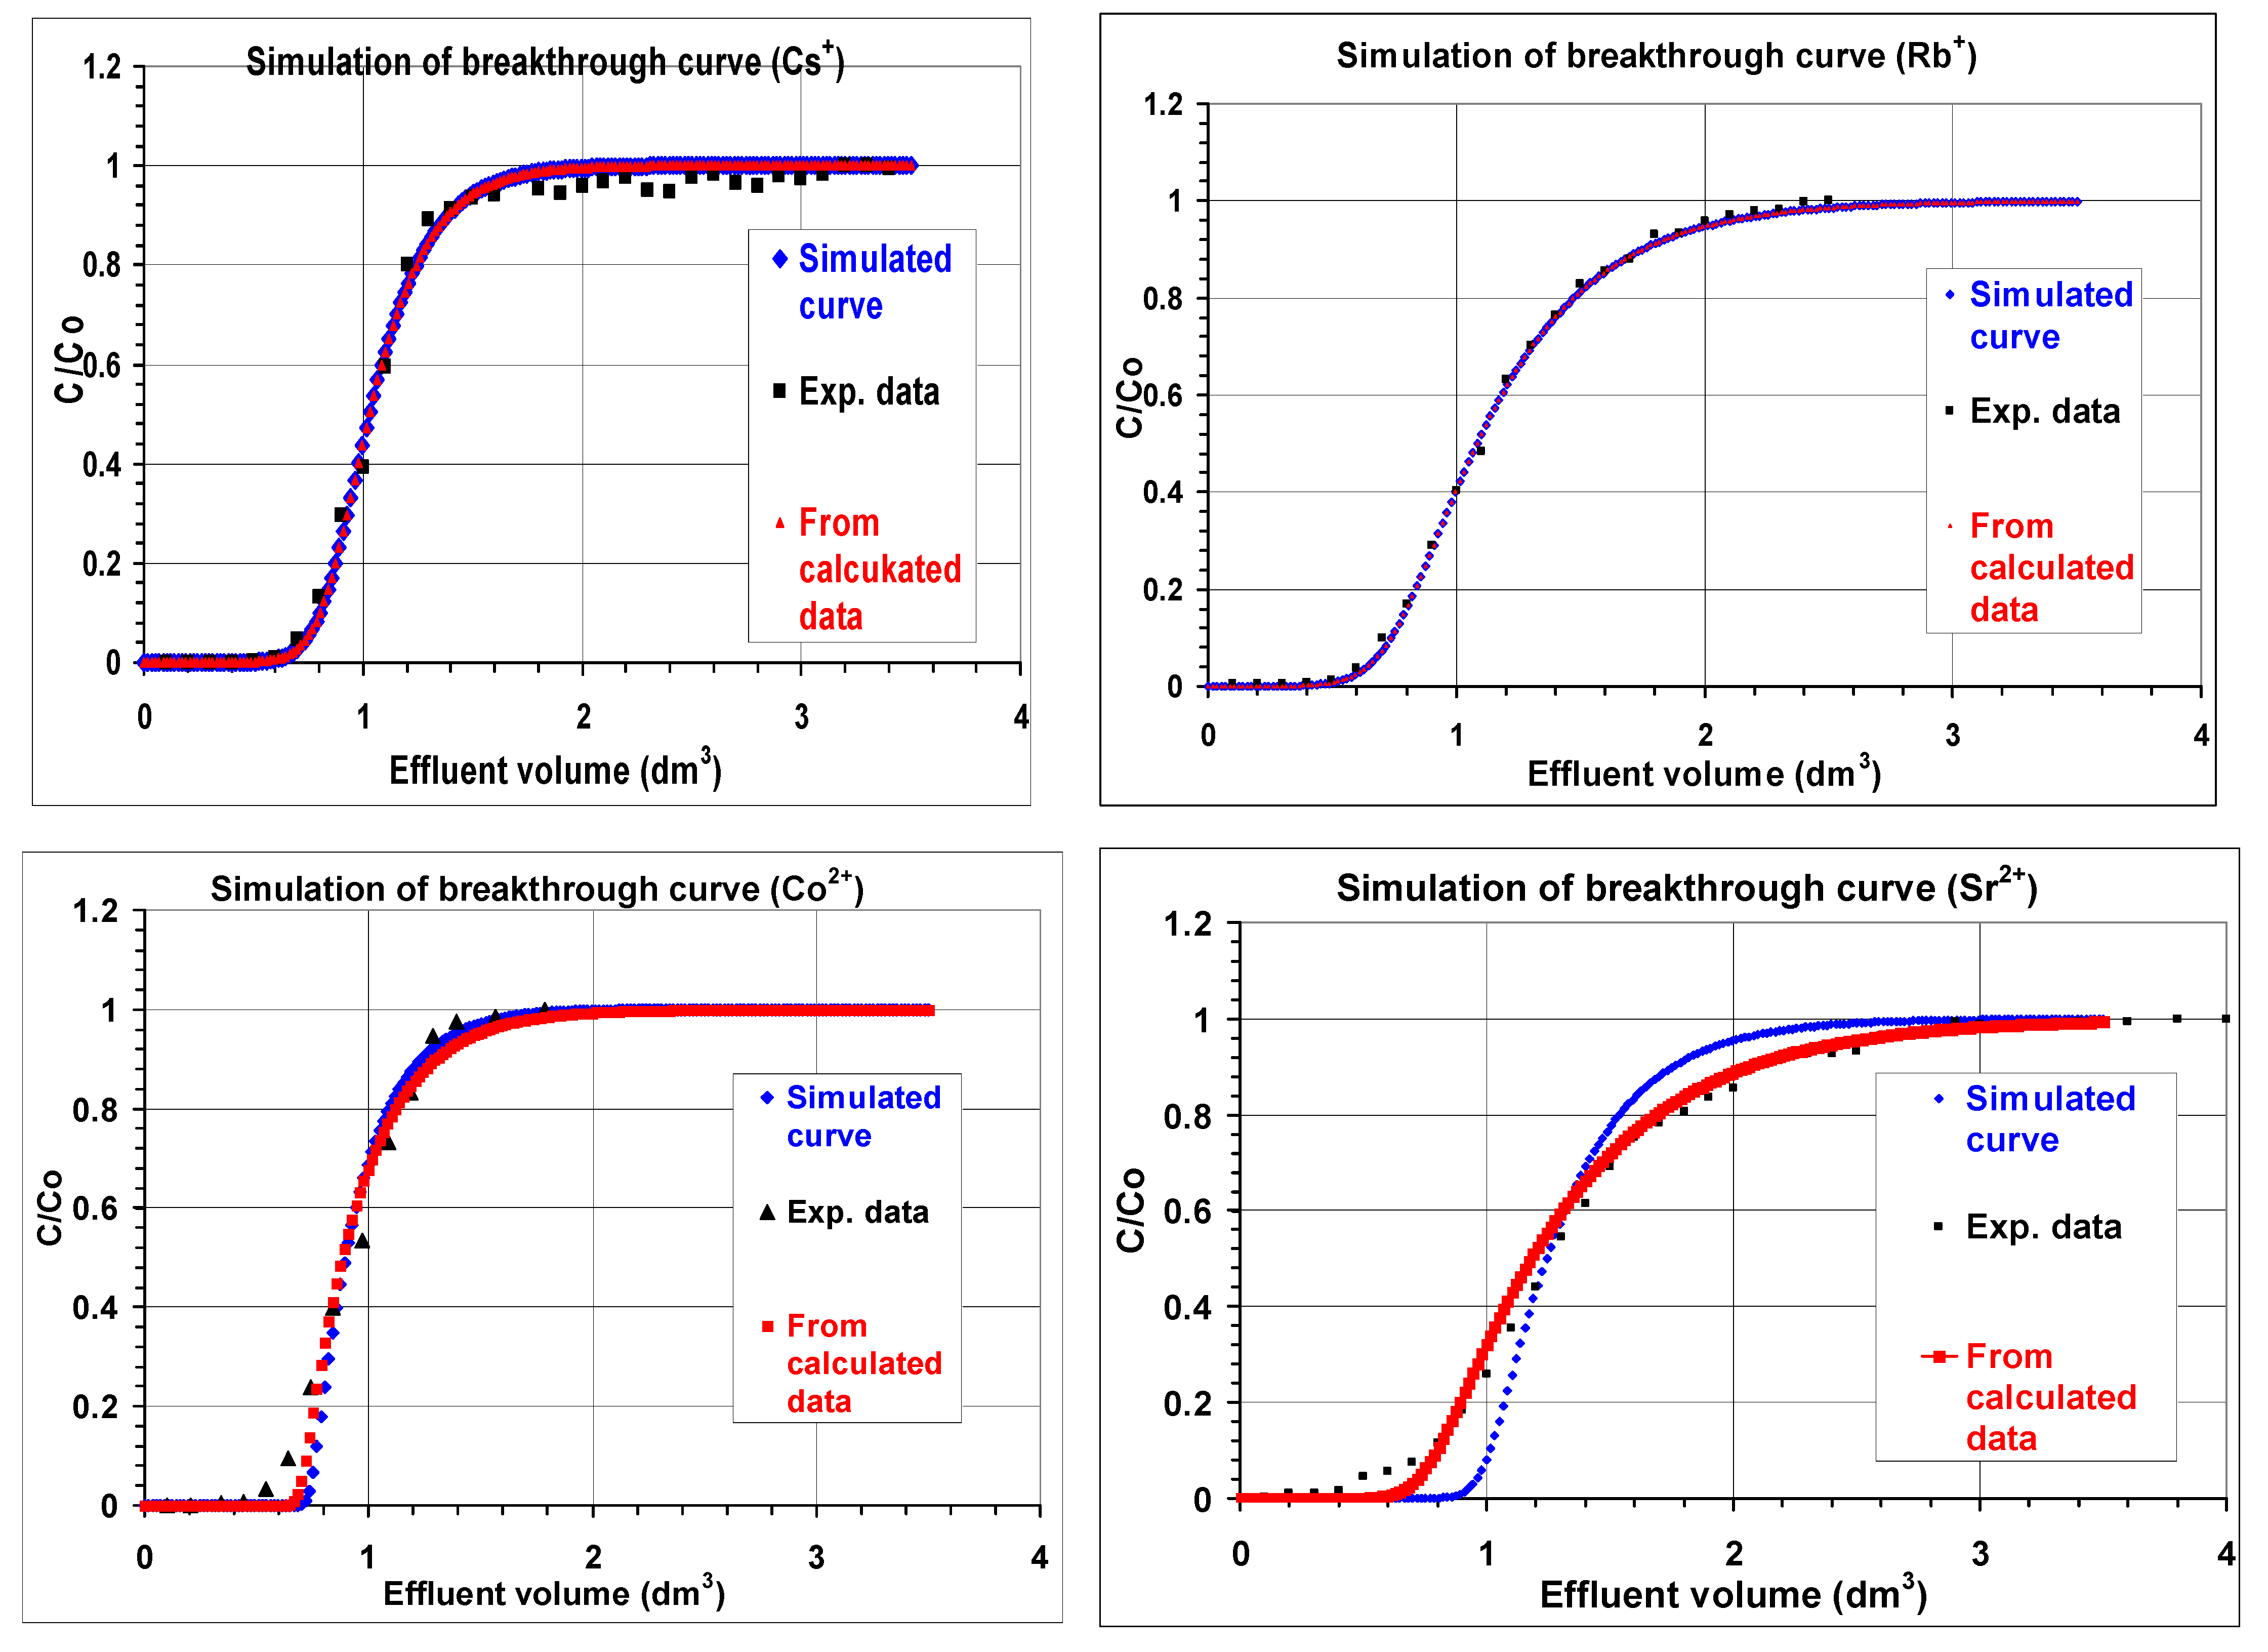
3.4.1. Dynamic Adsorption Simulation

In order to simulate dynamic fixed-bed adsorption breakthrough curves, we made the following basic assumptions: (i) the operating adsorption process was assumed to be isothermal; (ii) the liquid phase flowed according to an axial dispersion; (iii) the compressibility of the liquid phase was negligible; (iv) the liquid phase inside the pores was considered to be stationary and its flow was assumed not to be altered by movement of the mobile phase; (v) the brick bed was homogeneous and the brick particles were spherical in shape and uniform in size; and (vi) the liquid phase velocity, fluid flow rate, and column void fraction remained constant during the entire column experiment. In the modelling procedure, we further hypothesized that the adsorbate was first adsorbed on the external surface of the brick particle and then diffused inside the particle. The obtained thermodynamic equilibrium and kinetics data were used here from independent batch experiments with the aim of providing predictions of fixed-bed breakthrough behaviour (Table 4).
As the shape of the breakthrough curve depended on the adsorption equilibrium, intra-particle mass transfer, and hydrodynamic conditions, it was preliminarily necessary to determine the ideal operational conditions (such as adsorbent particle size, flow rate and input concentration) for optimizing the system and producing steep (or ideal) breakthrough curves for optimal column performance [84]. The optimization of breakthrough curves of cations was realized under well-defined experimental conditions, which are documented in Table 4. A mathematical model of fixed-bed adsorption (HSDM) was employed herein for the simulation of experimental breakthrough curves. The homogeneous surface diffusion model (HSDM; not detailed here) has been reported extensively in the past for describing the sorption dynamics of porous materials [103,104,105,106,107]. Simulating calculations were undertaken in the present work by using the fixed-bed adsorption simulation tool (FAST 2.1) [58]. Note that, from the FAST 2.1 software, mathematical formulations applying HSDM were based upon driving forces that did not separate pore diffusion from surface diffusion by fitting experimental breakthrough curve data. Figure 10 depicts experimental breakthrough curves corresponding to the dynamic adsorption of cations onto the brick composite. In the same figure, simulated breakthrough curves obtained from the HSDM model using FAST 2.1 software are represented as well.
Globally, the comparison of numerical results from the HSDM model with experimental data revealed relatively good model predictions. The numerical value of the diffusion coefficient obtained for each column study of element is provided in Table 4.
To summarize, the present work permitted us to simulate, in a single system, the adsorption dynamics of the ions Cs+, Rb+, Co2+, and Sr2+ on alkali-activated brick. Breakthrough curves of cationic adsorption experiments were successfully described from the HSDM model. The simulated values of diffusion parameters (kf and Ds) obtained from linear driving force approximation together with the Langmuir isotherm constant (KL) and maximum adsorption capacity (QAC) agreed well with those obtained experimentally under static (batch) operational conditions. The goodness-of-fit parameter then validated the successful prediction of experimental breakthrough curves and evidenced the predominance of surface diffusion for the studied cations. To support this, in the next paragraph, we calculate the different column dimensionless parameters which defined the shape of the breakthrough curve via adsorption dynamics, and use them to verify the importance of surface diffusion phenomena along the packed-brick pellets column.

3.4.2. Dimensionless Analysis of Diffusional Regimes

In the precedent paragraph, we employed the homogeneous surface diffusion model (HSDM) for simulating Na+/M+ (or 2Na+/M++) exchanges in the fixed-bed column and predicting the adsorption dynamics of nuclides. In the following section, we interpret dimensionless numbers relative to column operations (Biot, Bi; Stanton, St; solute distribution constant, Dg) with the aim of gaining information regarding the shapes of breakthrough curves and breakthrough times, as well as the types of diffusional regimes involved [105,108,109,110]. In this work, the dimensionless numbers Bi, St, and Dg (as defined in Section 2.9) were determined from experimental adsorption results for different elements in alkali-activated brick, and their values are listed in Table 4. Globally, characteristic dimensionless numbers ranged from 1091 to 5237 for Bi, from 162 to 256 for Dg, and from 296 to 778 for St. Ratio Ed = St/Bi was also considered in the dimensionless analysis, knowing that its implication on the adsorption process was directly related to the individual values of the Bi and St numbers. The very large values of Bi revealed that film mass transfer occurred very faster than internal diffusion, and hence, internal surface diffusion dominated the adsorption process. The high Biot number values also permitted us to better understand the influence of Ds on the dynamics of breakthrough curves. Indeed, since the obtained Bi values were high and Ds and Bi were inversely proportional, these should lead to low Ds values, as evidenced experimentally (Ds values ranging from 2.00 × 10⁻¹² to 6.66 × 10⁻¹² m2·s−1). Dimensionless analysis further confirmed the occurrence of slow diffusional regimes, which were characterized by smoothed wavefronts. Moreover, according to Pérez-Foguet and his co-workers [108], longer computational times are expected to be observed for large values of Dg in an elevated adsorbent medium. In the studied adsorption systems, as high time-scales were given by Dg, weak internal diffusions took place and significantly controlled the adsorption process. This finding was supported by the weak values of Ed, which also confirmed the involvement of slow adsorption diffusion.
The effective diffusion coefficients of the ions (Cs+, Rb+, Co2+, and Sr2+) adsorbed onto the brick-based composite were determined afterwards compared with published diffusion data relative to the mobility of these cations in industrial and natural minerals, like cements, clays, and clay rocks/soils (see Table 5).
Overall, one can conclude that the Deff values calculated here were within the range suggested for materials with close mineralogy, like cements alone, those associated with zeolites Na-A/Na-P [111,112,113,114,115], or even slag-blended geopolymers [115] (see Table 5).

3.4.3. Implication of the Connectivity of Pores on Ion Diffusivity

To evaluate the immobilization capacity of a binder toward nuclides, the physical barrier effect of the pore structure on ionic diffusivity ought to be taken into consideration [115]. For cementitious materials like ordinary Portland cement, fly ash-based geopolymers, and slag-blended geopolymers, it has previously been shown that the capillary porosity and connectivity of the capillary pores in porous media play a relevant role in ionic diffusion within these porous materials [115,120,121]. The capillary pores with pore diameters ranging from 10–50 to 10,000 nm [115,121] were indeed assumed to dominate the ionic transport processes in cementitious materials.
It has previously been suggested that the broad range of Deff observed in previous studies was mostly attributed to the variability of the porosity, capillary pore volume, and critical pore diameter, which control the ion diffusivity in cementitious materials [115]. In order to describe the connectivity of such porous solids, it was proposed to use the critical pore diameter as a key parameter representative of the highest proportion of interconnected pores, which would be mainly responsible for ion transport characteristics [115,121,122]. The critical pore diameter (or continuous pore diameter) was defined as the maximum of the Log differential pore volume, dV/dlog(diameter), versus the pore diameter curve. With this in mind, some investigations permitted us to correlate the critical pore diameter of the binder with the diffusivity behaviour of water-soluble ions such as caesium and strontium [115].
In order to appraise the physical barrier effect of treated brick on the diffusivity of caesium and strontium, we first attempted to attain the critical pore diameter of the brick composite. For this, the calculated dV/d(log d) term was plotted against the pore diameter, and the maximal dV/d(log d) value was determined, as shown in Figure 3c. We found ~50 nm (±10 nm). This value was comparable with that obtained for fly ash-based geopolymers (50–151 nm) and lower than those for fly ash/fly ash-based geopolymers (227–249 nm) and ordinary Portland cement (284 nm), but was much lower than that for fly ash/blast furnace slag-blended geopolymers (1567 nm) [115]. Taking into account the empirical linear equation expressing the critical pore diameter of the binder versus the diffusivity of water-soluble ions, which was established by Jang and his co-workers [115], we then evaluated the diffusion coefficient, Dsoluble, of water-soluble Cs+ and Sr2+ ions. We found Dsoluble = ~4 × 10⁻¹² and ~2 × 10⁻¹² m2·s−1, respectively. These values were somewhat lower than those calculated herein using different diffusion-based models (see Table 3). It could, however, be noted that, based either on the results from surface diffusion models (see Section 3.3) or those derived from the dependence of the connectivity of pores in cement-based materials upon the ion diffusion coefficient (as shown in this paragraph), the diffusion of strontium ions was found, in all cases, to be more difficult than that of caesium ions, which is in agreement, in most cases, with the findings of previous studies (see Table 5). Despite the slight discrepancy between the Dsoluble and Deff values determined for Cs+ and Sr2+, this study nevertheless permitted us to demonstrate the implication of hydrated entities of nuclides in the diffusion stages.
From these investigations, one could, therefore, ascertain that each of these elements still remained barely soluble or chemically unfixed to the brick matrix, meaning that the nuclide could be assumed to be adsorbed via hydration changes in the spherical shell of its cationic entity (as pointed out in Section 3.3) and transformed into an unfixed hydrate/complex. To validate this hypothesis, we recently performed a 133Cs analysis of Cs-doped composite samples and clearly evidenced the existence of (outer-sphere) hydrated-caesium complexes inside the zeolitic frameworks of the modified brick.

4. Conclusions

In the present work, the diffusional adsorption kinetics of the cations Cs+, Rb+, Co2+, and Sr2+ were investigated in single system. By applying the Weber–Morris model, mathematical treatment of the kinetics (batch) data evidenced a multi-step process with distinctive diffusion regimes that were linked to the pore size distribution of the material. W-M kinetic rate constants were found to be dependent on the following intrinsic characteristics of the hydrated cation: ionic potential; hydrated radius; B-viscosity parameter; and molar Gibbs energy of hydration of cations. By applying adequate diffusion models, a detailed mathematical analysis of the observed W-M kinetics stages allowed us to obtain the key diffusion parameters governing the successive diffusion regimes observed. The surface diffusion coefficient for each cation (Ds) was estimated from the mathematical expression relating it to both the pore diffusion coefficient (Dp) and effective diffusion coefficients (Deff). These calculations revealed the strong contribution of surface diffusion to the adsorption kinetics during the course of the second and third kinetics stages of the W-M model. It was noticed that the magnitude of the surface diffusion coefficient was strongly dependent upon the capacity of hydrated cationic species to lose water molecules when penetrating brick pores.
The HSDM model was used for describing and simulating (single) the adsorption of cations in a fixed-bed column under optimized operational conditions. A breakthrough curve simulation clearly indicated the predominance of surface diffusion in the intra-particle diffusion mechanism under fixed operational conditions, in agreement with a mathematical analysis of the (batch) adsorption kinetics data. The simulated (apparent) surface diffusion coefficients were found to be close to those calculated from diffusion-based models, which permitted us to validate the modelling procedure which was employed.
The capillary porosity and connectivity of the capillary pores in the modified brick were found to be relevant characteristics in the ionic diffusion of cations (Cs+ and Sr2+) within the porous structure, evidencing the immobilization of hydrated nuclides in the form of outer-sphere complexes.
Since artisanal gold mining activities are growing significantly in developing countries, mercury is being released at elevated levels to the environment. This led our research group to study mercury adsorption on alkali-activated brick. This work will permit future projects to implement dynamic water treatment systems in poor regions, which would be capable of eliminating this toxic metal from immediate contaminated waters and of obtaining potable water for the local population efficiently and at a low cost. Furthermore, experiments regarding the adsorption capability of alkali-activated brick toward soluble uranium species present in waters contaminated by uranium extraction mines in the Central African Republic are also underway in the laboratory.

5. Future Prospects

The brick composite represents a novel alkali-activated binder for immobilizing radio elements. Its low Si/Al ratio contributes to an abundance of negative surface charges, facilitating ionic exchanges between Na+ ions at the solid surface and radioactive ions (Cs+, Rb+, Co2+, and Sr2+) in the aqueous phase. The knowledge obtained herein on the diffusion behaviour of these ions inside brick frameworks will help us to better understand nuclear waste immobilization and nuclear radiation shielding after calcination or vitrification. Studies are underway to assess the state of the immobilized radio elements and to follow their degree of encapsulation inside composite frameworks under the effects of high temperatures. For this purpose, by using time-of-flight secondary ion mass spectrometry (ToF-SIMS) combined with sputter depth profiling, we propose the analysis of encapsulated atoms by establishing depth distribution of radioactive atoms inside brick specimens via ionic Bi3+ bombardment at different durations. Layer-by-layer sputtering will permit the reconstruction of radioactive element distribution by sample depth, as well as the interpretation of leaching behaviour in aggressive media. Using a similar approach, we also propose the micro-analysis of brick composite surfaces with depth using X-ray photoelectron spectroscopy. At the same time, we propose an examination of the chemical and structural transformations of brick composite matrices under the effects of elevated temperatures using X-ray diffraction, solid nuclear magnetic resonance and vibrational spectroscopies, and scanning electron microscopy.
Studies regarding zeolite-geopolymeric transformations of brick under variable alkaline conditions are also underway in the laboratory. This would permit us to determine the amount of extra-framework cations (Na+) or “active” negatively charged sites, as well as to examine the evolution of porosity with changes in the alkalinity and synthesis time. The objective of this work would be mainly to produce better green, economical, and hierarchically porous materials from brick, with the aim of facilitating the accessibility of more active surface sites for radionuclides through more interconnected meso- and microporous channels, and thereby to increase adsorption capacity.
On the other hand, our research group recently revealed the adsorption characteristics of a modified brick, which was coated with ferrihydrite, for removing endocrine-disrupting chemicals bisphenol A (BPA) and 4-nonyl phenol (NP), as well as hormones (17α-ethynylestradiol, testosterone, and estrone), from contaminated waters [123,124]. In the laboratory, special emphasis is now placed on attempts to eliminate organic micro-pollutants such as phthalates, polychlorinated biphenyl (PCB), pesticides, and polycyclic aromatic hydrocarbons (PAHs) from water using alkali-activated brick as the adsorbent.

Supplementary Materials

The following supporting information can be downloaded at: https://www.mdpi.com/article/10.3390/app14083511/s1, Figure S1: Plotting of the adsorption capacity (Qt, in µmol·g−1) against t1/2. Application of Weber-Morris kinetics model to adsorption kinetics of metallic cations (Pb2+, Ni2+, Zn2+, Cd2+, Fe2+, Cu2+ and Mn2+) on to brick composite in aqueous medium. Table S1: Values of ionic potential, Jones-Dole viscosity coefficient (B), and hydrated radius for Sr2+, Cs+ and Rb+ ions and some metallic cations. Intra-particle diffusion rate constants, kipd(i), determined for adsorption kinetics of these cations on the brick-based composite; Table S2: The infinite dilution diffusion coefficients for cation (Cs+, Rb+, Co2+ or Sr2+) and anion (NO3), and the ionic diffusivity of these ions; Table S3: Values of surface-diffusion coefficient (Ds) and molar Gibbs energy of hydration of cation, M+ or M2+ (ΔGH) used for drawing Figure 9.

Author Contributions

Conceptualization: A.B., N.P., G.D., O.A. and M.W.; methodology: A.B., N.P., G.D., O.A. and M.W.; formal analysis: A.B., G.D., N.P., O.A. and M.W.; investigation: A.B. and M.W.; resources: A.B. and M.W.; data curation: A.B., G.D., N.P., O.A. and M.W.; writing—original draft preparation: A.B.; writing—review and editing: A.B.; supervision: A.B. and M.W.; project administration: M.W.; funding acquisition: M.W. All authors have read and agreed to the published version of the manuscript.

Funding

This research received no external funding.

Institutional Review Board Statement

Not applicable.

Informed Consent Statement

Not applicable.

Data Availability Statement

The original contributions presented in the study are included in the article and Supplementary Materials, further inquiries can be directed to the corresponding author.

Acknowledgments

Scientific works were undertaken successfully owing to the cooperation between the University of Lille (France) and the University of Bangui (Central African Republic). This collaboration (being still underway) and the Grant-in-Aid to Gildas Doyemet for doctoral thesis preparation is financially supported by the Embassy of France to Bangui. Scanning electron microscopy studies were undertaken in laboratory UMR LOG 8187 at the Department of Earth Sciences (Villeneuve d’Ascq 59655, France). The authors gratefully thank Sandra Vantalon (Study Engineer) for carrying out surface analyses of solid samples by ESEM/EDS at the Faculty of Earth Sciences (Lille). Also, the authors gratefully thank: (i) David Dumoulin (Chemical Engineer) and Véronique Alaimo (Chemical Technician) for analyzing liquid samples using ICP-OES and ICP-MS at the Chevreul Institute (Lille); (ii) Viviane Roumazeilles (Research Director) for recording X-ray diffractograms and helping us to characterize crystalline forms in treated materials at the Laboratory of Oceanology and Geosciences, CNRS UMR 8187 (Lille); and (iii) Olivier Gardoll (study engineer) at the Unity of Catalysis and Solid Chemistry, UCCS UMR CNRS 8181 (Lille).

Conflicts of Interest

The authors declare no conflict of interest.

References

  1. Miller, S.A.; Horvath, A.; Monteiro, P.J.M. Readily implementable techniques can cut annual CO2 emissions from the production of concrete by over 20%. Environ. Res. Lett. 2016, 11, 74029. [Google Scholar] [CrossRef]
  2. Arokiasamy, P.; Al Bakri Abdullah, M.M.; Zamree Abd Rahim, S.; Sadique, M.; Yun Ming, L.; Anuar Mohd Salleh, M.A.; Arif Zainol, M.R.R.M.; Ruzaidi Ghazali, C.M. Diverse material based geopolymer towards heavy metals removal: A review. J. Mater. Res. Technol. 2023, 22, 126–156. [Google Scholar] [CrossRef]
  3. Abdel Salam, M.; Mokhtar, M.; Albukhari, S.M.; Baamer, D.F.; Palmisano, L.; AlHammadi, A.A.; Abukhadra, M.R. Synthesis of zeolite/geopolymer composite for enhanced sequestration of phosphate (PO43−) and ammonium (NH4+) ions; equilibrium properties and realistic study. J. Environ. Manag. 2021, 300, 113723. [Google Scholar] [CrossRef] [PubMed]
  4. Minelli, M.; Papa, E.; Medri, V.; Miccio, F.; Benito, P.; Doghieri, F.; Landi, E. Characterization of novel geopolymer—Zeolite composites as solid adsorbents for CO2 capture. Chem. Eng. J. 2018, 341, 505–515. [Google Scholar] [CrossRef]
  5. Onutai, S.; Sato, J.; Osugi, T. Possible pathway of zeolite formation through alkali activation chemistry of metakaolin for geopolymer–zeolite composite materials: ATR-FTIR study. J. Solid State Chem. 2023, 319, 123808. [Google Scholar] [CrossRef]
  6. Proust, V.; Gossard, A.; Schaeperkoetter, J.; Vannier, S.; David, T.; Barr, Y.; Misture, S.; Grandjean, A.; zur Loye, A.C. Design and characterization of hierarchical aluminosilicate composite materials for Cs entrapment: Adsorption efficiency tied to microstructure. J. Water Process Eng. 2023, 51, 103381. [Google Scholar] [CrossRef]
  7. Xu, G.; Shi, X. Characteristics and applications of fly ash as a sustainable construction material: A state-of-the-art review. Resour. Conserv. Recycl. 2018, 136, 95–109. [Google Scholar] [CrossRef]
  8. Freire, A.L.; Jorge José, H.; de Fatima, R.; Moreira, P.M. Potential applications for geopolymers in carbon capture and storage. Int. J. Greenh. Gas Control 2022, 118, 103687. [Google Scholar] [CrossRef]
  9. Elgarahy, A.M.; Maged, A.; Eloffy, M.G.; Zahran, M.; Kharbish, S.; Elwakeel, K.Z.; Bhatnagar, A. Geopolymers as sustainable eco-friendly materials: Classification, synthesis routes, and applications in wastewater treatment (Review). Sep. Purif. Technol. 2023, 324, 124631. [Google Scholar] [CrossRef]
  10. Luo, Z.; Zhi, T.; Liu, L.; Mi, J.; Zhang, M.; Tian, C.; Si, Z.; Liu, X.; Mu, Y. Solidification/ stabilization of chromium slag in red mud-based geopolymer. Constr. Build. Mater. 2022, 316, 125813. [Google Scholar] [CrossRef]
  11. Boughriet, A.; Allahdin, O.; Poumaye, N.; Tricot, G.; Revel, B.; Lesven, L.; Wartel, M. Micro-Analytical Study of a Zeolites/Geo-Polymers/Quartz Composite, Dielectric Behaviour and Contribution to Brønsted Sites Affinity. Ceramics 2022, 5, 908–927. [Google Scholar] [CrossRef]
  12. Boughriet, A.; Allahdin, O.; Poumaye, N.; Doyemet, G.; Tricot, G.; Revel, B.; Ouddane, B.; Wartel, M. Alkali-Activated Brick Aggregates as Industrial Valorized Wastes: Synthesis and Properties. Ceramics 2023, 6, 1765–1787. [Google Scholar] [CrossRef]
  13. Hossain, S.S.; Akhtar, F. Recent progress of geopolymers for carbon dioxide capture, storage and conversion. J. CO2 Util. 2023, 78, 102631. [Google Scholar] [CrossRef]
  14. Lopes Freire, A.; Moura-Nickel, C.D.; Scaratti, G.; De Rossi, A.; Araújo, M.H.; De Noni Júnior, A.; Egídio Rodrigues, A.; Rodríguez Castellon, E.; de, F. Peralta Muniz Moreira, R. Geopolymers produced with fly ash and rice husk ash applied to CO2 capture. J. Clean. Prod. 2020, 273, 122917. [Google Scholar] [CrossRef]
  15. Matalkah, F.; Soroushian, P. Role of CO2 in enhancing geopolymer properties formulated with fluidized bed combustion ash. J. CO2 Util. 2023, 71, 102462. [Google Scholar] [CrossRef]
  16. Miccio, F.; Natali Murri, A.; Landi, E. Synthesis and characterization of geopolymer oxygen carriers for chemical looping combustion. Appl. Energy 2017, 194, 136–147. [Google Scholar] [CrossRef]
  17. Bendoni, R.; Miccio, F.; Medri, V.; Landi, E. Chemical looping combustion using geopolymer-based oxygen carriers. Chem. Eng. J. 2018, 341, 187–197. [Google Scholar] [CrossRef]
  18. Natali Murri, A.; Miccio, F.; Medri, V.; Landi, E. Geopolymer-composites with thermomechanical stability as oxygen carriers for fluidized bed chemical looping combustion with oxygen uncoupling. Chem. Eng. J. 2020, 393, 124756. [Google Scholar] [CrossRef]
  19. El Alouani, M.; Saufi, H.; Moutaoukil, G.; Alehyen, S.; Nematollahi, B.; Belmaghraoui, W.; Taibi, M. Application of geopolymers for treatment of water contaminated with organic and inorganic pollutants: State-of-the-art review. J. Environ. Chem. Eng. 2021, 9, 105095. [Google Scholar] [CrossRef]
  20. Ettahiri, Y.; Bouargane, B.; Fritah, K.; Akhsassi, B.; Pérez-Villarejo, L.; Aziz, A.; Bouna, L.; Benlhachemi, A.; Novais, R.M. A state-of-the-art review of recent advances in porous geopolymer: Applications in adsorption of inorganic and organic contaminants in water. Constr. Build. Mater. 2023, 395, 132269. [Google Scholar] [CrossRef]
  21. Novais, R.M.; Seabra, M.P.; Labrincha, J.A. Porous geopolymer spheres as novel pH buffering materials. J. Clean. Prod. 2017, 143, 1114–1122. [Google Scholar] [CrossRef]
  22. Ascensao, G.; Seabra, M.P.; Aguiar, J.B.; Labrincha, J.A. Red mud-based geo- ~ polymers with tailored alkali diffusion properties and pH buffering ability. J. Clean. Prod. 2017, 148, 23–30. [Google Scholar] [CrossRef]
  23. Petlitckaia, S.; Barré, Y.; Piallat, T.; Grauby, O.; Ferry, D.; Poulesquen, A. Functionalized geopolymer foams for cesium removal from liquid nuclear waste. J. Clean. Prod. 2020, 269, 122400. [Google Scholar] [CrossRef]
  24. Mukiza, E.; Tri Phung, Q.; Frederickx, L.; Jacques, D.; Seetharam, S.; De Schutter, G. Co-immobilization of cesium and strontium containing waste by metakaolin-based geopolymer: Microstructure, mineralogy and mechanical properties. J. Nucl. Mater. 2023, 585, 154639. [Google Scholar] [CrossRef]
  25. Xu, M.; He, Y.; Wang, C.; He, X.; He, X.; Liu, J.; Cui, X. Preparation and characterization of a self-supporting inorganic membrane based on metakaolin-based geopolymers. Appl. Clay Sci. 2015, 115, 254–259. [Google Scholar] [CrossRef]
  26. Chen, H.; Zhang, Y.J.; He, P.Y.; Li, C.J.; Li, H. Coupling of self-supporting geopolymer membrane with intercepted Cr(III) for dye wastewater treatment by hybrid photocatalysis and membrane separation. Appl. Surf. Sci. 2020, 515, 146024. [Google Scholar] [CrossRef]
  27. Filipponi, A.; Masi, G.; Bandini, S.; Chiara Bignozzi, M. Preparation and characterization of metakaolin-based geopolymer membrane supports by facile pressed one-part route. Ceram. Int. 2023, 49, 6834–6842. [Google Scholar] [CrossRef]
  28. Gier Della Rocca, D.; De Noni Júnior, A.; Rodríguez-Aguado, E.; Aparecida Peralta, R.; Rodríguez-Castellon, E.; Li Puma, G.; Moreira, R.F.P.M. Mechanistic insights on the catalytic ozonation of trimethoprim in aqueous phase using geopolymer catalysts produced from mining waste. J. Environ. Chem. Eng. 2023, 11, 111163. [Google Scholar] [CrossRef]
  29. Supamathanon, N.; Boonserm, K.; Osakoo, N.; Wittayakun, J.; Prayoonpokarach, S.; Chanlek, N.; Dungkaew, W. Potassium supported on zeolite-geopolymer hybrid materials as a new solid base catalyst for transesterification of soybean oil. Renew. Energy 2023, 202, 1460–1469. [Google Scholar] [CrossRef]
  30. Zhang, Y.J.; Han, Z.C.; He, P.Y.; Chen, H. Geopolymer-based catalysts for cost-effective environmental governance: A review based on source control and end-of-pipe treatment. J. Clean. Prod. 2020, 263, 121556. [Google Scholar] [CrossRef]
  31. Barbarey, M.S.; El-Sayed Seleman, M.M.; El Kheshen, A.A.; Zawrah, M.F. Utilization of ladle furnace slag for fabrication of geopolymer: Its application as catalyst for biodiesel production. Constr. Build. Mater. 2024, 411, 134226. [Google Scholar] [CrossRef]
  32. Ettahiri, Y.; Akhsassi, B.; El Fazdoune, M.; Bouddouch, A.; Bouna, L.; Benlhachemi, A.; Pérez-Villarejo, L.; Peralta Muniz Moreira, R.F. From synthesis to applications: A comprehensive review of geopolymer materials for photocatalytic degradation of organic pollutants. Sep. Purif. Technol. 2024, 330, 125396. [Google Scholar] [CrossRef]
  33. Chen, S.; Ruan, S.; Zeng, Q.; Liu, Y.; Zhang, M.; Tian, Y.; Yan, D. Pore structure of geopolymer materials and its correlations to engineering properties: A review. Constr. Build. Mater. 2022, 328, 127064. [Google Scholar] [CrossRef]
  34. Papa, E.; Minelli, M.; Chiara Marchioni, M.; Landi, E.; Miccio, F.; Murri, A.N.; Benito, P.; Vaccari, A.; Medri, V. Metakaolin-based geopolymer—Zeolite NaA composites as CO2 adsorbents. Appl. Clay Sci. 2023, 237, 106900. [Google Scholar] [CrossRef]
  35. Abdelwahab, O.; Thabet, W.M. Natural zeolites and zeolite composites for heavy metal removal from contaminated water and their applications in aquaculture Systems: A review. Egypt. J. Aquat. Res. 2023, 49, 431–443. [Google Scholar] [CrossRef]
  36. Rakanovic, M.; Vukojevic, A.; Savanovic, M.M.; Armakovic, S.; Pelemiš, S.; Živic, F.; Sladojevic, S.; Armakovic, S.J. Zeolites as Adsorbents and Photocatalysts for Removal of Dyes from the Aqueous Environment. Molecules 2022, 27, 6582. [Google Scholar] [CrossRef] [PubMed]
  37. Ghorbani, M.; Amirahmadi, E.; Konvalina, P.; Moudrý, J.; Bárta, J.; Kopecký, M.; Ionut Teodorescu, R.; Bucur, R.D. Comparative Influence of Biochar and Zeolite on Soil Hydrological Indices and Growth Characteristics of Corn (Zea mays L.). Water 2022, 14, 3506. [Google Scholar] [CrossRef]
  38. Jeon, H.; Seok, J.; Ha, Y.; Kim, J.C.; Cho, H.S.; Yang, H.M.; Choi, M. First successful synthesis of an Al-rich mesoporous aluminosilicate for fast radioactive strontium capture. J. Hazard. Mater. 2023, 451, 131136. [Google Scholar] [CrossRef] [PubMed]
  39. Yang, S.; Yang, L.; Gao, M.; Bai, H.; Nagasaka, T. Synthesis of zeolite-geopolymer composites with high zeolite content for Pb (II) removal by a simple two-step method using fly ash and metakaolin. J. Clean. Prod. 2022, 378, 134528. [Google Scholar] [CrossRef]
  40. Kwon, S.; Kim, C.; Han, E.; Lee, H.; Cho, H.S.; Choi, M. Relationship between zeolite structure and capture capability for radioactive cesium and strontium. J. Hazard. Mater. 2021, 408, 124419. [Google Scholar] [CrossRef]
  41. Lahnafi, A.; Elgamouz, A.; Jaber, L.; Tijani, N.; Kawde, A. NaA zeolite-clay composite membrane formulation and its use as cost-effective water softener. Microporous Mesoporous Mater. 2023, 348, 112339. [Google Scholar] [CrossRef]
  42. Rozek, P.; Krol, M.; Mozgawa, W. Geopolymer-zeolite composites: A review. J. Clean. Prod. 2019, 230, 557–579. [Google Scholar] [CrossRef]
  43. Roshanfekr Rad, L.; Anbia, M. Zeolite-based composites for the adsorption of toxic matters from water: A review. J. Environ. Chem. Eng. 2021, 9, 106088. [Google Scholar] [CrossRef]
  44. Ren, Z.; Wang, L.; Li, Y.; Zha, J.; Tian, G.; Wang, F.; Zhang, H.; Liang, J. Synthesis of zeolites by in-situ conversion of geopolymers and their performance of heavy metal ion removal in wastewater: A review. J. Clean. Prod. 2022, 349, 131441. [Google Scholar] [CrossRef]
  45. Yoldi, M.; Fuentes-Ordoñez, E.G.; Korili, S.A.; Gil, A. Zeolite synthesis from industrial wastes. Microporous Mesoporous Mater. 2019, 287, 183–191. [Google Scholar] [CrossRef]
  46. Lee, W.H.; Lin, Y.W.; Lin, K.L. Parameter optimization, characterization, and crystallization mechanisms underlying the synthesis of zeolite A using liquid crystal display waste glass and sandblasting waste as alternative raw materials. J. Environ. Chem. Eng. 2022, 10, 108506. [Google Scholar] [CrossRef]
  47. Sayehi, M.; Delahay, G.; Tounsi, H. Synthesis and characterization of eco-friendly materials zeolite from waste glass and aluminium scraps using the hydrothermal technique. J. Environ. Chem. Eng. 2022, 10, 108561. [Google Scholar] [CrossRef]
  48. Lin, S.; Jiang, X.; Zhao, Y.; Yan, J. Zeolite greenly synthesized from fly ash and its resource utilization: A review. Sci. Total Environ. 2022, 851, 158182. [Google Scholar] [CrossRef] [PubMed]
  49. Gao, S.; Peng, H.; Song, B.; Zhang, J.; Wu, W.; Vaughan, J.; Zardo, P.; Vogrin, J.; Tulloch, S.; Zhu, Z. Synthesis of zeolites from low-cost feeds and its sustainable environmental applications. J. Environ. Chem. Eng. 2023, 11, 108995. [Google Scholar] [CrossRef]
  50. Allahdin, O.; Poumaye, N.; Wartel, M.; Boughriet, A. Removal of (natural and radioactive) cobalt by synthetic zeolites from brick: Adsorption isotherm, mechanism, and performance (in batch and column). Int. J. Sci. Res. Methodol. 2021, 19, 41–70. [Google Scholar]
  51. Allahdin, O.; Poumaye, N.; Wartel, M.; Boughriet, A. Radionuclide Basics: Cobalt-60, US EPA, U.S. Environmental Protection Agency. Available online: https://19january2017snapshot.epa.gov/radiation (accessed on 19 January 2017).
  52. Eun, S.; Ryu, J.; Kim, H.; Hong, H.; Kim, S. Simultaneous removal of radioactive cesium and strontium from seawater using a highly efficient Prussian blue-embedded alginate aerogel. J. Environ. Manag. 2021, 297, 113389. [Google Scholar] [CrossRef] [PubMed]
  53. Wang, B.; Moynier, F.; Jackson, M.G.; Huang, F.; Hu, X.; Ari Halldorsson, S.; Dai, W.; Devos, G. Rubidium isotopic fractionation during magmatic processes and the composition of the bulk silicate Earth. Geochim. Cosmochim. Acta 2023, 354, 38–50. [Google Scholar] [CrossRef]
  54. Smith, J.P.; Boyd, T.J.; Cragan, J.; Ward, M.C. Dissolved rubidium to strontium ratio as a conservative tracer for wastewater effluent-sourced contaminant inputs near a major urban wastewater treatment plant. Water Res. 2021, 205, 117691. [Google Scholar] [CrossRef]
  55. Nebel, O.; Scherer, E.E.; Mezger, K. Evaluation of the 87Rb decay constant by age comparison against the U-Pb system. Earth Planet. Sci. Lett. 2011, 301, 1–8. [Google Scholar] [CrossRef]
  56. Zhang, X.; Gu, P.; Liu, Y. Decontamination of radioactive wastewater: State of the art and challenges forward. Chemosphere 2019, 215, 543–553. [Google Scholar] [CrossRef] [PubMed]
  57. Largitte, L.; Pasquier, R. A review of the kinetics adsorption models and their application to the adsorption of lead by an activated carbon. Chem. Eng. Res. Des. 2016, 109, 495–504. [Google Scholar] [CrossRef]
  58. Schimmelpfennig, S.; Sperlich, A. FAST Fixed-Bed Adsorption Simulation Tool (Version 2.1 Beta); Leibniz-Institute of Freshwater Ecology and Inland Fisheries, Department of Ecohydrology: Berlin, Germany, 2011. [Google Scholar]
  59. Allahdin, O.; Wartel, M.; Tricot, G.; Revel, B.; Boughriet, A. Hydroxylation and dealumination of a metakaolinite-rich brick under acid conditions, and their influences on metal adsorption: One- and two-dimensional (1H, 27Al, 23Na, 29Si) MAS NMR, and FTIR studies. Microporous Mesoporous Mater. 2016, 226, 360–368. [Google Scholar] [CrossRef]
  60. Poumaye, N.; Allahdin, O.; Tricot, G.; Revel, B.; Billon, G.; Recourt, P.; Wartel, M.; Boughriet, A. MAS NMR investigations on a metakaolinite-rich brick after zeolitization by alkaline treatments. Microporous Mesoporous Matererials 2019, 277, 1–9. [Google Scholar] [CrossRef]
  61. Allahdin, O.; Wartel, M.; Recourt, P.; Revel, B.; Ouddane, B.; Billon, G.; Mabingui, J.; Boughriet, A. Adsorption capacity of iron oxyhydroxide-coated brick for cationic metals and nature of ion surface interactions. Appl. Clay Sci. 2014, 90, 141–149. [Google Scholar] [CrossRef]
  62. Weber, W.J.; Morris, J.C. Kinetics of adsorption on carbon from solutions. J. Sanit. Eng. Div. Am. Soc. Civ. Eng. 1963, 89, 31–60. [Google Scholar] [CrossRef]
  63. Yao, C.; Chen, T. A new simplified method for estimating film mass transfer and surface diffusion coefficients from batch adsorption kinetic data. Chem. Eng. J. 2015, 265, 93–99. [Google Scholar] [CrossRef]
  64. Leyva-Ramos, R.; Geankoplis, C.J. Model simulation and analysis of surface diffusion of liquids in porous solids. Chem. Eng. Sci. 1985, 40, 799–807. [Google Scholar] [CrossRef]
  65. Cussler, E.L. Diffusion: Mass Transfer in Fluid Systems, 3rd ed.; Cambridge University Press: Cambridge, UK, 2009; p. 647. [Google Scholar]
  66. Treacy, M.M.J.; Higgins, J.B. Collection of Simulated XRD Powder Patterns for Zeolites, 5th revised ed.; Elsevier: New York, NY, USA, 2007. [Google Scholar] [CrossRef]
  67. García-Martínez, J.; Cazorla-Amoros, D.; Linares-Solano, A. Further evidences of the usefulness of CO2 adsorption to characterize microporous solids. Stud. Surf. Sci. Catal. 2000, 128, 485–494. [Google Scholar] [CrossRef]
  68. Mgbemere, H.E.; Ekpe, I.C.; Lawal, G.I. Zeolite Synthesis, Characterization and Application Areas: A Review. Int. Res. J. Environ. Sci. 2017, 6, 45–59. [Google Scholar]
  69. Dong, J.H.; Lin, Y.S. In situ synthesis of P-type zeolite membranes on porous α-alumina supports. Ind. Eng. Chem. Res. 1998, 37, 2404–2409. [Google Scholar] [CrossRef]
  70. Breck, D. Zeolite Molecular Sieves; John Wiley & Sons: New York, NY, USA, 1974; p. 771. [Google Scholar] [CrossRef]
  71. Pal, P.; Das, J.K.; Das, N.; Bandyopadhyay, S. Synthesis of NaP zeolite at room temperature and short crystallization time by sonochemical method. Ultrason. Sonochem. 2013, 20, 314–321. [Google Scholar] [CrossRef] [PubMed]
  72. Sathupunya, M.; Glari, E.; Wongkasemjit, S. ANA and GIS zeolite synthesis directly from alumatrane and silatrane by sol-gel process and microwave technique. J. Eur. Ceram. Soc. 2002, 22, 2305–2314. [Google Scholar] [CrossRef]
  73. Zubowa, H.L.; Kosslick, H.; Müller, D.; Richter, M.; Wilde, L.; Fricke, R. Crystallization of phase-pure zeolite NaP from MCM-22-type gel compositions under microwave radiation. Microporous Mesoporous Mater. 2008, 109, 542–548. [Google Scholar] [CrossRef]
  74. Khabuanchalad, S.; Khemthong, P.; Prayoonpokarach, S.; Wittayakun, J. Transformation of zeolite NaY synthesized from rice husk silica to NaP during hydrothermal synthesis. Suranaree J. Sci. Technol. 2008, 15, 225–231. [Google Scholar]
  75. Behin, J.; Kazemian, H.; Rohani, S. Sonochemical synthesis of zeolite NaP from clinoptilolite. Ultrason. Sonochem. 2016, 28, 400–408. [Google Scholar] [CrossRef]
  76. Seliem, M.K.; Kormarneni, S. Equilibrium and kinetic studies for dissociation of iron from aqueous solution by synthetic Na-A zeolites: Statistical modelling and optimization. Microporous Mesoporous Mater. 2016, 228, 266–274. [Google Scholar] [CrossRef]
  77. Tontisirin, S. Synthesis and characterization of co-crystalline zeolite composite of LSX/A. Microporous Mesoporous Mater. 2017, 239, 123–129. [Google Scholar] [CrossRef]
  78. Thommes, M.; Kaneko, K.; Neimark, A.; Olivier, J.; Rodriguez-Reinoso, F.; Rouquerol, J.; Sing, K. Physisorption of gases, with special reference to the evaluation of surface area and pore size distribution (IUPAC Technical Report). Pure Appl. Chem. 2015, 87, 1051–1069. [Google Scholar] [CrossRef]
  79. Xiong, W.; Zeng, G.; Yang, Z.; Zhou, Y.; Zhang, C.; Cheng, M.; Liu, Y.; Hu, L.; Wan, J.; Zhou, C.; et al. Adsorption of tetracycline antibiotics from aqueous solutions on nanocomposite multi-walled carbon nanotube functionalized MIL-53(Fe) as new adsorbent. Sci. Total Environ. 2018, 627, 235–244. [Google Scholar] [CrossRef] [PubMed]
  80. Li, W.; Ji, W.; Yılmaz, M.; Zhang, T.C.; Yuan, S. One-Pot synthesis of MWCNTs/Fe-MOFs nanocomposites for enhanced adsorption of As(V) in aqueous solution. Appl. Surf. Sci. 2023, 609, 155304. [Google Scholar] [CrossRef]
  81. Poumaye, N.; Allahdin, O.; Lesven, L.; Wartel, M.; Boughriet, A. Isothermal modelling of Cd 2+, Co2+, Fe2+, Mn2+, Ni2+, Pb2+ and Zn2+ adsorptions onto zeolitized Brick: Importance of thermodynamic and physical characteristics of cationic metals in the process. Glob. J. Mater. Sci. Eng. 2021, 3, 1–11. [Google Scholar]
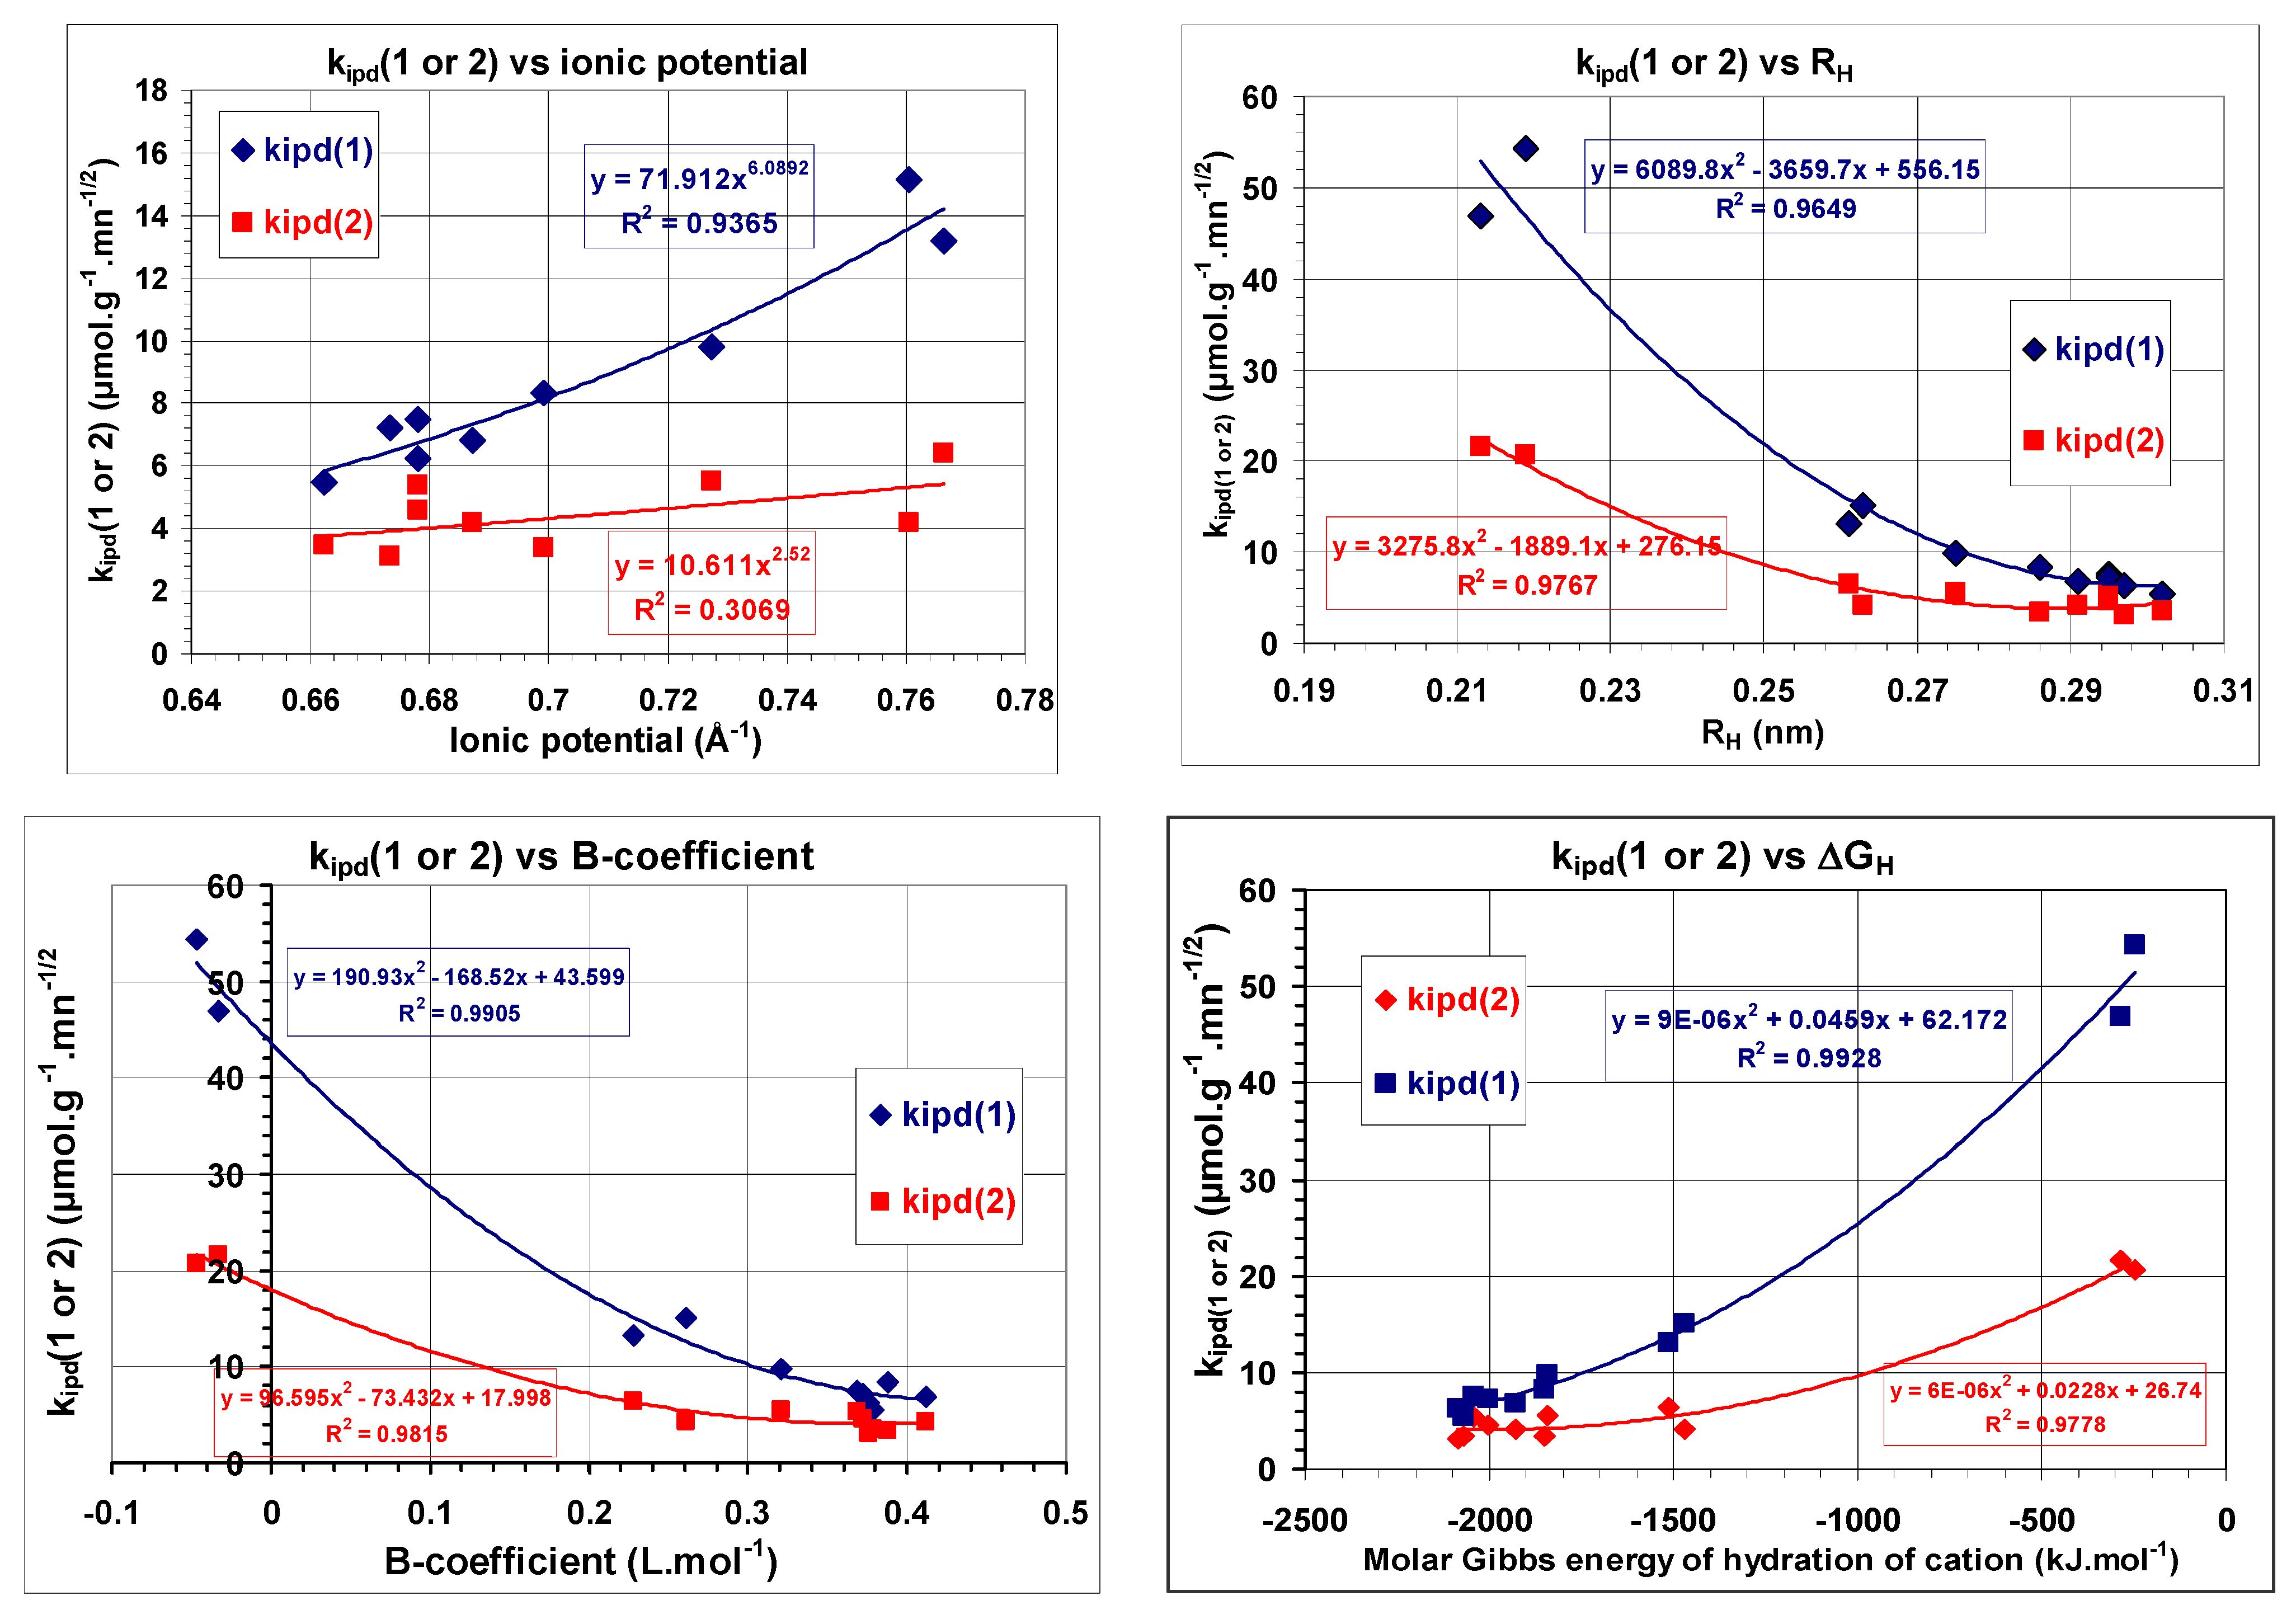
  82. Allahdin, O.; Poumaye, N.; Wartel, M.; Boughriet, A. Correlation analysis between cationic metal characteristics and ion-exchange performance of brick-derived zeolites: A comprehensive mechanistic explanation. Mater. Chem. Phys. 2022, 276, 125353. [Google Scholar] [CrossRef]
  83. Allahdin, O. Elimination (par Adsorption sur la Brique Activée) de Polluants Métalliques dans les eaux de la République Centrafricaine et les Pays en Voie de Développement: Aspects Texturaux, Physicochimiques, (Electro)-Cinétiques et Thermodynamiques. Ph.D. Thesis, University of Lille, Lille, France, 2014; p. 177. Available online: https://ori.univ-lille1.fr/thematic-search.html?menuKey=these&id=allahdin (accessed on 15 November 2014).
  84. Poumaye, N.M. Transformation Chimique et Structurale d’un Constituant de Brique en Zéolite: Application à L’élimination des Contaminants Métalliques dans le Traitement des eaux. Ph.D. Thesis, University of Lille, Lille, France, 2020; p. 177. Available online: https://www.theses.fr/253318424 (accessed on 15 July 2020).
  85. Tran, H.N.; You, S.J.; Hosseini-Bandegharaei, A.; Chao, H.P. Mistakes and inconsistencies regarding adsorption of contaminants from aqueous solutions: A critical review. Water Res. 2017, 120, 88–116. [Google Scholar] [CrossRef]
  86. Sheha, R.R.; El-Khouly, S.H. Adsorption and diffusion of cesium ions in zirconium(IV) iodomolybdate exchanger. Chem. Eng. Res. Des. 2013, 91, 942–954. [Google Scholar] [CrossRef]
  87. Inglezakis, V.J.; Fyrillas, M.M.; Park, J. Variable diffusivity homogeneous surface diffusion model and analysis of merits and fallacies of simplified adsorption kinetics equations. J. Hazard. Mater. 2019, 367, 224–245. [Google Scholar] [CrossRef]
  88. Guaya, D.; Jimenez, R.; Sarango, J.; Valderrama, C.; Cortina, J.L. Iron-doped natural clays: Low-cost inorganic adsorbents for phosphate recovering from simulated urban treated wastewater. J. Water Process Eng. 2021, 43, 102274. [Google Scholar] [CrossRef]
  89. Figueiredo do Nascimento, B.; Bezerra de Araujo, C.M.; Castro do Nascimento, A.; Rodrigues Bezerra da Costa, G.; Melo Lima Gomes, B.F.; Patrícia da Silva, M.; Keverson da Silva Santos, R.; Alves da Motta Sobrinho, M. Adsorption of Reactive Black 5 and Basic Blue 12 using biochar from gasification residues: Batch tests and fixed-bed breakthrough predictions for wastewater treatment. Bioresour. Technol. Rep. 2021, 15, 100767. [Google Scholar] [CrossRef]
  90. Li, R.; Yang, W.; Su, Y.; Li, Q.; Gao, S.; Shang, J.K. Ionic potential: A general material criterion for the selection of highly efficient arsenic adsorbents. J. Mater. Sci. Technol. 2014, 30, 949–953. [Google Scholar] [CrossRef]
  91. Marcus, Y. A simple empirical model describing the thermodynamics of hydration of ions of widely varying charges, sizes, and shapes. Biophys. Chem. 1994, 51, 111–127. [Google Scholar] [CrossRef]
  92. Jenkins, H.D.B.; Marcus, Y. Viscosity B-coefficients of ions in solution. Chem. Rev. 1995, 95, 2695–2724. [Google Scholar] [CrossRef]
  93. Yao, C.; Zhu, C. A new multi-mechanism adsorption kinetic model and its relation to mass transfer coefficients. Surf. Interfaces 2021, 26, 101422. [Google Scholar] [CrossRef]
  94. Li, P.; SenGupta, A.K. Intraparticle diffusion during selective ion exchange with a macroporous exchanger. React. Funct. Polym. 2000, 44, 273–287. [Google Scholar] [CrossRef]
  95. Jones, I.L.; Carta, G. Ion exchange of amino acids and dipeptides on cation resins with varying degree of cross-linking. 2. Intraparticle transport. Ind. Eng. Chem. Res. 1993, 32, 117–125. [Google Scholar] [CrossRef]
  96. Valderrama, C.; Gamisans, X.; de las Heras, F.X.; Cortina, J.L.; Farran, A. Kinetics of polycyclic aromatic hydrocarbons removal using hyper-cross-linked polymeric sorbents Macronet Hypersol MN200. React. Funct. Polym. 2007, 67, 1515–1529. [Google Scholar] [CrossRef]
  97. Kapoor, A.; Yang, R.T.; Wong, C. Surface diffusion. Catal. Rev. 1989, 31, 129–214. [Google Scholar] [CrossRef]
  98. Valderrama, C.; Gamisans, X.; de las Heras, X.; Farran, A.; Cortina, J.L. Sorption kinetics of polycyclic aromatic hydrocarbons removal using granular activated carbon: Intraparticle diffusion coefficients. J. Hazard. Mater. 2008, 157, 386–396. [Google Scholar] [CrossRef] [PubMed]
  99. Medved, I.; Cerny, R. Surface diffusion in porous media: A critical review. Microporous Mesoporous Mater. 2011, 142, 405–422. [Google Scholar] [CrossRef]
  100. Zhu, Q.; Moggridge, G.D.; D’Agostino, C. Adsorption of pyridine from aqueous solutions by polymeric adsorbents MN 200 and MN 500. Part 2: Kinetics and diffusion analysis. Chem. Eng. J. 2016, 306, 1223–1233. [Google Scholar] [CrossRef]
  101. Langmuir, I. The constitution and fundamental properties of solids and liquids, Part I Solids. J. Am. Chem. Soc. 1916, 38, 2221–2295. [Google Scholar] [CrossRef]
  102. Freundlich, H.M.F. Over the adsorption in solution. J. Phys. Chem. 1906, 57, 385–470. [Google Scholar] [CrossRef]
  103. Sperlich, A.; Werner, A.; Genz, A.; Amy, G.; Worch, E.; Jekel, M. Breakthrough behavior of granular ferric hydroxide (GFH) fixed-bed adsorption filters: Modeling and experimental approaches. Water Res. 2005, 39, 1190–1198. [Google Scholar] [CrossRef] [PubMed]
  104. Ahmad, A.L.; Chong, S.; Bhatia, M.F. Prediction of breakthrough curves for adsorption of complex organic solutes present in palm oil mill effluent (POME) on granular activated carbon. Ind. Eng. Chem. Res. 2006, 45, 6793–6802. [Google Scholar] [CrossRef]
  105. Sperlich, A.; Schimmelpfennig, S.; Baumgarten, B.; Genz, A.; Amy, G.; Worch, E.; Jekel, M. Predicting anion breakthrough in granular ferric hydroxide (GFH) adsorption filters. Water Res. 2008, 42, 2073–2082. [Google Scholar] [CrossRef]
  106. Hoong Chu, K. Prediction of arsenic breakthrough in a pilot column of polymer-supported nanoparticles. J. Water Process Eng. 2014, 3, 117–122. [Google Scholar] [CrossRef]
  107. Zhang, S.; Dang, J.; Lin, J.; Liu, M.; Zhang, M.; Chen, S. Selective enrichment and separation of Ag(I) from electronic waste leachate by chemically modified persimmon tannin. J. Environ. Chem. Eng. 2021, 9, 104994. [Google Scholar] [CrossRef]
  108. Pérez-Foguet, A.; Casoni, E.; Huerta, A. Dimensionless analysis of HSDM and application to simulation of breakthrough curves of highly adsorbent porous media. J. Environ. Eng. 2013, 139, 667–676. [Google Scholar] [CrossRef]
  109. Lin, X.; Huang, Q.; Qi, G.; Shi, S.; Xiong, L.; Huang, C.; Chen, X.; Li, H.; Chen, X. Estimation of fixed-bed column parameters and mathematical modeling of breakthrough behaviors for adsorption of levulinic acid from aqueous solution using SY-01 resin. Sep. Purif. Technol. 2017, 174, 222–231. [Google Scholar] [CrossRef]
  110. Kannan, P.; Pal, P.; Banat, F. Design of adsorption column for reclamation of methyldiethanolamine using homogeneous surface diffusion model. Oil Gas Sci. Technol. Rev. d’IFP Energies Nouv. 2020, 75, 82. [Google Scholar] [CrossRef]
  111. Guerrero, A.; Fernández, M.S.; Goni, S. Cemented materials in the LLW and MLW Spanish disposal. Mater. De Constr. 1999, 49, 31–40. [Google Scholar] [CrossRef]
  112. Lee, J.M.; Whang, J.; Kim, C.L.; Park, J.W. Leachability of radionuclides from cement-solidified waste form produced at Korean nuclear power plant. J. Environ. Sci. Health Part A 2002, 37, 201–212. [Google Scholar] [CrossRef]
  113. Shafique, M.; Walton, J.; Gutierrez, N.; Smith, R.; Tarquin, A. Influence of carbonation on leaching of cementitious wasteforms. J. Environ. Eng. 1998, 124, 463–467. [Google Scholar] [CrossRef]
  114. El-Kamash, A.M.; El-Naggar, M.R.; El-Dessouky, M.I. Immobilization of cesium and strontium radionuclides in zeolite-cement blends. J. Hazard. Mater. 2006, B136, 310–316. [Google Scholar] [CrossRef] [PubMed]
  115. Jang, J.G.; Park, S.M.; Lee, H.K. Physical barrier effect of geopolymeric waste form on diffusivity of cesium and strontium. J. Hazard. Mater. 2016, 318, 339–346. [Google Scholar] [CrossRef] [PubMed]
  116. Goni, S.; Guerrero, A.; Lorenzo, M.P. Efficiency of fly ash belite cement and zeolite matrices for immobilizing cesium. J. Hazard. Mater. 2006, 137, 1608–1617. [Google Scholar] [CrossRef]
  117. Gimmi, T.; Kosakowski, G. How mobile are sorbed cations in clays and clay rocks? Environ. Sci. Technol. 2011, 45, 1443–1449. [Google Scholar] [CrossRef]
  118. Melkior, T.; Yahiaoui, S.; Thoby, D.; Motellier, S.; Barthès, V. Diffusion coefficients of alkaline cations in Bure mudrock. Phys. Chem. Earth 2007, 32, 453–462. [Google Scholar] [CrossRef]
  119. García-Gutiérreza, M.; Missanaa, T.; Mingarroa, M.; Morejóna, J.; Cormenzana, J.L. Cesium diffusion in mortars from different cements used in radioactive waste repositories. Appl. Geochem. 2018, 98, 10–16. [Google Scholar] [CrossRef]
  120. Jang, J.G.; Lee, H.K. Microstructural densification and CO2 uptake promoted by the carbonation curing of belite-rich Portland cement. Cem. Concr. Res. 2016, 82, 50–57. [Google Scholar] [CrossRef]
  121. Yang, C.C. On the relationship between pore structure and chloride diffusivity from accelerated chloride migration test in cement-based materials. Cem. Concr. Res. 2006, 36, 1304–1311. [Google Scholar] [CrossRef]
  122. Yang, C.C.; Cho, S.W.; Wang, L.C. The relationship between pore structure and chloride diffusivity from ponding test in cement-based materials. Mater. Chem. Phys. 2006, 100, 203–210. [Google Scholar] [CrossRef]
  123. Ben Sghaier, R.; Net, S.; Allahdin, O.; Bessadok, S.; Sahyoun, W.; Ouddane, B.; Ben Hassan-Chehimi, D. Removal of bisphenol A and 4-nonylphenol from water by using a modifed brick–ferrihydrite coated. Chem. Pap. 2023, 77, 3937–3946. [Google Scholar] [CrossRef]
  124. Ben Sghaier, R.; Allahdin, O.; Net, S.; Bessadok, S.; Shayoun, W.; Ouddane, B.; Latrous, L. Application of modified bricks ferrihydrite-coated for the elimination of hormones from contaminated water: Case of 17α-ethynylestradiol, testosterone and estrone. Chem. Afr. 2024, 1–11. [Google Scholar] [CrossRef]
Figure 1. XRD patterns of brick materials. Raw brick (a); alkali-activated brick (b). Illite, I; Quartz, Q; Rutile, R; Na-P zeolite, ; LTA zeolite, .
Applsci 14 03511 g001
Figure 2. Morphological aspects of treated brick pellets observed using ESEM at different magnifications (ac). ESEM micrograph of raw brick (d). Spherical and ellipsoidal surface zones targeted on alkali-activated brick grains for ESEM/EDS analysis (e). ESEM micrograph of alkali-activated brick surface on which the lengths of cube edges and sphere diameters of zeolitic specimens were measured (f). Note that, in image e circles represent the surface zones targeted for ESEM/EDS analysis, and in image f numbers represent lengths of cube edges and sphere diameters of zeolitic specimens.
Applsci 14 03511 g002
Figure 3. N2 adsorption (in blue) and desorption (in red) isotherm (a) and corresponding pore size distribution curves for brick composite (in blue; b1) and raw brick (in red; b2). Log differential pore volume dV/d(log d) versus pore diameter (c).
Applsci 14 03511 g003
Figure 4. Plotting of the adsorption capacity (Qt, in µmol·g−1) against t1/2. Application of Weber-Morris kinetics model to adsorption kinetics of cations (Cs+, Rb+, Co2+, and Sr2+) on brick composite in aqueous medium. Note that the first, second and third steps observed from W-M model are represented in black squares, red squares and blue triangles, respectively.
Applsci 14 03511 g004
Figure 5. Dependence of the intra-particle diffusion rate constants, kipd(1) and kipd(2), upon ionic potential (Z/RH); hydrated radius (RH); Jones–Dole viscosity coefficient (B); and molar Gibbs energy of the cation’s hydration, M+ or M2+ (ΔGH). (Note that only divalent cations were taken into consideration in the curve: kipd(1) and kipd(2) versus ionic potential).
Applsci 14 03511 g005
Figure 6. Plotting of t/Qt (in g·mn·µmol−1) against time (mn). Application of film-surface diffusion model proposed by Yao and Chen [63] for adsorption kinetics of cations (Cs+, Rb+, Co2+, and Sr2+) onto a brick composite in aqueous medium.
Applsci 14 03511 g006
Figure 7. Plotting of −ln [1 − X(t)2] against time by covering kinetic data points which were used for separately determining Weber-Morris rate constants kipd(2) and kipd(3).
Applsci 14 03511 g007
Figure 8. Plotting of −Ln[(1 − X(t)).(π2/6)] against time by covering only the kinetic data points (in third W-M step) used for determining the Weber–Morris rate constant, kipd(3).
Applsci 14 03511 g008
Figure 9. Dependence of the surface diffusion coefficient (Ds) relative to the adsorption of nuclides (Cs+, Rb+, Co2+, and Sr2+), monovalent cations (Li+ and K+), and some metallic cations onto brick composites, with molar Gibbs energy of hydration of the cation M+ or M2+GH).
Applsci 14 03511 g009
Figure 10. Experimental and simulated breakthrough curves relative to the dynamic adsorption of cations (Cs+, Rb+, Co2+ and Sr2+) on to brick composite.
Applsci 14 03511 g010
Table 1. Intra-particle diffusion rate constants (kipd) and film thickness (C) determined for the different stages observed in Weber–Morris curves.
Radio-Nuclideskipd(1)
µmol·g−1·mn−1/2
C1
µmol·g−1
R2kipd(2)
µmol·g−1·mn−1/2
C2
µmol·g−1
R2kipd(3)
µmol·g−1·mn−1/2
C3
µmol·g−1
R2
Cs+54.322181.980.732620.715244.820.90021.4778328.860.4192
Rb+46.860205.180.975621.597258.820.97120.9431348.170.3990
Sr2+15.127278.790.89364.1924304.920.86600.5410330.030.5957
Co2+7.2088110.350.99504.5996116.110.97041.5526139.370.9633
Table 2. Film mass transfer coefficient evaluated using the film–surface diffusion model proposed by Yao and Chen [63].
Film–Surface DiffusionCs+Rb+Co2+Sr2+
ro (µmol·g−1·mn−1)1666.67869.57312.501282.10
a (mn−1)6.232.622.254.79
kf (m·s−1)0.0051410.0025560.001930.004229
Table 3. Surface diffusion coefficients values (Deff, Ds, and Dp; expressed in m2·s−1) obtained by applying the homogeneous surface diffusion model (HSDM) for the adsorption of cations (Cs+, Rb+, Co2+, and Sr2+) on brick composite. (a) Dp, calculated from Equation (6); (b) Deff, calculated from models established by Boyd et al. and discussed in ref. [93] and Vermeulen’s approximation also documented in ref. [93] at reaction time values of the different experimental points of the second stage and third stage of the Weber–Morris (W-M) kinetics model; (c) Def,f calculated from models established by Boyd et al. or Crank (as described in ref. [93] for long adsorption times; (d) Ds, evaluated from Equation (20).
CationsDp (a)Deff (b)
(W-M Step-2)
Deff (b)
(W-M Step-3)
Deff (c)
(W-M Step-3)
Ds(calc.) (d)
(W-M Step-2)
Ds(calc.) (d)
(W-M Step-3)
Cs+1.396 × 10−104.27 × 10−116.84 × 10−126.90 × 10−124.22 × 10−116.40 × 10⁻¹²
Rb+1.401 × 10−103.11 × 10−111.18 × 10−111.13 × 10−113.49 × 10−111.17 × 10⁻¹¹
Co2+8.768 × 10−116.35 × 10−124.79 × 10−124.95 × 10−126.00 × 10−124.50 × 10⁻¹²
Sr2+9.154 × 10−118.88 × 10−121.09 × 10−111.07 × 10−118.73 × 10−123.89 × 10⁻¹²
Table 4. Operating conditions, adsorbent characteristics, and equilibrium/kinetics parameters used for HSDM modelling of the breakthrough curves relative to the (single) adsorption of Cs+, Rb+, Co2+, and Sr2+ on brick composite.
HSDM ModellingCs+Rb+Co2+Sr2+
Operating conditionsActive brick mass (mb, g)10101010
Influent concentration (Co, mg·L−1)11885.866.1174
Flow rate (mL·min−1)5555
Bed volume (BV, mL)9.50729.50729.50729.5072
Empty bed contact time (EBCT, s)114.09114.09114.09114.09
Adsorbent characteristicsParticle-specific mass (ρp, g·cm−3)1.81351.81351.81351.8135
Bed porosity 0.420.420.420.42
Bed-specific mass (ρB, g·cm−3)1.05181.05181.05181.0518
Averaged particle diameter (dp, mm)0.850.850.850.85
Equilibrium and kinetics parametersAdsorption capacity (QAC, mg·g−1)10.210.55.518
Langmuir constant (KL, L·mg−1)0.0250.05930.5540.0763
Film diffusion coefficient (kf, m·s−1)0.0050.00250.00190.0042
Surface diffusion coefficient (Ds, m2·s−1)6.66 × 10−123.00 × 10−125.04 × 10−122 × 10−12
Dimensionless parametersSolute distribution parameter (Dg)162256203241
Biot number (Bi)2725229110915237
Stanton number (St)778389296669
The ratio: St/Bi (Ed)0.2860.1700.2710.128
Table 5. Comparison of the Deff values (in m2·s−1) of Cs+, Rb+, Co2+, and Sr2+ ions individually adsorbed on the brick-based composite with those previously reported, concerning their diffusion behaviour through different cements, clays, and clay rocks/soils.
MatrixCaesium(I)Rubidium(I)Cobalt(II)Strontium(II)
Portland cement0.59 × 10−11 to 1.70 × 10⁻¹¹ [111,112]--------------------1.7 × 10⁻¹² [113]
Ordinary Portland cement (OPC)4.6 × 10⁻¹¹ [114]
1.2 × 10⁻¹¹ [115]
--------------------5.40 × 10⁻¹² [114]
3.3 × 10⁻¹⁴ [115]
OPC + 4% zeolite A5.70 × 10−12 [114]--------------------3.75 × 10⁻¹² [114]
Fly ash belite cement2.2 × 10−11 [116]------------------------------
Fly ash belite cement with Na-P1 zeolite2.8 × 10−13 [116]------------------------------
Fly ash-based geopolymer1.2 × 10−14 to 1.8 × 10⁻¹⁴ [115]--------------------0.68 × 10⁻¹⁸ to 1.30 × 10⁻¹⁸ [115]
Slag-blended geopolymer1.1 × 10−12 to 1.1 × 10⁻¹¹ [115]--------------------2.1 × 10⁻¹⁷ to 5.1 × 10⁻¹⁶ [115]
Kaolinite-----------------------------------4.4 × 10⁻¹¹ to 6.1 × 10⁻¹¹ [117]
Montmorillonite------------------------------6.5 × 10⁻¹² to 38 × 10−12 [117]
Illite/smectite------------------------------16 × 10−11 [117]
Soils (lowest values)17.55 × 10⁻¹¹ [117]25 × 10−11 [117]--------------------
Bure mudrock2 × 10−12 to 3 × 10⁻¹² [118]
2.2 × 10⁻¹¹ (in theory) [118]
8 × 10⁻¹² [118]
2.2 × 10⁻¹¹ (in theory) [118]
--------------------
Bentonite (MX80)
(lowest values)
6.91 × 10⁻¹¹ [117]----------4.32 × 10⁻¹¹ [117]10.09 × 10⁻¹¹ [117]
Mortars0.7 × 10−14 to 8.9 × 10⁻¹³ [119]------------------------------
Activated brick
(this work)
4.27 × 10−113.11 × 10−116.35 × 10−128.88 × 10⁻¹²
Disclaimer/Publisher’s Note: The statements, opinions and data contained in all publications are solely those of the individual author(s) and contributor(s) and not of MDPI and/or the editor(s). MDPI and/or the editor(s) disclaim responsibility for any injury to people or property resulting from any ideas, methods, instructions or products referred to in the content.

