

A Meta-Analysis of the Effect of Moisture Content of Recycled Concrete Aggregate on the Compressive Strength of Concrete


1
The Charles E. Via, Jr. Department of Civil and Environmental Engineering, Virginia Polytechnic Institute and State University, Blacksburg, VA 24061, USA
2
Department of Materials Science and Engineering, Virginia Polytechnic Institute and State University, Blacksburg, VA 24061, USA
*
Authors to whom correspondence should be addressed.
Appl. Sci. 2024, 14(8), 3512; https://doi.org/10.3390/app14083512
Submission received: 8 March 2024
/
Revised: 11 April 2024
/
Accepted: 15 April 2024
/
Published: 22 April 2024
(This article belongs to the Special Issue Development, Characterization, Application and Recycling of Novel Construction Materials)
Abstract
:To reduce the environmental impact of concrete, recycled aggregates are of significant interest. Recycled concrete aggregate (RCA) presents a significant resource opportunity, although its performance as an aggregate in concrete is variable. This study presents a meta-analysis of the published literature to refine the understanding of how the moisture content of RCA, as well as other parameters, affects the compressive strength of concrete. Seven machine learning models were used to predict the compressive strength of concrete with RCA, including linear regression, support vector regression (SVR), and k-nearest neighbors (KNN) as single models, and decision tree, random forest, XGBoost, and LightGBM as ensemble models. The results of this study demonstrate that ensemble models, particularly the LightGBM model, exhibited superior prediction accuracy compared to single models. The LightGBM model yielded the highest prediction accuracy with R2 = 0.94, RMSE = 4.16 MPa, MAE = 3.03 MPa, and Delta RMSE = 1.4 MPa, making it the selected final model. The study, employing feature importance with LightGBM as the final model, identified age, water/cement ratio, and fine RCA aggregate content as key factors influencing compressive strength in concrete with RCA. In an interaction plot analysis using the final model, lowering the water–cement ratio consistently improved compressive strength, especially between 0.3 and 0.4, while increasing the fine RCA ratio decreased compressive strength, particularly in the range of 0.4 to 0.6. Additionally, it was found that maintaining moisture conditions of RCA typically between 0.0 and 0.8 was crucial for maximizing strength, whereas extreme moisture conditions, like fully saturated surface dry (SSD) state, negatively impacted strength.
1. Introduction
Concrete recycling can be implemented as a strategy to reduce carbon emissions and promote sustainable development [1,2,3]. Concrete with recycled aggregates is recognized as one of the most prominent eco-friendly concretes [4,5,6]. Another concern for using recycled aggregates is that the supply of quality natural aggregates is diminishing in certain regions of the world (e.g., [7]). Of particular concern is increasing amounts of construction and demolition waste [1,8,9], from which recycled concrete aggregates (RCA) are derived.
Consequently, concrete recycling and sustainable development are considered highly important in the construction industry [1,10,11]. Recycled concrete can be utilized by crushing discarded concrete debris and using it as RCA to partially or fully replace natural aggregates in new concrete [1]. Recycled aggregates can be classified depending on the particle size or the type of waste material [12]. Among them, coarse recycled aggregates produced from crushed concrete are the most used in concrete production, and they are referred to as recycled concrete aggregate or RCA [12,13,14,15,16,17,18].
The surface of RCA can consist of natural aggregate and adhered mortar, which results in RCA having different physicochemical properties compared to natural aggregates [19,20,21,22,23,24]. The adhered mortar is porous, resulting in higher water absorption capacity in RCA compared to natural aggregates [19,25]. Additionally, the roughness of the adhered mortar increases the surface area of recycled aggregate particles, requiring more water for achieving consistent workability compared to concrete made with the same natural aggregates [19]. As a result, the mechanical properties of concrete with RCA can be inferior to those of concrete using natural aggregate particles [19,20,21,22,23,24]. Therefore, a number of researchers have explored methodologies to limit the detrimental effect of RCA, such as through beneficiation methodologies (e.g., [26,27]), mix design approaches (e.g., [28,29]), or alternative mixing approaches (e.g., [13,30,31,32]).
A significant number of researchers have noted that the moisture content of the RCA at the time of concrete batching can have a significant impact on the properties and performance of the concrete (e.g., [32,33]) in addition to affecting the microstructure development [33,34,35]. Poon et al. [36] discussed concrete compressive strengths with three different RCA moisture conditions—air dry (AD), oven dry (OD), and saturated surface dry (SSD)—and argued that SSD aggregate would release water, resulting in a weakened interfacial transition zone (ITZ) and a higher water-to-cement ratio [12]. These AD, OD, and SSD moisture states represent different moisture levels in RCA and play a crucial role in concrete performance. AD refers to aggregates dried naturally under atmospheric conditions, while OD indicates aggregates dried in an oven to remove all moisture. SSD signifies aggregates with their surfaces saturated with moisture but not immersed in water. Brand et al. [32,33] found that partially saturated RCA has the potential to have an equivalent concrete strength compared to natural aggregate concrete, and Etxeberria et al. [23] recommended to use partial SSD rather than SSD to secure the compressive strength of concrete with RCA. Mefteh et al. [37] argued that recycled aggregates within an SSD condition have the most negative impact on concrete strength, while AD recycled aggregates optimize concrete strength [37].
The objective of this study is to explore the relationship between the compressive strength of concrete and the moisture content of recycled concrete aggregates (RCA) through the application of machine learning, since there are conflicting conclusions in the literature. Various factors, including the volume fraction of aggregates, aggregate type, aggregate gradation, coarse-to-fine aggregate ratio, aggregate shape and texture, water-to-cement ratio, cement content, type and content of any supplementary cementitious materials, and type and dosage of chemical admixtures [38,39,40,41,42], influence the compressive strength of concrete. Due to the complex and nonlinear interrelationship between these factors and compressive strength, general linear equations are often ineffective [43,44,45]. In recent years, machine learning algorithms have been increasingly used to predict the performance of concrete with both natural aggregates [46,47] and with recycled aggregates [4]. Studies have focused on predicting various properties of concrete with recycled aggregates, such as strength [43], elastic modulus [19], chloride resistance [1], and durability [48], using machine learning models. However, there remains insufficient established predictive information regarding the relationship between the compressive strength of concrete and the moisture content of RCA. Therefore, this study aims to address this gap by conducting a literature review to investigate the relationship between compressive strength and moisture content in RCA. To achieve this, a database was constructed consisting of 752 entries, considering parameters such as the moisture content, water-to-cement ratio, replacement ratio of recycled aggregates, composition ratio of natural aggregates, curing age, etc. Seven machine learning methods, including linear regression, support vector regression (SVR), k-nearest neighbors (KNN), decision tree, random forest, LightGBM, and XGBoost, were employed to develop a predictive model for the compressive strength of RCA. The models were compared using evaluation metrics, and the final model was selected. Furthermore, feature importance and interaction plots were utilized to analyze the relationship between moisture content and compressive strength. This study contributes to the field by addressing the lack of consideration of RCA moisture content in predicting concrete performance metrics, making it a novel endeavor in the realm of machine learning studies in concrete technology.
2. Experimental Methodology
2.1. Data Collection
In this study, a database was collected to predict the compressive strength of concrete with RCA when considering the moisture condition of the RCA. The database was obtained from published literature (Table 1). The database consists of 752 entries, focusing on studies that explicitly reported the moisture condition of RCA. The output variable is compressive strength (MPa), and there are a total of 13 input variables considered. The input variables represent the mixture materials used in RCA and are expressed as ratios after unifying them in kg/m3. The coarse RCA ratio represents the ratio of coarse RCA to the total coarse aggregate, and the fine RCA ratio represents the ratio of fine RCA to the total fine aggregate. These ratios are included to understand the influence of RCA proportions on compressive strength. The input variables related to the materials used in RCA are normalized by dividing them by the total material. The reason for dividing each material by the total material is to standardize all input variables on the same scale, allowing the model to consider the influence of each variable equally. This ensures that the model operates consistently even when the quantities or proportions of each material vary, making the results easier to interpret. Also, it can ease replication during future experiments, as following proportions makes it easier to replicate under standardized conditions. These input variables include cement, fly ash, water, superplasticizer, natural coarse aggregate, natural fine aggregate, fine RCA, and coarse RCA. The moisture condition is included as an input variable to investigate its influence on compressive strength. The range for the moisture condition was 0 to 1, where 0 was OD, 1 was SSD, and 0.5 was AD. Additionally, the other input variables are age and water-to-cement ratio.
2.2. Data Analysis
The database containing the input and output data was uploaded to the software as an Excel file, and the database was analyzed using Python code. Table 2 presents the statistical analysis of the database, including the mean, standard deviation, minimum, first quartile to third quartile, and maximum values. From Table 2, it is observed that there are variations among the input variables. Examining the mean values, the curing age is 23.06 days, and the average values for Coarse Aggregate/Total Material and Fine Aggregate/Total Material are 0.21 and 0.26, respectively. The average value for Superplasticizer/Total Material is 0.01, while for Fly Ash/Total Material it is 0.001, indicating significant variations. These variations can affect the performance of the model, hence preprocessing of the database is necessary [66].
2.3. Data Preprocessing
Scaling is a commonly used data preprocessing technique in machine learning. It is applied to address the issue of significant differences in units or ranges among variables. When variables have different units or ranges, it can make the interpretation of the model difficult. If one variable has a much larger range compared to others, it may have a large impact on the model’s predictions. To mitigate this problem, it is necessary to adjust the variables to a consistent scale [67,68].
In this study, before applying the scale, the dataset was divided into training and test sets. The dataset consisting of 752 samples was split into a training set, which accounts for 70% of the data, and a test set, which accounts for the remaining 30%, following the methodology employed in previous studies [19,69,70]. After splitting the data, standard scaling was applied to the input variables. This approach standardizes the variables by adjusting their means to 0 and standard deviations to 1, aligning them with a standard normal distribution [67].
2.4. Cross-Validation and Hyperparameter
Cross-validation (CV) is a technique used in machine learning to evaluate the performance of a model and estimate its generalization ability. It involves dividing the available data into multiple subsets or k-folds [71]. K is a user-specified value, commonly set to 5 or 10 but can be chosen as any other value as well [72,73]. In each iteration, the model is trained on a training set and then evaluated on the validation set. This process is repeated several times, with different subsets of the data serving as the validation set each time. The performance metrics obtained from each iteration are then averaged to provide an overall estimate of the model’s performance. CV helps address the issue of overfitting.
Hyperparameters are parameters that are set by the user before training the model. To optimize model performance, hyperparameter tuning is performed by systematically searching for the best combination of hyperparameter values [73]. This is often done in conjunction with CV, where different hyperparameter values are evaluated on different subsets of the data. This helps generalize well across different data subsets, resulting in a more robust and reliable model [74]. In this study, grid search was used to find the optimal CV value and hyperparameter values.
3. Results
3.1. Optimizing the Model
The study employed the grid search method to simultaneously find the optimal CV values and hyperparameter combinations for each model [75,76]. The range of CV fold values was set between a minimum of 2 and a maximum of 10, and various predefined hyperparameter values for each model were explored to find the best combination. The best CV fold values and hyperparameters for each model were selected based on evaluation metrics such as coefficient of determination (R2), root-mean-square deviation (RMSE), mean absolute error (MAE), and Delta RMSE. Furthermore, to ensure the reproducibility and consistency of the results, the random state parameter was set to ‘5’.
3.1.1. Linear Regression
Linear regression does not require additional hyperparameter tuning because it does not have many hyperparameters to tune. In linear regression, the focus of model training is to adjust the weights and biases of the input variables to find the best-fitting linear relationship. As a result, for the test dataset, the R2 is 0.66, RMSE is 9.72 MPa, and MAE is 7.67 MPa. The values for RMSE and MAE are relatively higher than the other six models. The Delta RMSE is 0.31 MPa.
3.1.2. Support Vector Regression (SVR)
The process of optimizing the SVR model involves adjusting the hyperparameters, cost, epsilon, gamma, and kernel values. The cost parameter determines the degree of error tolerance, while epsilon represents the acceptable range of error between predicted and actual values. In this case, the range for the cost parameter was set as 1, 10, and 100, and epsilon was set to 0.01 and 0.1. These values were commonly used and selected as initial choices for the parameters [77,78]. Additionally, gamma plays a role in adjusting the curvature of the decision boundary, and gamma values were set to 0.01 and 0.1. The kernel was considered with options including linear, polynomial, and Gaussian radial basis function (RBF) kernels.
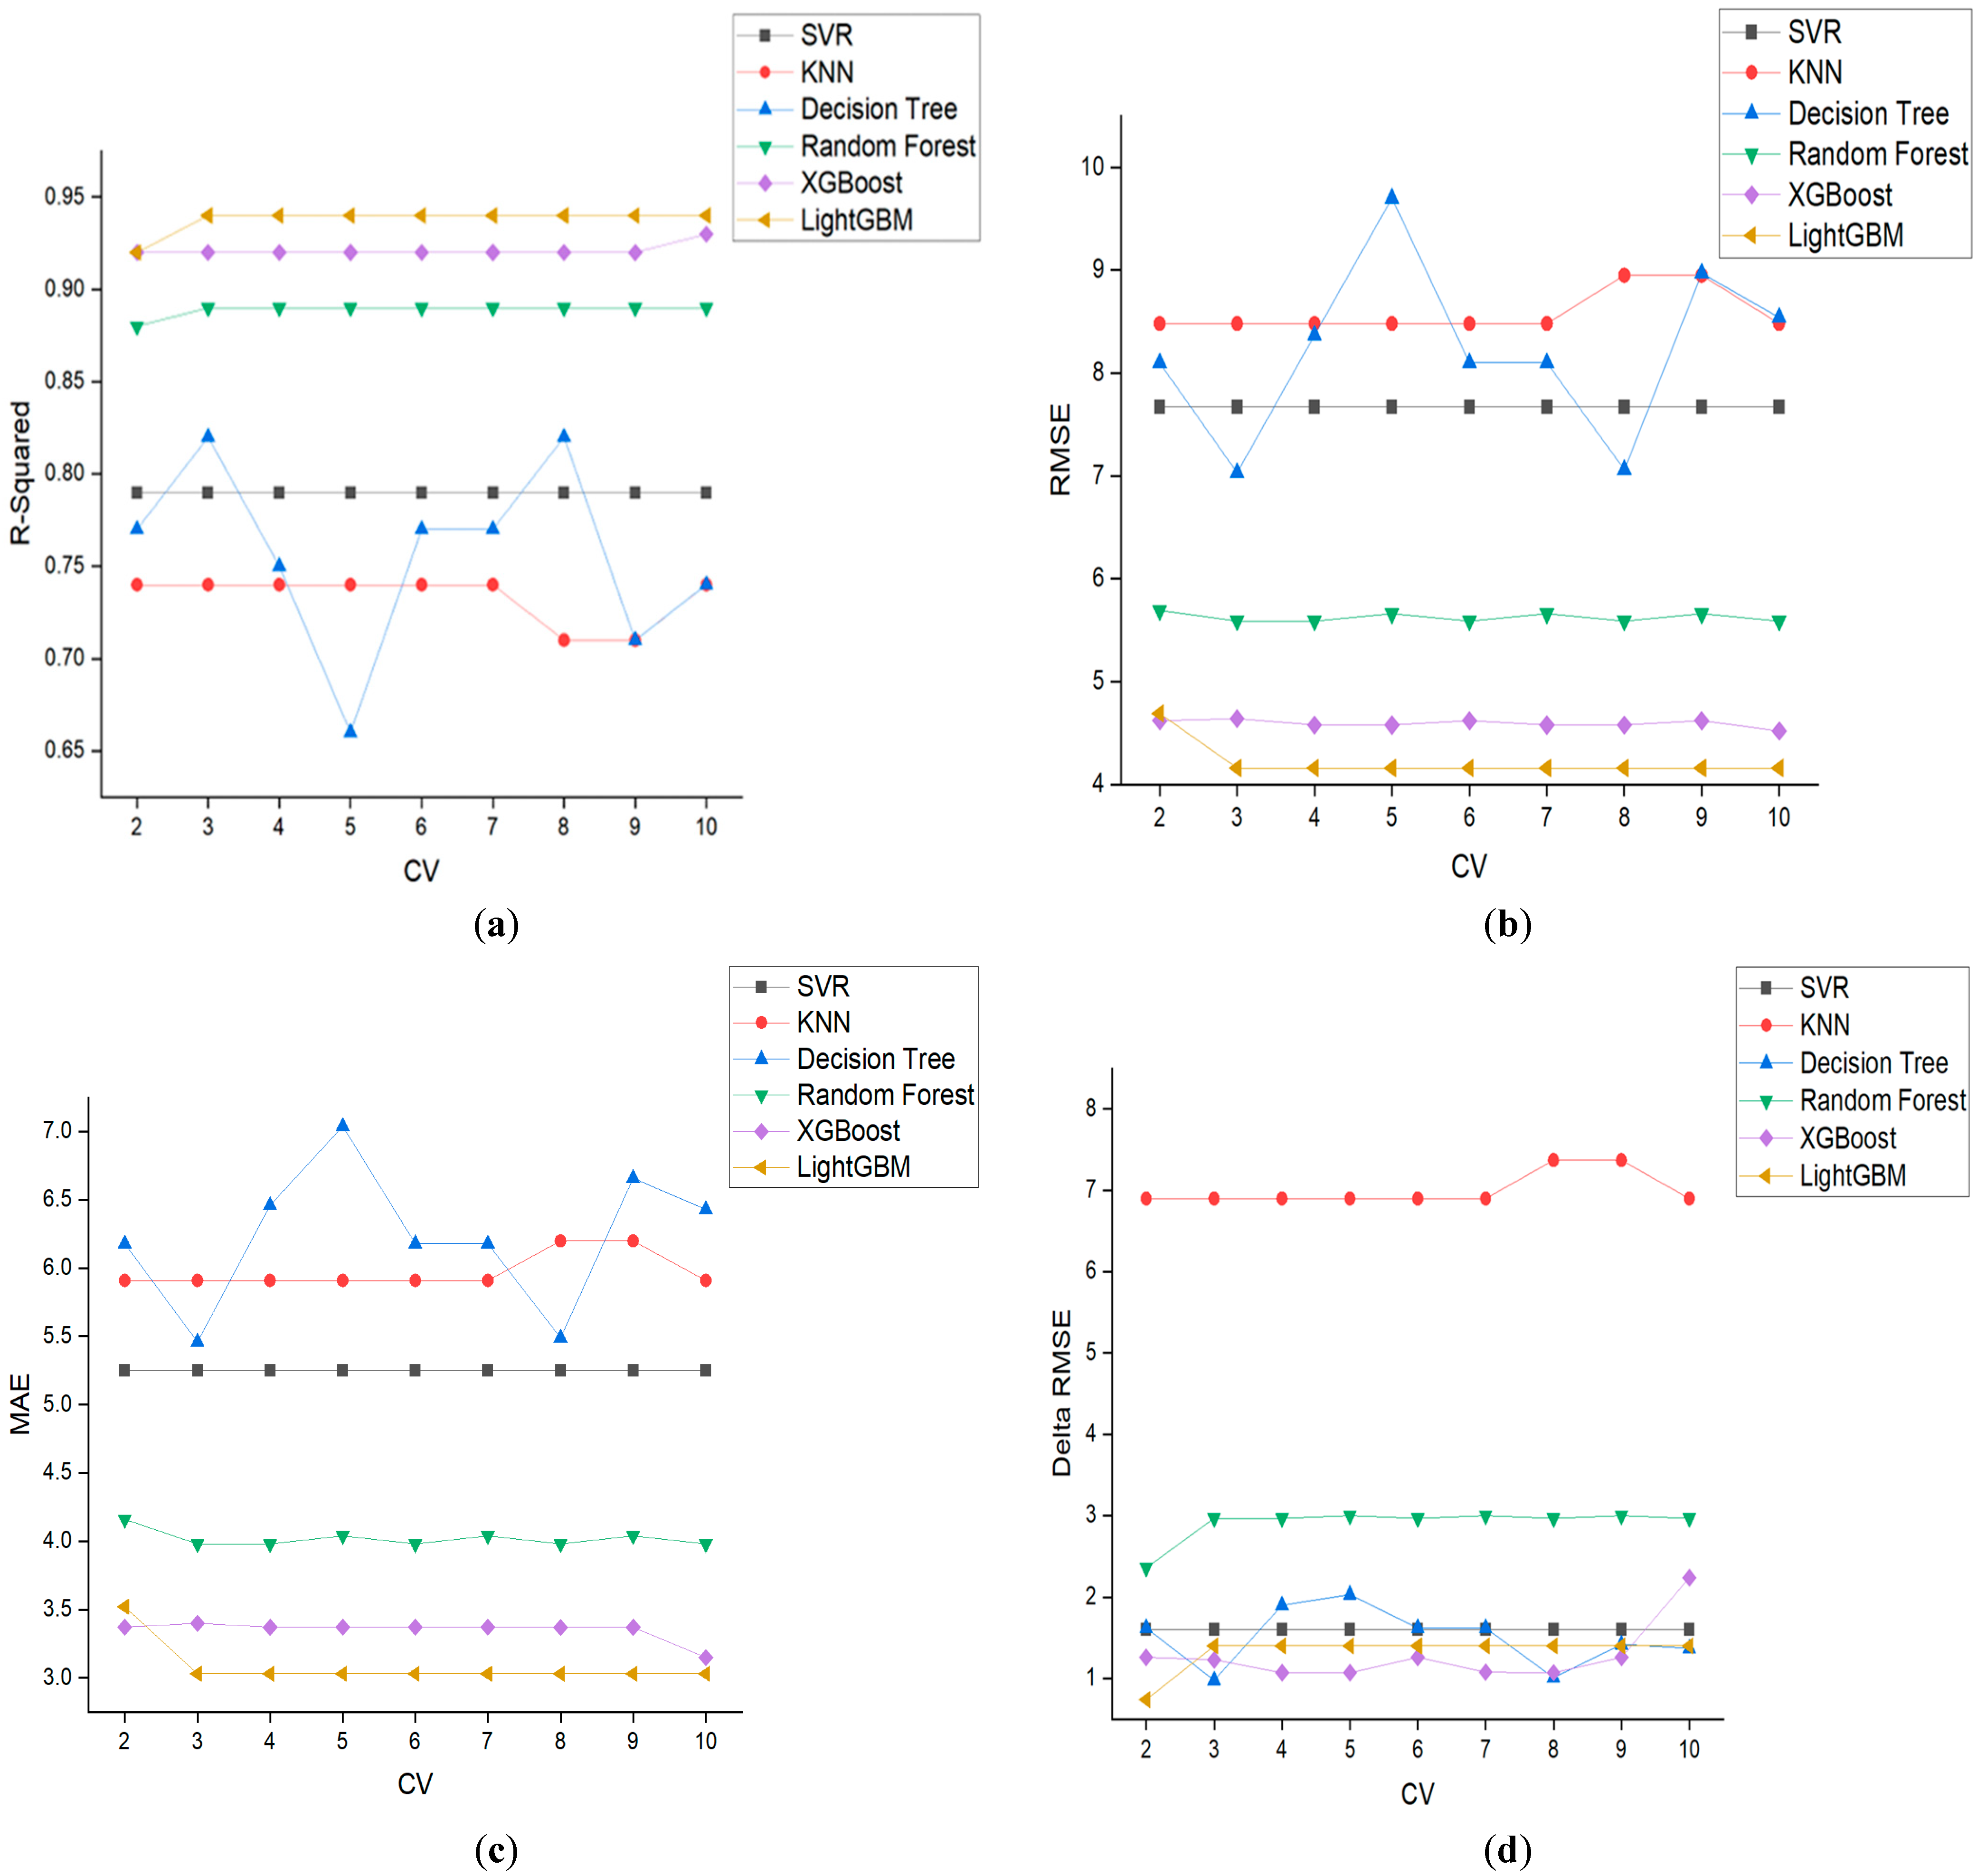
During the evaluation process with varying CV values from 2 to 10, consistent results were observed for the test sets in terms of evaluation metrics, as is visually represented in Figure 1. Figure 1 shows the evaluation metrics for each CV value. The R2 value for the test set was found to be 0.79, with an RMSE of 7.67 MPa and an MAE of 5.25 MPa. Furthermore, the Delta RMSE was 1.6 MPa. Based on these results, the optimal SVR model was obtained with a CV value of 2 and the following hyperparameter combination: cost value of 100, epsilon value of 0.1, gamma value of 0.1, and the Gaussian kernel. The decision to choose a smaller CV value, such as 2, was that a smaller CV value leads to a simpler model and reduced model complexity, which helps avoid overfitting [79]. Table 3 shows the optimal hyperparameter values and CV fold for each model.
3.1.3. K-Nearest Neighbors (KNN)
To optimize the k-nearest neighbors (KNN) model, the values of the number of neighbors, weights, algorithm, and power parameter are adjusted. Number of neighbors is a parameter that specifies the number of nearest neighbors and is usually chosen as an odd value for applying majority voting rule. In this study, the number of neighbors is set to three and five. Weights are a parameter that determines the weight of neighbors, and two options, uniform and distance, are chosen. Uniform assigns equal weight to all neighbors, while distance assigns weights inversely proportional to the distance. Algorithm is used for neighbor search, and auto is used in this study as it automatically selects the most suitable algorithm. Power parameters are methods of distance measurement, where in this study, Manhattan distance and Euclidean distance are used.
The results show that for CV values ranging from 2 to 10, for the test set, the R2, MAE, and RMSE values are consistent for CV values 2 to 7 and 10, which yielded the highest R2 and the lowest RMSE, Delta RMSE, and MAE. Therefore, the optimal KNN model is selected with a CV value of 2, 5 neighbors, weights as distance, algorithm is set to auto, and Euclidean distance for power parameter, as summarized in Table 3. CV value as 2 shows an R2 of 0.74, an RMSE of 8.48 MPa, an MAE of 5.91 MPa with the Delta RMSE as 6.91 MPa.
3.1.4. Decision Tree
The hyperparameters of the decision tree model include maximum depth, minimum number of samples split, maximum number of features, and criterion [25]. Maximum depth represents the maximum depth of the decision tree, and in this study, it was set to 5, 6, and 7. By controlling how deep the tree branches can extend, it helps mitigate the risk of overfitting. The minimum number of samples split refers to the minimum number of samples required to split a node. Nodes with fewer samples than this value will not be split. The default value in this research was set to 3, 4, and 5. The maximum number of features limits the number of features available for splitting and can help control the complexity and overfitting of the model. In this study, a square root of the total number of features and logarithm base 2 of the total number of features was chosen. Criterion is the function used to evaluate the quality of a node’s split and mean squared error, Friedman mean squared error, and Poisson loss were applied in this research.
The lowest RMSE and MAE values were achieved when CV values were 3 and 8. For CV = 3, the test set had an R2 of 0.82, an RMSE of 7.03 MPa, an MAE of 5.46 MPa, and Delta RMSE was 0.98 MPa. For CV = 8, the test set had an R2 of 0.82, an RMSE of 7.06 MPa, and an MAE of 5.49 MPa with delta RMAE as 1.01 MPa. Since the performance metrics for CV values for 3 and 8 came out very similar, CV value 3 was chosen as the optimal model for the decision tree. The optimal hyperparameters for CV = 3 are as follows: the maximum depth is 7, the minimum number of samples split was set as 5, the maximum number of features as a square root of the total number of features, and the criterion is mean squared error, as summarized in Table 3.
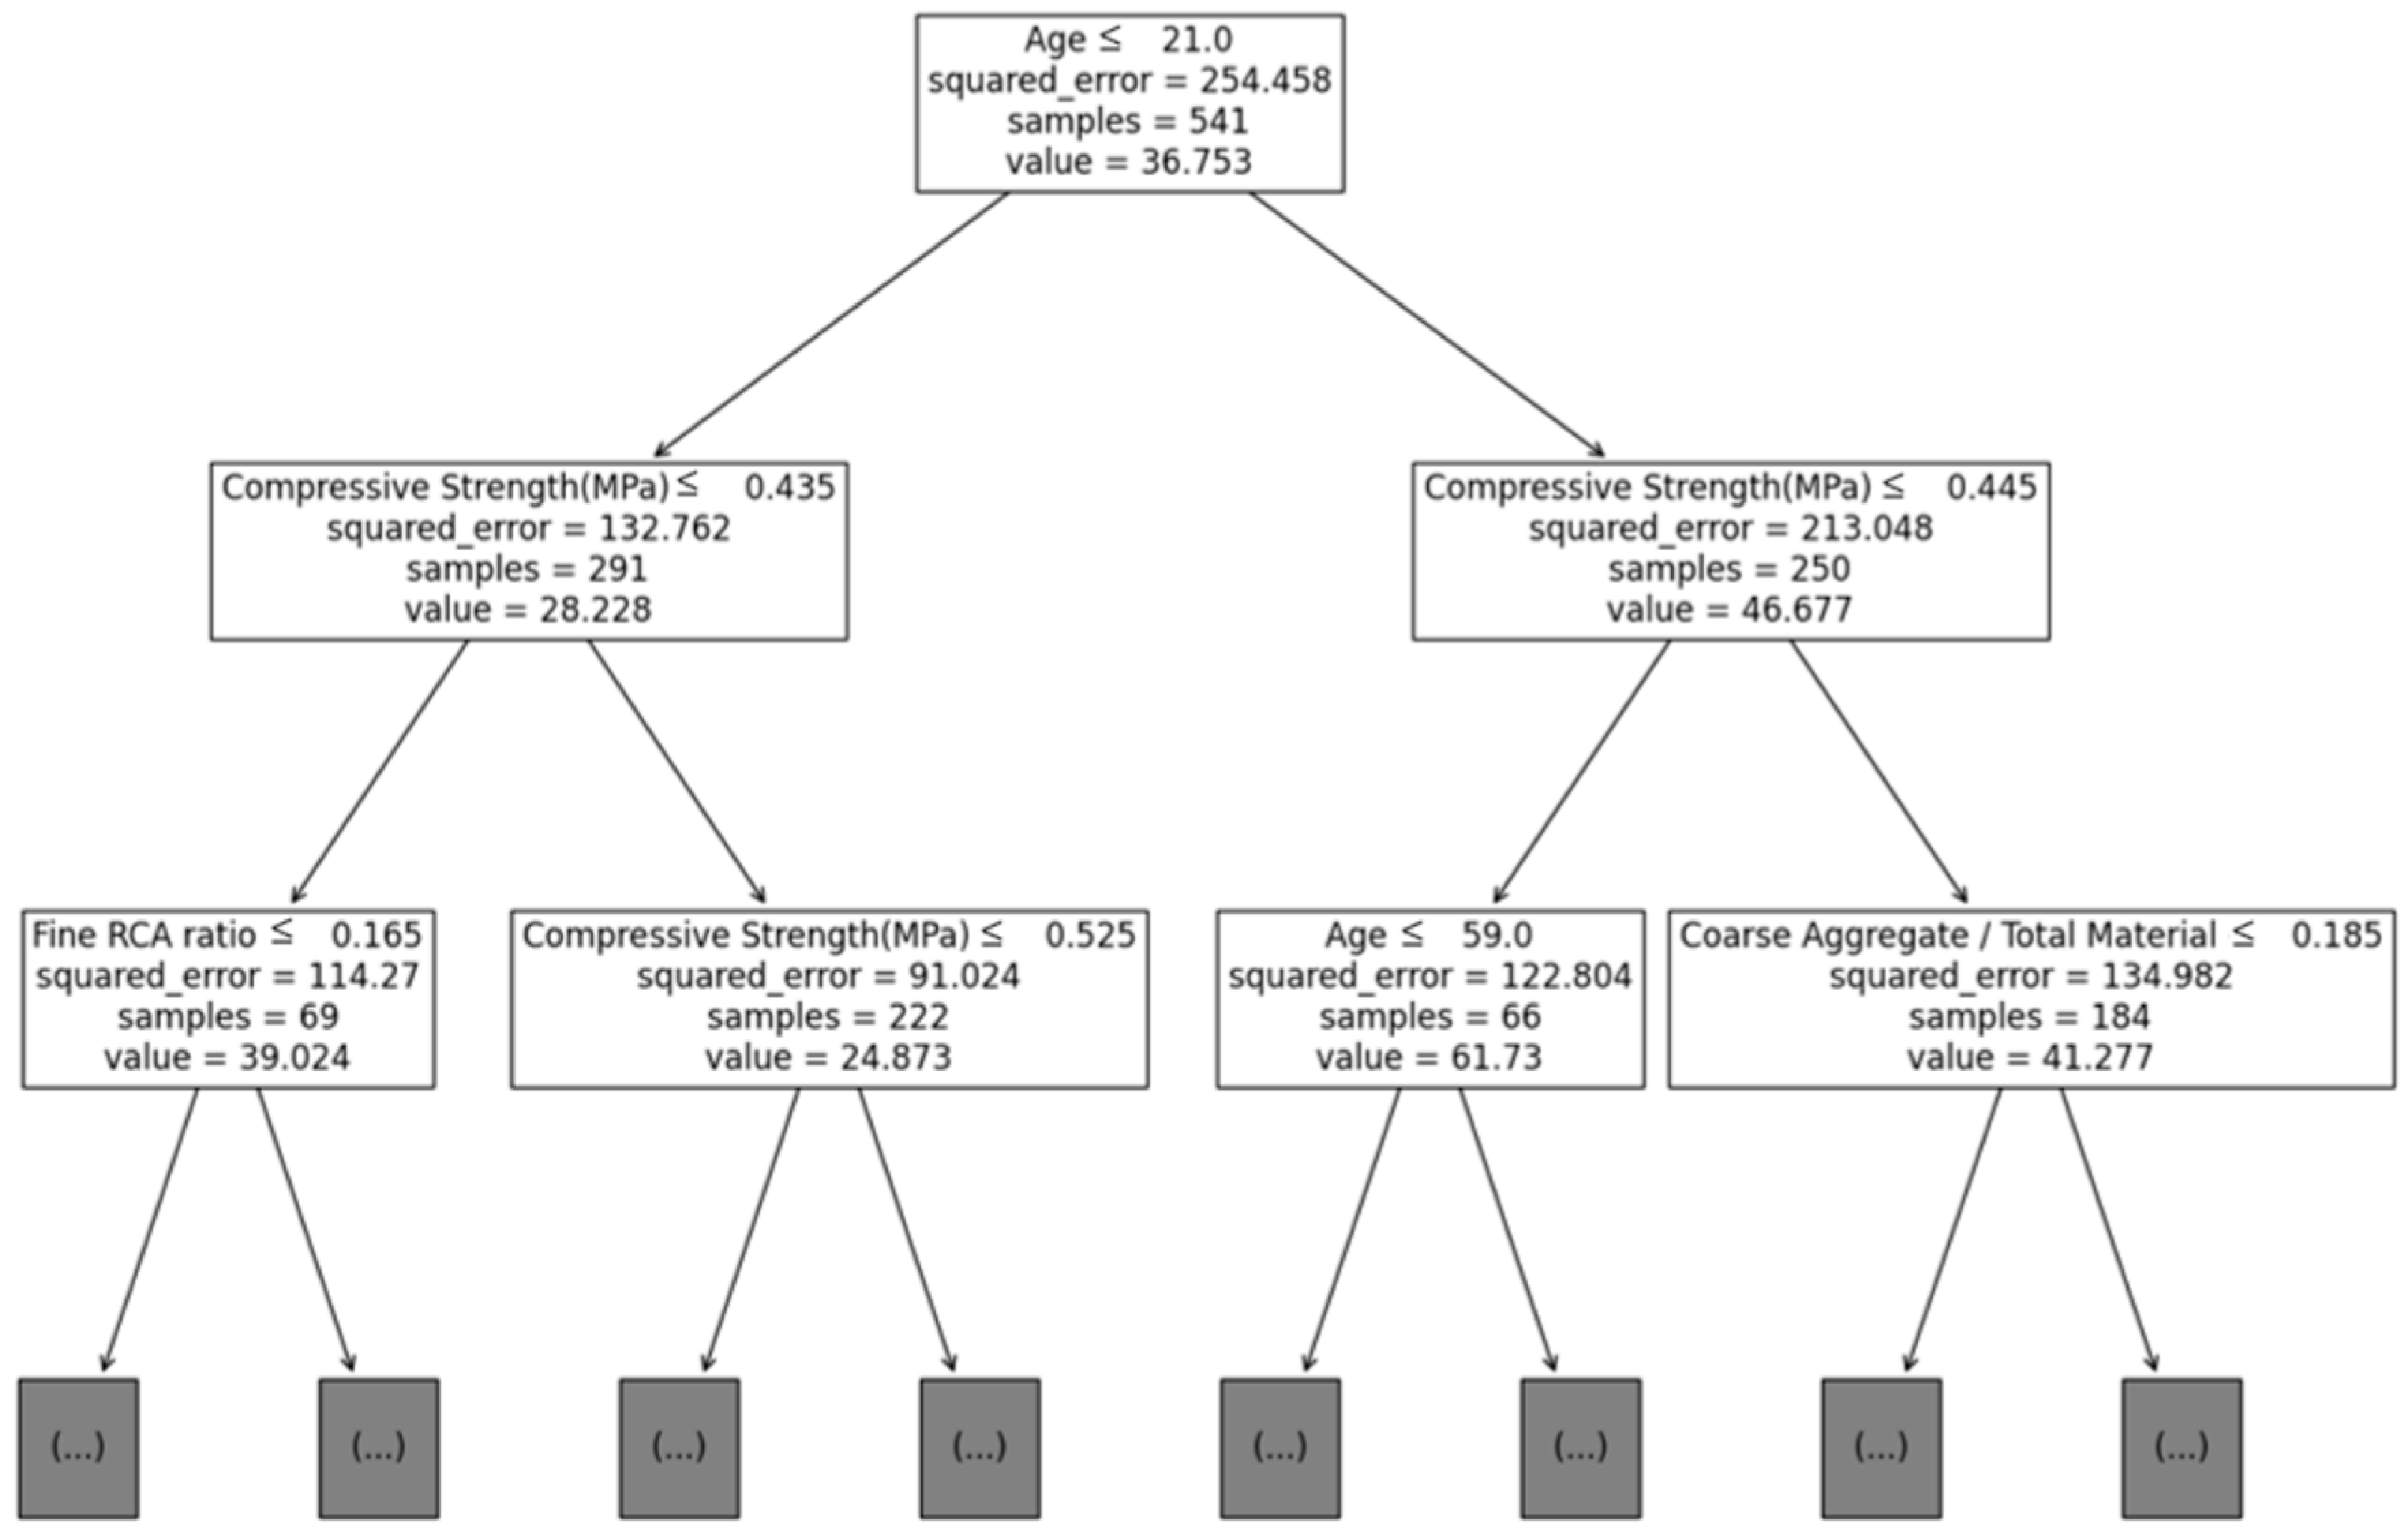
The advantage of the tree model is the ability to visualize the model [80]. Figure 2 represents the optimal decision tree model for CV as 3. Interpreting the figure, the first splitting criterion is ‘AGE’. It uses the ‘AGE’ feature to perform the first split. If the ‘AGE’ value is less than or equal to 21.0, it branches to the left; otherwise, it branches to the right. ‘Squared error’ indicates the mean squared error in the split, representing the average squared difference between the predicted and actual values in the split. In the first split, the mean squared error is 254.458. ‘Samples’ represents the number of data points included in the split, which is 541 in this case. The value of 541 is obtained by multiplying the training set ratio (0.7) by the total number of data points (752). Finally, ‘value’ denotes the average value of the target variable predicted within the split, which is 36.753 for the first split, representing the average of the target variable values for the data points belonging to the first split.
3.1.5. Random Forest
The hyperparameters of the random forest model that were specified in the study are the number of estimators, maximum depth, minimum number of samples split, and minimum number of samples leaf. The number of estimators represents the number of trees to be generated in the random forest. Increasing the number of trees can potentially improve prediction performance, but it can also slow down the model’s training and prediction speed [81]. The maximum depth limits the maximum depth of each tree in the random forest [81]. Setting a maximum depth helps control the risk of overfitting, as deeper trees can capture more specific patterns in the training data but may struggle to generalize well to new data. The minimum number of samples split is the minimum number of samples required to split an internal node, while the minimum number samples leaf is the minimum number of samples required to be at a leaf node [81]. These parameters also contribute to controlling the model’s complexity and generalization ability. The hyperparameter ranges specified in the study are as follows. The number of estimators is set to 100 and 200; maximum depth as 0, 5, and 10; minimum number of samples split as 2, 5, and 10; and minimum number samples leaf set to 1, 2, and 4.
The analysis of each CV value for the optimal hyperparameter values in terms of R2, RMSE, MAE, and the Delta RMSE revealed similar results between CV values of 3 and 10. However, there was a noticeable difference when the CV was set to 2. For CV as 2, the test set had an R2 of 0.88, an RMSE of 5.69 MPa, and an MAE of 4.16 MPa, with a Delta RMSE as 2.35 MPa. On the other hand, for CV values between 3 and 10, similar performance metrics were obtained. Especially for CV values as 3, the R2 was 0.89, RMSE was 5.59 MPa, and MAE was 3.98 MPa, and Delta RMSE was 2.97 MPa. Comparing the two CV values, 2 and 3, it can be observed that the model performs better when the CV is set to 3. Although the Delta RMSE value was higher for CV = 3 compared to CV = 2, the higher R2 and lower RMSE and MAE values indicate better overall performance when the CV is set to 3. Therefore, the optimal model for the random forest is obtained when the CV is set to 3, with 200 estimators, no maximum depth, a minimum samples split of 2, and 1 minimum samples leaf, as summarized in Table 3.
3.1.6. XGBoost
The selected hyperparameters for XGBoost in this study are number of estimators as 100 and 200; learning rate as 0.01 and 0.1; maximum depth as 3, 5, and 7; and number of subsamples as 0.5, 0.7, and 0.9 [82,83]. The number of estimators specifies the number of decision trees to be generated. Learning rate determines the contribution of each tree to the final prediction; smaller values result in less contribution from each tree, while larger values increase their contribution. Maximum depth limits the maximum depth of each tree, as deeper trees can lead to overfitting. Subsample specifies the proportion of samples used to train each tree.
When the CV value is 10, the highest R2 and lowest RMSE and MAE were observed. For CV as 10, the test set achieved an R2 of 0.93, RMSE of 4.52 MPa, and MAE of 3.15 MPa. The Delta RMSE was the highest at 2.24 MPa, suggesting that the model may be slightly overfitting to the training data. Despite this, the model still demonstrates superior performance in terms of R2, RMSE, and MAE. The CV as 10 yielded the best results. Thus, based on the higher R2, lower RMSE, and MAE, the model with the CV as 10 was chosen as the optimal model, even though the delta RMSE is higher compared to other CV values. Therefore, the optimal model is achieved with a CV of 10, and the corresponding optimal hyperparameters are 200 number estimators, a learning rate of 0.1, a maximum depth of 5, and subsamples of 0.5, as summarized in Table 3.
3.1.7. Light GBM
The hyperparameters for LightGBM were set with the same conditions as XGBoost [84]. Among the different CV values, the CV as 2 resulted in the lowest Delta RMSE of 0.74 MPa. However, when considering other evaluation metrics, CV values ranging from 3 to 10 showed better performance. Specifically, CV values between 3 and 10 achieved the highest R2 value of 0.94, along with the lowest RMSE of 4.16 MPa and MAE of 3.03 MPa. Furthermore, the Delta RMSE was the second lowest at 1.4 MPa. Taking all these factors into account, the optimal LightGBM model was selected with a CV value of 3. Consequently, the optimal hyperparameters for the LightGBM model are 200 estimators, a learning rate of 0.1, a maximum depth of 7, and a subsample of 0.5, as summarized in Table 3.
3.2. Final Model Selection
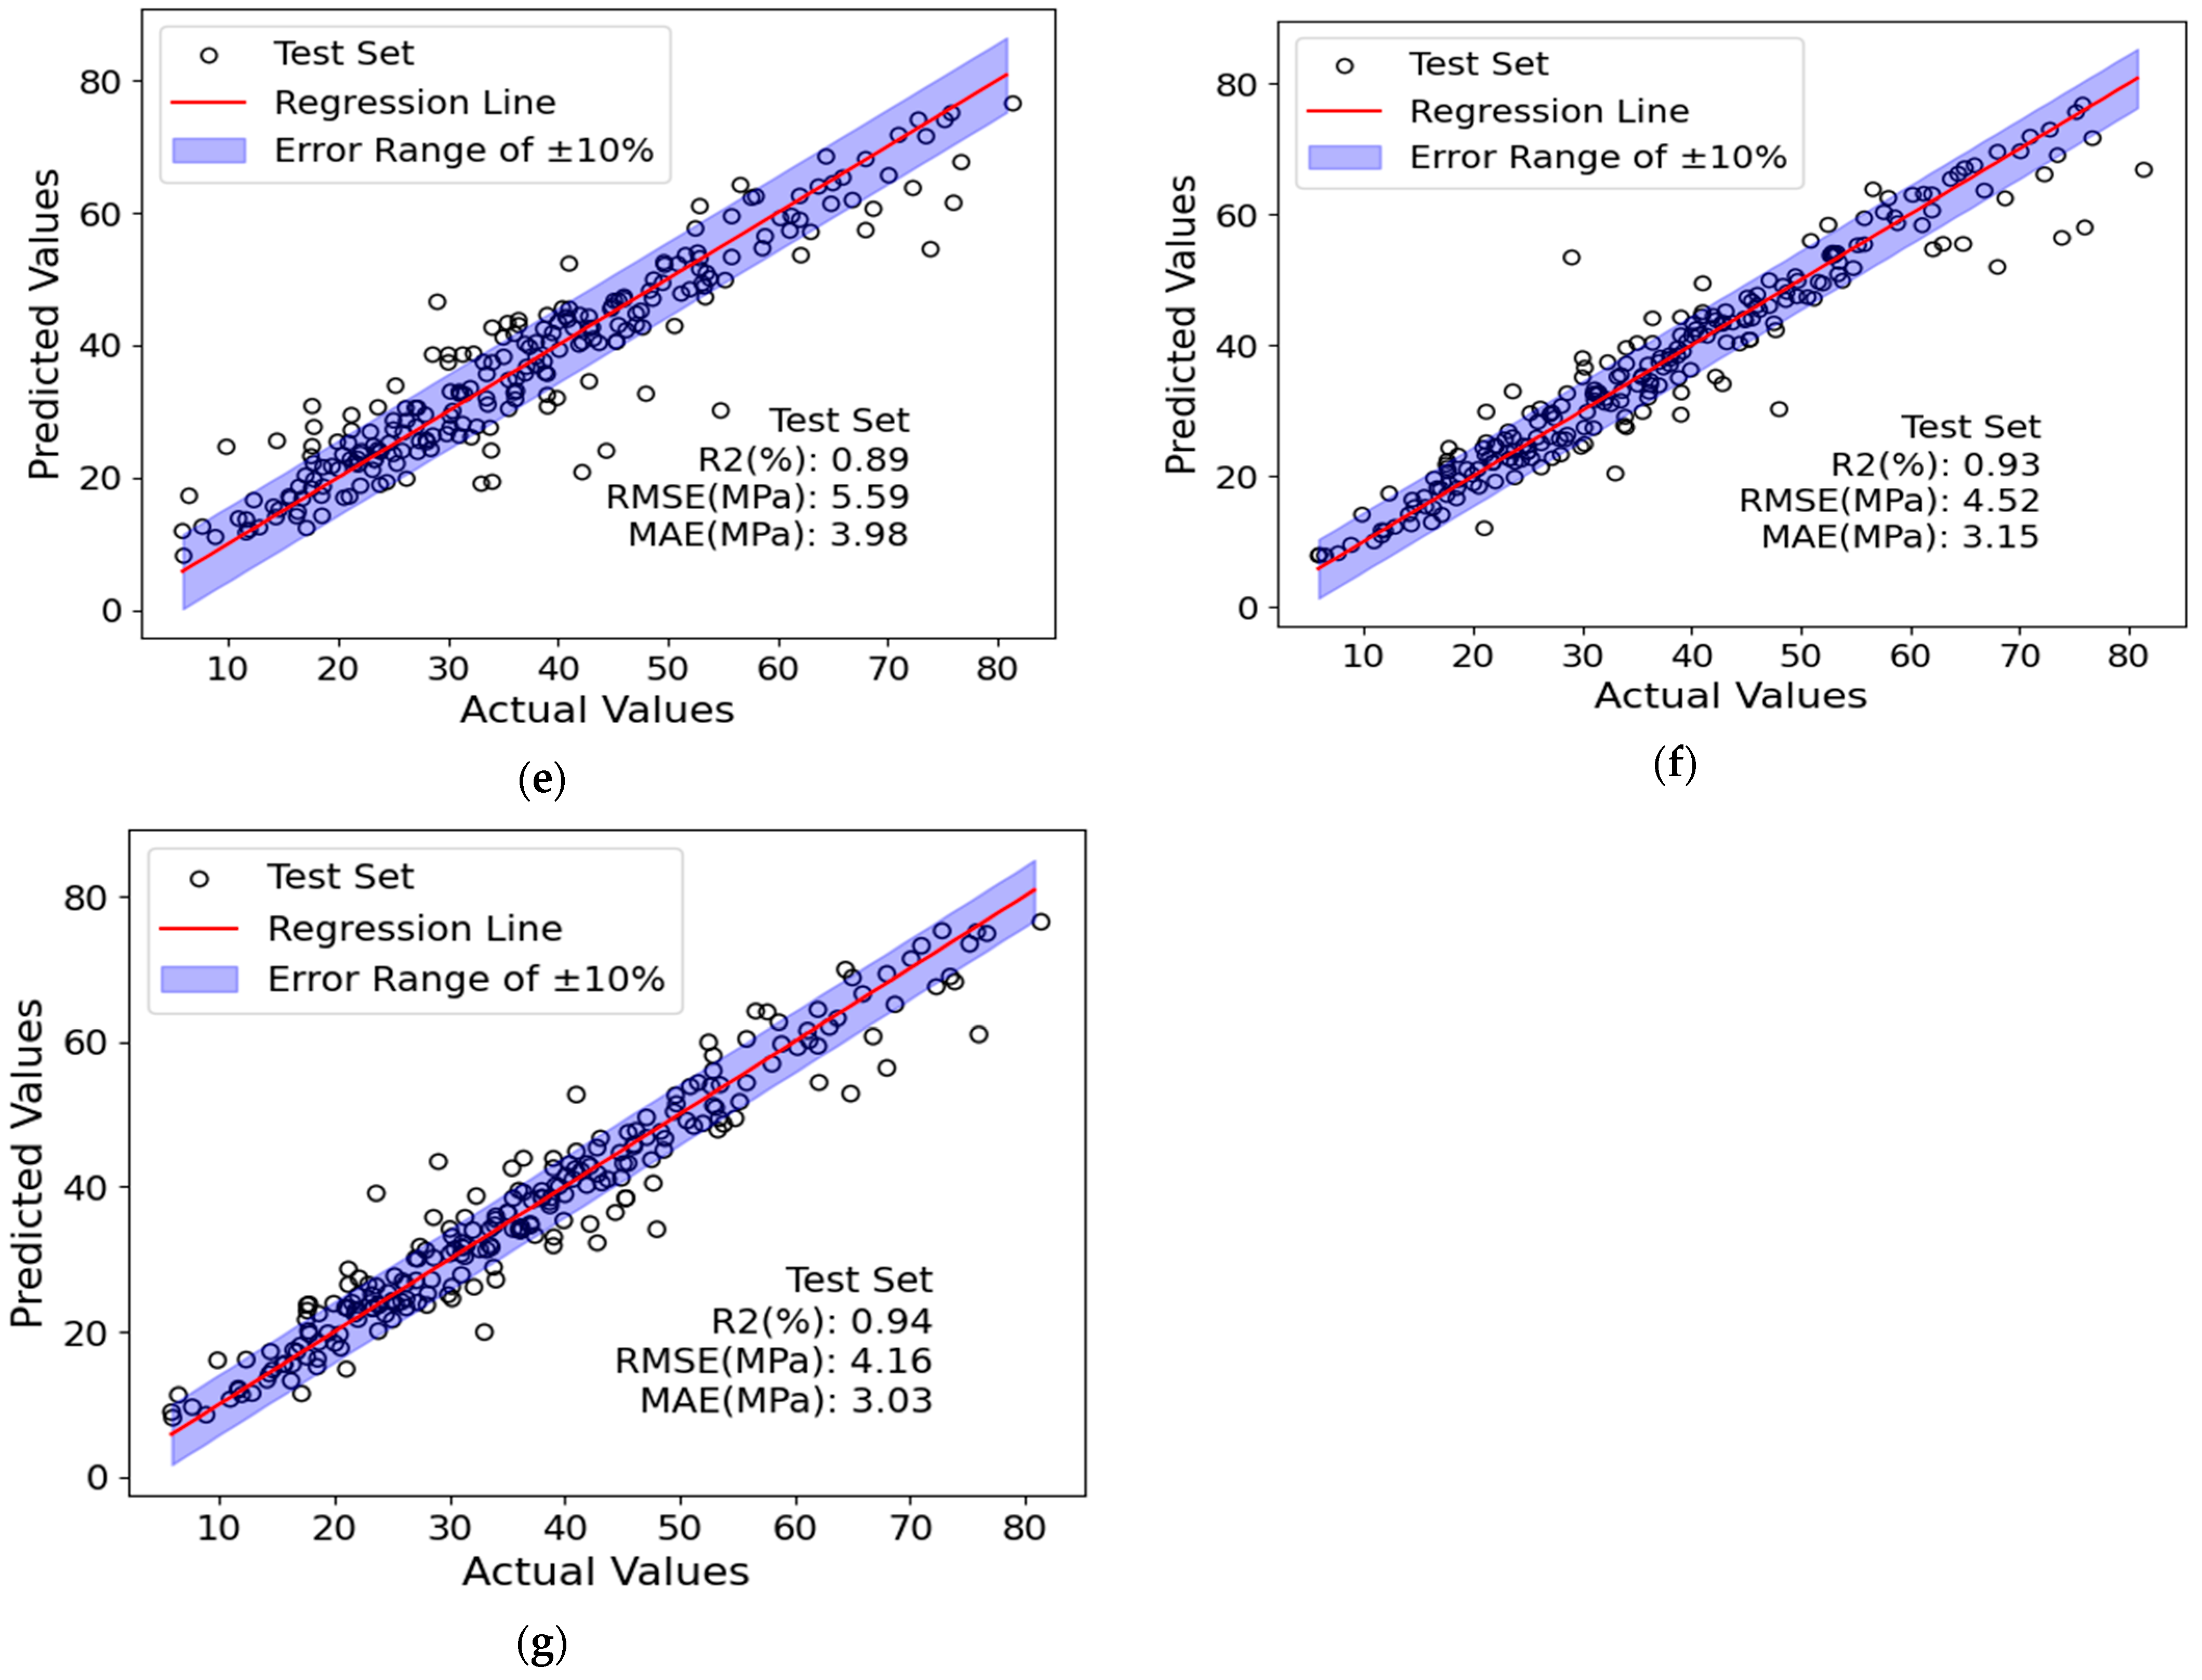
Figure 3 compares the performance of the seven models and visualizes the reliability of their predictions. By examining the scatter plots of the optimal models on the test set, both the model’s performance and the reliability of its predictions can be evaluated. The distribution of the actual values and predicted values is displayed visually, and the regression line and error range of ±10% show how well the predicted values fall within the acceptable range. The data points of XGBoost and LightGBM models are concentrated within the error range of 10%, indicating a better fit compared to the linear regression, SVR, KNN, decision tree, and random forest models. This suggests that the predictions of the XGBoost and LightGBM models can be considered more reliable compared to other models. Previous studies have also demonstrated similar findings. For instance, Cakiroglu et al. [85] used machine learning to study fiber-reinforced concrete and found that both model data samples remained within the ±10% deviation lines, while a study by Abdulalim Alabdullah et al. [71] on high-strength concrete prediction using LightGBM and XGBoost found a strong correlation between experimental and predicted results for both models.
Figure 4 compares the actual values and predicted values from the test dataset of seven optimal models. The horizontal axis represents the index of the test data, and the vertical axis represents the compressive strength. The data points connected by the red line represent the predicted values, while the data points connected by the blue line represent the actual values. A larger distance between the two data points on the y-axis indicates a lower accuracy of the model’s predictions. From the analysis, it can be observed that both the XGBoost and LightGBM models fit the original data very well. Both models show high prediction accuracy between the data indices 50 and 100. Following that, the random forest and decision tree models also exhibit good alignment with similar results. The model with the highest error rate is the linear regression model, with errors evenly distributed across the entire data index. Based on these results, XGBoost and LightGBM models demonstrate high reliability, while the linear regression model shows the least reliable predictions.
In Table 4, the values comparing the performance of the seven optimal models are presented, and Figure 5 illustrates the performance of the models based on Table 4. Through the comparison, the final model was selected based on performance metrics. Firstly, considering the R2 values, the linear regression model had the lowest R2 of 0.66 on the test set. In contrast, XGBoost and LightGBM models demonstrated strong predictive performance, achieving test set R2 values of 0.93 and 0.94, respectively. This aligns with the findings of [85], who reported R2 values of 0.93 for XGBoost and 0.94 for LightGBM. Secondly, looking at the RMSE and MAE values on the test set, the linear regression model had the highest values, while LightGBM had the lowest values of 4.16 MPa and 3.03 MPa, respectively, among the seven models. The RMSE and MAE values for the XGBoost and LightGBM models were also similarly low. Lastly, considering the Delta RMSE, the XGBoost model had a relatively low RMSE difference of 2.24 MPa, while the LightGBM model showed an even lower difference of 1.4 MPa. This indicates better generalization performance on the model. LightGBM exhibits high R2 values on the test set along with low RMSE, MAE, and Delta RMSE values. Based on the provided information, LightGBM exhibits better performance than XGBoost in terms of training time, with LightGBM taking 2.92 s compared to XGBoost 37.26 s. The results from Wang [86] support the superior prediction accuracy of the LightGBM model compared to other models. Similarly, Amin [74] observed that LightGBM exhibited the highest reliability among the XGBoost and random forest models, as indicated by R2, RMSE, and MAE values of 0.865, 3.56 MPa, and 1.3 MPa, respectively. Considering these findings and the evaluation of performance metrics, the LightGBM model was chosen as the optimized and final model for this study.
4. Discussion
4.1. Feature Importance Analysis
Figure 6 shows the feature importance and represents the relative importance of each feature in the final model. Feature importance is a metric used in machine learning models to evaluate the importance of each feature in predicting the outcome. It helps to understand which features have the most significant influence on the model’s predictions. In general, a higher feature importance value indicates a greater impact of that feature on the model’s predictions [87]. The statement regarding the importance of the “Fine Aggregate/Total Material” feature and its influence on compressive strength is consistent with previous studies (e.g., [88]). Similarly, the “Water/Cement” feature is identified as the second most important, aligning with the general understanding that reducing the water–cement ratio can improve the compressive strength of concrete [1,43,75,89]. The third-largest impact is attributed to the “Age” feature, suggesting that curing time or the age of the concrete influences compressive strength, which of course is well known. However, the “Fly Ash/Total Material” feature is reported to have a value of ‘0‘, indicating no impact on compressive strength, which is attributed to limited data availability given that only 12 data in the 752 total dataset included fly ash.
As the main motivator for this study, it can be seen that the moisture condition does not rank very high on the feature importance plot. Moisture condition of the RCA is the 8th ranked feature, indicating that other features, including water-to-cement ratio, total cement content, and coarse RCA content, have a greater impact on the compressive strength of concrete.
4.2. Interaction Plot Analysis
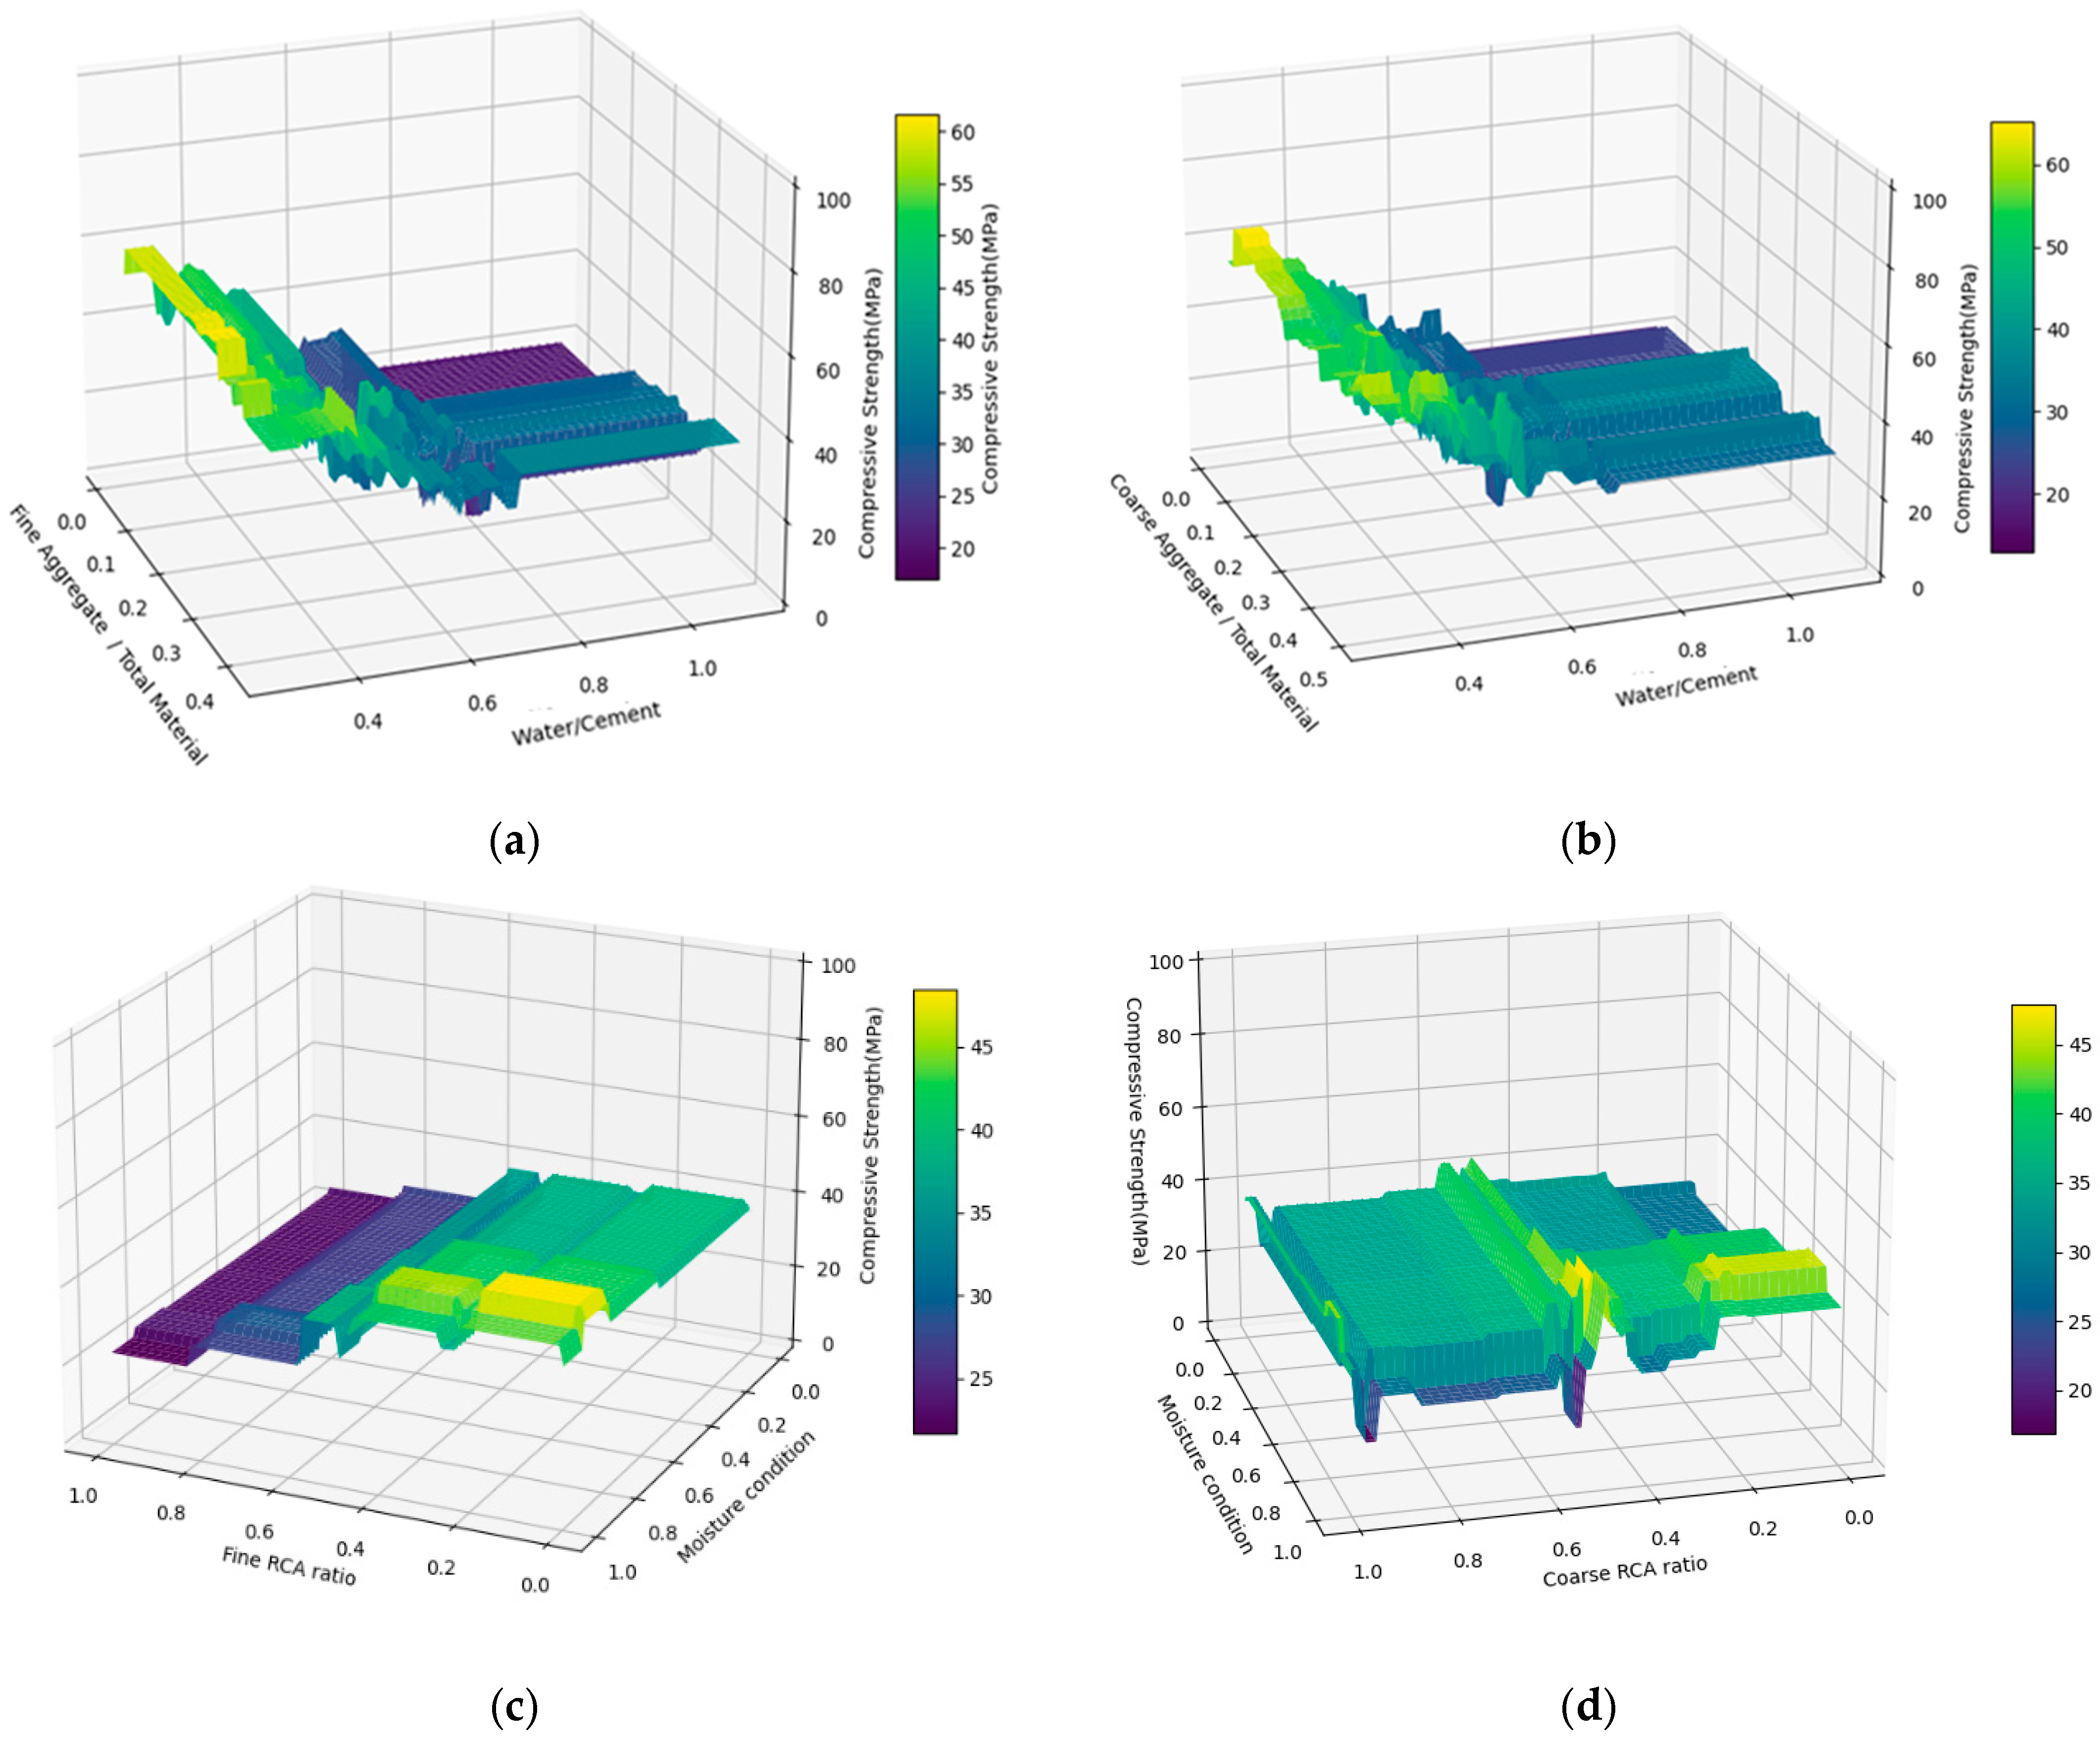
To gain a detailed understanding of the relationships between variables, an interaction plot was utilized to explore the interaction effects among variables. The interaction plot aids in visually comprehending the interplay between variables and comparing their effects at different levels. In this study, based on feature importance, water/cement ratio was chosen as the variable with a significant influence on compressive strength, and an interaction plot was generated. Figure 7 presents the interaction relationship between water/cement ratio, fine aggregate/total material, and compressive strength. The analysis reveals that from a water/cement ratio of 0.6 onwards, there is a sharp decrease in compressive strength; however, when water/cement is fixed at 0.3 and 0.4, the average compressive strength is 55.87 MPa and 50.73 MPa, respectively.
Figure 7 represents an interaction plot among coarse aggregate/total material, water/cement ratio, and compressive strength (MPa). It shows that when the water/cement ratio increases from 0.4 to 0.6, the compressive strength decreases rapidly by at least 17 MPa. Additionally, within the coarse aggregate/total material range of 0 to 0.5, at a water/cement ratio value of 0.3, the average compressive strength is 56.47 MPa, and at a water/cement ratio value of 0.4, the average compressive strength is 48.66 MPa. In conclusion, the research shows that reducing the water–cement ratio in cement mortar leads to higher compressive strength, particularly within the range of 0.3 to 0.4 water–cement ratio. These results are in line with findings from other studies [90]. Similarly, Zhou et al. [91] observed that the dynamic compressive strength of cement mortar increases as water content decreases.
Figure 7 shows the interaction between fine RCA ratio, moisture condition, and compressive strength (MPa). Increasing the fine RCA ratio leads to a decrease in compressive strength, especially in the range of 0.4 to 0.6. This aligns with Kou and Poon [92], who also found reduced strength with higher fine RCA content. They suggested using 25% to 50% fine RCA for maximum compressive and tensile strength. Checking the moisture condition ranging from 0 to 1.0, it was observed that as the moisture condition increased, the compressive strength also increased. A moisture condition at 0.8 exhibited the highest compressive strength within the entire fine RCA ratio range. However, when the moisture condition reaches the fully saturated surface dry (SSD) state, the compressive strength decreases slightly. This indicates that extreme moisture conditions can have a negative impact on the compressive strength of the material. In summary, the research suggests that an ideal fine RCA ratio could be around 0.4 to achieve higher compressive strength in concrete mixtures containing fine recycled aggregates. It is also recommended to maintain a moisture condition in the range of 0.0 to 0.8 to optimize compressive strength properties.
Based on the observations from Figure 7, it is evident that the interaction between coarse RCA ratio, moisture condition, and compressive strength follows certain trends. The highest compressive strength is achieved when the moisture condition is 0.8, and as the moisture condition increases, the compressive strength tends to increase, except when the moisture condition reaches 1.0, where there is a slight decrease in compressive strength. This was observed by Mefteh et al. [37] as well. The use of SSD recycled aggregates had the most significant adverse effect on concrete strength. Also, in the study by Poon et al. [36], the compressive strength decreased when recycled fine and coarse aggregates were in the SSD moisture condition. This decrease in strength can be attributed to the “bleeding” phenomenon, where water from the concrete mixture migrates to the surface of the aggregate particles, and then evaporates from the surface of the concrete mixture. As a result, the water–cement ratio increases during construction, leading to a reduction in the compressive strength of the concrete. Therefore, caution should be exercised when using recycled aggregates in the SSD state to avoid compromising the strength of the concrete.
In summary, the study reveals that for the coarse RCA ratio, values within the range of 0.0 to 0.2 lead to an increase in compressive strength, with the highest strength observed at a coarse RCA ratio of 0.2, irrespective of the moisture condition. However, for coarse aggregate/total material values exceeding 0.4 to 1.0, compressive strength decreases, especially when the coarse RCA ratio falls within the range of 0.4 to 0.6. Additionally, Etxeberria et al. [23] found that incorporating 25% recycled coarse aggregates can achieve mechanical properties equivalent to conventional concrete using the same cement quantity and water-to-cement ratio. Andal et al. [93] also recommended that incorporating 30% recycled coarse aggregates of preserved quality results in concrete of comparable quality to that made with natural aggregates. Based on these findings, the ideal moisture condition would be to avoid reaching SSD for coarse RCA, and the optimum coarse RCA ratio for achieving the highest compressive strength in the concrete mixture is around 0.2.
5. Conclusions and Future Recommendations
This study investigated the relationship between the compressive strength of concrete and the moisture content of RCA using machine learning techniques. Furthermore, various machine learning models were employed to comprehensively understand the impact of RCA moisture content on predicting concrete performance metrics. A literature review was conducted to explore the relationship between RCA moisture content and concrete compressive strength, based on which a database consisting of 752 items was constructed. Subsequently, a predictive model for RCA compressive strength was developed using seven machine learning models, and evaluation metrics were used to assess its performance.
Through the comprehensive construction of the database and the application of seven machine learning models, including XGBoost and LightGBM, the study developed a predictive model for RCA compressive strength. Evaluation results demonstrated that the LightGBM model outperformed other models in terms of R2 values, RMSE, MAE, and generalization performance, thereby proving to be the optimal choice for this study.
Feature importance and interaction plot analyses were conducted to investigate how moisture content affects compressive strength. The analysis revealed that “Age”, “Water/Cement “ and “Fine RCA Ratio” were the most influential features, in line with prior research. Surprisingly, the moisture condition of the RCA ranked relatively low in importance, indicating that factors like water-to-cement ratio and aggregate content had a greater influence. Interaction plot analysis highlighted the significance of water-to-cement ratio, aggregate ratios, and moisture conditions on compressive strength. Notably, reducing the water-to-cement ratio consistently led to higher compressive strength. Maintaining optimal aggregate ratios, both fine and coarse, proved crucial for enhancing compressive strength. Additionally, controlling moisture within specific ranges, particularly avoiding extremes like fully saturated surface dry (SSD) states, was crucial for maximizing compressive strength. These findings support established research, emphasizing the importance of these factors in concrete mixture design for achieving desired mechanical properties.
Overall, this study fills the gap in predicting concrete performance metrics considering RCA moisture content and provides valuable insights for optimizing concrete mixtures containing recycled aggregates. These findings underscore the importance of comprehensive parameter consideration and the use of machine learning techniques in enhancing predictive models for concrete technology.
From a recommendation perspective, further research is needed to understand the impact of various recycled materials on concrete performance and to develop optimal mixtures. Among these, slag, generated during the steel manufacturing process, stands out as a valuable recycled material for concrete production. Properly processed, slag can enhance concrete quality and provide environmental benefits. Leveraging innovative technologies like machine learning to optimize the utilization of recycled materials holds significant promise in promoting sustainable construction and material production. These efforts are expected to contribute to achieving sustainable architecture and material production by enhancing environmental protection and resource efficiency.
Supplementary Materials
The following supporting information can be downloaded at: https://www.mdpi.com/article/10.3390/app14083512/s1, The Supplementary Materials for this article include Python Code and Database Source.
Author Contributions
S.-W.C.: Investigation, Writing—original draft, Writing—review and editing. S.E.C.: Data curation, Software, Validation, Visualization, Writing—original draft. A.S.B.: Methodology, Project Administration, Supervision, Writing—original draft, Writing—review and editing. All authors have read and agreed to the published version of the manuscript.
Funding
This research received no external funding.
Institutional Review Board Statement
Not applicable.
Informed Consent Statement
Not applicable.
Data Availability Statement
The data presented in this study are openly available as Supplementary Materials to this manuscript at https://www.mdpi.com/article/10.3390/app14083512/s1.
Acknowledgments
Thank you to the Peer reviewers for elevating the quality of the paper through their feedback, thereby enhancing its credibility and verifiability.
Conflicts of Interest
The authors declare no conflict of interest.
References
- Liu, K.-H.; Zheng, J.-K.; Pacheco-Torgal, F.; Zhao, X.-Y. Innovative modeling framework of chloride resistance of recycled aggregate concrete using ensemble-machine-learning methods. Constr. Build. Mater. 2022, 337, 127613. [Google Scholar] [CrossRef]
- Cavalline, T.; Snyder, M.B.; Taylor, P. Tech Brief: Use of Recycled Concrete Aggregate in Concrete Paving Mixtures; FHWA-HIF-22-020; Federal Highway Administration: Washington, DC, USA, 2022. [Google Scholar]
- Crackler, T. Recycled Concrete Aggregate Usage in the US; National Concrete Pavement Technology Center, Iowa State University: Ames, IA, USA, 2018. [Google Scholar]
- Feng, J.; Zhang, H.; Gao, K.; Liao, Y.; Gao, W.; Wu, G. Efficient creep prediction of recycled aggregate concrete via machine learning algorithms. Constr. Build. Mater. 2022, 360, 129497. [Google Scholar] [CrossRef]
- Xie, T.; Gholampour, A.; Ozbakkaloglu, T. Toward the development of sustainable concretes with recycled concrete aggregates: Comprehensive review of studies on mechanical properties. J. Mater. Civ. Eng. 2018, 30, 04018211. [Google Scholar] [CrossRef]
- Torgal, F.; Miraldo, S.; Labrincha, J.A.; Brito, J. An overview on concrete carbonation in the context of eco-efficient construction: Evaluation, use of SCMs and/or RAC. Constr. Build. Mater. 2012, 36, 141–150. [Google Scholar] [CrossRef]
- Pavlů, T.; Kočí, V.; Hájek, P. Environmental assessment of two use cycles of recycled aggregate concrete. Sustainability 2019, 11, 6185. [Google Scholar] [CrossRef]
- Torres, A.; Brandt, J.; Lear, K.; Liu, J. A looming tragedy of the sand commons. Science 2017, 357, 970–971. [Google Scholar] [CrossRef] [PubMed]
- Zhang, C.; Hu, M.; Di Maio, F.; Sprecher, B.; Yang, X.; Tukker, A. An overview of the waste hierarchy framework for analyzing the circularity in construction and demolition waste management in Europe. Sci. Total Environ. 2022, 803, 149892. [Google Scholar] [CrossRef] [PubMed]
- Pacheco-Torgal, F.; Ding, Y.; Colangelo, F.; Tuladhar, R.; Koutamanis, A. Advances in Construction and Demolition Waste Recycling: Management, Processing and Environmental Assessment; Woodhead Publishing: Cambridge, UK, 2020. [Google Scholar]
- Tam, V.W.Y.; Soomro, M.; Evangelista, A.C.J. A review of recycled aggregate in concrete applications (2000–2017). Constr. Build. Mater. 2018, 172, 272–292. [Google Scholar] [CrossRef]
- Zhang, H.; Xu, X.; Liu, W.; Zhao, B.; Wang, Q. Influence of the moisture states of aggregate recycled from waste concrete on the performance of the prepared recycled aggregate concrete (RAC)—A review. Constr. Build. Mater. 2022, 326, 126891. [Google Scholar] [CrossRef]
- Kong, D.; Lei, T.; Zheng, J.; Ma, C.; Jiang, J.; Jiang, J. Effect and mechanism of surface-coating pozzalanics materials around aggregate on properties and ITZ microstructure of recycled aggregate concrete. Constr. Build. Mater. 2010, 24, 701–708. [Google Scholar] [CrossRef]
- Singh, N.; Singh, S.P. Carbonation and electrical resistance of self compacting concrete made with recycled concrete aggregates and metakaolin. Constr. Build. Mater. 2016, 121, 400–409. [Google Scholar] [CrossRef]
- Zhang, H.; Zhao, Y. Cracking of reinforced recycled aggregate concrete beams subjected to loads and steel corrosion. Constr. Build. Mater. 2019, 210, 364–379. [Google Scholar] [CrossRef]
- Zhang, H.; Xu, X.; Su, S.; Zeng, W. To improve the resistance of recycled aggregate concrete (RAC) to the internal steel corrosion by the pre-treatment of aggregate. Constr. Build. Mater. 2021, 306, 124911. [Google Scholar] [CrossRef]
- Montero, J.; Laserna, S. Influence of effective mixing water in recycled concrete. Constr. Build. Mater. 2017, 132, 343–352. [Google Scholar] [CrossRef]
- Marinković, S.; Radonjanin, V.; Malešev, M.; Ignjatović, I. Comparative environmental assessment of natural and recycled aggregate concrete. Waste Manag. 2010, 30, 2255–2264. [Google Scholar] [CrossRef]
- Han, T.; Siddique, A.; Khayat, K.; Huang, J.; Kumar, A. An ensemble machine learning approach for prediction and optimization of modulus of elasticity of recycled aggregate concrete. Constr. Build. Mater. 2020, 244, 118271. [Google Scholar] [CrossRef]
- Li, C.; Geng, H.; Deng, C.; Li, B.; Zhao, S. Experimental investigation on columns of steel fiber reinforced concrete with recycled aggregates under large eccentric compression load. Materials 2019, 12, 445. [Google Scholar] [CrossRef]
- Corinaldesi, V. Mechanical and elastic behaviour of concretes made of recycled-concrete coarse aggregates. Constr. Build. Mater. 2010, 24, 1616–1620. [Google Scholar] [CrossRef]
- Evangelista, L.; de Brito, J. Durability performance of concrete made with fine recycled concrete aggregates. Cem. Concr. Compos. 2010, 32, 9–14. [Google Scholar] [CrossRef]
- Etxeberria, M.; Vázquez, E.; Marí, A.; Barra, M. Influence of amount of recycled coarse aggregates and production process on properties of recycled aggregate concrete. Cem. Concr. Res. 2007, 37, 735–742. [Google Scholar] [CrossRef]
- Xiao, J.; Li, J.; Zhang, C. Mechanical properties of recycled aggregate concrete under uniaxial loading. Cem. Concr. Res. 2005, 35, 1187–1194. [Google Scholar] [CrossRef]
- Behnood, A.; Olek, J.; Glinicki, M. Predicting modulus elasticity of recycled aggregate concrete using M5′ model tree algorithm. Constr. Build. Mater. 2015, 94, 137–147. [Google Scholar] [CrossRef]
- Prajapati, R.; Gettu, R.; Singh, S. Thermomechanical beneficiation of recycled concrete aggregates (RCA). Constr. Build. Mater. 2021, 310, 125200. [Google Scholar] [CrossRef]
- Kim, J. Properties of recycled aggregate concrete designed with equivalent mortar volume mix design. Constr. Build. Mater. 2021, 301, 124091. [Google Scholar] [CrossRef]
- Bidabadi, M.S.; Akbari, M.; Panahi, O. Optimum mix design of recycled concrete based on the fresh and hardened properties of concrete. J. Build. Eng. 2020, 32, 101483. [Google Scholar] [CrossRef]
- Jang, H.; Kim, J.; Sicakova, A. Effect of aggregate size on recycled aggregate concrete under equivalent mortar volume mix design. Appl. Sci. 2021, 11, 11274. [Google Scholar] [CrossRef]
- Tam, Y.; Gao, X.; Tam, C. Comparing performance of modified two-stage mixing approach for producing recycled aggregate concrete. Mag. Concr. Res. 2006, 58, 477–484. [Google Scholar] [CrossRef]
- Tam, V.W.Y.; Tam, C.M.; Wang, Y. Optimization on proportion for recycled aggregate in concrete using two-stage mixing approach. Constr. Build. Mater. 2007, 21, 1928–1939. [Google Scholar] [CrossRef]
- Brand, A.; Roesler, J.; Salas, A. Initial moisture and mixing effects on higher quality recycled coarse aggregate concrete. Constr. Build. Mater. 2015, 79, 83–89. [Google Scholar] [CrossRef]
- Brand, A.; Roesler, J. Interfacial transition zone of cement composites with recycled concrete aggregate of different moisture states. Adv. Civ. Eng. Mater. 2018, 7, 87–102. [Google Scholar] [CrossRef]
- Leite, M.B.; Monteiro, P.J.M. Microstructural analysis of recycled concrete using X-ray microtomography. Cem. Concr. Res. 2016, 81, 38–48. [Google Scholar] [CrossRef]
- Le, T.; Le Saout, G.; Garcia-Diaz, E.; Damien, B.; Rémond, S. Hardened behavior of mortar based on recycled aggregate: Influence of saturation state at macro- and microscopic scales. Constr. Build. Mater. 2017, 141, 479–490. [Google Scholar] [CrossRef]
- Poon, C.S.; Shui, Z.H.; Lam, L.; Fok, H.; Kou, S.C. Influence of moisture states of natural and recycled aggregates on the slump and compressive strength of concrete. Cem. Concr. Res. 2004, 34, 31–36. [Google Scholar] [CrossRef]
- Mefteh, H.; Kebaïli, O.; Oucief, H.; Berredjem, L.; Arabi, N. Influence of moisture conditioning of recycled aggregates on the properties of fresh and hardened concrete. J. Clean. Prod. 2013, 54, 282–288. [Google Scholar] [CrossRef]
- McNeil, K.; Kang, T.H.K. Recycled concrete aggregates: A review. Int. J. Concr. Struct. Mater. 2013, 7, 61–69. [Google Scholar] [CrossRef]
- Montgomery, D. Workability and compressive strength properties of concrete containing recycled concrete aggregate. In Sustainable Construction: Use of Recycled Concrete Aggregate; Thomas Telford: London, UK, 1998; pp. 287–296. [Google Scholar]
- Bui, N.K.; Satomi, T.; Takahashi, H. Effect of mineral admixtures on properties of recycled aggregate concrete at high temperature. Constr. Build. Mater. 2018, 184, 361–373. [Google Scholar] [CrossRef]
- Dosho, Y. Effect of mineral admixtures on the performance of low-quality recycled aggregate concrete. Crystals 2021, 11, 596. [Google Scholar] [CrossRef]
- Ju, M.; Jeong, J.G.; Palou, M.; Park, K. Mechanical behavior of fine recycled concrete aggregate concrete with the mineral admixtures. Materials 2020, 13, 2264. [Google Scholar] [CrossRef] [PubMed]
- Tran, V.Q.; Dang, V.Q.; Ho, L.S. Evaluating compressive strength of concrete made with recycled concrete aggregates using machine learning approach. Constr. Build. Mater. 2022, 323, 126578. [Google Scholar] [CrossRef]
- Choi, W.-C.; Yun, H.-D. Compressive behavior of reinforced concrete columns with recycled aggregate under uniaxial loading. Eng. Struct. 2012, 41, 285–293. [Google Scholar] [CrossRef]
- Cree, D.; Green, M.; Noumowé, A. Residual strength of concrete containing recycled materials after exposure to fire: A review. Constr. Build. Mater. 2013, 45, 208–223. [Google Scholar] [CrossRef]
- Gamil, Y. Machine learning in concrete technology: A review of current researches, trends, and applications. Front. Built Environ. 2023, 9, 1145591. [Google Scholar] [CrossRef]
- Dabiri, H.; Kioumarsi, M.; Kheyroddin, A.; Kandiri, A.; Sartipi, F. Compressive strength of concrete with recycled aggregate; a machine learning-based evaluation. Clean. Mater. 2022, 3, 100044. [Google Scholar] [CrossRef]
- Ozbakkaloglu, T.; Gholampour, A.; Xie, T. Mechanical and durability properties of recycled aggregate concrete: Effect of recycled aggregate properties and content. J. Mater. Civ. Eng. 2018, 30, 04017275. [Google Scholar] [CrossRef]
- Li, L.G.; Lin, C.J.; Chen, G.M.; Kwan, A.K.H.; Jiang, T. Effects of packing on compressive behaviour of recycled aggregate concrete. Constr. Build. Mater. 2017, 157, 757–777. [Google Scholar] [CrossRef]
- Pepe, M.; Toledo Filho, R.D.; Koenders, E.A.B.; Martinelli, E. A novel mix design methodology for Recycled Aggregate Concrete. Constr. Build. Mater. 2016, 122, 362–372. [Google Scholar] [CrossRef]
- Berredjem, L.; Arabi, N.; Molez, L. Mechanical and durability properties of concrete based on recycled coarse and fine aggregates produced from demolished concrete. Constr. Build. Mater. 2020, 246, 118421. [Google Scholar] [CrossRef]
- Butler, L.; West, J.S.; Tighe, S.L. Effect of recycled concrete coarse aggregate from multiple sources on the hardened properties of concrete with equivalent compressive strength. Constr. Build. Mater. 2013, 47, 1292–1301. [Google Scholar] [CrossRef]
- Puente de Andrade, G.; de Castro Polisseni, G.; Pepe, M.; Toledo Filho, R.D. Design of structural concrete mixtures containing fine recycled concrete aggregate using packing model. Constr. Build. Mater. 2020, 252, 119091. [Google Scholar] [CrossRef]
- Chen, X.; Zhang, H.; Geng, Y.; Wang, Y.-Y. Tests and prediction model for time-dependent internal relative humidity of recycled aggregate concrete due to self-desiccation. Constr. Build. Mater. 2022, 352, 129024. [Google Scholar] [CrossRef]
- Brandes, M.R.; Kurama, Y. Effect of recycled concrete aggregates on strength and stiffness gain of concrete and on bond strength of steel prestressing strand. PCI J. 2018, 63, 87–105. [Google Scholar] [CrossRef]
- Gumede, M.T.; Franklin, S.O. Studies on strength and related properties of concrete incorporating aggregates from demolished wastes: Part 2—Compressive and flexural strengths. Open J. Civ. Eng. 2015, 05, 175. [Google Scholar] [CrossRef]
- Sun, D.; Huang, W.; Liu, K.; Ma, R.; Wang, A.; Guan, Y.; Shen, S. Effect of the moisture content of recycled aggregate on the mechanical performance and durability of concrete. Materials 2022, 15, 6299. [Google Scholar] [CrossRef] [PubMed]
- Garcia-Gonzalez, J.; Rodriguez-Robles, D.; Juan-Valdes, A.; Moran-Del Pozo, J.M.; Guerra-Romero, M.I. Pre-saturation technique of the recycled aggregates: Solution to the water absorption drawback in the recycled concrete manufacture. Materials 2014, 7, 6224–6236. [Google Scholar] [CrossRef] [PubMed]
- Yildirim, S.T.; Meyer, C.; Herfellner, S. Effects of internal curing on the strength, drying shrinkage and freeze–thaw resistance of concrete containing recycled concrete aggregates. Constr. Build. Mater. 2015, 91, 288–296. [Google Scholar] [CrossRef]
- Ismail, S. Effect of different moisture states of surface-treated recycled concrete aggregate on properties of fresh and hardened concrete. Int. J. Mater. Metall. Eng. 2014, 8, 65–71. [Google Scholar] [CrossRef]
- Koenders, E.A.B.; Pepe, M.; Martinelli, E. Compressive strength and hydration processes of concrete with recycled aggregates. Cem. Concr. Res. 2014, 56, 203–212. [Google Scholar] [CrossRef]
- Fan, C.-C.; Huang, R.; Hwang, H.; Chao, S.-J. Properties of concrete incorporating fine recycled aggregates from crushed concrete wastes. Constr. Build. Mater. 2016, 112, 708–715. [Google Scholar] [CrossRef]
- Shicong, K. Reusing Recycled Aggregates in Structural Concrete. Ph.D. Thesis, Hong Kong Polytechnic University, Hong Kong, 2006. [Google Scholar]
- Pradhan, S.; Kumar, S.; Barai, S.V. Recycled aggregate concrete: Particle Packing Method (PPM) of mix design approach. Constr. Build. Mater. 2017, 152, 269–284. [Google Scholar] [CrossRef]
- Lin, Y.-H.; Tyan, Y.-Y.; Chang, T.-P.; Chang, C.-Y. An assessment of optimal mixture for concrete made with recycled concrete aggregates. Cem. Concr. Res. 2004, 34, 1373–1380. [Google Scholar] [CrossRef]
- Zhang, C.; Zhu, Z.; Liu, F.; Yang, Y.; Wan, Y.; Huo, W.; Yang, L. Efficient machine learning method for evaluating compressive strength of cement stabilized soft soil. Constr. Build. Mater. 2023, 392, 131887. [Google Scholar] [CrossRef]
- Shahriyari, L. Effect of normalization methods on the performance of supervised learning algorithms applied to HTSeq-FPKM-UQ data sets: 7SK RNA expression as a predictor of survival in patients with colon adenocarcinoma. Brief. Bioinform. 2019, 20, 985–994. [Google Scholar] [CrossRef] [PubMed]
- Ahsan, M.M.; Mahmud, M.A.P.; Saha, P.K.; Gupta, K.D.; Siddique, Z. Effect of data scaling methods on machine learning algorithms and model performance. Technologies 2021, 9, 52. [Google Scholar] [CrossRef]
- Young, B.A.; Hall, A.; Pilon, L.; Gupta, P.; Sant, G. Can the compressive strength of concrete be estimated from knowledge of the mixture proportions?: New insights from statistical analysis and machine learning methods. Cem. Concr. Res. 2019, 115, 379–388. [Google Scholar] [CrossRef]
- Cook, R.; Lapeyre, J.; Ma, H.; Kumar, A. Prediction of Compressive Strength of Concrete: Critical Comparison of Performance of a Hybrid Machine Learning Model with Standalone Models. J. Mater. Civ. Eng. 2019, 31, 1–15. [Google Scholar] [CrossRef]
- Abdulalim Alabdullah, A.; Iqbal, M.; Zahid, M.; Khan, K.; Nasir Amin, M.; Jalal, F.E. Prediction of rapid chloride penetration resistance of metakaolin based high strength concrete using light GBM and XGBoost models by incorporating SHAP analysis. Constr. Build. Mater. 2022, 345, 128296. [Google Scholar] [CrossRef]
- Ayaz, Y.; Kocamaz, A.F.; Karakoç, M.B. Modeling of compressive strength and UPV of high-volume mineral-admixtured concrete using rule-based M5 rule and tree model M5P classifiers. Constr. Build. Mater. 2015, 94, 235–240. [Google Scholar] [CrossRef]
- Zhang, J.; Ma, G.; Huang, Y.; Sun, J.; Aslani, F.; Nener, B. Modelling uniaxial compressive strength of lightweight self-compacting concrete using random forest regression. Constr. Build. Mater. 2019, 210, 713–719. [Google Scholar] [CrossRef]
- Amin, M.N.; Salami, B.A.; Zahid, M.; Iqbal, M.; Khan, K.; Abu-Arab, A.M.; Alabdullah, A.A.; Jalal, F.E. Investigating the bond strength of FRP laminates with concrete using LIGHT GBM and SHAPASH analysis. Polymers 2022, 14, 4717. [Google Scholar] [CrossRef]
- Zhang, X.; Dai, C.; Li, W.; Chen, Y. Prediction of compressive strength of recycled aggregate concrete using machine learning and Bayesian optimization methods. Front. Earth Sci. 2023, 11, 1112105. [Google Scholar] [CrossRef]
- Bergstra, J.; Bardenet, R.; Kégl, B.; Bengio, Y. Algorithms for Hyper-Parameter Optimization. Adv. Neural Inf. Process. Syst. 2011, 24, 2546–2554. [Google Scholar]
- Cortes, C.; Vapnik, V. Support-vector networks. Mach. Learn. 1995, 20, 273–297. [Google Scholar] [CrossRef]
- Montesinos López, O.A.; Montesinos López, A.; Crossa, J. Support vector machines and support vector regression. In Multivariate Statistical Machine Learning Methods for Genomic Prediction; Montesinos López, O.A., Montesinos López, A., Crossa, J., Eds.; Springer International Publishing: Cham, Switzerland, 2022; pp. 337–378. [Google Scholar] [CrossRef]
- Escalante, H.J.; Montes, M.; Sucar, L. Particle swarm model selection. J. Mach. Learn. Res. 2009, 10, 405–440. [Google Scholar]
- Song, Y.-Y.; Lu, Y. Decision tree methods: Applications for classification and prediction. Shanghai Arch. Psychiatry 2015, 27, 130–135. [Google Scholar] [CrossRef] [PubMed]
- Probst, P.; Boulesteix, A.-L.; Wright, M. Hyperparameters and Tuning Strategies for Random Forest. Wiley Interdiscip. Rev. Data Min. Knowl. Discov. 2018, 9, e1301. [Google Scholar] [CrossRef]
- Sommer, J.; Sarigiannis, D.; Parnell, T. Learning to tune XGBoost with XGBoost. arXiv 2019, arXiv:1909.07218. [Google Scholar]
- Xiong, X.; Guo, X.; Zeng, P.; Zou, R.; Wang, X. A short-term wind power forecast method via xgboost hyper-parameters optimization. Front. Energy Res. 2022, 10, 905155. [Google Scholar] [CrossRef]
- Gan, M.; Pan, S.; Chen, Y.; Cheng, C.; Pan, H.; Zhu, X. Application of the machine learning lightgbm model to the prediction of the water levels of the lower columbia river. J. Mar. Sci. Eng. 2021, 9, 496. [Google Scholar] [CrossRef]
- Cakiroglu, C.; Aydın, Y.; Bekdaş, G.; Geem, Z.W. Interpretable predictive modelling of basalt fiber reinforced concrete splitting tensile strength using ensemble machine learning methods and SHAP approach. Materials 2023, 16, 4578. [Google Scholar] [CrossRef]
- Wang, X.; Chen, A.; Liu, Y. Explainable ensemble learning model for predicting steel section-concrete bond strength. Constr. Build. Mater. 2022, 356, 129239. [Google Scholar] [CrossRef]
- Liu, L.; Chen, J. Effect of concretion wastes recycled aggregate on concrete performance. In Proceedings of the 2017 3rd International Forum on Energy, Environment Science and Materials (IFEESM 2017), Shenzhen, China, 25–26 November 2017. [Google Scholar] [CrossRef]
- Peng, Y.; Unluer, C. Modeling the mechanical properties of recycled aggregate concrete using hybrid machine learning algorithms. Resour. Conserv. Recycl. 2023, 190, 106812. [Google Scholar] [CrossRef]
- Liu, J.; Han, X.; Pan, Y.; Cui, K.; Xiao, Q. Physics-assisted machine learning methods for predicting the splitting tensile strength of recycled aggregate concrete. Sci. Rep. 2023, 13, 9078. [Google Scholar] [CrossRef] [PubMed]
- Haach, V.G.; Vasconcelos, G.; Lourenço, P.B. Influence of aggregates grading and water/cement ratio in workability and hardened properties of mortars. Constr. Build. Mater. 2011, 25, 2980–2987. [Google Scholar] [CrossRef]
- Zhou, J.; Chen, X.; Wu, L.; Kan, X. Influence of free water content on the compressive mechanical behaviour of cement mortar under high strain rate. Sadhana 2011, 36, 357–369. [Google Scholar] [CrossRef]
- Kou, S.C.; Poon, C.S. Properties of self-compacting concrete prepared with coarse and fine recycled concrete aggregates. Cem. Concr. Compos. 2009, 31, 622–627. [Google Scholar] [CrossRef]
- Andal, J.; Shehata, M.; Zacarias, P. Properties of concrete containing recycled concrete aggregate of preserved quality. Constr. Build. Mater. 2016, 125, 842–855. [Google Scholar] [CrossRef]
Figure 1.
Performance metrics for each cross-validation value of the models, including (a) R2; (b) RMSE; (c) MAE; and (d) Delta RMSE.
Figure 1.
Performance metrics for each cross-validation value of the models, including (a) R2; (b) RMSE; (c) MAE; and (d) Delta RMSE.

Figure 2.
Optimal model of decision tree.

Figure 3.
Evaluation of the optimal model’s performance of (a) linear regression; (b) SVR; (c) KNN; (d) decision tree; (e) random forest; (f) XGBoost; and (g) LightGBM.
Figure 3.
Evaluation of the optimal model’s performance of (a) linear regression; (b) SVR; (c) KNN; (d) decision tree; (e) random forest; (f) XGBoost; and (g) LightGBM.


Figure 4.
Actual and predicted values for the test data using the optimal models of (a) linear regression; (b) SVR; (c) KNN; (d) decision tree; (e) random forest; (f) XGBoost; and (g) LightGBM.
Figure 4.
Actual and predicted values for the test data using the optimal models of (a) linear regression; (b) SVR; (c) KNN; (d) decision tree; (e) random forest; (f) XGBoost; and (g) LightGBM.


Figure 5.
Comparing the optimal models using (a) R2; (b) RMSE; (c) MSE; (d) Delta RMSE; and (e) training time.
Figure 5.
Comparing the optimal models using (a) R2; (b) RMSE; (c) MSE; (d) Delta RMSE; and (e) training time.

Figure 6.
Feature importance of the final model.

Figure 7.
Result of interaction plot (a) relationship between fine aggregate/total material, water/cement, and compressive strength; (b) relationship between coarse aggregate/total material, water/Cement, and compressive strength; (c) relationship between fine RCA ratio, moisture condition, and compressive Strength; and (d) relationship between coarse RCA, moisture condition, and compressive strength.


Table 1.
Database source.
| No. | Reference | Number of Data | No. | Reference | Number of Data |
|---|---|---|---|---|---|
| 1 | [32] | 12 | 12 | [49] | 36 |
| 2 | [50] | 10 | 13 | [51] | 15 |
| 3 | [52] | 8 | 14 | [53] | 10 |
| 4 | [29] | 27 | 15 | [54] | 6 |
| 5 | [55] | 50 | 16 | [22] | 3 |
| 6 | [56] | 24 | 17 | [57] | 14 |
| 7 | [36] | 36 | 18 | [58] | 4 |
| 8 | [59] | 54 | 19 | [60] | 18 |
| 9 | [34] | 5 | 20 | [61] | 20 |
| 10 | [62] | 42 | 21 | [63] | 300 |
| 11 | [64] | 12 | 22 | [65] | 46 |
| Total Data: 752 |
Table 2.
Database analysis.
| Parameters | Unit | Mean | Standard Deviation | Min | 25 Percentile | 50 Percentile | 75 Percentile | Max |
|---|---|---|---|---|---|---|---|---|
| Coarse RCA Ratio | - | 0.46 | 0.41 | 0 | 0 | 0.49 | 1 | 1 |
| Fine RCA Ratio | - | 0.12 | 0.30 | 0 | 0 | 0 | 0 | 1 |
| Cement/Total Material | - | 0.18 | 0.03 | 0.1 | 0.16 | 0.18 | 0.19 | 0.28 |
| Fly Ash/Total Material | - | 0.001 | 0.006 | 0 | 0 | 0 | 0 | 0.04 |
| Water/Total Material | - | 0.09 | 0.02 | 0.04 | 0.08 | 0.09 | 0.1 | 0.18 |
| Superplasticizer/Total Material | - | 0.01 | 0.04 | 0 | 0 | 0 | 0 | 0.17 |
| Coarse Aggregate/Total Material | - | 0.21 | 0.17 | 0 | 0 | 0.22 | 0.37 | 0.5 |
| Fine Aggregate/Total Material | - | 0.26 | 0.09 | 0 | 0.26 | 0.28 | 0.3 | 0.43 |
| Fine RCA/Total Material | - | 0.05 | 0.13 | 0 | 0 | 0 | 0 | 0.73 |
| Coarse RCA/Total Material | - | 0.2 | 0.17 | 0 | 0 | 0.19 | 0.39 | 0.47 |
| Moisture Condition | - | 0.88 | 0.3 | 0 | 1 | 1 | 1 | 1 |
| Age | Day | 23.06 | 25.89 | 1 | 7 | 14 | 28 | 90 |
| Water/Cement | - | 0.46 | 0.12 | 0.27 | 0.42 | 0.5 | 0.55 | 1.11 |
| Compressive Strength | MPa | 36.82 | 16.20 | 4.8 | 24.63 | 35.4 | 47.33 | 85.2 |
Table 3.
Optimal hyperparameter values and CV fold.
| Model | Best Hyperparameter | CV |
|---|---|---|
| SVR | Cost: 100 Epsilon: 0.1 Gamma: 0.1 Kernel: Gaussian | 2 |
| KNN | Number of neighbors: 5 Weights: distance Algorithm: auto Power parameter: Euclidean distance | 2 |
| Decision tree | Maximum depth: 7 Minimum number of sample split: 5 Maximum number of features: square root Criterion: mean squared error | 3 |
| Random forest | Number of estimators: 200 Maximum depth: None Minimum number of samples split: 2 Number of minimum samples leaf: 1 | 3 |
| XGBoost | Number of estimators: 200 Learning rate: 0.1 Maximum depth: 5 Number of subsamples: 0.5 | 10 |
| LightGBM | Number of estimators: 200 Learning rate: 0.1 Maximum depth: 7 Number of subsamples: 0.5 | 3 |
Table 4.
Comparing the performance indicators of optimal models.
| Database | Indicators | Models | ||||||
|---|---|---|---|---|---|---|---|---|
| Linear Regression | SVR | KNN | Decision Tree | Random Forest | XGBoost | LightGBM | ||
| Training set | R2 | 0.65 | 0.86 | 0.99 | 0.86 | 0.97 | 0.98 | 0.97 |
| RMSE (MPa) | 9.41 | 6.07 | 1.57 | 6.05 | 2.62 | 2.28 | 2.76 | |
| MAE (MPa) | 7.41 | 3.75 | 0.38 | 4.52 | 1.8 | 1.54 | 1.98 | |
| Test set | R2 | 0.66 | 0.79 | 0.74 | 0.82 | 0.89 | 0.93 | 0.94 |
| RMSE (MPa) | 9.72 | 7.67 | 8.48 | 7.03 | 5.59 | 4.52 | 4.16 | |
| MAE (MPa) | 7.67 | 5.25 | 5.91 | 5.46 | 3.98 | 3.15 | 3.03 | |
| Delta RMSE (MPa) | 0.31 | 1.6 | 6.91 | 0.98 | 2.97 | 2.24 | 1.4 | |
| Training time (seconds) | 0.03 | 5.01 | 0.07 | 0.37 | 43.37 | 37.26 | 2.92 | |
Disclaimer/Publisher’s Note: The statements, opinions and data contained in all publications are solely those of the individual author(s) and contributor(s) and not of MDPI and/or the editor(s). MDPI and/or the editor(s) disclaim responsibility for any injury to people or property resulting from any ideas, methods, instructions or products referred to in the content. |
© 2024 by the authors. Licensee MDPI, Basel, Switzerland. This article is an open access article distributed under the terms and conditions of the Creative Commons Attribution (CC BY) license (https://creativecommons.org/licenses/by/4.0/).
Share and Cite
MDPI and ACS Style
Cho, S.-W.; Cho, S.E.; Brand, A.S. A Meta-Analysis of the Effect of Moisture Content of Recycled Concrete Aggregate on the Compressive Strength of Concrete. Appl. Sci. 2024, 14, 3512. https://doi.org/10.3390/app14083512
AMA Style
Cho S-W, Cho SE, Brand AS. A Meta-Analysis of the Effect of Moisture Content of Recycled Concrete Aggregate on the Compressive Strength of Concrete. Applied Sciences. 2024; 14(8):3512. https://doi.org/10.3390/app14083512
Chicago/Turabian StyleCho, Sung-Won, Sung Eun Cho, and Alexander S. Brand. 2024. "A Meta-Analysis of the Effect of Moisture Content of Recycled Concrete Aggregate on the Compressive Strength of Concrete" Applied Sciences 14, no. 8: 3512. https://doi.org/10.3390/app14083512
Note that from the first issue of 2016, this journal uses article numbers instead of page numbers. See further details here.