
Enhanced Visual Performance for In–Vehicle Reading Task Evaluated by Preferences, Emotions and Sustained Attention


Department of Illuminating Engineering & Light Sources, School of Information Science and Technology, Fudan University, Shanghai 200433, China
*
Authors to whom correspondence should be addressed.
Appl. Sci. 2024, 14(8), 3513; https://doi.org/10.3390/app14083513
Submission received: 28 February 2024
/
Revised: 12 April 2024
/
Accepted: 12 April 2024
/
Published: 22 April 2024
(This article belongs to the Section Transportation and Future Mobility)
Abstract
:The proliferation of electric and hybrid vehicles has made it possible for people to read and work in a stationary vehicle for extended periods. However, the current commonly used in–vehicle lighting design is still centered around driving and driving safety. Following recommendations from the literature, a neutral white color band (4000 K–5000 K) with 50–100 lx at the vehicle table area is favored. Whether this lighting environment can meet the needs to enhance the reading performance in a modern vehicle was investigated in this presented study. Therefore, in total, 12 lighting settings were designed based on combinations of four illuminance levels (50 lx, 100 lx, 150 lx and 200 lx) and three correlated color temperatures (3000 K, 4000 K and 5000 K); we recruited 19 subjects (12 females, 7 males) and let study participants evaluate each condition based on electronic and paper reading. Next, subjective preferences, positive and negative emotions, feeling of fatigue and sustained attention were tested. We found that higher illuminance and higher CCT (Correlated Color Temperature) can significantly improve the performance of in–vehicle readers in most aspects following Kruithof’s law (p < 0.05). Among them, we recommend the combination of 150 lx and 4000 K as the light parameters for in–vehicle reading as a new development guideline. In addition, we also discovered the inconsistency of people’s lighting preferences between in–vehicle spaces and conventional spaces. For indoor lighting, illuminance values up to 1000 lx are still favored. For an in–vehicle function, starting with 200 lx, the preference level and reading performance already declined. In comparison between electronic and paper reading, both were similarly evaluated. These results show that a neutral white light color should be chosen with a horizontal illuminance of maximal 150 lx for a reading light function independent of the reading device. Interdisciplinarily speaking, our findings can be applied in similar small spaces or transportation modes with gentle acceleration and deceleration such as small space hotel rooms, trains, airplanes or ships.
1. Introduction
Historically, vehicles were predominantly viewed as means of transport, leading to the design of traditional interior lighting being centered on the requirements of driving. This resulted in lighting that was low in brightness–to avoid impairing the driver’s vision—with a yellowish hue and point-based sources. The primary function was to illuminate key areas such as the central console, door handles, and storage compartments [1].
Despite the widespread adoption of ambient lighting within vehicle interiors in recent years, its role has largely been decorative, offering minimal utility for tasks like reading [2]. However, the focus of in–vehicle activities is shifting towards working and reading, rendering traditional lighting inadequate for these new demands [3]. Moreover, applying conventional environmental lighting research to the complex in-car environment poses challenges. In standard settings, desk-level illumination is typically set at a minimum of 300 lx to satisfy reading brightness requirements [4,5,6,7,8,9,10,11,12], with levels below 300 lx often considered uncomfortable or unsatisfactory [13,14,15,16,17,18]. Preferences for lighting scenes improve as illumination increases from 1000 lx to 1800 lx [19]. Yet, recent studies on lighting in small spaces have opted for significant lower levels of horizontal illumination than those used in larger areas. For instance, research on capsule hotel lighting by Yu et al. explored illumination levels of 150 lx and 300 lx [20], while Chen et al. investigated a range from 20 lx to 250 lx in very small spaces, finding optimal comfort at 100 lx before it declined with increased brightness [21]. These variations in research parameters and findings highlight the complexity of adapting lighting studies from conventional to specialized small spaces [22,23,24,25,26,27,28,29].
Small spaces, defined by their significantly reduced physical and psychological dimensions compared to standard environments, offer considerable advantages in space and cost savings [30,31]. Existing research has shown that as vertical illuminance increases, the overall perception of spatial brightness in subway cabins is enhanced [32]. The interior of vehicles represents a quintessential example of such a small space environment.
The evolution of vehicle lighting, marked by the shift to LED technology, has significantly enhanced in–vehicle lighting functions. Previously limited to basic tasks with white tungsten lamps, modern vehicles now offer advanced lighting and connectivity features. LED’s energy efficiency and design flexibility, coupled with vehicle internet connectivity, have transformed vehicles into mobile offices and reading spaces, enabling activities like online reading and extended work sessions during travel.
These two big changes make the research of the lighting environment for stationary in–vehicle reading essienital and urgent. This study aims to explore the impact of illuminance and CCT on visual preference, emotions, sustained attention, and fatigue.
2. Materials and Method
2.1. Design
In this research, we designated illuminance, CCT, and reading modalities as the independent variables, while the participants’ subjective evaluations of the lighting environment and their attention served as the dependent variables. Existing research indicates that reading on paper requires significantly higher illumination levels compared to reading on electronic devices [33]. Therefore, we chose four illuminance levels (50 lx, 100 lx, 150 lx, and 200 lx) and three color temperatures (3000 K, 4000 K, and 5000 K) to investigate their effects on reading behavior in a vehicle setting. These selections cover a range of common lighting conditions found in both automotive and residential environments.
The illuminance levels range from dim (50 lx) to bright (200 lx), simulating various lighting scenarios one might encounter while reading in a vehicle. The color temperatures were selected to represent warm (3000 K), neutral (4000 K), and cool (5000 K) light, mirroring the spectrum of light individuals are exposed to throughout the day and in different settings.
This range of illuminance and color temperatures allows us to explore how various lighting conditions affect reading comfort, preference, and performance, providing insights into optimal lighting configurations for vehicle interiors.
For the subjective evaluation, we employed a five–point Likert scale, crafting sub-questions to assess preferences, positive and negative emotions, and fatigue levels. As shown in Table 1, for preferences, the criteria included: (a) Overall satisfaction (1 = very dissatisfied to 5 = very satisfied), (b) Reading experience (1 = very dissatisfied to 5 = very satisfied) and (c) Perceived brightness (1 = very dissatisfied to 5 = very satisfied). To enhance the experimental results’ comparability and practical relevance, we utilized the widely adopted 0–5 Likert scale for evaluating emotional responses and fatigue. For positive emotions, the items were: (a) Alertness (0 = very slightly or not at all to 4 = extremely), (b) Energy level (0 = very slightly or not at all to 4 = extremely), and (c) Vigor (0 = very slightly or not at all to 4 = extremely). The negative emotion items included: (a) Distress (0 = very slightly or not at all to 4 = extremely), (b) Nervousness (0 = very slightly or not at all to 4 = extremely), and (c) Jitteriness (0 = very slightly or not at all to 4 = extremely). For fatigue assessment, we queried: (a) Sleepiness (0 = very slightly or not at all to 4 = extremely), (b) Fatigue (0 = very slightly or not at all to 4 = extremely), (c) Eye ache (0 = very slightly or not at all to 4 = extremely), and (d) Eye burning (0 = very slightly or not at all to 4 = extremely). To evaluate participants’ attention, we utilized the D2 Test of Attention [34].
2.2. Experimental Environment
The experimental laboratory was constructed within a real SUV vehicle, offering an interior space measuring 420 cm in length, 180 cm in width, and 140 cm in height. This vehicle was placed in a sealed, darkened room, with every wall lined with non-reflective materials, located in Shanghai Emerald Garden. To ensure strict control over the lighting conditions inside the vehicle, a non-reflective curtain was draped over the vehicle’s roof, effectively isolating the interior light environment.
Originally, the Lixiang One features three rows of seating: the first row comprises the driver and front passenger seats, the second row consists of two individual passenger seats, and the third row includes two auxiliary seats. To maintain stringent control over the experimental variables, the interior was subdivided into four equally sized compartments using opaque acrylic boards, which prevented participants from seeing or interacting with each other. The third row was omitted from the study due to its inconsistency with the seating arrangement in the other rows.
For efficient experiment management and participant communication, four wired walkie-talkies were installed within the vehicle. Additionally, audio cues for the d2 Test of Attention were transmitted through these devices. The lighting setup in the controlled laboratory featured both direct and indirect light sources. The indirect lighting was positioned along the periphery of the partitioned spaces, utilizing a blend of red, green, blue, warm white (3000 K), and cold white (6000 K) LED sources integrated into a single unit and encased within a silicone light strip. Each LED type could be adjusted individually, allowing for a wide range of illuminance and CCT adjustments. The direct lighting comprised two LED lamps suspended from the vehicle’s ceiling, also incorporating red, green, blue, warm white (3000 K), and cold white (6000 K) LEDs. Throughout the experiment, various combinations of these LED sources were employed to achieve the desired lighting conditions. A diagram of the laboratory layout is provided to illustrate the experimental setup in Figure 1.
In our study, we designated the desk area as the primary focus for lighting assessment, selecting one central point along with four corner points for the measurement of lighting parameters to ensure uniform illuminance across the area. Throughout the experiment, the Color Rendering Index (CRI) was maintained above 79, indicating a light source that basically renders colors compared to natural light [35]. The uniformity of illuminance was kept above 0.7, ensuring that light distribution was even and consistent. Subjective assessments of glare categorized it as ’nearly no glare,’ highlighting the effectiveness of our lighting design in minimizing discomfort. The distribution of illuminance on the desk was configured to derive 80 percent from direct lighting sources and 20 percent from indirect lighting, optimizing the balance between task lighting and ambient lighting.
The parameters for the 12 light sources used in the experiment are detailed in Table 1. To accurately measure the CCT and illuminance levels produced under each lighting condition, we employed the Konica Minolta CL–500A Chroma meter. The measured parameters, reflecting the precise lighting conditions achieved, are presented in Table 2.
2.3. Participants
Nineteen participants were enlisted for the study through both online and offline recruitment efforts. The cohort had an average age of 38.06, with a standard deviation of 7.79, comprising twelve females and seven males. Prior to the commencement of the experiment, all participants were required to submit their personal information. They were also queried about their academic background, specifically if they specialized in human factors related to lighting, to ensure their expertise did not influence the study outcomes; those with such a background were excluded. Furthermore, participants provided informed consent, acknowledging that the experiment posed no health risks and that any data collected from their psychological and physical assessments would be exclusively used for research purposes.
2.4. Procedure
This study employed a within–subject design to mitigate the effects of individual differences. Each participant was required to experience all 12 conditions, with the sequence of lighting conditions randomized using MATLAB. The specific sequence for each participant is detailed in the accompanying table. The entire suite of 12 conditions was estimated to take six hours to complete. To ensure participants remained alert and engaged, the experiment was divided into two separate sessions, each lasting three hours, conducted during the working hours of 8 a.m. to 11 a.m. and 3 p.m. to 6 p.m. The impact of the timing on the results was examined using a one–factor ANOVA, with the null hypothesis being that the experiment’s timing had no significant effect on the outcomes (p > 0.05), suggesting the acceptance of the null hypothesis and indicating no significant temporal influence on the results.
Participants were instructed to arrive 30 min before the start of the experiment. Upon their first arrival, they were briefed on the D2 Test of Attention and introduced to questionnaires assessing visual comfort and fatigue, as well as the concept of glare. They were then given a trial paper for the D2 test and asked to follow an audio guide for practice. Once proficient, participants were escorted to the vehicle’s interior. Through wired communication devices installed in the vehicle, participants were advised against moving the chairs and tables, engaging in conversation with one another, or using cell phones or any other forms of visual display terminals.
The experiment proceeded as follows: (1) Participants entered the vehicle for a pre–experiment briefing to become acquainted with the scale and the tests; (2) The lighting environment was adjusted to the set experimental conditions, followed by a 5 min period for light adaptation; (3) Participants performed the D2 test on an electronic screen; (4) They completed a questionnaire regarding their electronic reading preferences; (5) The D2 test was then conducted on paper; (6) Participants filled out questionnaires on their preferences for paper reading, mood, and fatigue; (7) A 3 min rest period was observed before repeating from step (2). A flowchart detailing this procedure is provided as shown in Figure 2.
3. Results
Descriptive statistics results are shown in Table 3 and the multiple ANOVA test results are shown in Table 4, and the significance levels are set at 0.05 and 0.01. In this study, the Wilcoxon test was employed to assess the significance of differences observed in the data. Utilizing SPSS software for the analysis, this non–parametric test allowed us to evaluate the median differences between two paired groups without assuming a normal distribution. This method was chosen due to its appropriateness for small sample sizes and its capability to handle ordinal data or non–normally distributed interval data [36].
3.1. Overall Preference
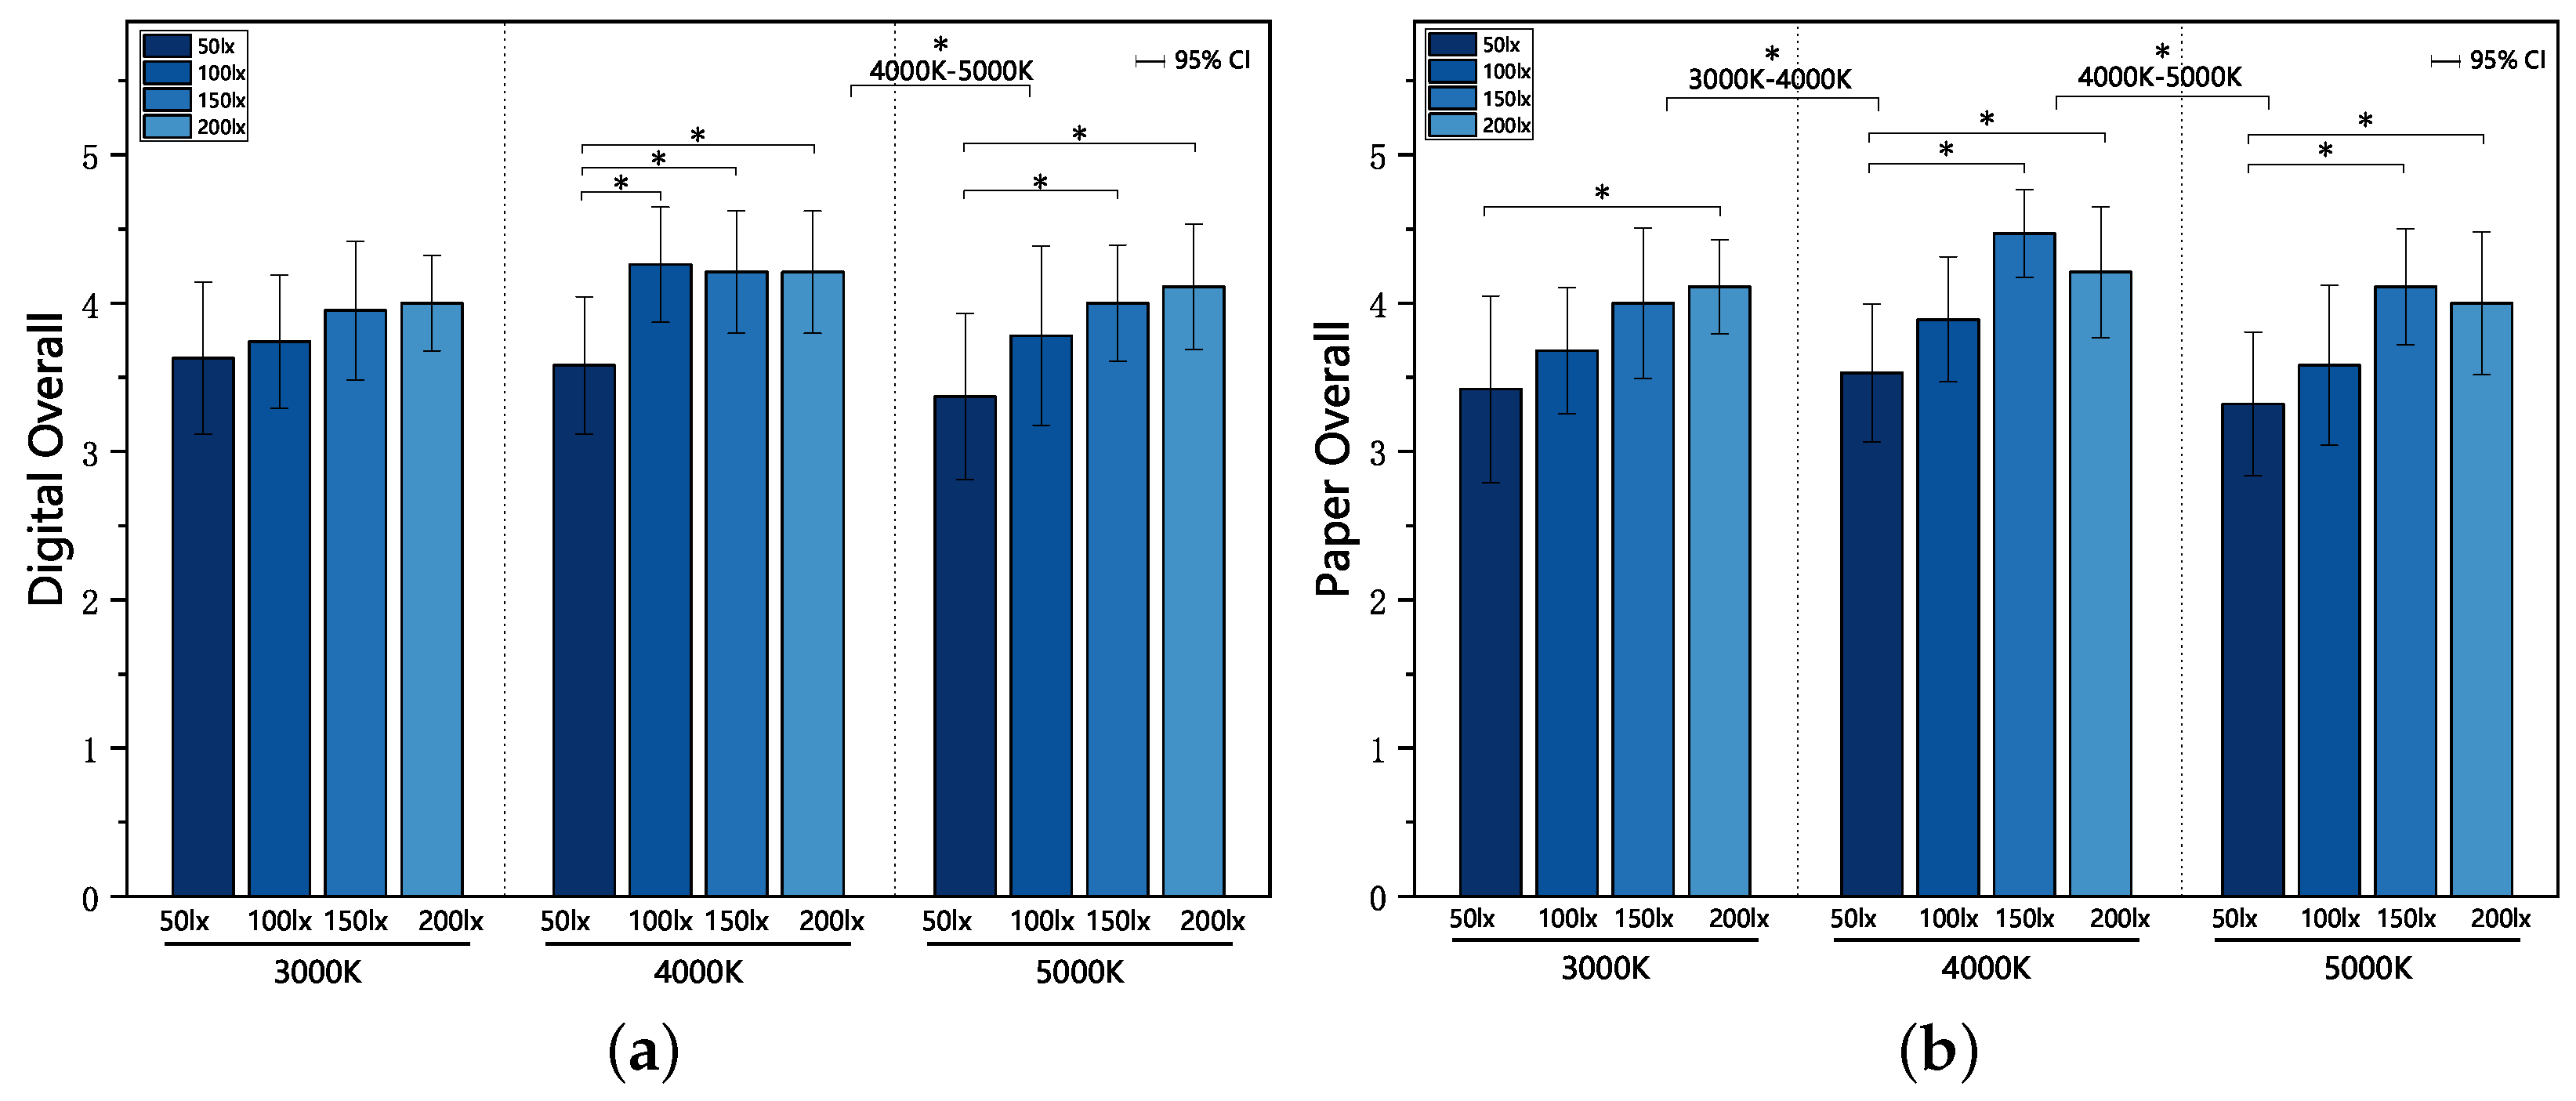
The comparative analysis of overall preferences for electronic and paper reading is depicted in Figure 3. To assess the differences between groups, we employed the Wilcoxon nonparametric test, with the significance level (p) established at 0.05. Within the context of electronic reading, the distinctions were particularly pronounced in the 4000 K category, where the illuminance levels of 100 lx, 150 lx, and 200 lx each significantly outperformed the 50 lx setting. Similarly, within the 5000 K category, both 150 lx and 200 lx achieved significantly higher scores compared to 50 lx, indicating a higher illuminance levels could be preferred. However, the 3000 K group did not exhibit any significant variations in preference.
A notable difference emerged between the 4000 K and 5000 K categories, with the 4000 K setting receiving significantly higher preference scores than the 5000 K, highlighting a distinct favoritism towards the 4000 K light temperature.
In terms of paper reading preferences, the 200 lx setting within the 3000 K group was significantly favored over the 50 lx level. For the 4000 K group, both 150 lx and 200 lx settings were preferred significantly more than the 50 lx option. This pattern was mirrored in the 5000 K group, where 150 lx and 200 lx levels again scored significantly higher than 50 lx. When comparing across the different color temperatures, the 4000 K setting was significantly more preferred than both the 3000 K and 5000 K settings, underscoring a consistent preference for the 4000 K light temperature across both electronic and paper reading formats.
3.2. Reading Experience Preference
The findings regarding preferences for reading experiences are illustrated in Figure 4. Within the realm of electronic reading, the 150 lx illumination level within the 3000 K group was the only one to achieve a significantly higher preference score compared to 50 lx. In the 4000 K group, the 100 lx level was notably preferred over the 50 lx setting. For the 5000 K group, both 150 lx and 200 lx levels received significantly higher preference scores than the 50 lx level, indicating a clear favorability towards higher illuminance settings. Between the different CCT groups, there were no significant differences observed.
Regarding preferences for the paper reading experience, both the 200 lx and 150 lx settings in the 3000 K group significantly outperformed the 50 lx level. In the 4000 K category, the 150 lx and 200 lx levels were both greatly preferred over the 50 lx setting, with the 150 lx also significantly surpassing the 100 lx level in terms of preference. Similarly, in the 5000 K group, the 150 lx and 200 lx levels were significantly more favored than the 50 lx setting. Notably, when comparing across groups, the preference score for the 4000 K setting was significantly higher than that of the 5000 K, suggesting a distinct overall preference for the 4000 K lighting condition in paper reading experiences.
3.3. Brightness Preference
The findings related to brightness preferences are detailed in Figure 5. For electronic reading brightness preference, both 150 lx and 200 lx illumination levels in the 3000 K group were significantly favored over the 50 lx level. In the 4000 K group, the illumination levels of 100 lx, 150 lx, and 200 lx all received significantly higher preference scores compared to 50 lx, indicating a potential preference for higher brightness levels. Similarly, in the 5000 K group, the 150 lx and 200 lx levels were significantly preferred over the 50 lx level. Notably, the preference for the 4000 K setting was significantly greater than that for the 3000 K setting when comparing across groups.
Regarding brightness preferences for paper reading, the 200 lx setting in the 3000 K group was significantly more preferred than the 50 lx setting. In the 4000 K group, the 150 lx level was significantly favored over the 50 lx level. Within the 5000 K group, both 150 lx and 200 lx levels achieved significantly higher preference scores than the 50 lx level. Furthermore, when comparing across groups, the preference score for the 4000 K setting was significantly higher than that for the 5000 K setting, highlighting a clear overall preference for the 4000 K lighting condition in terms of brightness for paper reading.
3.4. Positive Emotions
In our study, we crafted three questions to gauge positive emotions: Energetic, Vigorous, and Alert. The distinction between the Energetic and Vigorous emotions was particularly pronounced, with the outcomes for these two attributes further illustrated in Figure 6. For the Energetic attribute, illumination levels of 150 lx and 200 lx in the 3000 K group notably outperformed the 50 lx setting. In the 4000 K group, the 150 lx setting achieved a significantly higher score compared to the 50 lx setting, though with a borderline significance level (p = 0.053). Within the 5000 K group, no significant differences were observed. Notably, the 3000 K setting’s score was slightly superior to both the 4000 K and 5000 K groups, indicating a potential preference across different CCT groups.
Regarding the Vigorous attribute, the distinctions within the 3000 K group were less apparent, with the difference between the 150 lx and 200 lx settings approaching significance (p = 0.056), yet without a marked difference in mean values. The 150 lx setting in the 4000 K group was significantly preferred over the 50 lx setting. However, no significant differences were noted across the CCT groups, suggesting a nuanced influence of illuminance and color temperature on the perception of vigor.
3.5. Negative Emotions
In the assessment of negative emotions, as shown in Figure 7, the experimental findings for both the Distressed and Jittery items were notably similar within each group, with no significant differences identified. However, an interesting pattern emerged within the Nervous item, where the combined setting of 150 lx at 4000 K slightly surpassed other SPDs in terms of scores. The statistical analysis revealed that this configuration was significantly more impactful than the 50 lx at 4000 K setting. It also matched the scores at 100 lx at 4000 K, with the difference between it and the 100 lx at 4000 K setting nearing statistical significance (p = 0.064), suggesting a nuanced response to varying levels of illuminance and color temperature in the elicitation of nervousness.
3.6. Fatigue
We formulated four questions related to fatigue: Fatigue, Sleepy, Eye Aching, and Eye Burning, observing distinct differences among these items, with results detailed in Figure 8. For the Fatigue item, the 50 lx setting in the 3000 K group registered significantly higher scores compared to both the 150 lx and 200 lx settings. In the 4000 K group, the 150 lx setting scored significantly lower than the 50 lx, 100 lx, and 200 lx settings. No significant differences were noted within the 5000 K group. Comparatively, the 3000 K setting’s score was significantly lower than that of the 5000 K group.
In the Sleepy category, the 50 lx illumination at 3000 K was significantly higher than at 200 lx. The 150 lx setting in the 4000 K group was markedly lower than the 50 lx and 100 lx settings (p = 0.098) and the 200 lx setting (p = 0.067). The 100 lx setting in the 5000 K group was significantly lower than both the 50 lx and 100 lx settings (p = 0.054), with no significant variances observed between CCT groups.
Regarding the Eye Aching query, the 50 lx level in the 3000 K group was significantly higher than both the 100 lx and 200 lx levels. The 150 lx illumination in the 4000 K group was significantly lower than at 100 lx. The 200 lx setting in the 5000 K group was significantly higher than at 100 lx (p = 0.083), again with no significant differences between CCT groups.
For the Eye Burning aspect, the 50 lx setting in the 3000 K group was notably higher than at 200 lx. The 150 lx level in the 4000 K group was significantly lower than the 50 lx, 100 lx, and 200 lx settings. The 150 lx setting in the 5000 K group was significantly higher than at 100 lx (p = 0.058), with no significant differences found between the CCT groups.
3.7. Sustained Attention
The outcomes of the D2 Test of Attention are documented in Table 5. This test evaluates three primary metrics: TN–E (total number of tasks completed minus all errors), E1 errors (omissions), and E2 errors (miscirculations). To analyze the impact of illuminance, CCT, and reading style on these metrics, a three–way ANOVA was employed, with the detailed results presented in Table 6.
The analysis revealed that the TN–E scores are significantly influenced by the interaction between CCT and illuminance, rather than by any individual factor alone. Similarly, E1 errors (omissions) are affected by the combined influence of CCT and illuminance, indicating that neither CCT nor illuminance independently impacts the rate of omissions significantly. In contrast, E2 errors (miscirculations) show a significant dependency on the reading medium, with electronic reading resulting in significantly fewer E2 errors compared to paper reading. This suggests that the mode of reading plays a crucial role in determining the accuracy of task execution in the D2 Test of Attention.
3.8. Preference Index
In our research, we devised three preference questions, each reflecting a distinct aspect: Overall Preference, Reading Experience, and Brightness. The responses to these queries underscore their unique contributions, demonstrating the distinct preferences between electronic and paper reading in a controlled experimental setting. However, distinguishing between these two reading modes in practical situations proves challenging. To address this, we aggregated the scores from all six questions to formulate an overall preference index. We generated a simulated equipotential plots in Origin using the overall preference ratings for 12 lighting environments from 19 participants, totaling 208 data points, offering a more intuitive visualization of preference patterns. In this plot, higher score means higher preference. This plot are depicted in Figure 9, providing valuable insights for the future design of in–vehicle lighting environments. Such simulated equipotential diagrams serve as a practical tool for optimizing lighting parameters to enhance the reading experience within vehicles.
4. Discussion
4.1. Higher Illuminance Improved Performance
When a desk is positioned at a height of 65–70 cm from the floor, our empirical measurements indicate that the illuminance offered by current commonly used in–vehicle lighting for such a surface does not exceed 50 lx. Consequently, in our analysis, we have adopted 50 lx as a benchmark for existing interior lighting designs, with Table 7 presenting the comparative outcomes. The evaluation of individual and overall scores for both electronic and paper reading reveals that higher illuminance levels consistently surpass the 50 lx benchmark, with numerous comparisons achieving statistical significance (p < 0.05). These findings underscore a clear need for enhanced illuminance within vehicles to accommodate both electronic and paper reading activities, surpassing the capabilities of current lighting designs.
4.2. Comparation with Study in Conventional Spaces and Small Spaces
In our research, we observed that increasing illuminance from 150 lx to 200 lx did not significantly enhance participants’ preference for the lighting environment; instead, there was a slight decline (the mean value decreased, although not significantly). This trend was particularly noticeable at color temperatures of 4000 K and 5000 K, with the preference for 150 lx being moderately satisfied. This finding aligns with two other investigations into lighting in small spaces. Yu et al. [20] adapted Kruithof’s concept of a pleasing zone based on semantic scale outcomes in a study of capsule hotels, where an illuminance of 300 lx was evaluated using a seven–point Likert scale and rated close to five points. Similarly, Chen et al.’s study [21] on perception in small spaces identified an optimal illuminance level of 100 lx, which also approached a five–point rating on a seven–point Likert scale. Conversely, a comprehensive examination of lighting in traditional spaces revealed that an illuminance of 200 lx consistently scored below 50 points out of 100 [31].
This discrepancy may be attributed to differences in eye–level illumination. In standard spaces, with ceiling heights typically over 2 m, the distance from a seated person’s eye level to the ceiling–mounted light source is at least 0.8 m. However, studies on lighting in small spaces often feature room heights of 1.2 m or less, placing the eye level approximately 30 cm from the ceiling light source. This proximity significantly alters the perception of brightness and can lead to a more intense experience of the light, which may explain why lower illuminance levels are often preferred in smaller spaces. The closer presence of the light source not only increases the direct illumination but also enhances the perceived brightness due to the reduced distance, potentially making higher illuminance levels feel overwhelming or less comfortable in confined environments.
Furthermore, psychological factors may also play a crucial role in this preference. In smaller spaces, individuals may seek a cozier, more intimate atmosphere that is often associated with lower levels of light. This desire for a subdued ambiance can contrast sharply with the preference for brighter, more vibrant lighting in larger, more open spaces where activities requiring higher visibility may dominate. Thus, the context of the space and the associated psychological comfort levels significantly influence lighting preferences.
The adaptation level theory suggests that human perception of lighting conditions is relative and can be influenced by previous exposure to light levels. In confined spaces, where the range of illuminance is naturally limited, individuals’ expectations and preferences for lighting may adjust to lower levels as a baseline, further contributing to the preference for lower illuminance.
In light of these considerations, it becomes apparent that designing lighting environment for small spaces requires a nuanced understanding of both the physical and psychological factors at play. Acknowledging that the ideal illuminance level may be lower in such environments is crucial for creating comfortable, visually appealing spaces that meet the occupants’ needs and preferences. As our research and other studies suggest, there is a clear need to reevaluate traditional lighting standards and adapt them to the unique characteristics of small spaces to enhance the overall experience of the inhabitants.
4.3. Study Limitations
Our study, exploring the impact of vehicle interior lighting on reading behavior with a focus on a specific demographic (19 participants: 12 females and 7 males, average age 39), faces certain limitations that warrant further discussion. We recognize, as highlighted by the reviewer, potential biases arising from our sample’s age and gender composition [37,38,39]. The sensitivity to lighting environments may vary across age groups, and differences in visual perception and preferences between genders could influence our findings. Additionally, we did not examine how lighting preferences might shift over the day, missing out on understanding the influence of circadian rhythms and melatonin levels on light intensity and color temperature preferences, which are known to affect alertness and relaxation at different times.
To address these shortcomings, future studies should aim for a more diverse participant pool and consider the temporal aspects of lighting preferences, enhancing our comprehension of how gender, age and daily timing affect lighting preferences and reading behavior. Incorporating circadian rhythm insights into experimental designs could yield a more nuanced evaluation of vehicle interior lighting’s effect on reading.
Moreover, our study was conducted in a stationary vehicle to prioritize safety and feasibility, serving as an initial investigation into this subject. This approach, however, limits our ability to replicate the dynamic conditions of actual driving, such as movement and changing external lighting, potentially affecting the applicability of our results to real—world driving scenarios. Future research should, therefore, extend to studies in moving vehicles, under diverse lighting and environmental conditions, to fully grasp the implications of interior vehicle lighting on reading behavior. This direction not only promises to refine our understanding but also to guide the development of more effective vehicle lighting designs.
5. Conclusions
The study investigated the influence of various lighting conditions, specifically different levels of illuminance and CCT, on the reading experience inside a vehicle. Through experimental methods, it aimed to identify lighting parameters that could enhance reading performance and comfort. The research concluded that a lighting combination of 150 lx illuminance and 4000 K CCT could be more conducive to reading in a vehicle compared to lower illuminance levels traditionally used in automotive interiors. This conclusion is based on observed improvements in subjective preferences, positive emotional responses, and reductions in reported physical and visual fatigue among participants.
Moreover, the study highlighted that preferences for lighting conditions might differ between reading on electronic devices versus paper, suggesting that future vehicle lighting designs could benefit from considering these distinctions. It also pointed out that lighting standards applied in general spaces might not directly translate to the unique context of vehicles, potentially leading to less than optimal reading experiences or increased energy use.
Our experimental approach involved a controlled lab setup within an actual SUV to closely mimic a genuine in–vehicle context. Participants underwent visual tests and provided feedback via subjective assessment questionnaires, evaluating their experience in terms of sustained attention (measured by the d2 Test of Attention), visual preference, emotions, and fatigue. The key contributions of this research include: (1) recommending an ideal lighting mix of 150 lx and 4000 K for stationary in–vehicle reading; (2) highlighting the distinct preferences for electronic versus paper for stationary in–vehicle reading; (3) demonstrating that lighting preferences in the confined space of a stationary vehicle markedly differ from those in broader, conventional environments.
Author Contributions
Conceptualization, Y.N. and C.W.; methodology, Y.N. and C.W.; software, Y.N.; formal analysis, Y.N.; writing—original draft preparation, Y.N.; writing—review and editing, Y.N., C.W. and Y.L.; supervision, C.W. and Y.L. All authors have read and agreed to the published version of the manuscript.
Funding
This research received no funding.
Institutional Review Board Statement
Not applicable.
Informed Consent Statement
Not applicable.
Data Availability Statement
Unable to provide raw data due to confidentiality agreement.
Acknowledgments
The authors would like to thank all of the people who participated in the study.
Conflicts of Interest
The authors declare no conflicts of interest.
References
- Kim, T.; Kim, Y.; Jeon, H.; Choi, C.-S.; Hyeon-Jeong, S. Emotional Response to In-Car Dynamic Lighting. Int. J. Automot. Technol. 2021, 22, 1035–1043. [Google Scholar] [CrossRef]
- Weirich, C.; Lin, Y.; Khanh, T.Q. Evidence for Human-Centric in–vehicle Lighting: Part 1. Appl. Sci. 2022, 12, 552. [Google Scholar] [CrossRef]
- Weirich, C.; Lin, Y.; Khanh, T.Q. Evidence for human-centric in–vehicle lighting: Part 2-Modeling illumination based on color-opponents. Front. Neurosci. 2022, 16, 969125. [Google Scholar] [CrossRef] [PubMed]
- Weirich, C.; Lin, Y.; Khanh, T.Q. Evidence for human-centric in–vehicle lighting: Part 3-Illumination preferences based on subjective ratings, eye-tracking behavior, and EEG features. Front. Neurosci. 2023, 17, 1248824. [Google Scholar] [CrossRef] [PubMed]
- Loe, L.; Mansfield, K.; Rowlands, E. Appearance of lit environment and its relevance in lighting design: Experimental study. Light. Res. Technol. 1994, 26, 119–133. [Google Scholar] [CrossRef]
- Pellegrino, A. Assessment of artificial lighting parameters in a visual comfort perspective. Light. Res. Technol. 1999, 31, 107–115. [Google Scholar] [CrossRef]
- Houser, K.; Tiller, D.; Bernecker, C.a.; Mistrick, R. The subjective response to linear fluorescent direct/indirect lighting systems. Light. Res. Technol. 2002, 34, 243–260. [Google Scholar] [CrossRef]
- de Vries, A.; Souman, J.L.; de Ruyter, B.; Heynderickx, I.; de Kort, Y.A.W. Lighting up the office: The effect of wall luminance on room appraisal, office workers’performance, and subjective alertness. Build. Environ. 2018, 142, 534–543. [Google Scholar] [CrossRef]
- Knez, I.; Enmarker, I. Effects of office lighting on mood and cognitive performance and A gender effect in work-xRelated judgment. Environ. Behav. 1998, 30, 553–567. [Google Scholar] [CrossRef]
- McCloughan, C.L.B.; Aspinall, P.A.; Webb, R.S. The impact of lighting on mood. Light. Res. Technol. 1999, 31, 81–88. [Google Scholar] [CrossRef]
- Hawkes, R.; Loe, D.; Rowlands, E. A note towards the understanding of lighting quality. Illum. Eng. Soc. 1979, 8, 111–120. [Google Scholar] [CrossRef]
- Durak, A.; Olguntürk, N.C.; Yener, C.; Güvenç, D.; Gürçınar, Y. Impact of lighting arrangements and illuminances on different impressions of a room. Build. Environ. 2007, 42, 3476–3482. [Google Scholar] [CrossRef]
- Subisak, G.; Bernecker, C. Psychological preferences for industrial lighting. Light. Res. Technol. 1993, 25, 171–177. [Google Scholar] [CrossRef]
- de Vries, A.; Souman, J.L.; de Kort, Y.A. Teasing apart office illumination: Isolating the effects of task illuminance on office workers. Light. Res. Technol. 2020, 52, 944–958. [Google Scholar] [CrossRef]
- Kuller, L.D.R.; Wetterberg, L. Dagger Melatonin, cortisol, EEG, ECG and subjective comfort in healthy humans: Impact of two fluorescent lamp types at two light intensities. Light. Res. Technol. 1993, 25, 71–81. [Google Scholar] [CrossRef]
- Veitch, J.A. Revisiting the performance and mood effects of information about lighting and fluorescent lamp type. Environ. Psychol. 1997, 17, 253–262. [Google Scholar] [CrossRef]
- Knez, I. Effects of colour of light on nonvisual psychological processes. Environ. Psychol. 2001, 21, 201–208. [Google Scholar] [CrossRef]
- Boray, P.F.; Gifford, R.; Rosenblood, L. Effects of warm white, cool white and fullspectrum fluorescent lighting on simple cognitive performance, mood and ratings of others. Environ. Psychol. 1989, 9, 297–307. [Google Scholar] [CrossRef]
- Khanh, T.Q.; Bodrogi, P.; Guo, X.; Phan, Q.A. Towards a user preference model for interior lighting. Part 2: Experimental results and modelling. Light. Res. Technol. 2019, 51, 1030–1043. [Google Scholar] [CrossRef]
- Yu, H.; Akita, T. The effect of illuminance and correlated colour temperature on perceived comfort according to reading behaviour in a capsule hotel. Build. Environ. 2019, 148, 384–393. [Google Scholar] [CrossRef]
- Chen, T.; Wang, L.; Li, Y.; Chen, P.; Yu, J. Modeling perceptions of very small space in physical dimension: Effect of the form of line light-emitting units with preference. Build. Environ. 2023, 228. [Google Scholar] [CrossRef]
- Caberletti, L.; Elfmann, K.; Kummel, M.; Schierz, C. Influence of ambient lighting in a vehicle interior on the driver’s perceptions. Light. Res. Technol. 2010, 42, 297–311. [Google Scholar] [CrossRef]
- Flannagan, M.J.; Devonshire, J.M. Effects of Automotive Interior Lighting on Driver Vision. Leukos 2012, 9, 9–23. [Google Scholar] [CrossRef]
- Löcken, A.; Yan, F.; Heuten, W.; Boll, S.C.J. Investigating driver gaze behavior during lane changes using two visual cues: Ambient light and focal icons. J. Multimodal User Interfaces 2019, 13, 119–136. [Google Scholar] [CrossRef]
- Rodríguez-Morilla, B.; Madrid, J.A.; Molina, E.; Correa, A. Blue-Enriched White Light Enhances Physiological Arousal but Not Behavioral Performance during Simulated Driving at Early Night. Front. Psychol. 2017, 8, 997. [Google Scholar] [CrossRef] [PubMed]
- Rodríguez-Morilla, B.; Madrid, J.A.; Molina, E.; Pérez-Navarro, J.; Correa, Á. Blue-Enriched Light Enhances Alertness but Impairs Accurate Performance in Evening Chronotypes Driving in the Morning. Front. Psychol. 2018, 9, 688. [Google Scholar] [CrossRef] [PubMed]
- van Huysduynen, H.H.; Terken, J.; Meschtscherjakov, A.; Eggen, B.; Tscheligi, M. Ambient Light and its Influence on Driving Experience. In 9th ACM International Conference on Automotive User Interfaces and Interactive Vehicular Applications (AutomotiveUI); University Oldenburg: Oldenburg, Germany, 2017. [Google Scholar]
- Weisgerber, D.M.; Nikol, M.; Mistlberger, R.E. Driving home from the night shift: A bright light intervention study. Sleep Med. 2018, 30, 171–179. [Google Scholar] [CrossRef] [PubMed]
- Stylidis, K.; Woxlin, A.; Siljefalk, L.; Heimersson, E.; Söderberg, R. Understanding light. A study on the perceived quality of car exterior lighting and interior illumination. Procedia CIRP 2020, 93, 1340–1345. [Google Scholar] [CrossRef]
- Wei, W.; Hong, L. Influence of light on human physiology and psychology and light strategies in claustrophobic environment. Manned Spacefl. 2018, 24, 418–426. [Google Scholar]
- Klabes, J.; Babilon, S.; Beck, S.; Braun, S.; Johannbroer, B.; Joppien, A.; Trinh, Q.V.; Khanh, T.Q. Towards a comprehensive lighting-quality model: Validation of brightness, visual clarity, and color preference formulae applicability in two realistic mock-up scenarios. Osa Contin. 2021, 4, 3139–3156. [Google Scholar] [CrossRef]
- Xu, J.; Xiang, Z.-R.; Zhi, J.-Y.; Chen, Y.-D.; Xu, X.-F. Assessment of visual comfort in the lighting environments of subway cabins in China. Int. J. Rail Transp. 2023, 11, 406–427. [Google Scholar] [CrossRef]
- Yu, H.; Akita, T. Effects of illuminance and color temperature of a general lighting system on psychophysiology while performing paper and computer tasks. Build. Environ. 2023, 228. [Google Scholar] [CrossRef]
- Brickenkamp, R.; Zillmer, E. The d2 Test of Attention. In Seattle, 1st ed.; Hogrefe & Huber Publishers: Seattle, DC, USA, 1998. [Google Scholar]
- Lee, S.; Yoon, H.C. A Randomized Controlled Trail for Comparing LED Color Temperature and Color Rendering Attributes in Different Illuminance Environments for Human-Centric Office Lighting. Appl. Sci. 2021, 11, 8313. [Google Scholar] [CrossRef]
- Wilcoxon, F. Individual comparisons by ranking methods. Biom. Bull. 1945, 1, 80–83. [Google Scholar] [CrossRef]
- Huang, R.H.; Lee, L.; Chiu, Y.-A.; Sun, Y. Effects of correlated color temperature on focused and sustained attention under white LED desk lighting. Color Res. Appl. 2015, 40, 281–286. [Google Scholar] [CrossRef]
- Shamsul, B.M.T.; Sia, C.C.; Ng, Y.G.; Karmegan, K. Effects of light’s colour temperatures on visual comfort level, task performances, and alertness among students. Am. J. Public Health Res. 2013, 1, 159–165. [Google Scholar] [CrossRef]
- Lee, J.H.; Moon, J.W.; Kim, S. Analysis of occupants’ visual perception to refine indoor lighting environment for office tasks. Energies 2014, 7, 4116–4139. [Google Scholar] [CrossRef]
Figure 1.
Laboratory diagram (blue labels indicate indirect light).

Figure 2.
Flow chart of the experimental procedure.

Figure 3.
Overall preference results: (a) digital reading; (b) paper reading. Statistical significances p < 0.05 marked with *.
Figure 3.
Overall preference results: (a) digital reading; (b) paper reading. Statistical significances p < 0.05 marked with *.

Figure 4.
Reading experience preference results: (a) digital reading; (b) paper reading. Statistical significances p < 0.05 marked with *.
Figure 4.
Reading experience preference results: (a) digital reading; (b) paper reading. Statistical significances p < 0.05 marked with *.

Figure 5.
Brightness preference results: (a) digital reading; (b) paper reading. Statistical significances p < 0.05 marked with *.
Figure 5.
Brightness preference results: (a) digital reading; (b) paper reading. Statistical significances p < 0.05 marked with *.

Figure 6.
Positive emotions: (a) Energetic; (b) Vigorous. Statistical significances p < 0.05 marked with *.
Figure 6.
Positive emotions: (a) Energetic; (b) Vigorous. Statistical significances p < 0.05 marked with *.

Figure 7.
“Nervous” results p < 0.05 marked with *.

Figure 8.
Fatigue results: (a) Fatigue; (b) Sleepy; (c) Eye–aching; (d) Eye–burning. Statistical significances p < 0.05 marked with *.
Figure 8.
Fatigue results: (a) Fatigue; (b) Sleepy; (c) Eye–aching; (d) Eye–burning. Statistical significances p < 0.05 marked with *.

Figure 9.
Simulated equipotential plots of total preferences results.


Table 1.
Questionnaires of preference.
| Item | Question | Very Dissatisfied | Slightly Dissatisfied | Moderate | Slightly Satisfied | Very Satisfied |
|---|---|---|---|---|---|---|
| 1 | Overall satisfaction when using VDT | 1 | 2 | 3 | 4 | 5 |
| 2 | Reading experience satisfaction on VDT | 1 | 2 | 3 | 4 | 5 |
| 3 | Perceived brightness satisfaction when using VDT | 1 | 2 | 3 | 4 | 5 |
| 4 | Overall satisfaction when using paper materials | 1 | 2 | 3 | 4 | 5 |
| 5 | Reading experience satisfaction on paper | 1 | 2 | 3 | 4 | 5 |
| 6 | Perceived brightness satisfaction when using paper materials | 1 | 2 | 3 | 4 | 5 |
Table 2.
Photometric and colorimetric data of the illumination Spectral Power Distributions (SPDs) used in the experiment.
Table 2.
Photometric and colorimetric data of the illumination Spectral Power Distributions (SPDs) used in the experiment.
| Spectrum | in lux (±2%) | CCT in K (±3%) | Duv | u’ (±0.015) | v’ (±0.015) | IES TM30–20 | IES TM30–20 |
|---|---|---|---|---|---|---|---|
| SPD1 | 50 | 3081 | −0.0162 | 0.2539 | 0.4972 | 82 | 100 |
| SPD2 | 103 | 3015 | −0.0154 | 0.2556 | 0.4995 | 81 | 100 |
| SPD3 | 152 | 3038 | −0.0152 | 0.2548 | 0.4994 | 82 | 99 |
| SPD4 | 198 | 3046 | −0.0153 | 0.2546 | 0.4992 | 81 | 99 |
| SPD5 | 50 | 3965 | −0.0212 | 0.2376 | 0.4760 | 81 | 100 |
| SPD6 | 105 | 3974 | −0.0212 | 0.2375 | 0.4758 | 81 | 100 |
| SPD7 | 156 | 3943 | −0.0211 | 0.2379 | 0.4764 | 81 | 100 |
| SPD8 | 200 | 3949 | −0.0211 | 0.2378 | 0.4763 | 81 | 100 |
| SPD9 | 49 | 5019 | −0.0211 | 0.2261 | 0.4619 | 79 | 101 |
| SPD10 | 102 | 5068 | −0.0212 | 0.2257 | 0.4612 | 79 | 101 |
| SPD11 | 149 | 5084 | −0.0212 | 0.2256 | 0.4609 | 79 | 100 |
| SPD12 | 196 | 5082 | −0.0215 | 0.2259 | 0.4607 | 79 | 101 |
Table 3.
Descriptive statistics results.
| Spectrum | D Overall | D Experience | D Brightness | P Overall | P Experience | P Brightness | Distressed | Nervous | ||||||||
|---|---|---|---|---|---|---|---|---|---|---|---|---|---|---|---|---|
| M | SD | M | SD | M | SD | M | SD | M | SD | M | SD | M | SD | M | SD | |
| SPD1 | 3.63 | 1.07 | 3.32 | 1.16 | 3.26 | 1.15 | 3.42 | 1.31 | 3.32 | 1.34 | 3.32 | 1.25 | 1.47 | 0.77 | 1.42 | 0.69 |
| SPD2 | 3.74 | 0.93 | 3.79 | 0.71 | 3.37 | 1.01 | 3.68 | 0.89 | 3.79 | 1.08 | 3.58 | 1.02 | 1.47 | 0.84 | 1.26 | 0.65 |
| SPD3 | 3.95 | 0.97 | 3.84 | 1.12 | 3.68 | 1.16 | 4.00 | 1.05 | 3.89 | 1.10 | 3.84 | 1.12 | 1.47 | 0.84 | 1.32 | 0.58 |
| SPD4 | 4.00 | 0.67 | 3.84 | 0.60 | 3.84 | 0.90 | 4.11 | 0.66 | 4.16 | 0.69 | 4.16 | 0.69 | 1.32 | 0.58 | 1.26 | 0.56 |
| SPD5 | 3.58 | 0.96 | 3.47 | 1.07 | 3.37 | 1.07 | 3.53 | 0.96 | 3.47 | 1.02 | 3.63 | 1.07 | 1.42 | 0.69 | 1.37 | 0.83 |
| SPD6 | 4.26 | 0.81 | 4.05 | 0.91 | 3.89 | 0.81 | 3.89 | 0.88 | 3.68 | 0.95 | 3.79 | 0.98 | 1.37 | 0.83 | 1.26 | 0.56 |
| SPD7 | 4.21 | 0.86 | 3.89 | 1.02 | 3.94 | 1.06 | 4.47 | 0.61 | 4.21 | 0.79 | 4.26 | 0.93 | 1.63 | 1.01 | 1.74 | 1.10 |
| SPD8 | 4.21 | 0.86 | 3.79 | 1.08 | 3.95 | 1.03 | 4.21 | 0.92 | 4.11 | 0.94 | 4.11 | 1.05 | 1.53 | 0.84 | 1.26 | 0.81 |
| SPD9 | 3.37 | 1.17 | 3.32 | 1.11 | 3.42 | 1.07 | 3.32 | 1.00 | 3.21 | 1.08 | 3.17 | 1.10 | 1.53 | 0.84 | 1.32 | 0.67 |
| SPD10 | 3.78 | 1.22 | 3.71 | 1.26 | 3.44 | 1.25 | 3.58 | 1.12 | 3.42 | 1.26 | 3.47 | 1.12 | 1.53 | 0.91 | 1.44 | 0.86 |
| SPD11 | 4.00 | 0.82 | 3.89 | 0.96 | 3.89 | 0.94 | 4.11 | 0.81 | 4.11 | 0.99 | 4.05 | 0.91 | 1.47 | 0.77 | 1.53 | 1.07 |
| SPD12 | 4.11 | 0.88 | 3.84 | 1.02 | 4.00 | 1.00 | 4.00 | 1.00 | 3.68 | 1.06 | 3.89 | 1.05 | 1.47 | 0.70 | 1.37 | 0.60 |
| M | SD | M | SD | M | SD | M | SD | M | SD | M | SD | M | SD | M | SD | |
| SPD1 | 1.29 | 0.59 | 1.89 | 0.99 | 1.74 | 0.93 | 1.95 | 0.97 | 1.58 | 1.07 | 1.63 | 1.07 | 1.68 | 1.29 | 1.32 | 1.11 |
| SPD2 | 1.37 | 1.01 | 2.16 | 1.17 | 1.63 | 1.17 | 1.39 | 1.15 | 1.26 | 1.10 | 1.42 | 1.22 | 1.11 | 1.24 | 1.00 | 1.00 |
| SPD3 | 1.37 | 0.83 | 2.11 | 0.94 | 2.37 | 1.12 | 2.16 | 1.12 | 1.37 | 1.12 | 1.21 | 1.08 | 1.42 | 1.35 | 1.05 | 1.18 |
| SPD4 | 1.42 | 0.90 | 2.05 | 1.03 | 2.47 | 1.17 | 2.05 | 1.13 | 1.21 | 1.03 | 1.00 | 0.82 | 1.21 | 1.27 | 0.89 | 1.05 |
| SPD5 | 1.56 | 0.92 | 1.79 | 1.08 | 1.74 | 0.87 | 1.74 | 0.73 | 1.37 | 1.12 | 1.68 | 1.06 | 1.37 | 1.07 | 1.00 | 1.05 |
| SPD6 | 1.28 | 0.83 | 1.84 | 0.96 | 1.74 | 1.15 | 1.89 | 0.96 | 1.39 | 1.09 | 1.47 | 1.07 | 1.63 | 1.26 | 1.11 | 0.94 |
| SPD7 | 1.42 | 0.84 | 2.05 | 1.18 | 2.26 | 1.28 | 2.32 | 1.00 | 0.89 | 1.08 | 0.83 | 0.99 | 1.00 | 1.16 | 0.47 | 0.84 |
| SPD8 | 1.37 | 1.01 | 1.95 | 0.97 | 2.11 | 1.18 | 2.00 | 1.11 | 1.47 | 0.96 | 1.58 | 1.22 | 1.32 | 1.00 | 1.11 | 0.99 |
| SPD9 | 1.50 | 1.04 | 1.95 | 0.97 | 1.74 | 1.05 | 1.79 | 0.98 | 1.63 | 1.07 | 1.63 | 1.07 | 1.37 | 1.34 | 1.00 | 0.82 |
| SPD10 | 1.42 | 1.02 | 2.00 | 1.16 | 1.63 | 1.17 | 1.71 | 1.11 | 1.11 | 1.10 | 1.42 | 1.26 | 1.06 | 1.06 | 0.83 | 1.04 |
| SPD11 | 1.47 | 0.91 | 1.95 | 1.03 | 1.79 | 1.23 | 2.00 | 1.20 | 1.53 | 1.17 | 1.63 | 1.21 | 1.26 | 1.10 | 1.26 | 1.15 |
| SPD12 | 1.58 | 0.90 | 2.11 | 1.13 | 1.84 | 0.69 | 2.11 | 0.66 | 1.53 | 1.22 | 1.58 | 1.26 | 1.47 | 1.02 | 1.11 | 1.05 |
Table 4.
Three-way ANOVA test results.
| Subjective Evaluation | Source | SS | df | MS | F | p |
|---|---|---|---|---|---|---|
| Overall | illuminance | 37.634 | 3 | 12.545 | 14.404 | <0.01 ** |
| CCT | 5.514 | 2 | 2.757 | 3.165 | <0.05 * | |
| Reading type | 0.332 | 1 | 0.332 | 0.382 | 0.537 | |
| illuminance * CCT | 2.865 | 6 | 0.478 | 0.548 | 0.771 | |
| illuminance * Reading type | 3.022 | 3 | 1.007 | 1.157 | 0.326 | |
| CCT*Reading type | 0.104 | 2 | 0.052 | 0.060 | 0.942 | |
| illuminance * CCT * Reading type | 1.238 | 6 | 0.206 | 0.237 | 0.964 | |
| Experience | illuminance | 30.960 | 3 | 10.32 | 9.926 | <0.01 ** |
| CCT | 2.516 | 2 | 1.258 | 1.210 | 0.299 | |
| Reading type | 0.022 | 1 | 0.022 | 0.021 | 0.885 | |
| illuminance * CCT | 2.815 | 6 | 0.469 | 0.451 | 0.844 | |
| illuminance * Reading type | 3.134 | 3 | 1.045 | 1.005 | 0.391 | |
| CCT * Reading type | 0.784 | 2 | 0.392 | 0.377 | 0.686 | |
| illuminance * CCT * Reading type | 1.867 | 6 | 0.311 | 0.299 | 0.937 | |
| Brightness | illuminance | 33.757 | 3 | 11.252 | 10.668 | <0.01 ** |
| CCT | 4.272 | 2 | 2.136 | 2.025 | <0.05 * | |
| Reading type | 1.082 | 1 | 1.082 | 1.026 | 0.312 | |
| illuminance * CCT | 1.918 | 6 | 0.320 | 0.303 | 0.935 | |
| illuminance * Reading type | 0.767 | 3 | 0.256 | 0.242 | 0.867 | |
| CCT * Reading type | 1.161 | 2 | 0.580 | 0.550 | 0.577 | |
| illuminance * CCT * Reading type | 1.595 | 6 | 0.266 | 0.252 | 0.958 | |
| Distressed | illuminance | 0.220 | 3 | 0.073 | 0.100 | 0.960 |
| CCT | 0.125 | 2 | 0.062 | 0.085 | 0.919 | |
| illuminance * CCT | 0.848 | 6 | 0.141 | 0.192 | 0.979 | |
| Nervous | illuminance | 1.447 | 3 | 0.482 | 0.735 | 0.533 |
| CCT | 0.455 | 2 | 0.227 | 0.346 | 0.708 | |
| illuminance * CCT | 0.434 | 6 | 0.072 | 0.110 | 0.995 | |
| Jittery | illuminance | 0.212 | 3 | 0.071 | 0.084 | 0.969 |
| CCT | 0.099 | 2 | 0.050 | 0.059 | 0.943 | |
| illuminance * CCT | 0.484 | 6 | 0.081 | 0.095 | 0.997 | |
| Alert | illuminance | 0.714 | 3 | 0.238 | 0.284 | 0.837 |
| CCT | 0.043 | 2 | 0.022 | 0.026 | 0.975 | |
| illuminance * CCT | 2.706 | 6 | 0.451 | 0.538 | 0.779 | |
| Energetic | illuminance | 11.388 | 3 | 3.796 | 3.553 | <0.05 * |
| CCT | 4.660 | 2 | 2.330 | 2.181 | 0.116 | |
| illuminance * CCT | 4.967 | 6 | 0.828 | 0.775 | 0.591 | |
| Vigorous | illuminance | 5.634 | 3 | 1.878 | 1.862 | <0.05 * |
| CCT | 0.197 | 2 | 0.098 | 0.098 | 0.907 | |
| illuminance * CCT | 4.124 | 6 | 0.687 | 0.682 | 0.665 | |
| Sleepy | illuminance | 2.137 | 3 | 0.712 | 0.549 | 0.649 |
| CCT | 0.731 | 2 | 0.365 | 0.282 | 0.755 | |
| illuminance * CCT | 5.766 | 6 | 0.961 | 0.741 | 0.618 | |
| Fatigue | illuminance | 6.574 | 3 | 2.191 | 1.658 | <0.05 * |
| CCT | 1.038 | 2 | 0.519 | 0.392 | 0.676 | |
| illuminance * CCT | 7.427 | 6 | 1.238 | 0.936 | 0.471 | |
| Eye aching | illuminance | 1.656 | 3 | 0.552 | 0.366 | 0.777 |
| CCT | 0.078 | 2 | 0.039 | 0.026 | 0.974 | |
| illuminance * CCT | 6.328 | 6 | 1.055 | 0.700 | 0.650 | |
| Eye burning | illuminance | 0.883 | 3 | 0.294 | 0.304 | 0.823 |
| CCT | 1.244 | 2 | 0.622 | 0.642 | 0.528 | |
| illuminance * CCT | 8.160 | 6 | 1.360 | 1.403 | 0.216 |
* Significance levels are set at p < 0.05 * and <0.01 **. Results with a significance level have been marked and italicized.
Table 5.
Results of d2 test.
| Spectrum | Digital Reading | Paper Reading | ||||||||||
|---|---|---|---|---|---|---|---|---|---|---|---|---|
| TN-E | E1 | E2 | TN-E | E1 | E2 | |||||||
| M | SD | M | SD | M | SD | M | SD | M | SD | M | SD | |
| SPD1 | 615.31 | 50.76 | 14.00 | 16.23 | 0.00 | 0.00 | 610.85 | 55.31 | 11.85 | 9.89 | 0.46 | 0.78 |
| SPD2 | 642.80 | 24.42 | 8.47 | 13.48 | 0.07 | 0.26 | 636.47 | 24.03 | 9.93 | 8.74 | 0.47 | 0.74 |
| SPD3 | 642.87 | 18.11 | 11.67 | 18.15 | 0.07 | 0.26 | 635.47 | 17.85 | 12.67 | 10.53 | 0.27 | 0.59 |
| SPD4 | 645.94 | 18.77 | 6.38 | 14.79 | 0.00 | 0.00 | 643.53 | 20.15 | 5.00 | 4.00 | 0.07 | 0.26 |
| SPD5 | 640.44 | 26.62 | 8.31 | 14.01 | 0.00 | 0.00 | 624.60 | 48.47 | 6.93 | 9.57 | 0.20 | 0.41 |
| SPD6 | 625.06 | 36.76 | 10.19 | 13.81 | 0.06 | 0.25 | 615.53 | 41.69 | 12.53 | 10.43 | 0.47 | 0.92 |
| SPD7 | 592.06 | 154.49 | 11.06 | 12.97 | 0.00 | 0.00 | 634.19 | 22.60 | 10.56 | 12.30 | 0.50 | 1.21 |
| SPD8 | 646.79 | 16.96 | 8.79 | 15.96 | 0.00 | 0.00 | 643.13 | 19.60 | 7.73 | 6.67 | 0.20 | 0.56 |
| SPD9 | 636.60 | 30.66 | 8.53 | 13.51 | 0.00 | 0.00 | 625.40 | 39.08 | 11.53 | 9.20 | 0.27 | 0.59 |
| SPD10 | 648.60 | 13.54 | 6.93 | 12.56 | 0.00 | 0.00 | 643.40 | 16.54 | 5.80 | 4.71 | 0.53 | 0.74 |
| SPD11 | 646.44 | 15.76 | 7.63 | 13.51 | 0.00 | 0.00 | 638.73 | 25.01 | 8.33 | 7.67 | 0.80 | 2.31 |
| SPD12 | 631.25 | 30.48 | 10.94 | 14.36 | 0.00 | 0.00 | 616.13 | 43.82 | 13.20 | 10.29 | 0.27 | 0.59 |
| Total | 633.98 | 54.72 | 9.42 | 14.23 | 0.02 | 0.13 | 630.86 | 34.18 | 9.65 | 9.13 | 0.37 | 0.95 |
Table 6.
3—way ANOVA test of d2 test results.
| D2 Test Results | Source | SS | df | MS | F | p |
|---|---|---|---|---|---|---|
| TN–E | illuminance | 5891.646 | 3 | 1963.882 | 0.964 | 0.410 |
| CCT | 5222.252 | 2 | 2611.126 | 1.282 | 0.279 | |
| Readingtype | 1390.597 | 1 | 1390.597 | 0.683 | 0.409 | |
| illuminance * CCT | 35,194.821 | 6 | 5865.804 | 2.879 | 0.009 ** | |
| illuminance * Readingtype | 5347.565 | 3 | 1782.522 | 0.875 | 0.454 | |
| CCT * Readingtype | 2660.394 | 2 | 1330.197 | 0.653 | 0.521 | |
| illuminance * CCT * Readingtype | 12,627.233 | 6 | 2104.539 | 1.033 | 0.403 | |
| E1 | illuminance | 42.970 | 3 | 14.323 | 0.097 | 0.961 |
| CCT | 50.040 | 2 | 25.020 | 0.170 | 0.844 | |
| Readingtype | 6.669 | 1 | 6.669 | 0.045 | 0.832 | |
| illuminance * CCT | 1752.546 | 6 | 292.091 | 1.985 | 0.067 * | |
| illuminance * Readingtype | 9.984 | 3 | 3.328 | 0.023 | 0.995 | |
| CCT * Readingtype | 37.819 | 2 | 18.909 | 0.128 | 0.879 | |
| illuminance * CCT * Readingtype | 227.323 | 6 | 37.887 | 0.257 | 0.956 | |
| E2 | illuminance | 1.294 | 3 | 0.431 | 0.944 | 0.420 |
| CCT | 0.298 | 2 | 0.149 | 0.326 | 0.722 | |
| Readingtype | 11.993 | 1 | 11.993 | 26.241 | 0.000 * | |
| illuminance * CCT | 2.149 | 6 | 0.358 | 0.784 | 0.583 | |
| illuminance * Readingtype | 0.652 | 3 | 0.217 | 0.475 | 0.700 | |
| CCT * Readingtype | 0.623 | 2 | 0.311 | 0.682 | 0.507 | |
| illuminance * CCT * Readingtype | 2.266 | 6 | 0.378 | 0.826 | 0.550 |
* Significance levels are set at p < 0.05 * and p < 0.01 **. Results with a significance level have been marked and italicized.
Table 7.
Compariation based on 50 lx.
| 100 lx | 150 lx | 200 lx | |||||
|---|---|---|---|---|---|---|---|
| 50 lx | D–overall | ↑ | * | ↑ | ** | ↑ | ** |
| D–reading | ↑ | * | ↑ | * | ↑ | * | |
| D–brightness | ↑ | n.s | 1 | ** | ↑ | ** | |
| Digital total preference | ↑ | * | ↑ | ** | ↑ | ** | |
| P–overall | ↑ | n.s | ↑ | ** | ↑ | ** | |
| P–reading | ↑ | n.s | ↑ | ** | ↑ | ** | |
| P–brightness | ↑ | n.s | ↑ | ** | ↑ | ** | |
| Paper total preference | ↑ | * | ↑ | ** | ↑ | ** | |
| distressed | ↑ | n.s | ↑ | n.s | 0 | n.s | |
| jittery | 0 | n.s | 0 | n.s | ↑ | n.s | |
| nervous | ↑ | n.s | 0 | n.s | ↑ | n.s | |
| Total negative emotions | ↑ | n.s | 0 | n.s | ↑ | n.s | |
| energetic | ↑ | n.s | ↑ | * | ↑ | * | |
| vigorous | 0 | n.s | ↑ | n.s | ↑ | n.s | |
| alert | ↑ | n.s | ↑ | n.s | 0 | n.s | |
| Total positive emotions | 0 | n.s | ↑ | * | ↑ | * | |
| sleepy | ↑ | * | ↑ | n.s | ↑ | n.s | |
| fatigue | ↑ | n.s | ↑ | * | ↑ | n.s | |
| eye aching | ↑ | n.s | ↑ | n.s | ↑ | n.s | |
| eye burning | ↑ | n.s | ↑ | n.s | ↑ | n.s | |
| Total fatigue feelings | ↑ | * | ↑ | * | ↑ | n.s | |
* Significance levels are set at p < 0.05 * and p < 0.01 ** and n.s means not significant. ↑ means average value is higher compared with 50 lx condition and 0 means not higher.
Disclaimer/Publisher’s Note: The statements, opinions and data contained in all publications are solely those of the individual author(s) and contributor(s) and not of MDPI and/or the editor(s). MDPI and/or the editor(s) disclaim responsibility for any injury to people or property resulting from any ideas, methods, instructions or products referred to in the content. |
© 2024 by the authors. Licensee MDPI, Basel, Switzerland. This article is an open access article distributed under the terms and conditions of the Creative Commons Attribution (CC BY) license (https://creativecommons.org/licenses/by/4.0/).
Share and Cite
MDPI and ACS Style
Ni, Y.; Weirich, C.; Lin, Y. Enhanced Visual Performance for In–Vehicle Reading Task Evaluated by Preferences, Emotions and Sustained Attention. Appl. Sci. 2024, 14, 3513. https://doi.org/10.3390/app14083513
AMA Style
Ni Y, Weirich C, Lin Y. Enhanced Visual Performance for In–Vehicle Reading Task Evaluated by Preferences, Emotions and Sustained Attention. Applied Sciences. 2024; 14(8):3513. https://doi.org/10.3390/app14083513
Chicago/Turabian StyleNi, Yichen, Christopher Weirich, and Yandan Lin. 2024. "Enhanced Visual Performance for In–Vehicle Reading Task Evaluated by Preferences, Emotions and Sustained Attention" Applied Sciences 14, no. 8: 3513. https://doi.org/10.3390/app14083513
Note that from the first issue of 2016, this journal uses article numbers instead of page numbers. See further details here.