
Research on Optimization of an Open-Bench Deep-Hole Blasting Parameter Using an Improved Gray Wolf Algorithm


School of Environment and Resources, Southwest University of Science and Technology, Mianyang 621000, China
*
Author to whom correspondence should be addressed.
Appl. Sci. 2024, 14(8), 3514; https://doi.org/10.3390/app14083514
Submission received: 20 March 2024
/
Revised: 11 April 2024
/
Accepted: 19 April 2024
/
Published: 22 April 2024
(This article belongs to the Special Issue Recent Advances in the Effect of Blast Loads on Structures)
Abstract
:The blasting quality of open-pit mining can be enhanced and the production cost of stope reduced by establishing a mathematical model for step drilling and blasting costs based on stope consumption. By enhancing the Gray Wolf algorithm, the parameters for step drilling and blasting are optimized, resulting in improved effectiveness for step blasting mining, as demonstrated through modeling and calculation. The enhanced Gray Wolf algorithm effectively enhances the blasting performance, reduces production costs, and increases production efficiency. Taking a limestone mine as an example, the optimized drilling and blasting parameters are as follows: hole spacing of 4.62 m, row spacing of 4 m, and explosive consumption rate of 0.23 kg/t; based on these parameters, the stope’s production cost is reduced to CNY 7.7.
1. Introduction
The selection of blasting parameters significantly impacts the outcomes of blasting operations, with a close correlation with the associated costs. Moreover, the configuration of these parameters also influences the expenses incurred during drilling and loading in production and processing processes. Common issues encountered in open-pit step blasting include excessive explosive consumption, a high proportion of oversized fragments post-blasting, and large block sizes that hinder efficient loading. In some cases, even secondary blasts are required for excessively large rock fragments, as depicted in Figure 1. These challenges severely hamper both production efficiency and cost-effectiveness. Consequently, it becomes imperative to identify optimal drilling and blasting parameters within open-pit blasting operations to effectively control blast effects while minimizing costs [1].
Currently, due to the challenges encountered in the process of loading blasting materials, numerous scholars have conducted research on optimizing parameters for open-air step blasting. Liu Guanghui [2], Guo Ming [3], and Tan Zhen [4] employed traditional Gray correlation analysis to examine the primary factors influencing lumpiness caused by blasting and concluded that the consumption of explosives is the main factor affecting both lumpiness and overall effectiveness. However, this result only demonstrates a correlation between explosive unit consumption and block degree without directly linking it to production cost. Yin Yuexian et al. [5] analyzed field experiments to establish a relationship between explosive unit consumption and block consumption, ultimately obtaining a curve that can be utilized for selecting optimal levels of explosive unit consumption. Wu Yongxiang [6] determined multiple group schemes through engineering experiments aimed at optimizing and screening blasting parameters; however, these studies primarily focus on individual parameter optimization, with limited impact on the overall cost or effectiveness. The results obtained by Wen Xing [7] and Peng Jinhao [8] regarding different projects’ blasting parameters are only applicable within their respective projects, making them difficult to apply in other types of projects’ selection processes for such parameters. Xu Dengwei [9] and Lan Qiuhua [10], among others, established several groups of optimization schemes based on varying lithology while verifying feasibility through field tests on open-pit steps; however, subjective designer experience still influences parameter selection. In the aforementioned studies, the investigation of blasting parameters primarily relies on field tests or a combination of numerical experiments. The selection of blasting parameters is predominantly based on empirical settings or traditional calculation formulas for such parameters in order to design and optimize experimental groups. Subsequently, adjustments and optimizations are made according to experimental results to achieve optimal outcomes. On one hand, this optimization process renders the obtained blasting parameters susceptible to variations in experiment quantity and the rationality of experiment designs, making it challenging to accurately determine precise values for these parameters while also considering overall costs. On the other hand, field tests encounter certain challenges, such as tedious procedures and complex operations, which may hinder their implementation in some projects. The desired blasting effect in the mine can be achieved through optimizing the design of blasting parameters and enhancing blasting methods. The primary objective of optimization is to minimize mining costs. To achieve this, it is essential to establish a precise system for evaluating the blasting effect and construct an optimization model based on this system that accurately reflects real-world conditions. However, due to numerous imperfect evaluation systems for the blasting effects and various types of optimization models available, most personnel involved in blasting still heavily rely on empirical knowledge to make multiple adjustments in order to attain optimal outcomes. This dependence on experiential methods has long impeded changes in the design of blasting parameters and techniques within engineering projects, thereby limiting advancements in mining technology and cost optimization. The development of a method that can directly correlate blasting parameters with production costs, while being easily implementable and capable of accurately determining optimal blasting parameters, is, therefore, imperative.
In recent years, with the rapid advancement of computer technology and artificial intelligence, various optimization algorithms have been extensively utilized in transportation [11], logistics [12], energy scheduling [13], as well as diverse forecasting applications [14]. Moreover, their application in mining has also yielded significant outcomes. In light of this, the present study employs the enhanced Gray Wolf optimization algorithm [15,16] to determine the blasting parameters for open-pit drilling. Compared to conventional algorithms, this improved approach enables faster and more accurate identification of optimal values. Additionally, by establishing a production cost model for blasting shipping and solving an objective function related to optimal cost determination, it is possible to directly link blasting parameters with production costs. Furthermore, using a limestone mine located in southwest China as a case study example, the mining and production model is established to calculate production costs. The improved Gray Wolf algorithm is then employed to solve this model and identify drilling and blasting parameters that minimize consumption costs. The specific analysis process is illustrated in Figure 2.
2. Optimization Model of Bench Drilling and Blasting Parameters in Open-Pit Mine
In recent years, among a large number of parameters that affect the blasting effect and blasting quality, the block theory is widely accepted by scholars [17]. The main parameters for blasting block are hole spacing, explosive consumption, and resistance line; thus, the design of these parameters can change the overall block and improve the blasting quality and effect [18,19].
According to the actual situation of mine production, the blasting mining cost is divided into drilling cost C1, blasting cost C2, and shipping cost C3.
The cost of drilling in a significant number of drilling and blasting operations exhibits a strong positive correlation as follows:
where C1 represents the overall expenditure for drilling all holes; m1 denotes the cost per meter drilled; L is the hole depth; H is the height of the step; S is the bore area of the pore network; γ is the bulk density of the ore.
The cost of step blasting is mainly related to the consumption of explosives, hole load area, and step parameters and mainly consists of the consumption of explosives and blasting materials.
where q is the single explosive consumption; m2 is the unit price of the explosive; m3 is the cost of blasting equipment consumed per meter.
The loading process mainly includes two parts: shoveling cost and transportation cost. The shoveling process is affected by the degree of rock blocks, and the average block size is taken as the independent variable of shoveling cost, which is obtained by statistics on the consumption of shoveling equipment and the amount of shoveling per unit time. The transportation cost is related to the consumption of vehicles and the average block size, among which the average block size mainly affects the load rate of vehicles. Shipment costs are grouped into two parts as follows:
where X is the average lumpiness of the shipped ore; m4 is the transportation cost per ton of ore; A1–A5 is the correlation coefficient of the statistical model.
In the mine’s production process, the results of open-pit drilling and blasting are affected by many factors, and the average lumpiness after blasting directly affects the subsequent production cost. Therefore, the model of blasting production cost is established as follows:
The cost of rock drainage is in line with the transportation cost, as it encompasses the expenses related to personnel operation and management included in the shipping cost.
3. Solving Algorithm of Blasting Parameter Optimization Model
3.1. Gray Wolf Optimization Algorithm
The Gray Wolf Optimization (GWO) algorithm emulates the predation behavior of gray wolves, incorporating various cooperative division of labor and internal communication processes to achieve intelligent optimization for finding the optimal survival strategy. The algorithm primarily consists of three key operations: wolf tracking, approximation, and attack. Figure 3 illustrates the simulated movement pattern. The specific process is outlined as follows:
3.1.1. Initializing Population
The wolf pack begins to forage: the first alpha wolf, beta wolf, delta wolf and another wolf ω are generated at the beginning, and the distance and direction of their movement in relation to the prey are defined by Equations (5) and (6).
where XP(n) is the prey position after n selections; Xg(n) represents the position of the Gray Wolf after n times of transmission, that is, the local solution; σ and τ are random coefficient; σ = 2a·r1 − a, τ = 2·r2, a decreases linearly in the interval [0, 2]; r1 and r2 are random numbers in the interval [0, 1].
3.1.2. Determine the Location
The wolves and their prey exist within a vast abstract space, making it challenging to determine the precise location of the prey. Therefore, it is assumed that the α wolf, β wolf, and δ wolf possess exceptional hunting abilities during initialization. This implies that the local solutions obtained in the first three attempts are preserved and expressed as follows:
The symbol D represents the distance between ω other wolves and the initial three wolves, while Xg(n) denotes its current position.
The symbol X denotes the direction and step size of each iteration, while X(n + 1) represents the final position after ω other wolves have undergone the same iterative process.
3.2. Improved Gray Wolf Optimization Algorithm
The Gray Wolf algorithm’s method for finding the optimal value is relatively straightforward but highly reliant on the initialization position. If the initial value is close to a local solution that is far from the optimal solution, reaching the optimum becomes challenging due to limited search distance. Additionally, as ‘a’ decreases linearly from 2 to 0, ‘σ’ also exhibits a linear decline, while the actual process’s search solution is nonlinear. Consequently, if nonlinearity arises early on and convergence happens too quickly at the beginning with a small population number and reduced search scope, it may lead to falling into a local solution. Conversely, if convergence occurs slowly in later stages, algorithm efficiency will be excessively low [20,21,22,23].
3.2.1. Tent Chaotic Mapping
In order to overcome the limitations of local solutions, chaos mapping can be employed to extend the initial position beyond the range of local solutions, thereby enhancing its global solution search capability and convergence ability. Chaotic sequences are frequently utilized in optimization search problems, with Tent chaotic mapping offering distinct advantages over other chaotic maps in terms of randomness, uniformity, ergodicity, and other aspects. Consequently, Tent mapping is chosen as the governing rule for generating initial Gray Wolf populations within the Gray Wolf Optimization algorithm due to its superior mathematical expression [24,25,26,27].
The random generation number “u” in the interval [0, 1] determines the chaos parameter and influences the distribution characteristics of the generated sequence “X”. When “u” is 0.5, the generated sequence follows a uniform distribution. The sequence “X” is initially generated by the Tent map.
3.2.2. Convergence Factor a
The selection of a nonlinear convergence factor is based on the influence of σ in the Gray Wolf algorithm on both local and global search, aiming to enhance the algorithm’s early-stage global search capability.
The maximum number of iterations, denoted as T, represents the upper limit for the iteration process. Meanwhile, t refers to the actual number of iteration steps taken during this process.
3.2.3. Population Location Renewal and Variation
The process of population position renewal involves an iterative process, which leads to a decrease in population size and an increase in duplicate individuals. This often results in local convergence and the adoption of suboptimal solutions. To address this issue, Gaussian variation [28,29] is introduced to facilitate population position renewal and variation, thereby reducing the likelihood of falling into local solutions. The formula for generating individuals using Gaussian variation is as follows:
The position of the individual after variation, denoted as X(t + 1), is determined by a normally distributed random variable N. This variable follows a Gaussian distribution, with a mean of 0 and a standard deviation of 1.
The improvement process for the enhanced Gray Wolf algorithm is illustrated in Figure 4. Firstly, the population is initialized, and the number of iterations as well as the search scope of the spatial dimension are determined. Subsequently, the new position for each wolf pack member is computed by comparing Tent mapping with a nonlinear convergence factor. Then, based on the objective function, the positions of three wolves with optimal fitness are calculated and recorded; subsequently, these positions are compared to their original fitness values and updated accordingly for each new wolf. Finally, whether or not the maximum number of iterations has been reached is assessed. If so, the optimal solution is recorded; otherwise, iteration continues until reaching the specified number.
The improved Gray Wolf algorithm’s optimization ability is tested using the multi-peak test function. Figure 5 illustrates the trajectory of the multi-peak function search, which is a commonly employed test function for evaluating optimization algorithms with a dimension of 30 and a theoretical minimum value of 0. This function contains multiple peaks that effectively discern optimization algorithms with inadequate global search capabilities, as they tend to converge towards local optima.
After considering the objective function, other optimization algorithms, such as the simulated annealing optimization algorithm [30] (SA), genetic optimization algorithm [31] (GA), particle swarm optimization algorithm [32] (PSO), improved Whale algorithm [33] (EWOA), and improved Gray Wolf optimization algorithm (IGWO), were all set to a population of 50 with 1000 iterations. Multiple comparison experiments were conducted to find the optimal solution for the function. The enhanced Gray Wolf algorithm exhibits accelerated descent and convergence in Figure 6 while searching for the minimum fitness value, whereas other algorithms fail to attain the specified number of iteration steps due to local optima. As shown in Figure 7, it is evident that the search results of the improved Gray Wolf Optimization algorithm can achieve an optimal solution with a value of zero, indicating its superior global search capability compared to other algorithms as it accurately identifies the global optimum.
4. Optimization of Blasting Parameters
4.1. The Optimization of Engineering Cases
The lime mine area has an elevation ranging from 624 m to 1063 m, with a relative elevation difference of 439 m, indicating a medium-cut low-mountain landform. The terrain in the mining area exhibits higher elevations towards the north and lower elevations towards the south, characterized by steep slopes and well-developed vegetation. The highest mining point reaches +900 m, while the lowest mining point is at +701 m, resulting in a relative elevation difference of 199 m. The natural ore composition is relatively simple, consisting solely of limestone ore with predominant mineral components, including calcite, sparry calcite, and dolomite. The rock’s physical and mechanical parameters are presented in Table 1. At the conclusion of mining operations, the step height measures 15 m, while the working step exhibits a slope angle of 75°. The safety platform spans a width of 4 m, whereas the cleaning platform boasts an impressive width of 8 m. The road grade is classified as III and has a width of 8 m. With regard to longitudinal slopes, the maximum stands at 8%, while the average measures 6.4%. Additionally, a minimum turning curve radius of 15 m is required, and a relaxation slope section with a minimum length of 60 m must be implemented. To ensure optimal conditions for transportation within the mine site, mud-bound gravel pavement will be utilized along approximately 2.8 km worth of mining roads. Lastly, medium- and deep-hole multi-row hole-differential extrusion blasting techniques will be employed in conjunction with detonating tubes.
During the calculation process for overall costs, actual consumption and production data from mine operations are taken into consideration. It can be concluded that the drilling cost per meter in the mine (m1) amounts to CNY 22/m. The step height is set at 15 m with a hole depth (L) of 17 m. The bulk weight of ore (γ) stands at 2.62 ton/cubic meter. An emulsion explosive is used for blasting with a unit price (m2) of CNY 7/kg. Additionally, the cost per meter for blasting equipment (m3) reaches CNY 3.5/m. Transportation costs per ton of ore amount to m4 = CNY 2/ton. By analyzing lumpiness and consumption costs related to shipped ore statistics, values A1 = 0.298, A2 = 0.013, A3 = −0.0036, A4 = 0.032, and A5 = 0.48 can be obtained. By incorporating these variables into Formula (4), we can derive an overall consumption cost mathematical model specific to limestone mines. To solve this mathematical model effectively, the improved Gray Wolf algorithm is employed. The objective function associated with it is as follows:
The equation is defined as follows: X represents the average block size, a denotes the hole distance, b signifies the row distance, and q indicates the single explosive consumption.
The development of the limestone mine joint has not been undertaken. Based on the average block formula and blasting experience formula, we derived the target constraint conditions.
The given formula incorporates the subsequent variables: a denotes the hole distance, b represents the row distance, q signifies the explosive consumption per unit, Q stands for the charge amount, and m represents the gun hole density coefficient. Typically, limestone exhibits a value ranging from 0.8 to 1.0 for this coefficient. W1 corresponds to the chassis resistance line, with a fixed value of 5 m. In terms of empirical values, q ranges from 0.2 to 0.4 kg/t for explosive consumption per unit, while a varies between 4 and 5 m for hole distance, and b ranges from 3 to 4 m for row distance. By enhancing the Gray Wolf optimization algorithm in order to search for optimal results within our objective function, we obtained optimal values as follows: a = 4.62 m (optimal hole distance), b = 4 m (optimal row distance), q = 0.23 kg/t (the quantity of explosives utilized for each ton of ore during blasting), and b = 4 m (optimal row distance). The total cost was optimized at CNY 7.7/ton while satisfying all imposed constraints.
The step diagram is depicted in Figure 8. The hole arrangement predominantly follows a triangular pattern, and the layout is accomplished through manual drafting tape. Based on engineering requirements and geological conditions, all charges are continuously connected, with the adoption of either multi-hole or single-hole delayed detonation, depending on site conditions. The delayed detonation network is illustrated in Figure 9. The hole distance is 4.62 m, the row distance is 4 m, and the layout accuracy is 0.1 m.
H is the height of the step, 15 m; B represents the safe distance between the center of the drilling hole and the top line of the slope on the step surface, 3 m; W1 is the length of the chassis resistance line, 5 m; L is the hole depth, 17 m; L1 is the charge depth, 12 m; h is the excess depth of the hole, 0.3 m; finally, L2 indicates the depth to fill the blockage, 5 m.
The optimal parameters, with a hole spacing of 4.62 m and row spacing of 4 m, exhibit excellent blasting effectiveness in practical operations, effectively reducing the bulk rate and lowering the production cost of loading. The results after production blasting operation are illustrated in Figure 10.
4.2. Algorithm Comparison Verification
The enhanced Gray Wolf algorithm is further assessed for its capability to explore the objective function in engineering applications. To accomplish this, we utilize a mathematical model based on the aforementioned engineering parameters as the target solution. We compare it with well-established and widely used optimization algorithms, such as simulated annealing (SA), genetic optimization (GA), and particle swarm optimization (PSO). Moreover, our emphasis lies in minimizing overall cost consumption using a low-complexity model. The experiment comprises 200 iterations, a population size of 20, and a solution dimension of 3. We observe the variation in fitness with each iteration number. As illustrated in Figure 11, the Gray Wolf Optimization algorithm demonstrates rapid convergence speed, with lower fitness values indicating attainable optimal cost solutions. In contrast, other intelligent optimization algorithms exhibit slower iteration speeds and encounter challenges escaping local optima or locating the global optimum.
4.3. Numerical Simulation Verification
According to the enhanced Gray Wolf algorithm, the blasting parameters and mine production data obtained from the overall cost mathematical model are resolved. The numerical model of the blasting step is established by utilizing Rhino modeling software (Version 6 SR10) coupled with Flac3d (Version 7.00.126), and a comparison is made between the failure situation and damage range of the step under different hole spacing and row spacing to validate the rationality of solving the blasting parameters.
4.3.1. Establishing the Model for Blasting Steps
The slope’s step size was confirmed to be consistent with the actual step size, with a height of 15 m and a gun hole depth of 17 m. The bottom end was extended by 30 cm, while the overall width of the model measured 10 m. The initial model was created using Rhino modeling software, generating a solid grid. The grid had a minimum mesh length of 0.1 m and a maximum mesh length of 1 m. Gun holes were spaced at intervals of 4.62 m horizontally and rows were spaced at intervals of 4 m vertically. In the mixed-grid mode, for instance, there were a total of 109,175 output grids generated. Figure 12 illustrates both the model and the position of the gun holes in it, while Figure 13 shows their location in Flac3d model format. When generating the initial stress field, constraints were applied on all sides surrounding it as well as on its front, back, left, and right sides.
4.3.2. Applying Dynamic Loading
The dynamic loading position is located on the inner surface of the gun hole, with the upper part serving as a plugging section, measuring 3.75 m in length. The sine wave loading technique is employed, with a total loading time of 0.08 s and appropriate damping and free-field boundaries set up. Figure 14 illustrates the load exerted by both the free-field boundary and blasting hole surface after loading.
4.3.3. Conducting Comparative Analysis on Model Failure
In order to compare and analyze the influence of hole spacing and row spacing on slope step blasting, the maximum principal stress distribution of the three models is illustrated in Figure 15. The hole spacing for group (a) is 4 m and 3.46 m, for group (b) is 4.62 m and 4 m, and for group (c) is 5 m and 4.33 m. (a) After blasting, the maximum stress at the gun hole location reaches 1.543 × 10⁵ N, while the maximum principal stress at the middle and back sections amounts to 6 × 10⁴ N. The stress distribution exhibits unevenness with a concentration area, where significant stress occurs in the rear rock mass. (b) Following blasting, the maximum stress at the gun hole location measures up to 1.542 × 10⁵ N; however, there exists small residual stress in both the middle and back parts of the rock mass with an evenly distributed pattern. (c) For group (c), after blasting, it shows a peak value of approximately 1.554 × 10⁵ N at the gun hole location as well as a maximum principal stress reaching around 8 × 10⁴ N in its middle and back sections, which also exhibit some degree of concentration. By comparing these cloud images, it can be observed that within a range of approximately 20 m–40 m from the upper edge of the step area, the level of stress experienced by group (b) is significantly lower than that encountered by both groups (a) and (c). This indicates that due to minimal damage effects on the intact rock mass behind caused by blasting operations, group (b) demonstrates better suitability for mining production and construction purposes. The level of stress at the back end of group (c) is less than that of group (a), but it is more pronounced than that of group (b). Therefore, it can better adapt for rock mining and production compared to groups (a) and (c).
The acceleration changes in groups (a), (b), and (c) at 30 m on the edge of the step within 1 s of blasting time are illustrated in Figure 16. It can be observed from the figure that group (a) achieves a maximum acceleration of 0.185 m/s2 at 0.009 s, while group (b) reaches a peak acceleration of 0.176 m/s2 at the same time. Group (c), on the other hand, attains its maximum value at 0.009 s, with a peak acceleration of 0.183 m/s2. Similarly, among the three simulation groups, group (b) experiences the smallest peak acceleration, indicating that the rock mass behind it bears minimal stress and exhibits good stability, which is favorable for subsequent construction.
The velocity changes at 30 m on the upper edge of the slope step for groups (a), (b), and (c) within 1 s of the blasting record time are depicted in Figure 17. It can be observed from the figure that group (a) reaches a maximum velocity of 0.022 m/s, after which it starts to decline. Group (b) attains a maximum velocity of 0.013 m/s, peaking at 0.045 s before declining thereafter. Group (c) achieves a maximum speed of 0.023 m/s towards the end. Consequently, it can be concluded that among these three groups simulating slope step blasting, group (b) exhibits a minimal impact on the farthest measurement point from the blast hole location, specifically on the upper edge of the slope step, thus indicating that group (b) inflicts less damage to the intact rock mass behind its post-blasting.
The above idealized model research experiments demonstrate that the enhanced Gray Wolf algorithm is employed for optimizing blasting parameters in mining slopes with simple lithology and structural planes, resulting in improved blasting effectiveness and cost optimization.
5. Conclusions
(1) By optimizing the initial population generation and convergence factors of the original Gray Wolf algorithm, the improved Gray Wolf Optimization algorithm demonstrates significant advantages over its predecessor in solving multi-peak objective functions. It exhibits faster convergence and a stronger ability to search for global optimal solutions.
(2) A mathematical model is established to accurately analyze and calculate the production cost of drilling, blasting, and loading operations in a limestone mine. This enables precise control over mine production costs. The improved Gray Wolf Optimization algorithm is applied to optimize mining parameters for blasting in order to obtain overall optimal cost parameters for mine extraction. The optimal hole distance is determined as 4.62 m, row distance as 4 m, and explosive consumption as 0.23 kg/t, with a resulting cost of 7.7 CNY/ton. Numerical comparison experiments and actual production applications confirm that these results meet the production requirements effectively, providing a valuable reference for similar projects.
Author Contributions
Investigation, Writing—original draft, L.Z. and D.S.; Writing—review & editing, L.Z. and D.S.; Numerical simulation, Software, L.Z., Z.L. and B.C.; Data curation, R.W. and R.C. All authors have read and agreed to the published version of the manuscript.
Funding
Financial support for this work was provided by the Sichuan Natural Science Foundation Project (Youth Science Foundation Project) (No. 2022NSFSC1089) and the Natural Science Foundation of the Southwest University of Science and Technology (No. 18zx7124).
Institutional Review Board Statement
Not applicable.
Informed Consent Statement
Not applicable.
Data Availability Statement
The data presented in this study are available in article.
Conflicts of Interest
The authors declare no conflict of interest.
References
- Sun, Z. Optimization of deep hole blasting parameters in Anjialing open pit Mine. Open Pit Min. Technol. 2022, 37, 32–34. [Google Scholar]
- Liu, G.; Yu, D. Grey correlation analysis of influencing factors of block size in medium-deep hole step blasting. Blasting 2008, 39–41+46. [Google Scholar] [CrossRef]
- Guo, M. Grey Correlation analysis of main influencing factors of blasting block degree. Min. Res. Dev. 2000, 20, 41–43. [Google Scholar] [CrossRef]
- Tan, Z.; Li, G.; Li, C.; Huang, Y. Grey correlation analysis of blasting parameters’ influence on blasting block effect. Min. Eng. 2003, 1, 41–43. [Google Scholar]
- Yin, Y.; Zhu, Z.; Chen, M. Experimental Study on Mining Blasting of Chang-jiu Limestone Mine. Blasting 2020, 37, 43–47+88. [Google Scholar] [CrossRef]
- Wu, Y.; Zhao, M.; Wang, J.; Du, L.; He, T.; Qian, Z. Optimization test and application of blasting hole network parameters on slope surface of different mines. Blasting 2022, 39, 75–80+99. [Google Scholar]
- Wen, X.; Zhao, L.; Zhu, Q.; Li, P. Research on optimization of mine drilling and blasting parameters based on blasting funnel test. Min. Res. Dev. 2021, 41, 28–31. [Google Scholar]
- Peng, J.; Fu, Y.; Chen, Y.; Zhang, K.; Luo, D. Optimization and application of tunnel blasting parameters based on blasting funnel test. Min. Res. Dev. 2020, 40, 23–26. [Google Scholar]
- Xu, D.; Li, W.; Zhang, K.; Peng, X.; Qian, X. Experimental study on a bench blasting funnel with different lithology in an open pit. Nonferrous Met. Eng. 2023, 13, 129–140. [Google Scholar]
- Lan, Q.; Wang, Z.; Deng, Q.; Yuan, C.; Gao, Z. Research on parameter optimization of open-pit deep hole step blasting in superhard rock. Nonferrous Met. (Mine Sect.) 2024, 76, 84–91. [Google Scholar]
- Liu, F.; Lu, G.; Jiang, K. Research on Optimization of high-speed train operation scheme for Intercity corridor based on Supply and demand coordination. Railw. Transp. Econ. 2024, 1–16. Available online: https://link.cnki.net/urlid/11.1949.u.20240313.1541.002 (accessed on 18 April 2024).
- Luo, Z.; Li, T. Data-driven Forecast of emergency medical supplies demand and logistics site-distribution optimization. Control Decis. 2024, 1–9. [Google Scholar] [CrossRef]
- Xu, X.; Zhang, M.; Pan, J.; Xu, C.; Zhang, H. Particle swarm Optimization Algorithm for Energy Scheduling of Multi-port energy router “Source Load and Storage”. J. Nav. Univ. Eng. 2024, 1–6. Available online: https://link.cnki.net/urlid/42.1106.E.20240314.1935.010 (accessed on 18 April 2024).
- Huang, L.; Song, S.; Liu, C.; Wang, J.; Hu, D.; He, Q.; Lu, Y. Ice Cover Prediction Model for Transmission lines based on IHHO-HKELM. J. Electr. Power Sci. Technol. 2024, 1–10. Available online: https://link.cnki.net/urlid/43.1475.TM.20240314.1605.002 (accessed on 18 April 2024).
- Cao, K.; Tan, C.; Liu, H.; Zheng, M. Data fusion algorithm of wireless sensor networks based on improved Grey Wolf algorithm and Optimized BP neural network. J. Univ. Chin. Acad. Sci. 2022, 39, 232–239. [Google Scholar]
- Lu, C.; Yu, J.; Yu, Z.; Ding, S.; Zhang, Z.; Qiu, K. Detection method of steel bar diameter in concrete based on improved Grey Wolf algorithm optimization SVR. Comput. Sci. 2022, 49, 228–233. [Google Scholar]
- Hu, Z. Comprehensive Optimization of Open Pit Blasting to Crushing. Ph.D. Thesis, Wuhan University of Technology, Wuhan, China, 2012. [Google Scholar]
- Zhou, Y.; Li, K.; Xiao, S.; Zhang, G. Optimization of dump stacking parameters in open pit. Metal Mine 2014, 48–51. [Google Scholar]
- Yan, Y.; Xu, Z.; Liu, X.; Wang, X.; Zhang, Y. Blasting parameter optimization based on improved sparrow search algorithm. Min. Metall. Eng. 2023, 43, 11–14+19. [Google Scholar]
- Chen, M.; Zhang, J.; Zhou, C. SOC Estimation of Li Ion Battery Based on IGWO BP Neural Network. J. Hubei Univ. Technol. 2024, 39, 46–51. [Google Scholar]
- Yan, F.; Shi, Z.; Wang, L. Dynamic energy-saving batch scheduling problem of flexible job shop based on improved Gray Wolf Algorithm. Mod. Manuf. Eng. 2024, 24–32+161. [Google Scholar] [CrossRef]
- Chen, P.; Zhou, J.; Wu, M. Research on On-line Metering Error prediction Method of DC Charging pile based on improved GGO-GM (1,1) model. Mod. Electron. Technol. 2024, 47, 112–117. [Google Scholar]
- Dai, W.; Wang, J.; Cheng, Z.; Zhang, P. Research on Improvement of Real Genetic Algorithm for Constrained Optimization Problems. Control Decis. 2019, 34, 937–946. [Google Scholar]
- Liu, Z.; He, L.; Yuan, L.; Zhang, H. Path planning of mobile robot using improved Gray Wolf algorithm. J. Xi’an Jiaotong Univ. 2022, 56, 49–60. [Google Scholar]
- Zhang, J.; Gu, X. Zinc consumption prediction by support vector machine based on improved Grey Wolf algorithm. J. East China Univ. Sci. Technol. (Nat. Sci. Ed.) 2022, 48, 343–351. (In Chinese) [Google Scholar]
- Shang, L.; Li, H.; Hou, Y.; Huang, C.; Zhang, J. Short-term power load forecasting based on feature selection and optimized Extreme Learning Machine. J. Xi’an Jiaotong Univ. 2022, 56, 165–175. [Google Scholar]
- Zhang, Z.; Rao, S.; Zhang, S. Grey Wolf optimization algorithm based on adaptive normal cloud model. Control Decis. 2021, 36, 2562–2568. [Google Scholar]
- Xu, C.; Li, C.; Yu, X.; Huang, Q. Improved Grey Wolf optimization Algorithm based on Cat Chaos and Gaussian variation. Comput. Eng. Appl. 2017, 53, 1–9+50. (In Chinese) [Google Scholar]
- Dang, X.; Wang, M. Function optimization of Grey Wolf algorithm improved by hybrid strategy. Comput. Digit. Eng. 2021, 49, 1747–1752. (In Chinese) [Google Scholar]
- Guo, P.; Chen, K.; Xian, S. Adaptive temperature simulated annealing algorithm for Traveling Salesman Problem. Control Theory Appl. 2021, 38, 245–254. [Google Scholar]
- Sun, Y.; Zhang, K.; Shi, Y.; Guo, H. Research on Optimization decision of emergency materials dispatch based on truck-UAV coordination in mountainous areas. Chin. J. Manag. Sci. 2023, 1–14. [Google Scholar] [CrossRef]
- Huang, Z.; Chen, X. Drone cluster forest fire detection method based on PSO-GA algorithm. Comput. Eng. Appl. 2023, 59, 289–294. (In Chinese) [Google Scholar]
- Feng, W.; Song, K. An enhanced whale optimization algorithm. Comput. Simul. 2020, 37, 275–279+357. [Google Scholar]
Figure 1.
The residual rock fragment remaining after a controlled explosion.
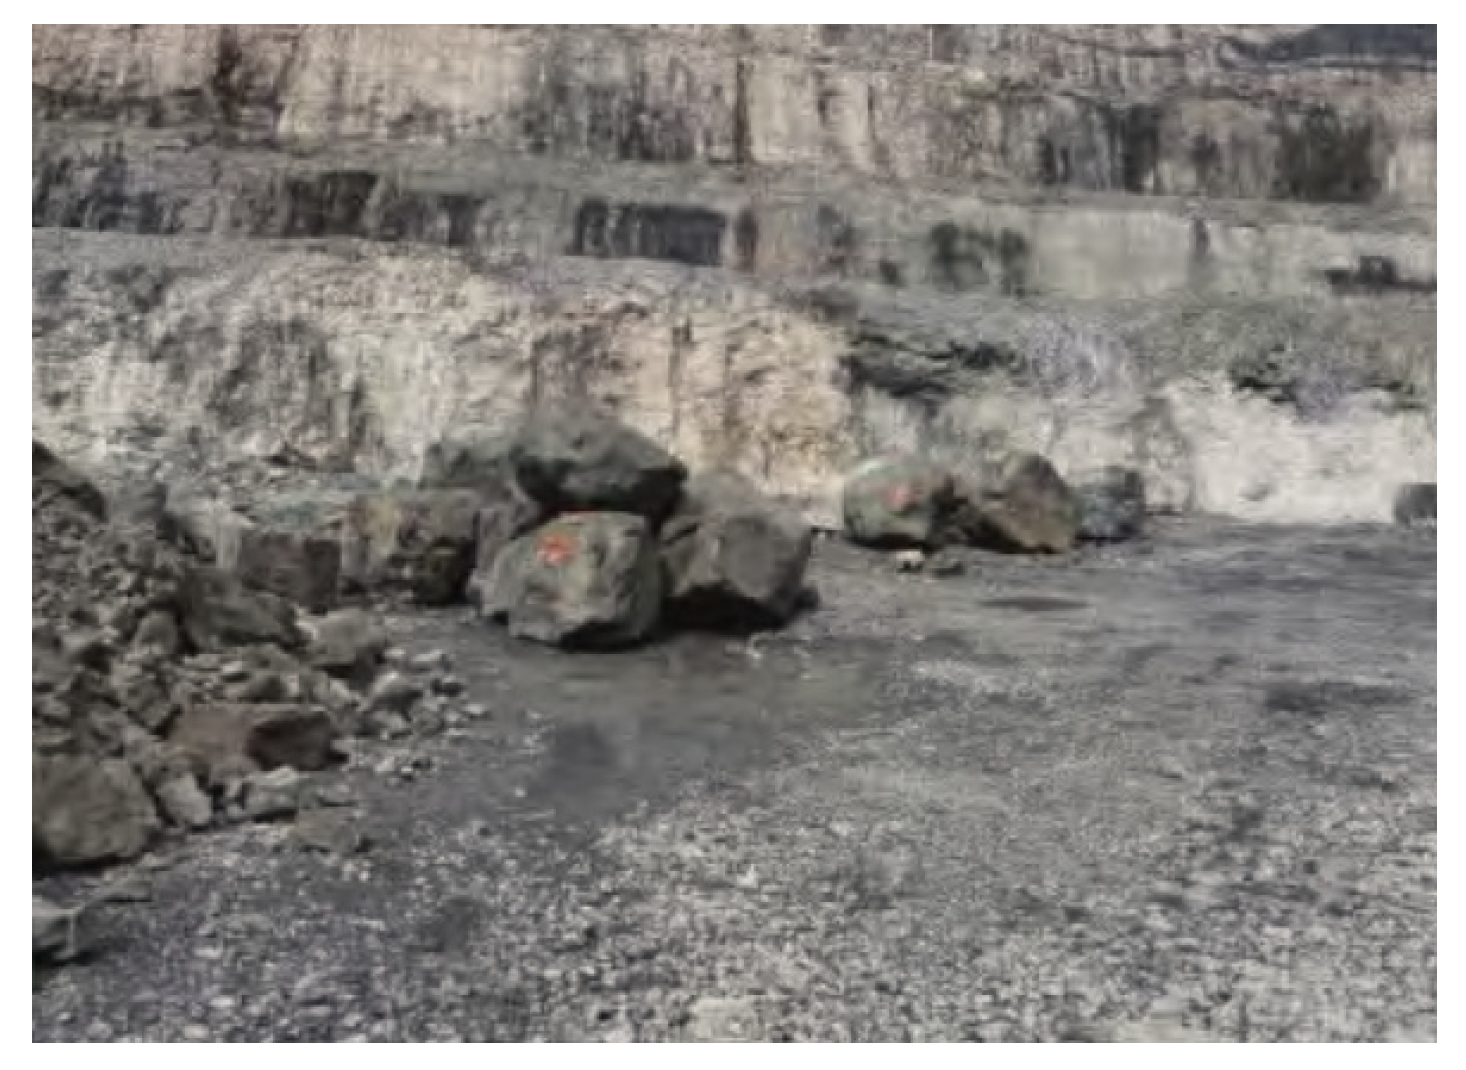
Figure 2.
A flow chart for parameter optimization analysis.
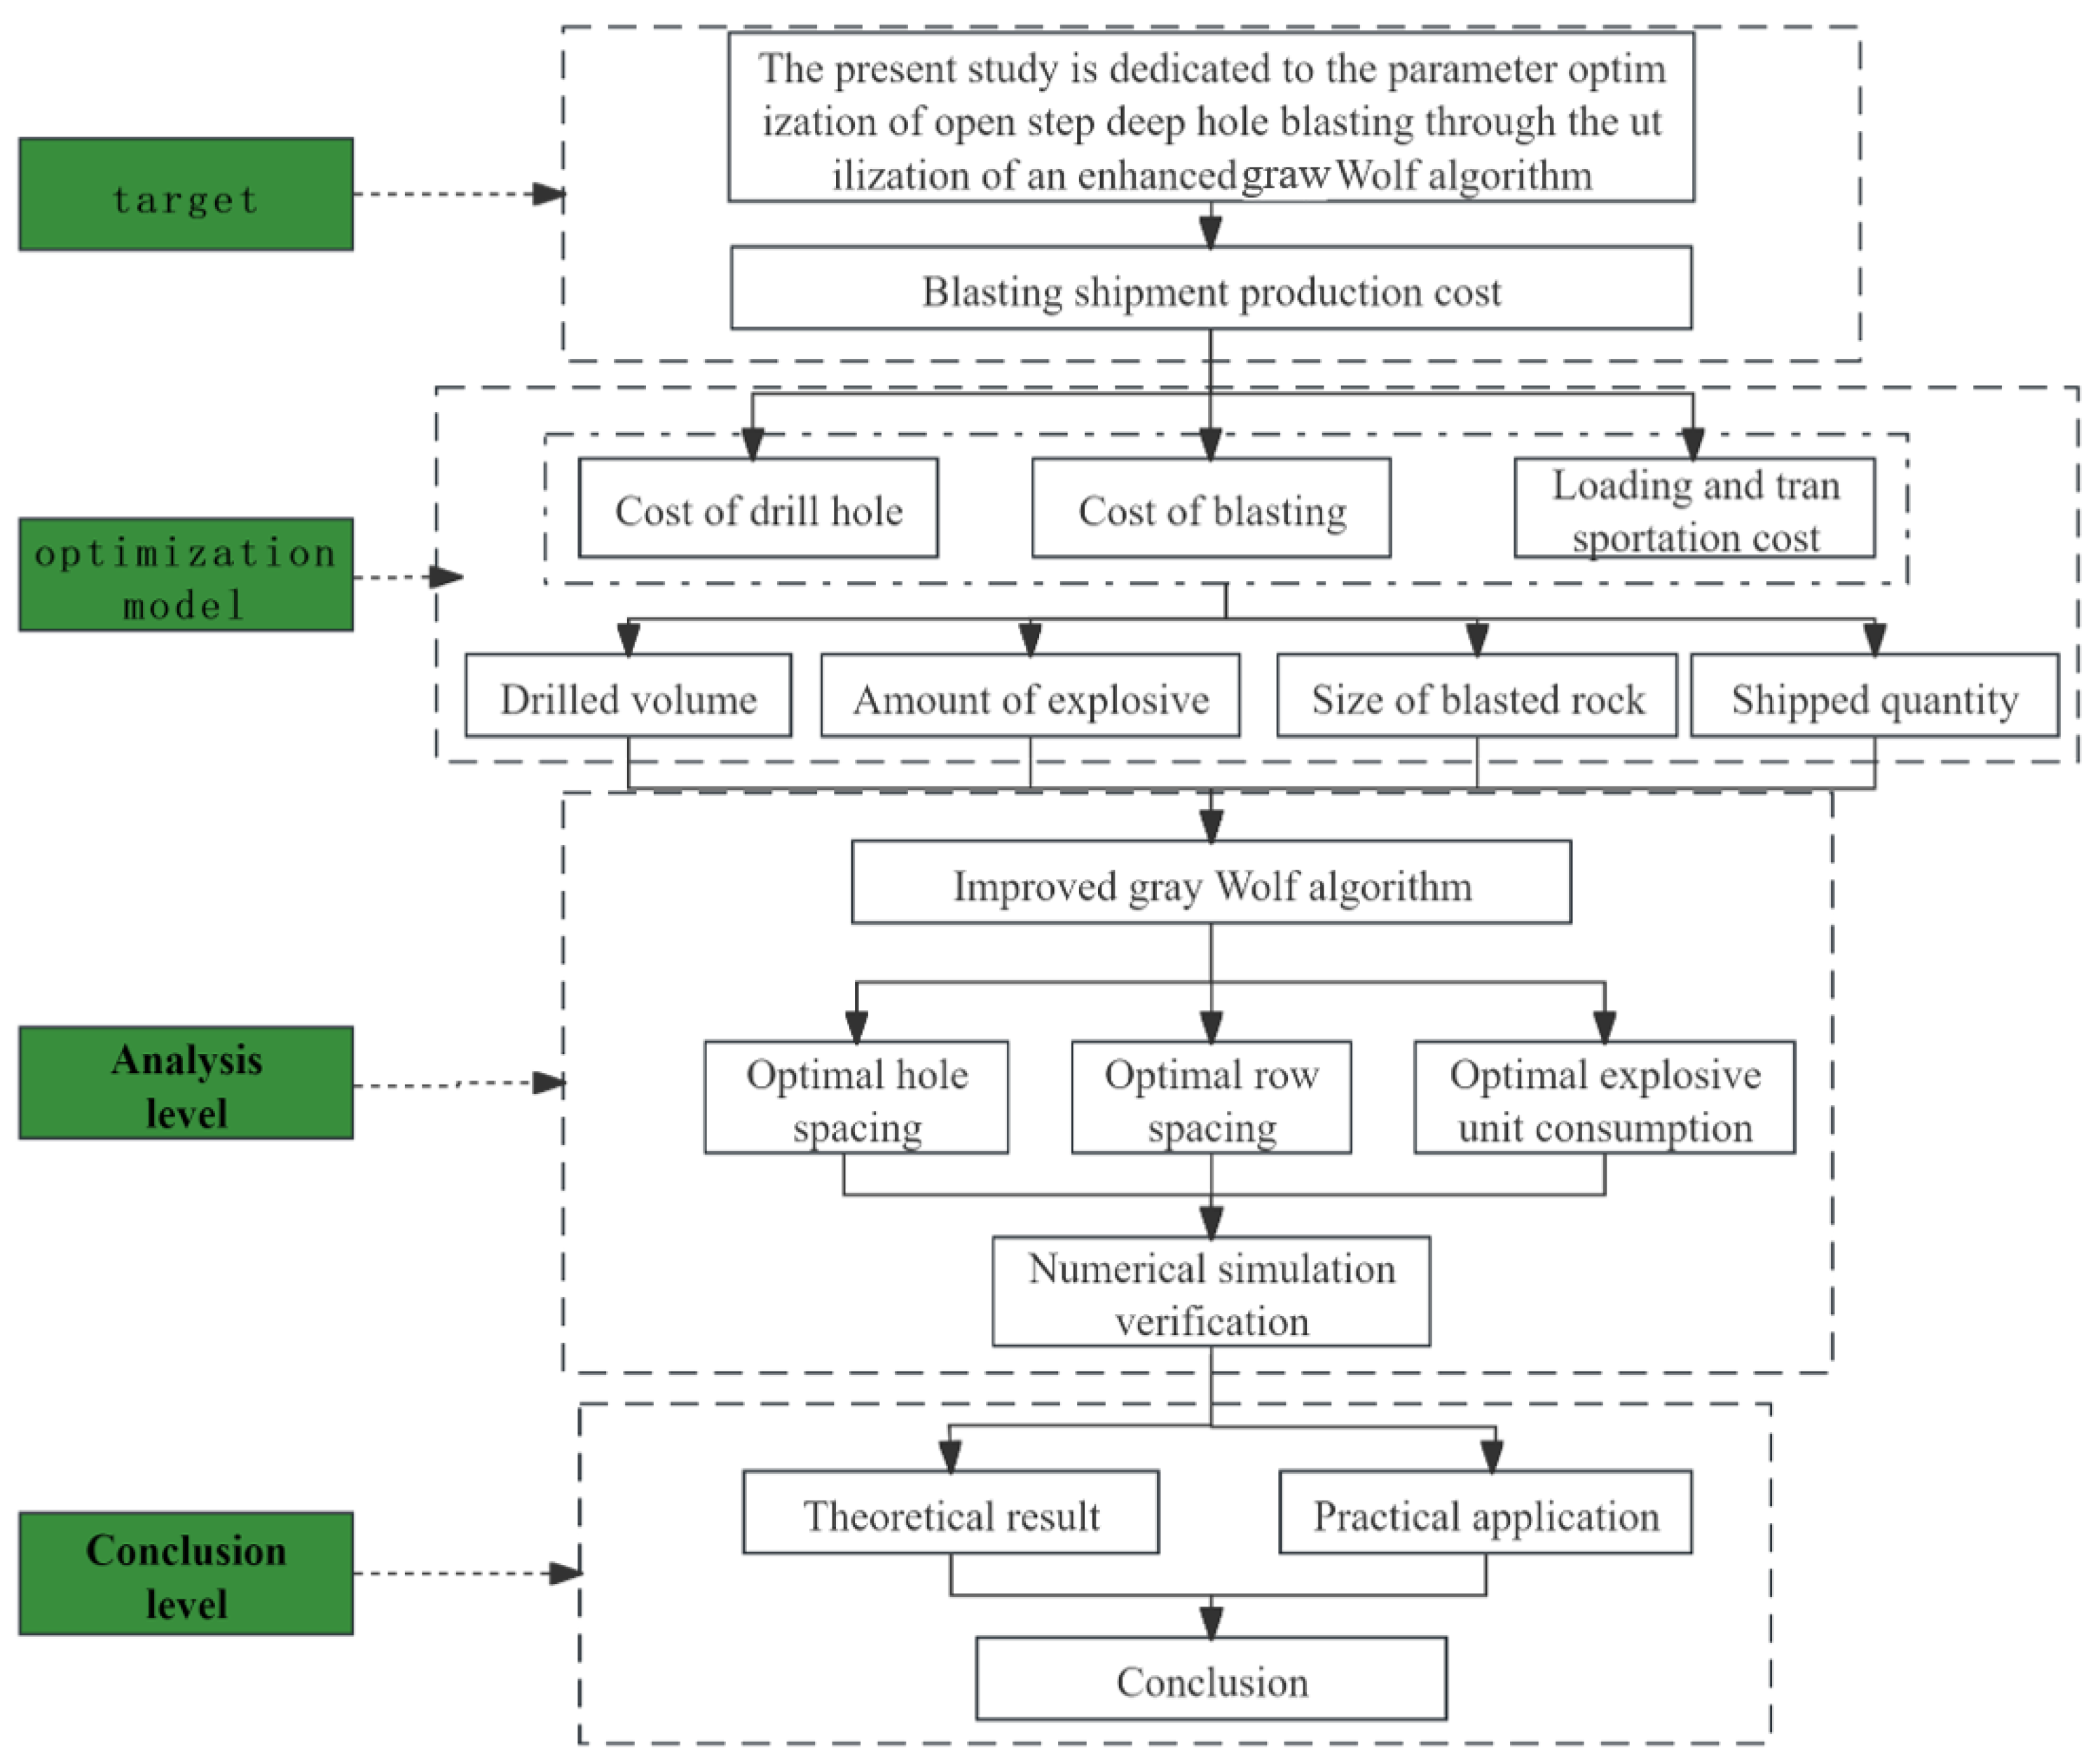
Figure 3.
Simulation of mobile foraging.
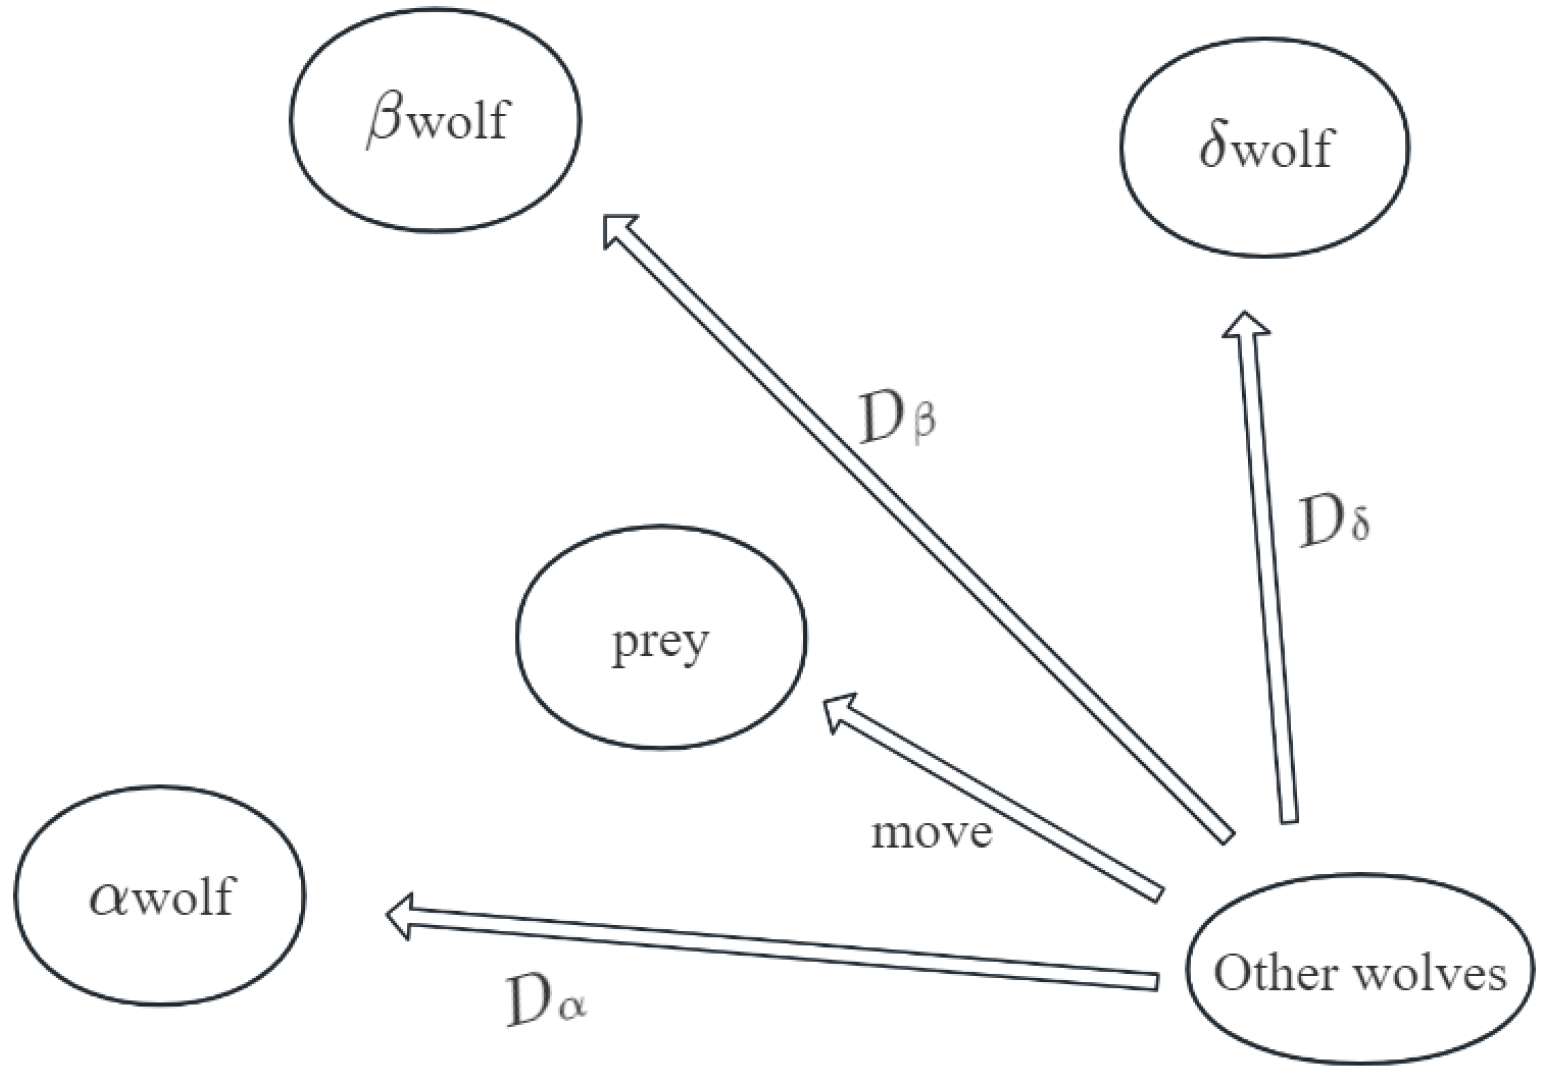
Figure 4.
The flow chart for improved Gray Wolf algorithm.
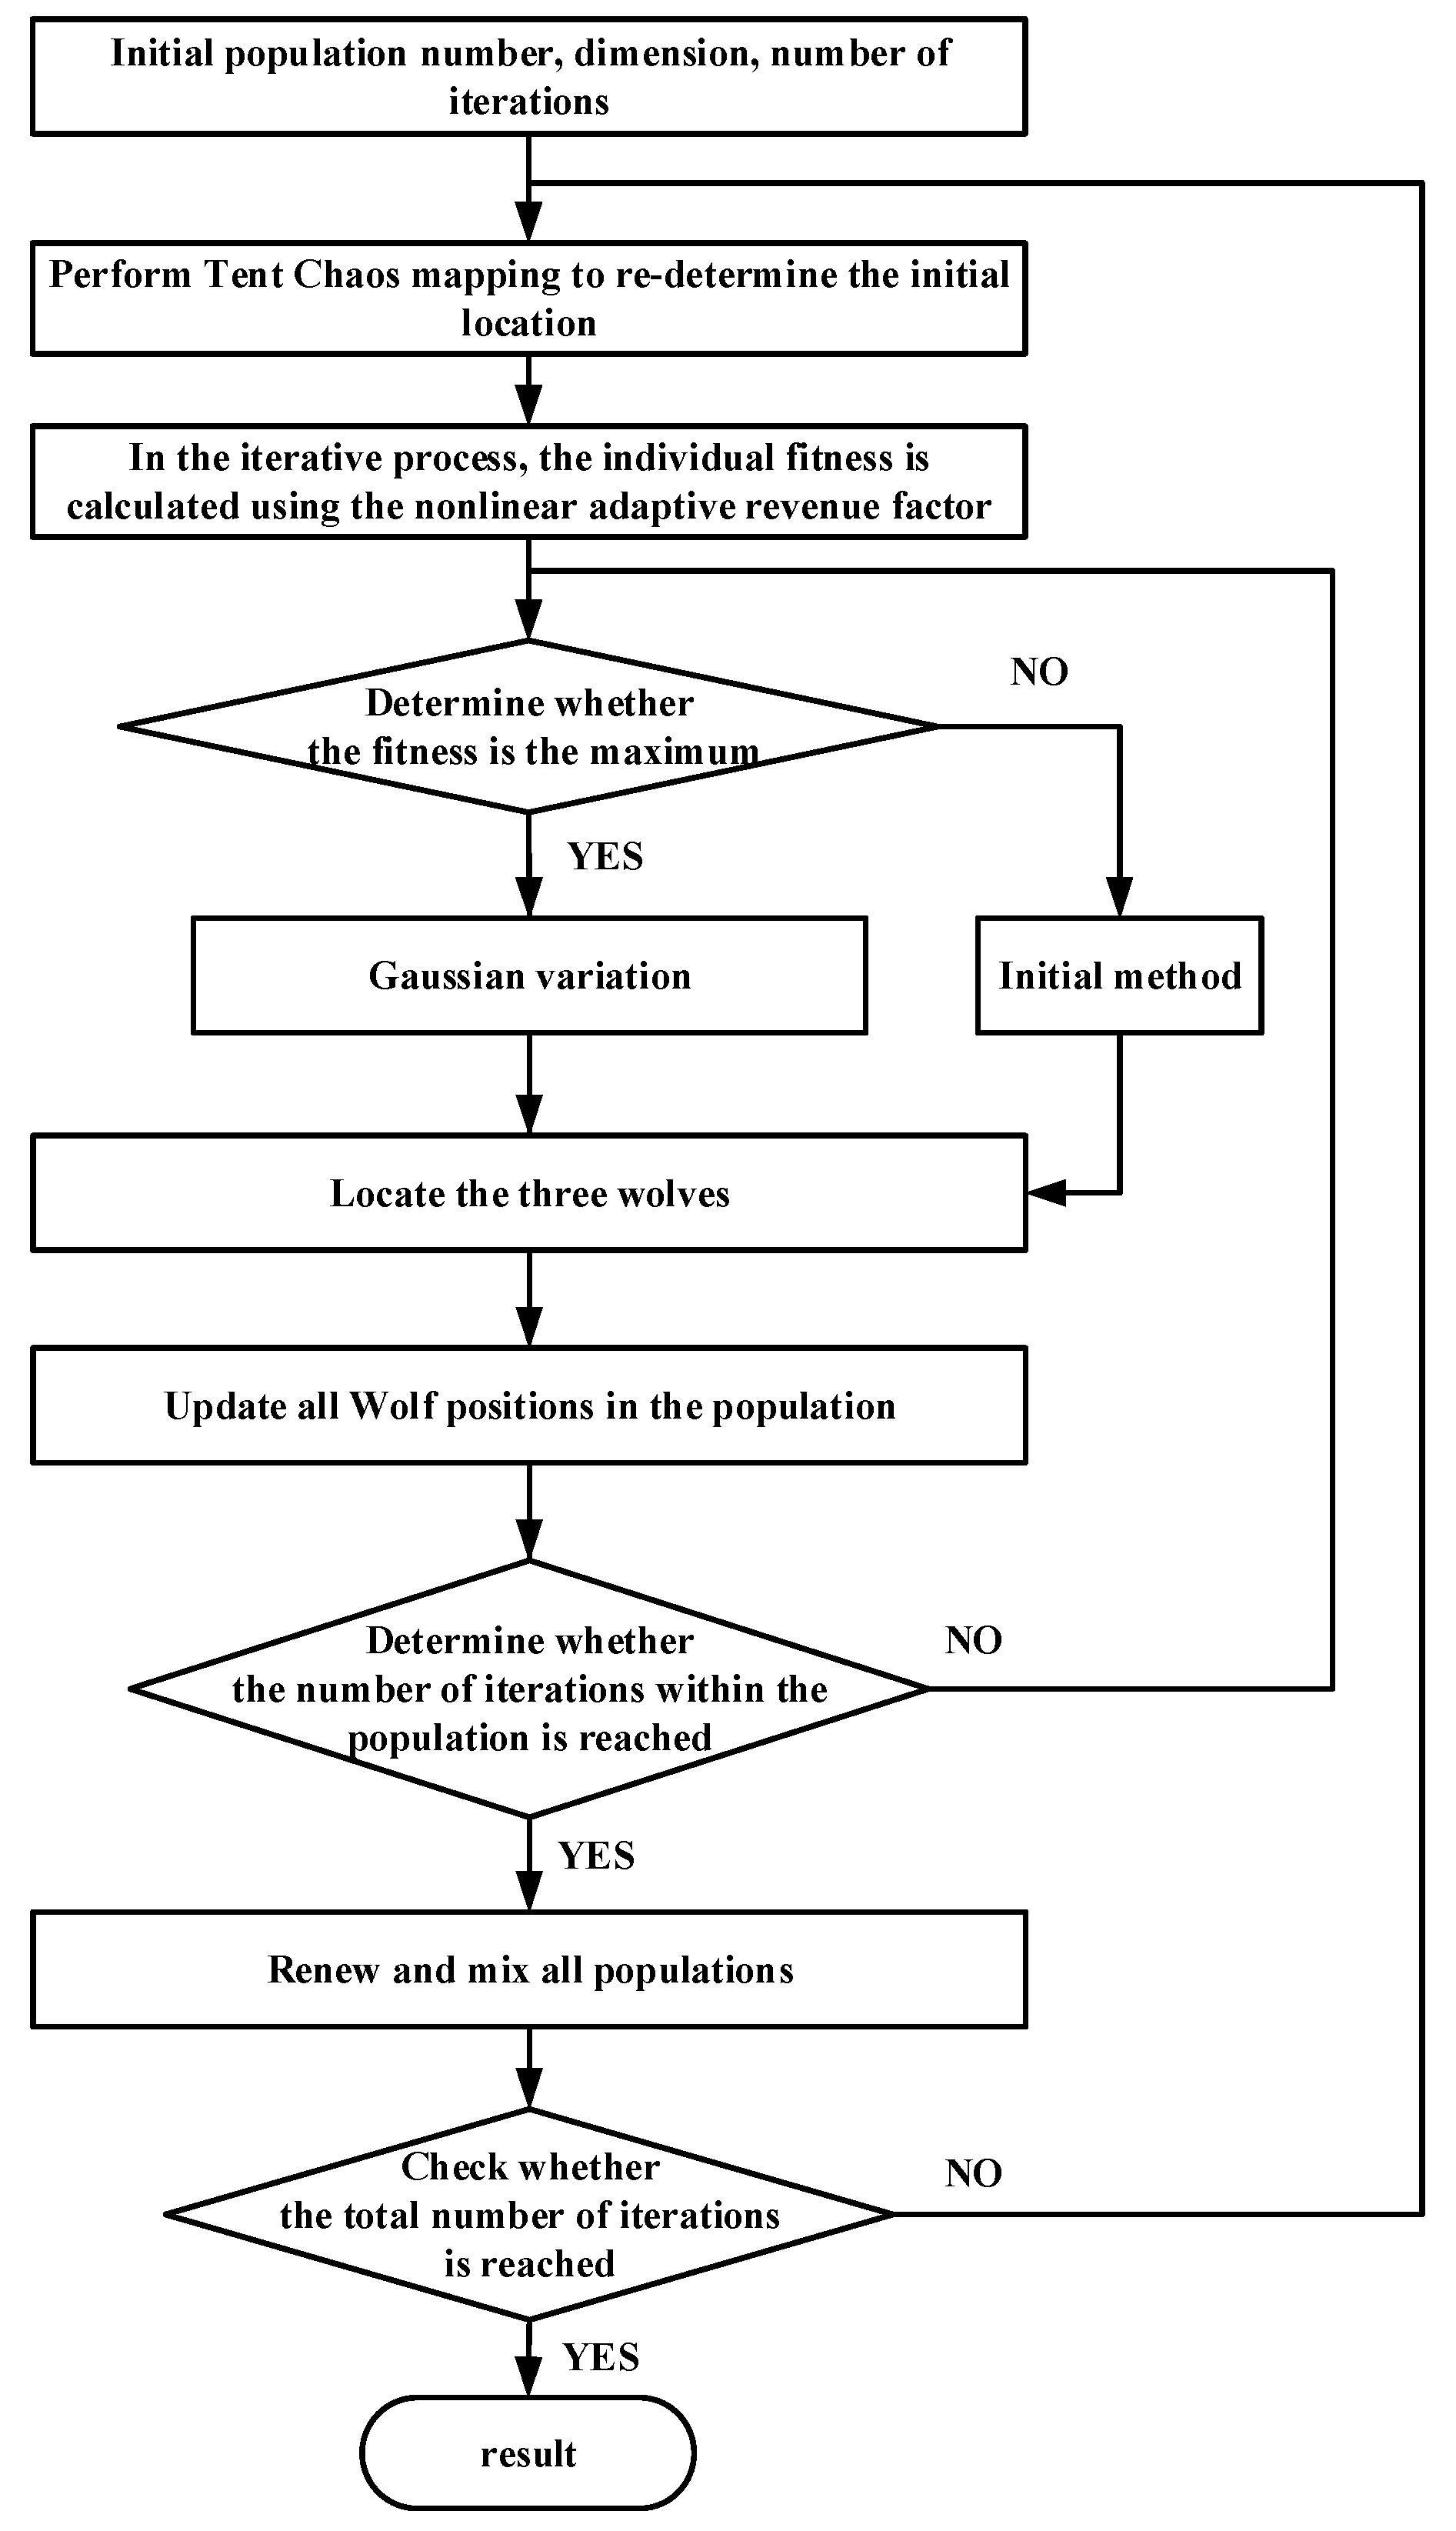
Figure 5.
The search trajectory of the Gray Wolf algorithm has been improved.

Figure 6.
Fitness step curve.
Figure 7.
The optimization algorithm determines the value of the optimal solution.
Figure 8.
Step element diagram.
Figure 9.
The network diagram for delay.
Figure 10.
The impact of slope step blasting following optimization.
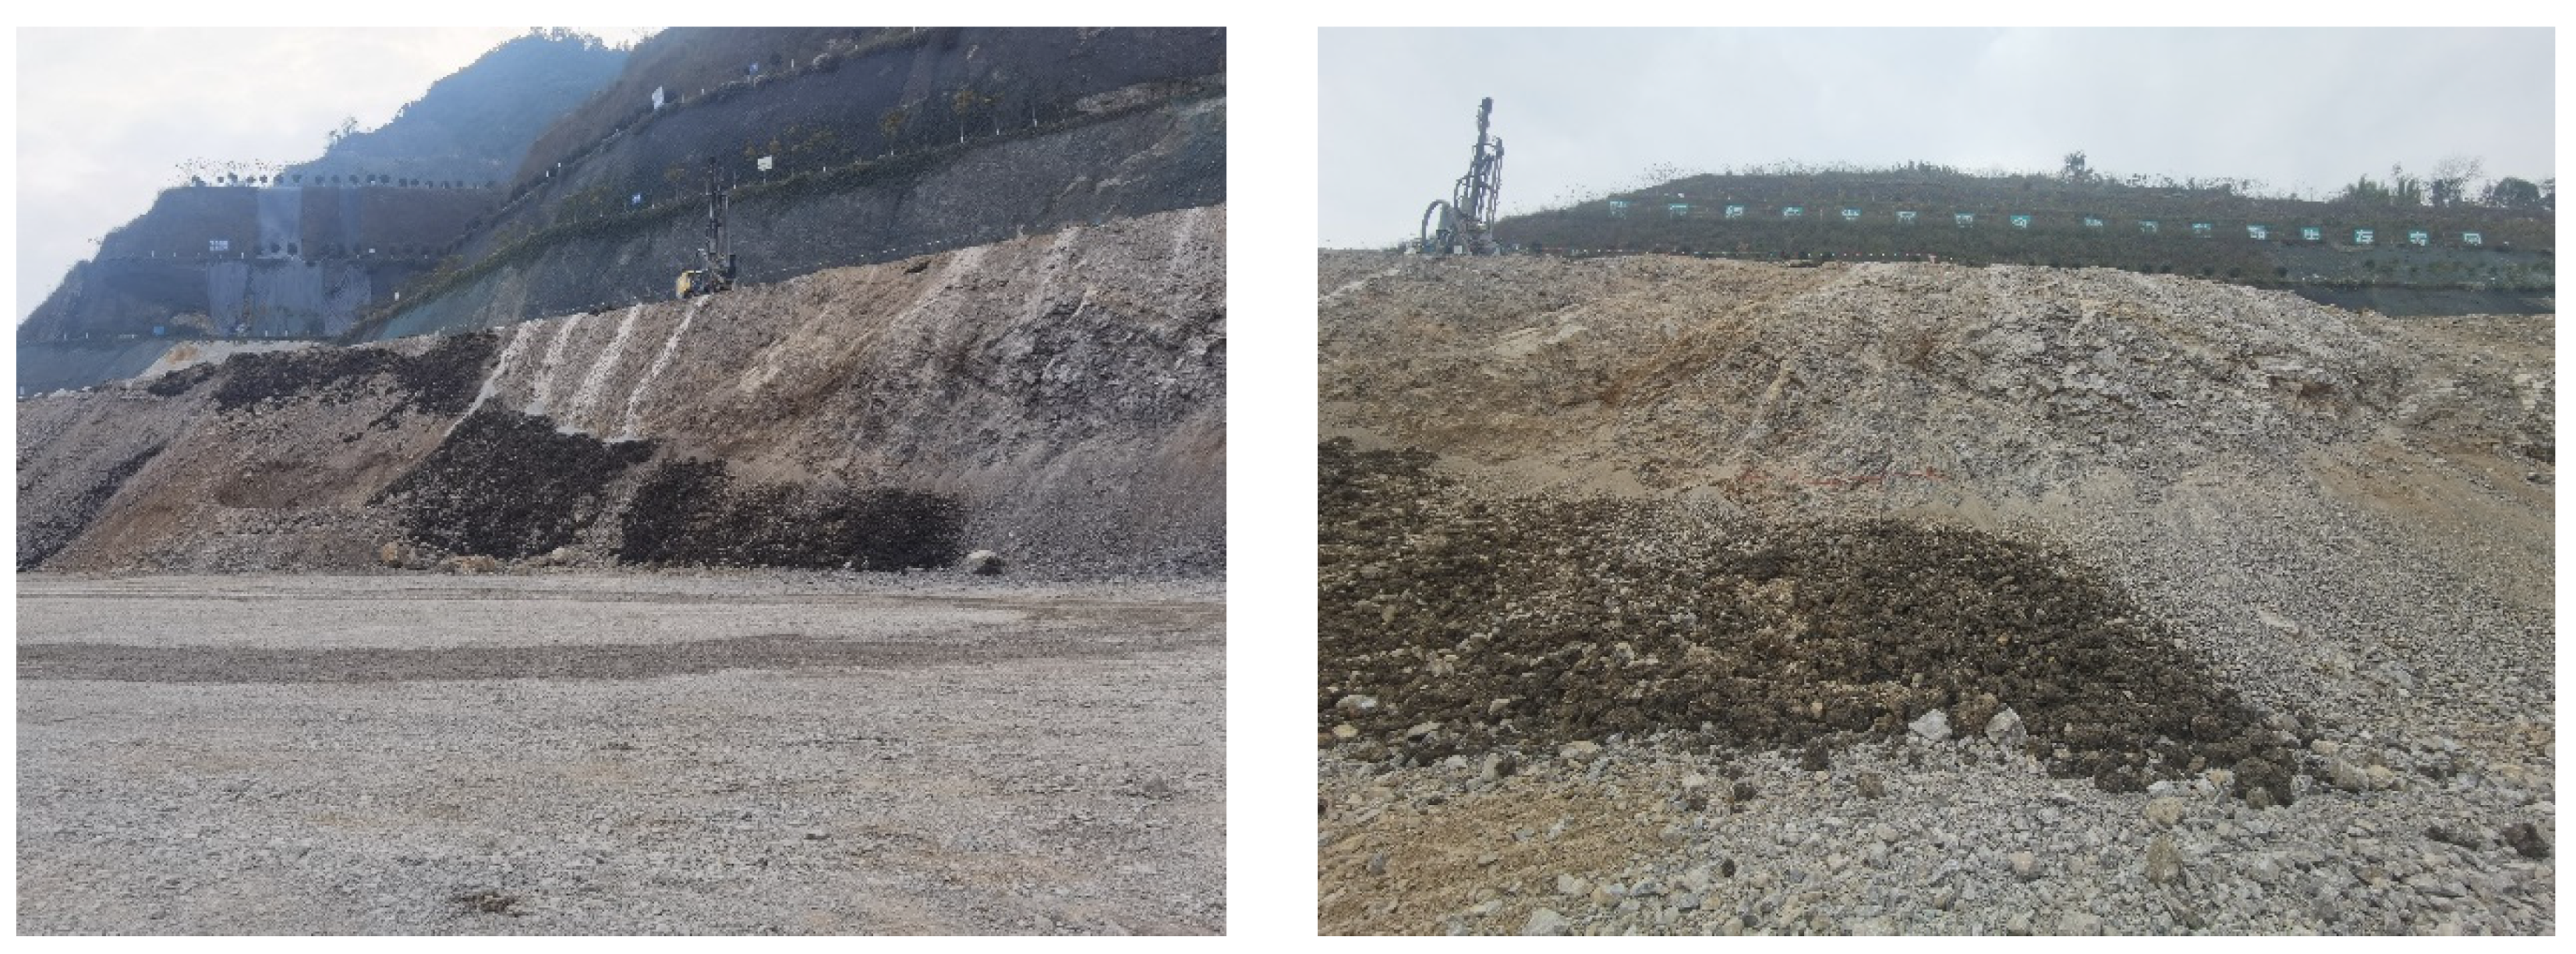
Figure 11.
The comparison is commonly solved using algorithms.
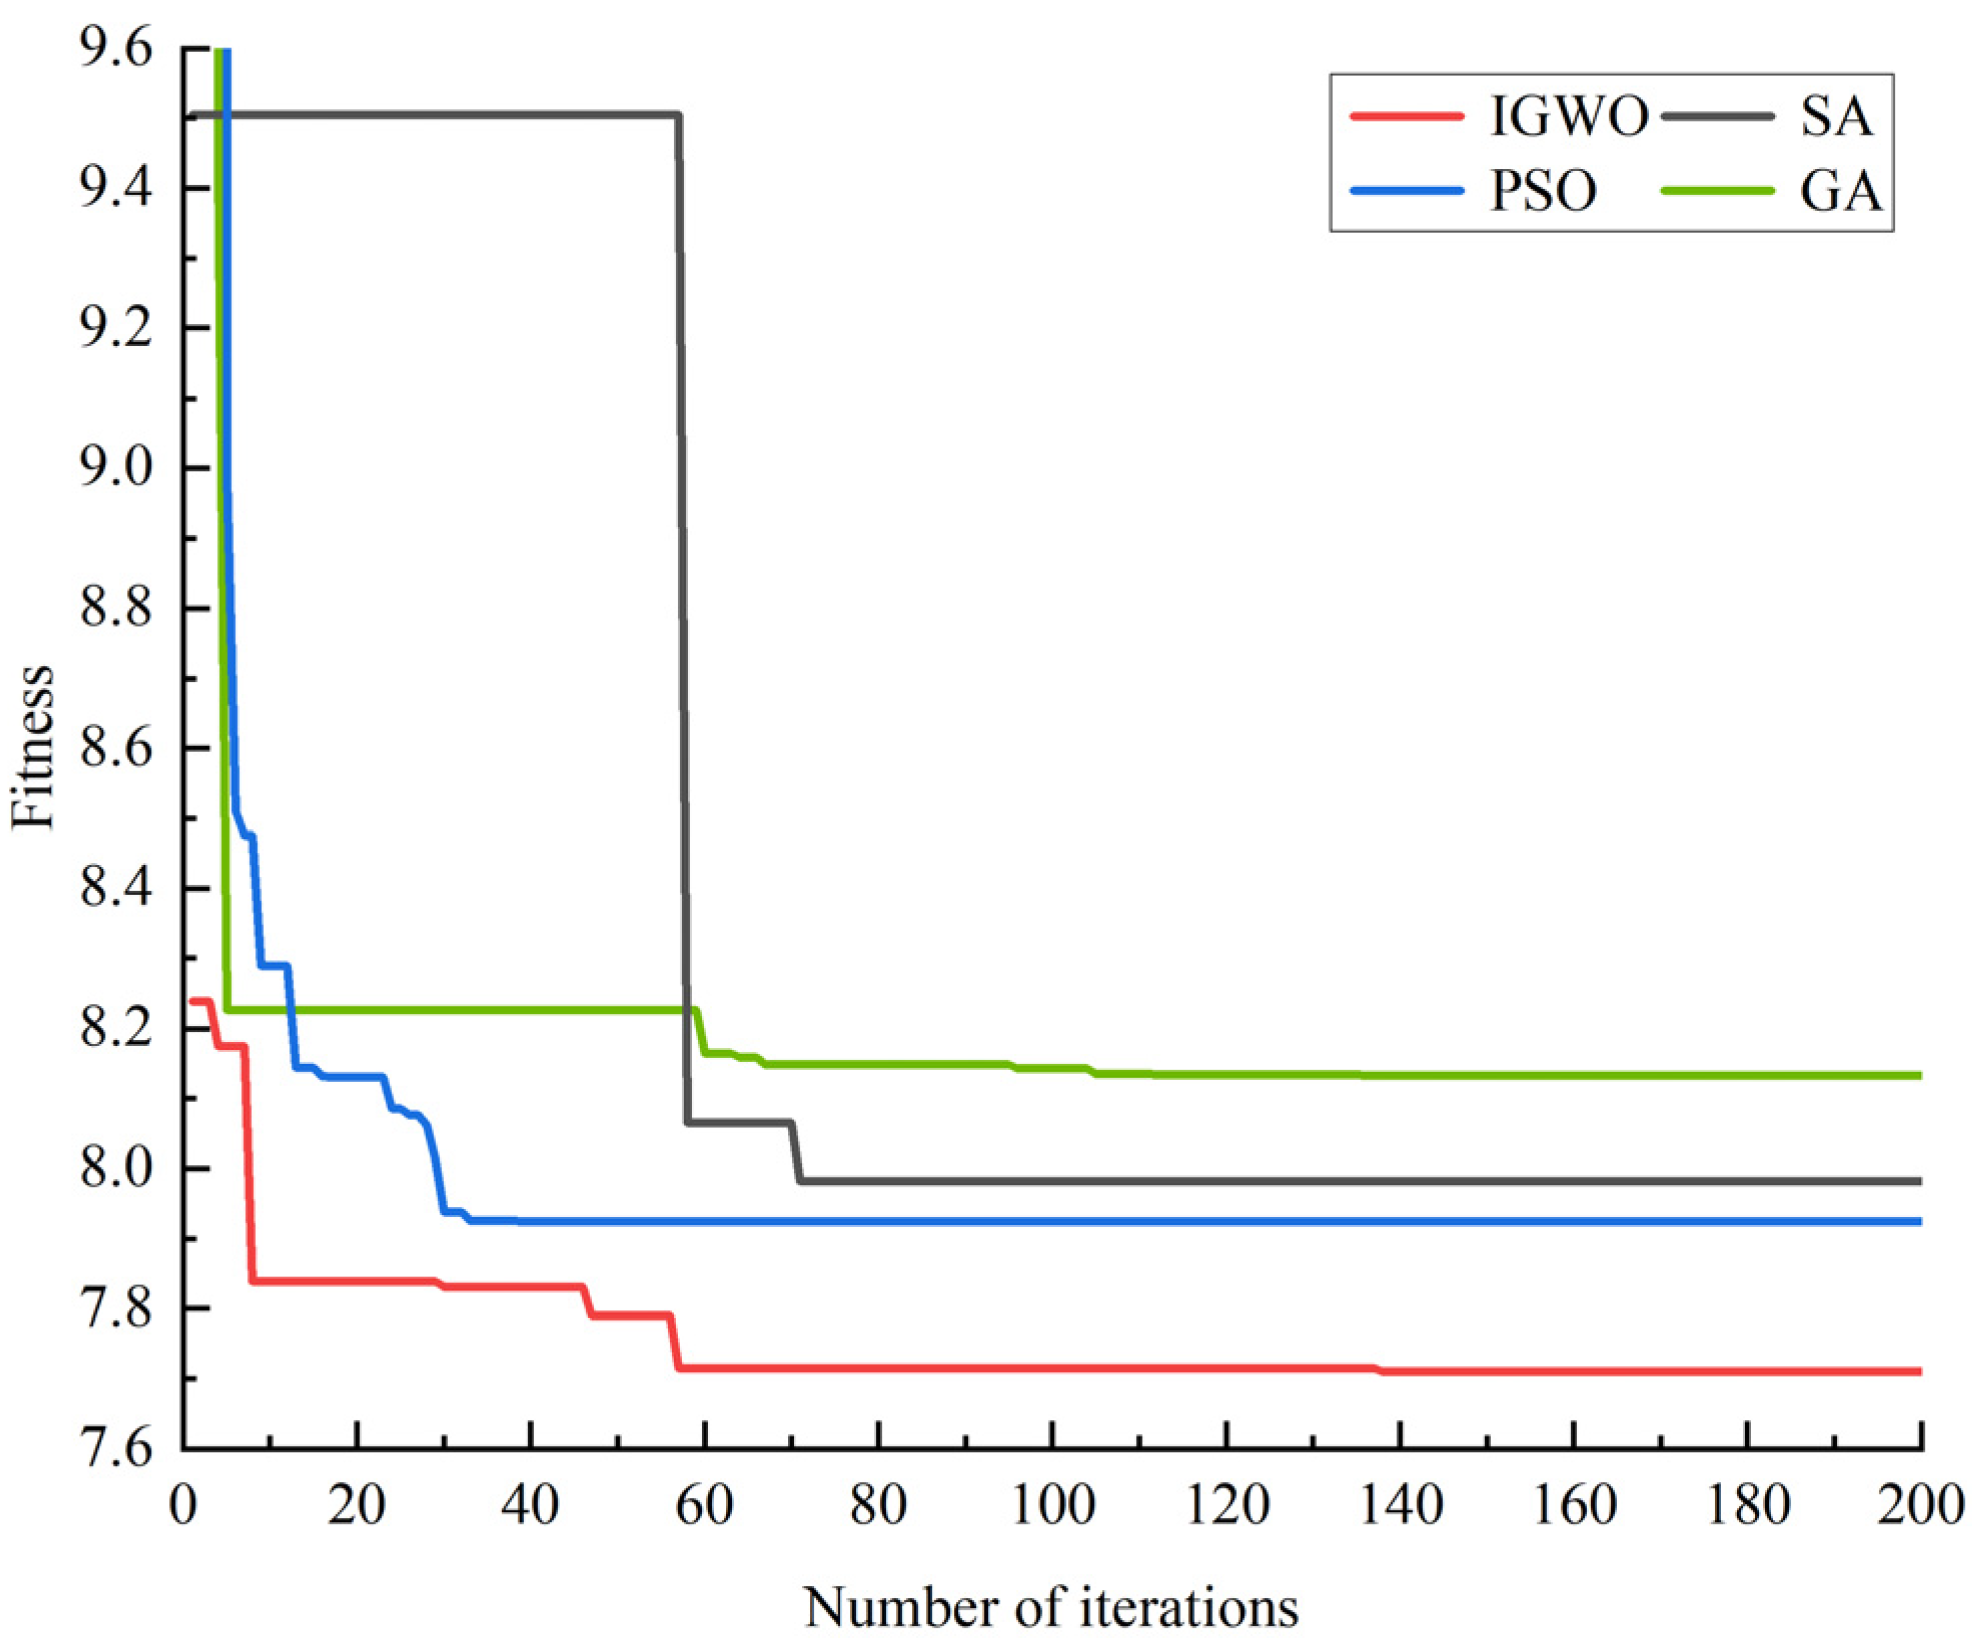
Figure 12.
The Rhino modeling software creates solid models.
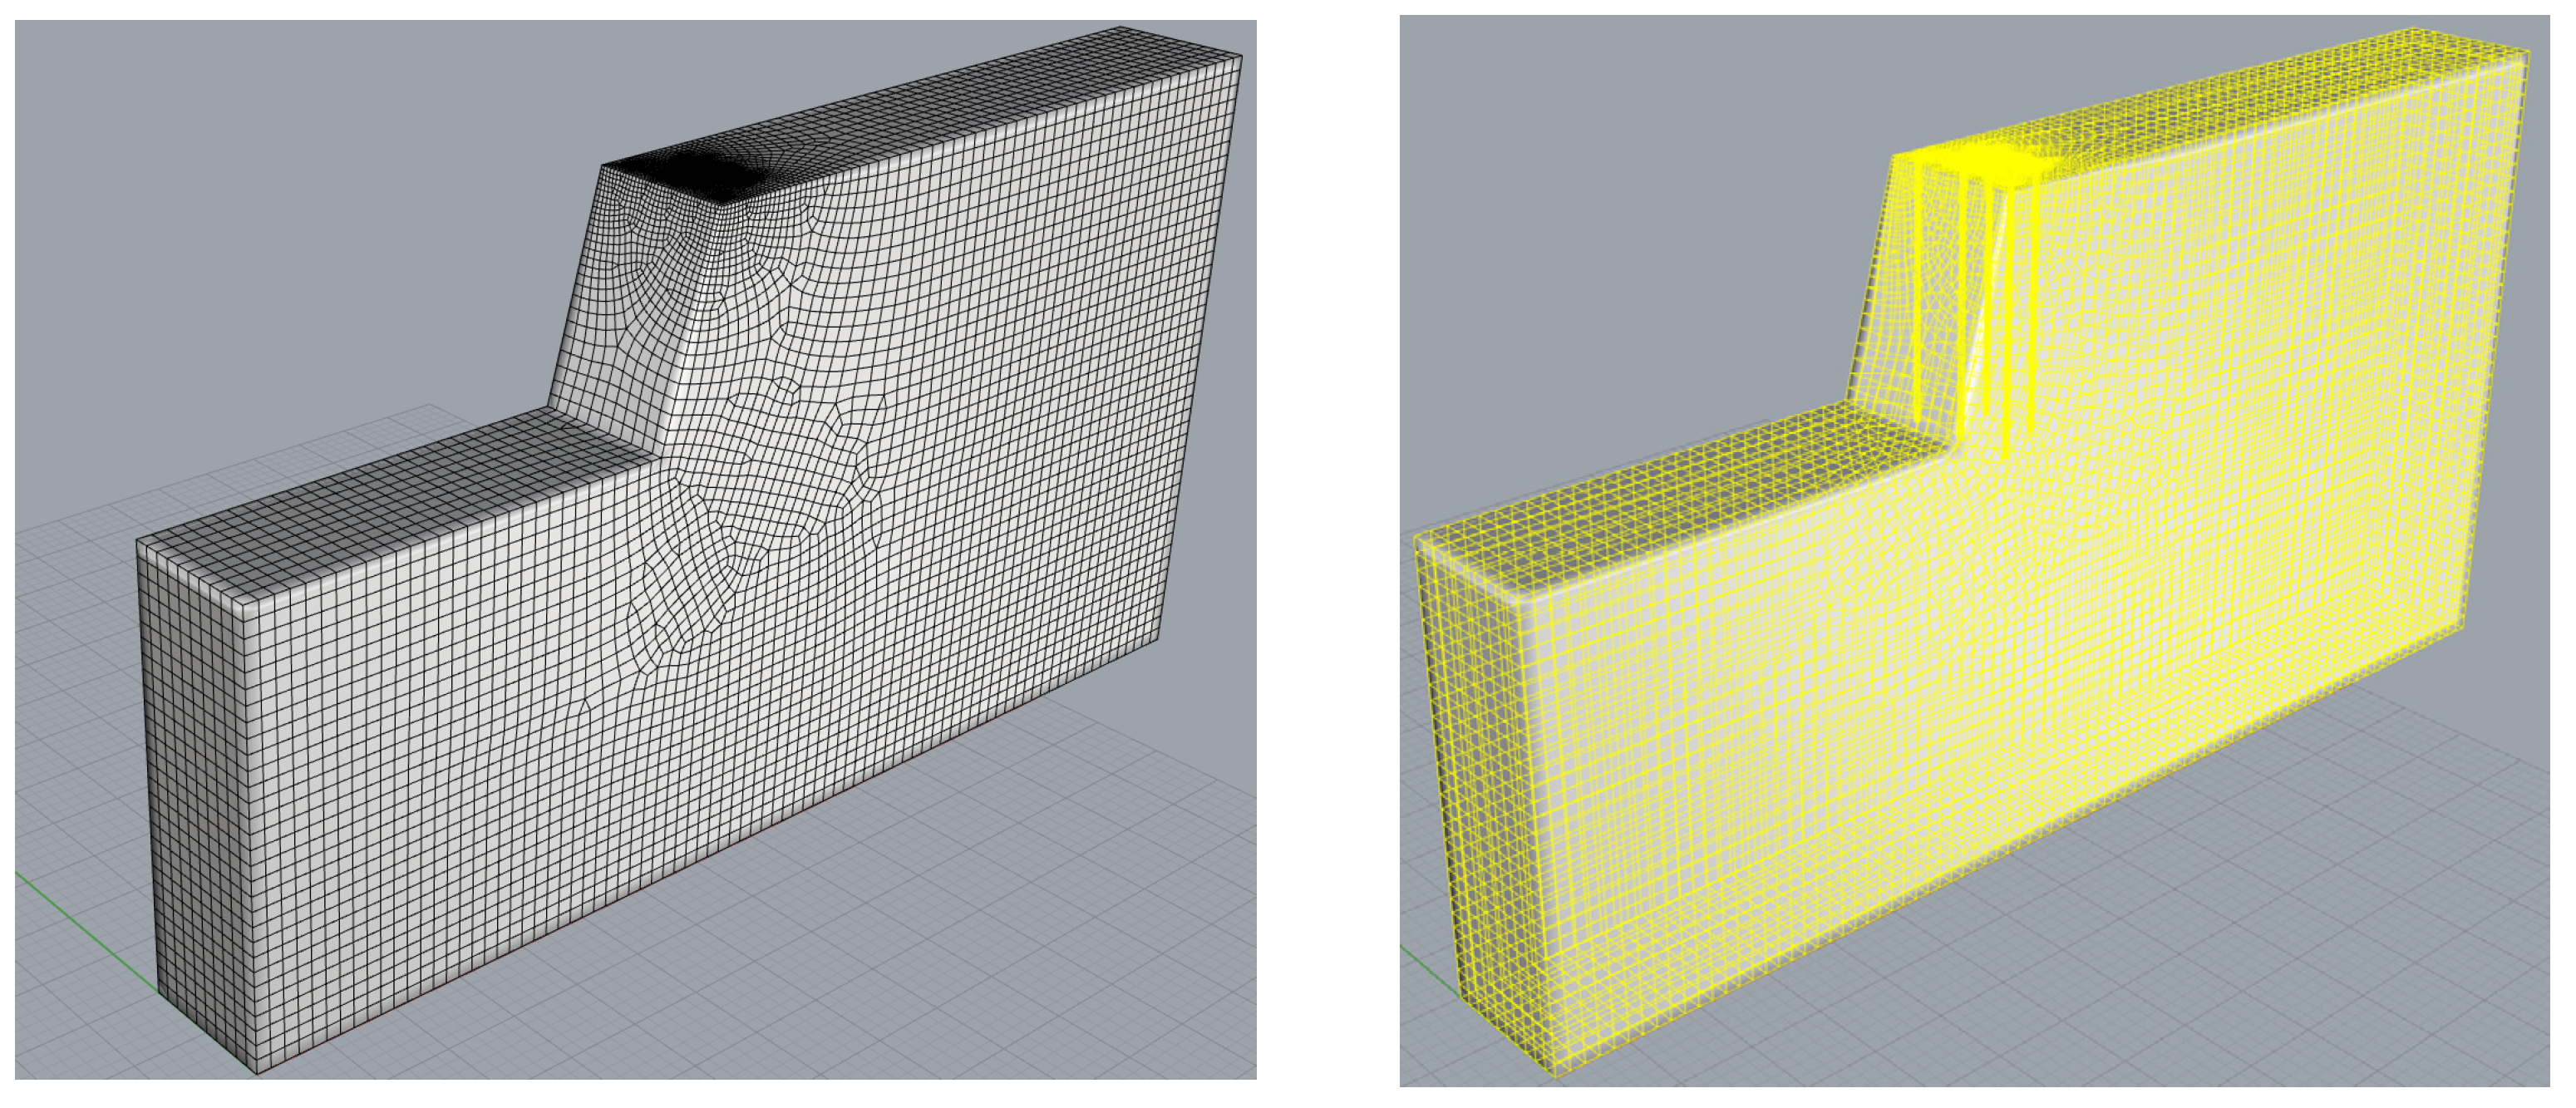
Figure 13.
Model blasting hole locations and applied boundary conditions.

Figure 14.
Model free-field boundaries and load application.

Figure 15.
Results of maximum principal stress distribution in groups (a–c).
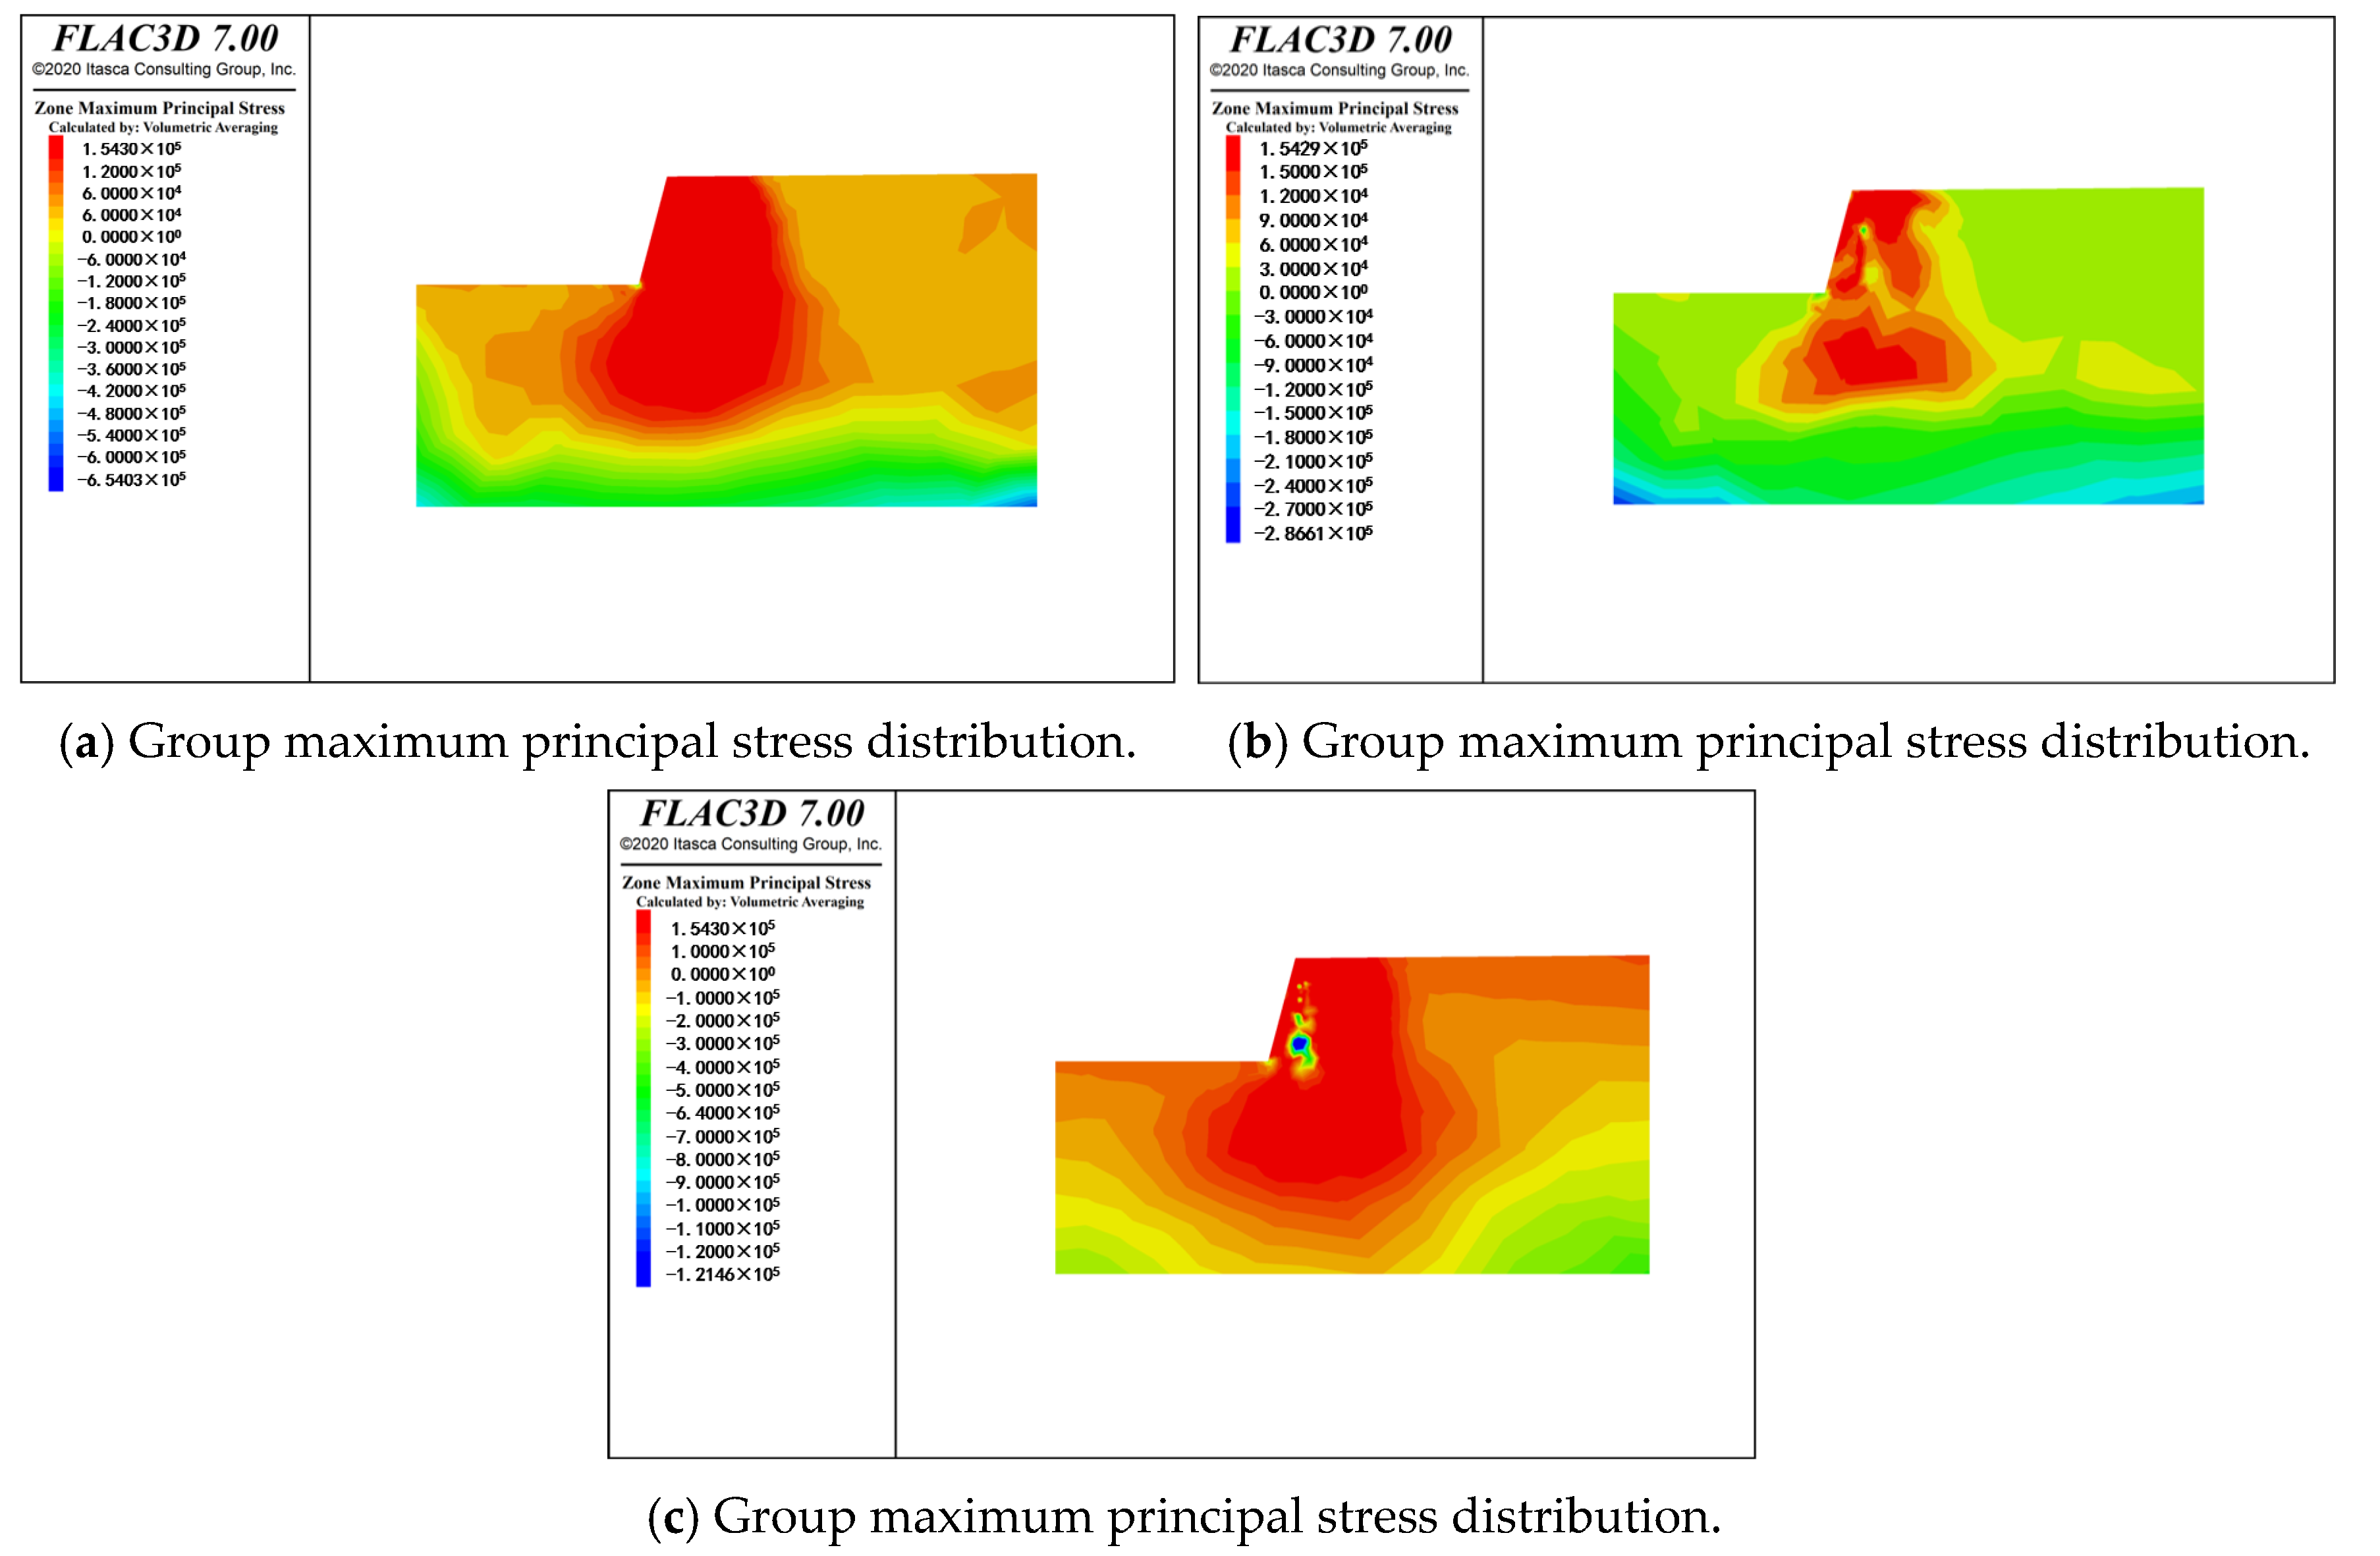
Figure 16.
Acceleration 30 m away from the upper edge of the slope step.

Figure 17.
Velocity at 30 m from the upper edge of the slope step.


Table 1.
Physical and mechanical parameters of rock.
| σcm (MPa) | σt (MPa) | c (MPa) | φ (°) | Erm (GPa) | μ | K (GPa) | G (GPa) |
|---|---|---|---|---|---|---|---|
| 7.5922 | 0.1543 | 1.0324 | 35.14 | 2.1520 | 0.22 | 1.2810 | 0.8820 |
Disclaimer/Publisher’s Note: The statements, opinions and data contained in all publications are solely those of the individual author(s) and contributor(s) and not of MDPI and/or the editor(s). MDPI and/or the editor(s) disclaim responsibility for any injury to people or property resulting from any ideas, methods, instructions or products referred to in the content. |
© 2024 by the authors. Licensee MDPI, Basel, Switzerland. This article is an open access article distributed under the terms and conditions of the Creative Commons Attribution (CC BY) license (https://creativecommons.org/licenses/by/4.0/).
Share and Cite
MDPI and ACS Style
Zhao, L.; Su, D.; Li, Z.; Chen, B.; Wang, R.; Chen, R. Research on Optimization of an Open-Bench Deep-Hole Blasting Parameter Using an Improved Gray Wolf Algorithm. Appl. Sci. 2024, 14, 3514. https://doi.org/10.3390/app14083514
AMA Style
Zhao L, Su D, Li Z, Chen B, Wang R, Chen R. Research on Optimization of an Open-Bench Deep-Hole Blasting Parameter Using an Improved Gray Wolf Algorithm. Applied Sciences. 2024; 14(8):3514. https://doi.org/10.3390/app14083514
Chicago/Turabian StyleZhao, Li, Dengfeng Su, Zhengguo Li, Banghong Chen, Rui Wang, and Rongkai Chen. 2024. "Research on Optimization of an Open-Bench Deep-Hole Blasting Parameter Using an Improved Gray Wolf Algorithm" Applied Sciences 14, no. 8: 3514. https://doi.org/10.3390/app14083514
Note that from the first issue of 2016, this journal uses article numbers instead of page numbers. See further details here.