
Experimental Study on Mechanical Properties of Highway Subgrade in Cold Regions under Different Conditions

1
School of Civil and Architectural Engineering, East China University of Technology, Nanchang 330013, China
2
College of Civil Engineering and Architecture, Dalian University, Dalian 116622, China
*
Author to whom correspondence should be addressed.
Appl. Sci. 2024, 14(9), 3547; https://doi.org/10.3390/app14093547
Submission received: 5 March 2024
/
Revised: 26 March 2024
/
Accepted: 18 April 2024
/
Published: 23 April 2024
Abstract
:In order to study the changes in the mechanical properties of road subgrade in cold areas after the freezing and thawing of highways in cold areas, indoor mechanical tests were carried out to investigate the effects of the number of freeze–thaw cycles, freezing temperature, water content, and circumferential pressure on the mechanical properties of road subgrade soil in cold areas after thawing. The mechanical properties of road subgrade soil in cold areas after thawing were measured under different conditions. The test results show that, within the study range: (1) After 7 freeze–thaw cycles, the destructive stress of the subgrade soil decreased from 321.7 kPa to 289.9 kPa, a decrease of 9.9%, and the elastic modulus decayed by 19.9%. (2) When the freezing temperature was reduced from −5 °C to −15 °C, the destructive stress of the subgrade soil decreased from 303.9 kPa to 290.1 kPa, a decrease of 13.8 kPa, approximately 4.5%, and the decrease in modulus of elasticity was about 1.6%. (3) The water content increased from 6% to 12%, and the destructive stress decreased from 405.43 kPa to 288.4 kPa, a decrease of 29.1%, and the modulus of elasticity decreased approximately linearly, with an attenuation of 50.4%. (4) The peripheral pressure increased from 50 kPa to 150 kPa, and the destructive stress increased from 194.7 kPa to 367.7 kPa, a growth of 88.8%, and its modulus of elasticity increased with the increase in peripheral pressure, an increase of 154.1%. The results of this research can provide a reference for highway and engineering construction in the western silt–soil distribution area.
1. Introduction
In recent years, infrastructure investment in western China has increased, and the construction of railway and road projects in cold regions has been increasing [1]. Currently, most of the cold regions in China are still dominated by railway construction. However, compared to railways, roads have a shorter construction period and a more flexible budget. Therefore, the future development potential of roads in cold regions should not be underestimated [2,3]. The rapid development of China’s transport infrastructure construction, the growth in demand for road transport, and the increasing number of passenger and freight vehicles, along with the continuous improvement of road design and construction standards, have placed strict requirements on the service level of the road system [4,5,6].
As the main stress-bearing part of the road, the strength, stiffness, and long-term stability of the roadbed will directly affect the road’s performance and service life. Under traffic load, the roadbed soil is directly subjected to large weekly cyclic shear action transferred from the upper layers. As a result, the roadbed strength continues to deteriorate and permanent deformation continues to accumulate. This leads to the pavement structure being very prone to folding, cracking, and various other issues, which seriously affect the safety, comfort, and durability of the highway [6,7]. Roadbeds in cold regions are even more susceptible to damage of road pavements due to cyclic temperature changes during the freezing and thawing process [8,9].As shown in Table 1, scholars around the world have studied the mechanical properties and deformation mechanism of railway roadbeds in cold regions, and have made certain academic achievements [10,11,12].
However, there have been fewer studies on roadbeds in cold regions, especially regarding the mechanics and deformation mechanism of thawed soil after freeze–thaw cycles. The current research mainly focuses on the thermal insulation properties of roadbeds [19], changes in moisture content [20,21], vehicle loading [22,23], improvement treatments [24,25,26], and the effects of multi-field coupling [27].
Therefore, this paper aims to conduct indoor mechanical tests to measure the mechanical property laws of thawed soil in the roadbed of cold regions under different conditions. The research object includes seven different freeze–thaw cycles (0, 1, 3, 5, 7), three freezing temperatures (−5 °C, −10 °C, −15 °C), four water contents (6%, 8%, 10%, 12%), and three peripheral pressures (50 kPa, 100 kPa, 150 kPa) of the thawed soil. Triaxial shear tests were conducted on the soil samples. By analyzing the test results, the changes in the mechanical properties of the thawed soil in the roadbed under different conditions were determined. This provides a valuable reference for the study of mechanical properties of thawed soil in roadbeds in cold regions, and offers guidance for the design and construction of highways in cold regions.
2. Test Description
Test equipment. The triaxial test system used in this test is produced by MTS company in Eden City, NC, USA, which mainly consists of the Landmark 370.25 triaxial testing machine, peripheral pressure control system, automatic data acquisition system, and other parts, as shown in Figure 1. The main technical specifications of the equipment are as follows: maximum axial force of 250 kN, maximum axial displacement of ±88 mm, frequency range of 0–20 Hz, temperature range of −40 °C to +60 °C (with an error of ±0.1 °C), and measurement accuracy of ±0.01–0.03. It automatically collects data such as axial load, axial displacement, peripheral pressure, and time, and the measured data are accurate.
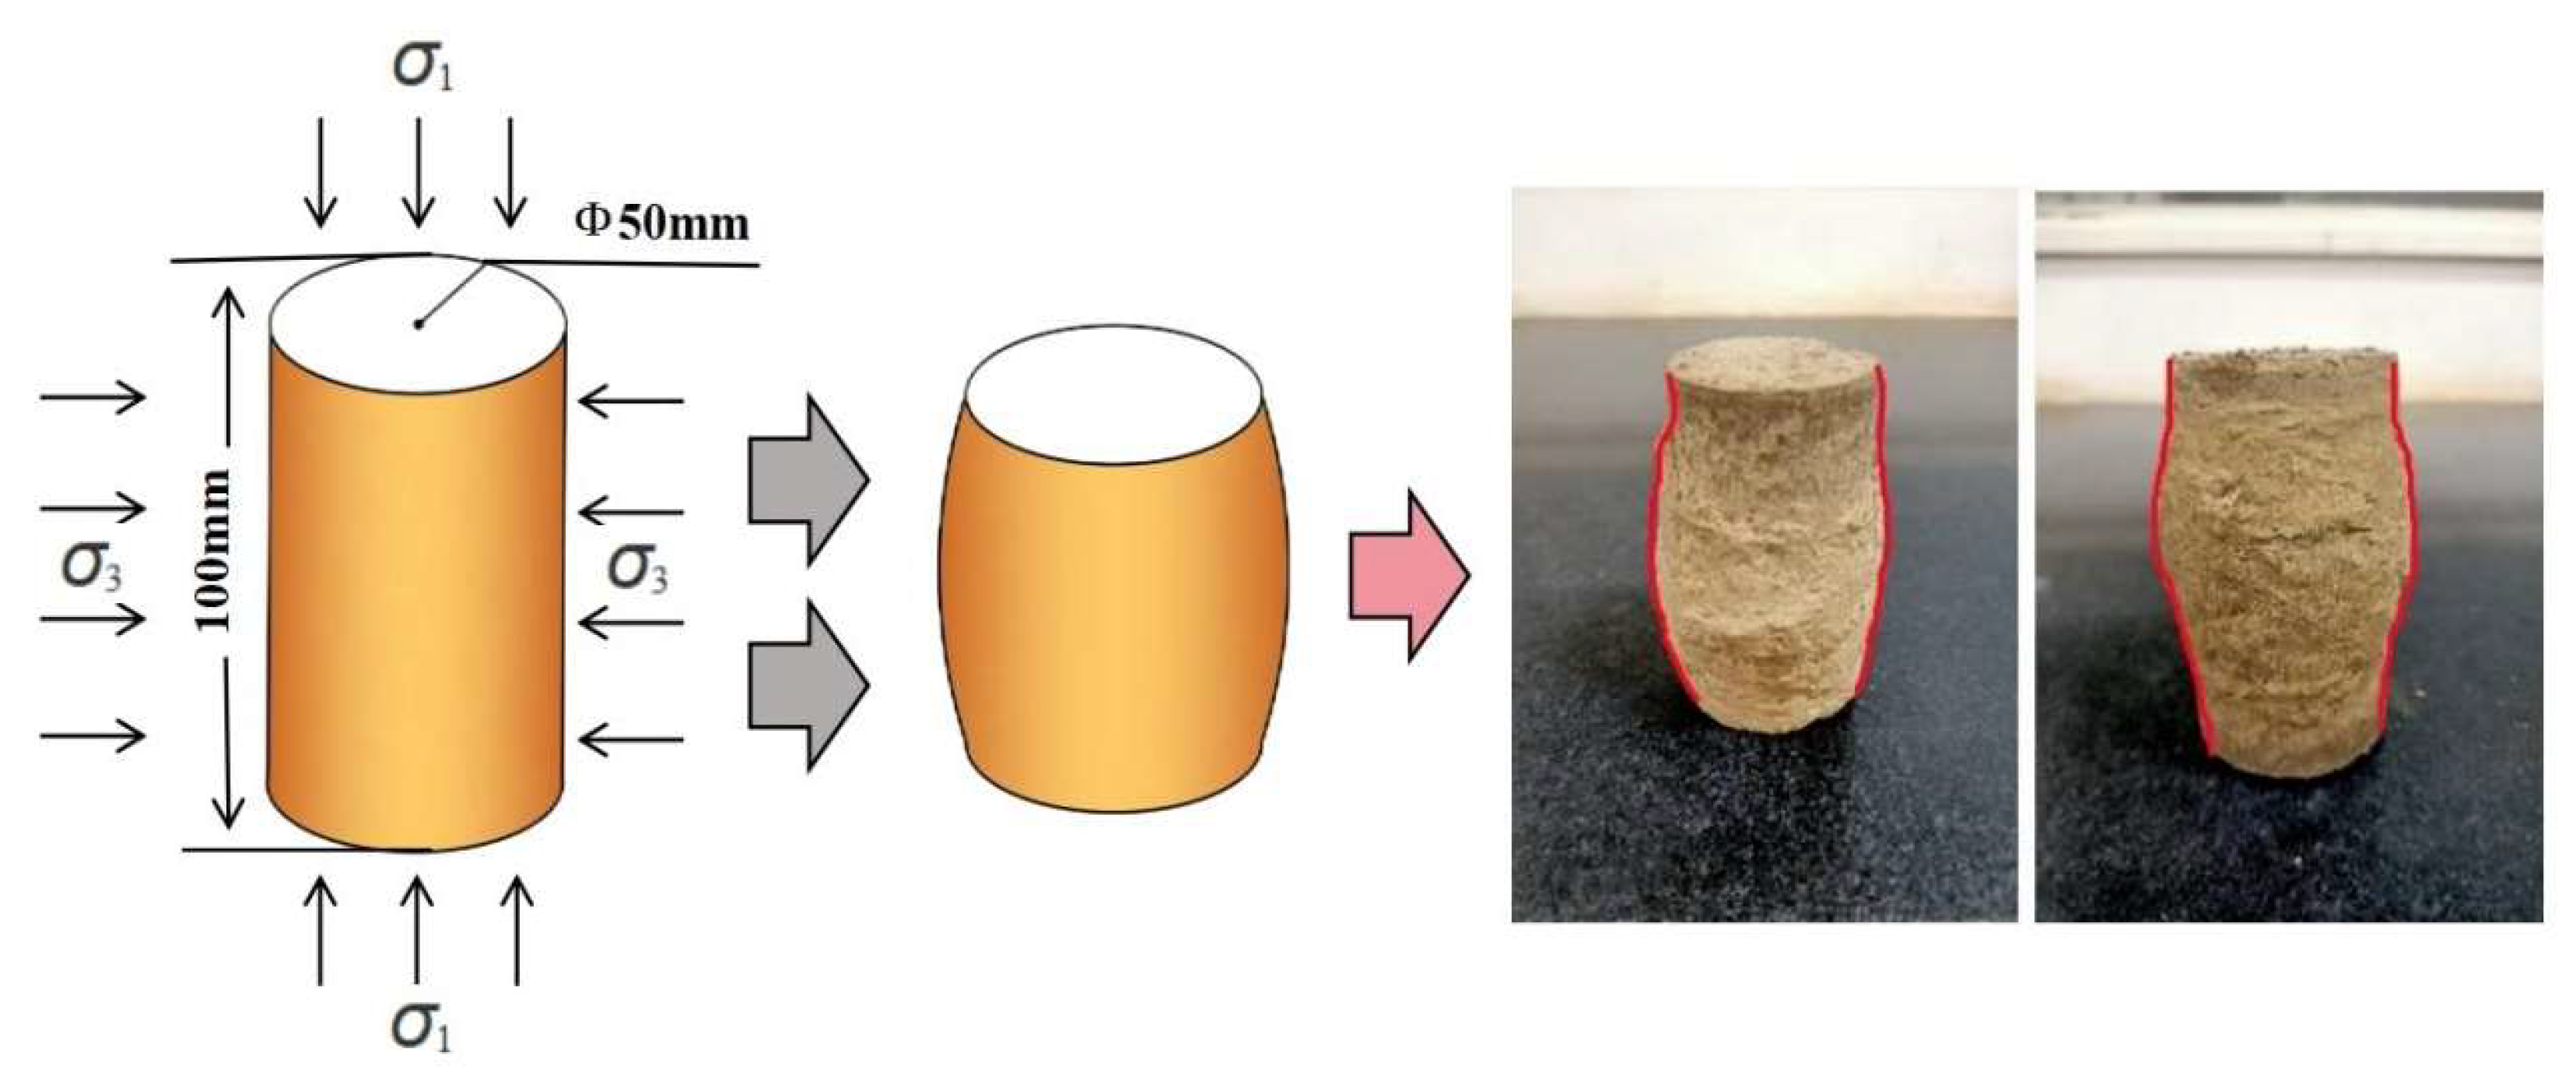
Test method. The test soil was taken from a highway foundation in the Northwest China region. Its particle grading is shown in Figure 2, and the basic parameters are shown in Table 2. According to the results of the compaction test, the saturated water content of the specimen was 13.2%. In order to reflect that the soil is in an unsaturated state in engineering practice in Northwest China, the optimal water content was taken as the middle value. It floated up and down, and the final setting of the water content of remolded soil was 6%, 8%, 10%, and 12%. The dry density was taken as 1.9296 g/cm3 according to 96% compaction. By using a special sample preparation instrument, the density of the sample can be controlled. The sample preparation instrument is composed of a hydraulic jack and a three-axis mold. The size of the three-axis mold is Ø50 mm × 100 mm. The density of the sample can be controlled by weighing the soil with the corresponding weight. The perimeter pressure was selected as 50 kPa, 100 kPa, and 150 kPa, according to the common horizontal stress range of the roadbed. In order to study the effect of the number of freeze–thaw cycles, 0, 1, 3, 5, and 7 freeze–thaw cycles, and three freezing temperatures of −5 °C, −10 °C, and −15 °C were set. The freezing and thawing process was carried out in a cycle of 48h. Firstly, freezing at freezing temperature conditions for 24 h, and then thawing at room temperature conditions (20 °C) for 24 h. The test program is shown in Table 3.
The specific test steps are as follows:
- (1)
- Sieving: According to the specifications, the test specimen diameter should be 50 mm, and the maximum allowable particle size should be 5 mm. Therefore, the rejection method (sieving) was used to remove particles that exceed the size limit. The wet soil was mixed well and placed into a plastic bag, sealed, moisturized, and left undisturbed for about 24 h.
- (2)
- Sample making: The prepared wet soil was placed into the sample making mold in three layers. Using the static pressure sample maker, it was pressed into a cylindrical specimen with a diameter of 50 mm and a height of 100 mm. The upper surface was shaved after each layer was pressed.
- (3)
- Demolding: The specimen was wrapped with a thin layer of cling film and placed into a plexiglass cylinder. It was then wrapped with cling film again and marked to prevent moisture loss. It was put into a constant temperature environment box and quickly frozen at −30 °C for 4 h to prevent water migration in the soil.
- (4)
- Conservation: The frozen specimens were removed for demolding. They were then re-wrapped with cling film and placed in the molds for curing. The molds were sealed well and placed in a constant temperature environment box for freeze–thaw cycles. After the freeze–thaw cycle, the specimens were further cured at room temperature (20 °C) for 24 h to shape them. Three parallel specimens were prepared for each test condition.
Data processing. The calculation formula of axial strain ε1 is:
where ∆h is axial deformation, mm; h0 is the height of the sample, mm.
During the test, the sample will produce transverse deformation and the cross-sectional area will change. Therefore, the average method is adopted for the sample area when processing the data, that is, the cross-sectional area of the sample is approximately replaced by the corrected cross-sectional area of the equal volume cylinder. The correction formula of the corrected cross-sectional area Aa of the specimen is as follows:
where Ac is the cross-sectional area of the sample before the test, mm2; V0 is the volume of the sample before the test, mm3; and ∆V is the volume change in mm3.
The axial deviatoric stress (σ1 − σ3) is calculated according to the corrected area, and the calculation formula is:
where F is the axial pressure, N.
Duncan-Chang constitutive model is used to fit the stress–strain relationship of triaxial shear test by hyperbola, that is:
where a and b are test parameters. For the conventional triaxial shear test, ε1/(σ1 − σ3) is approximately linear with ε1, and Equation (5) can be expressed as:
Because dσ2 = dσ3 = 0 in the conventional triaxial shear test, the tangent modulus Et can be reduced to:
When ε1 = 0, the initial tangent modulus Ei is Et, then:
If ε1 → ∞, then the limit deviatoric stress (σ1 − σ3)ult is:
In fact, the axial strain ε1 is not infinite. In this paper, the peak deviatoric stress (σ1 − σ3)f of the specimen is determined according to ε1 reaching 15%, so there is (σ1 − σ3)f < (σ1 − σ3)ult, and the failure ratio Rf can be defined as:
Thus, Et can be expressed as a function of stress.
3. Experiment Results and Analysis
3.1. Changes in the Appearance of the Sample after Loading
The shape changes of the specimens after loading were relatively similar, and representative specimens were selected, as shown in Figure 3. Analyzing the appearance of the specimens, it can be seen that when the strain was loaded up to 15%, the smoothness of the side walls of the specimens deteriorated, and the middle part of the side walls became concave and convex. The middle and lower parts of the specimen bulged obviously, with the largest transverse deformation in the middle, and smaller transverse deformation at the top and bottom. The specimen as a whole took on a bulging shape. The shear zone on the side wall of the specimen is not obvious. Cracks can be seen in the middle and upper part of the specimen; the cracks are distributed obliquely, with an angle of more than 45°, and the spreading direction is different. One part of the cracks is distributed unidirectionally, while the other part is distributed bi-directionally, presenting “V” and “Λ” types.
3.2. The Effect of Freeze–Thaw Cycles on Mechanical Properties
Figure 4 shows the stress–strain curves of the thawed roadbed soil after different numbers of freeze–thaw cycles (0, 1, 3, 5, and 7 times) with a water content of 10%, a peripheral pressure of 100 kPa, and a freezing temperature of −10 °C. The stress–strain curves of the thawed roadbed soil are shown in Figure 4. From the figure, it can be seen that with the increase in the number of freeze–thaw cycles, the stress–strain relationship curves of the roadbed soil have basically the same morphology, which are hardened curves, and the strength of the roadbed soil gradually decreases with the increase in the number of freeze–thaw cycles. In the early stage of loading, when the axial strain is less than 0.3%, the shape of the curve is nearly a straight line, which indicates that the axial bias stress of the specimen at this time increases sharply and linearly, and the specimen is undergoing elastic deformation.
For the strain-hardening type curve, the destructive stress corresponding to 15% of the axial strain is taken at the axial bias stress. The change in the destructive stress and elastic modulus of the subgrade soil under freeze–thaw cycles is shown in Figure 5. From the figure, it can be concluded that the destructive stress of the subgrade soil shows an approximate exponentially decreasing trend with an increase in the number of freeze–thaw cycles. After seven freeze–thaw cycles, the destructive stress of the subgrade soil decreased from 321.7 kPa to 289.9 kPa, representing a total decrease of 9.9%. Among them, the destructive stress decreased the most after the first freeze–thaw cycle, up to 5.5%, indicating that the effect of the first freeze–thaw cycle is the most significant. Overall, the effects of the first three freeze–thaw cycles on the destructive stress were more pronounced, while the effects of the third to seventh freeze–thaw cycles were smaller. Especially after the seventh freeze–thaw cycle, the destructive stress only decreased by 0.3%, which was already essentially stable.
According to the characteristics of the stress–strain relationship curve in Figure 4, the ratio of the axial deviatoric stress increment, corresponding to 0.3% axial strain to the axial strain increment, is used as the elastic modulus of subgrade soil, that is:
As shown in Figure 5, the elastic modulus of the roadbed soil also shows an approximate exponential decrease as the number of freeze–thaw cycles increases, but the decay rate gradually slows down. After seven freeze–thaw cycles, the elastic modulus of the roadbed soil decreased from 0.832 MPa to 0.666 MPa, resulting in a decay of 20.0%. Among them, the first freeze–thaw cycle had the greatest impact on the specimen, with the elastic modulus of the subgrade soil decreasing the most, reaching 8.0%. After the 7th freeze–thaw cycle, the modulus of elasticity only decreased by 1.9%.
Soil strength decreases due to freezing and thawing. The main reason is that the pore volume in the soil increases as water freezes. When the ice in the pores melts, the increased pore space cannot return to its original state, causing the soil to become loose and less dense. This reduction in density weakens the linkage between soil particles. After multiple cycles of freezing and thawing, the pore volume reaches its limit, and the soil strength eventually stabilizes.
The data from the triaxial shear test were compiled as a function of ε1/(σ1 − σ3) and ε1. It was observed that there was a deviation in the test points in the initial stage. Therefore, some test points with larger deviations were adjusted using the fitness line method. The relationship curve between ε1/(σ1 − σ3) and ε1 under different numbers of freezing and thawing cycles is shown in Figure 6.
A linear fit was applied to each curve in Figure 6 to obtain the values of the test parameters a and b in the model, as shown in Table 4. The coefficient of determination R2 was found to be greater than 0.98, indicating a high level of fit.
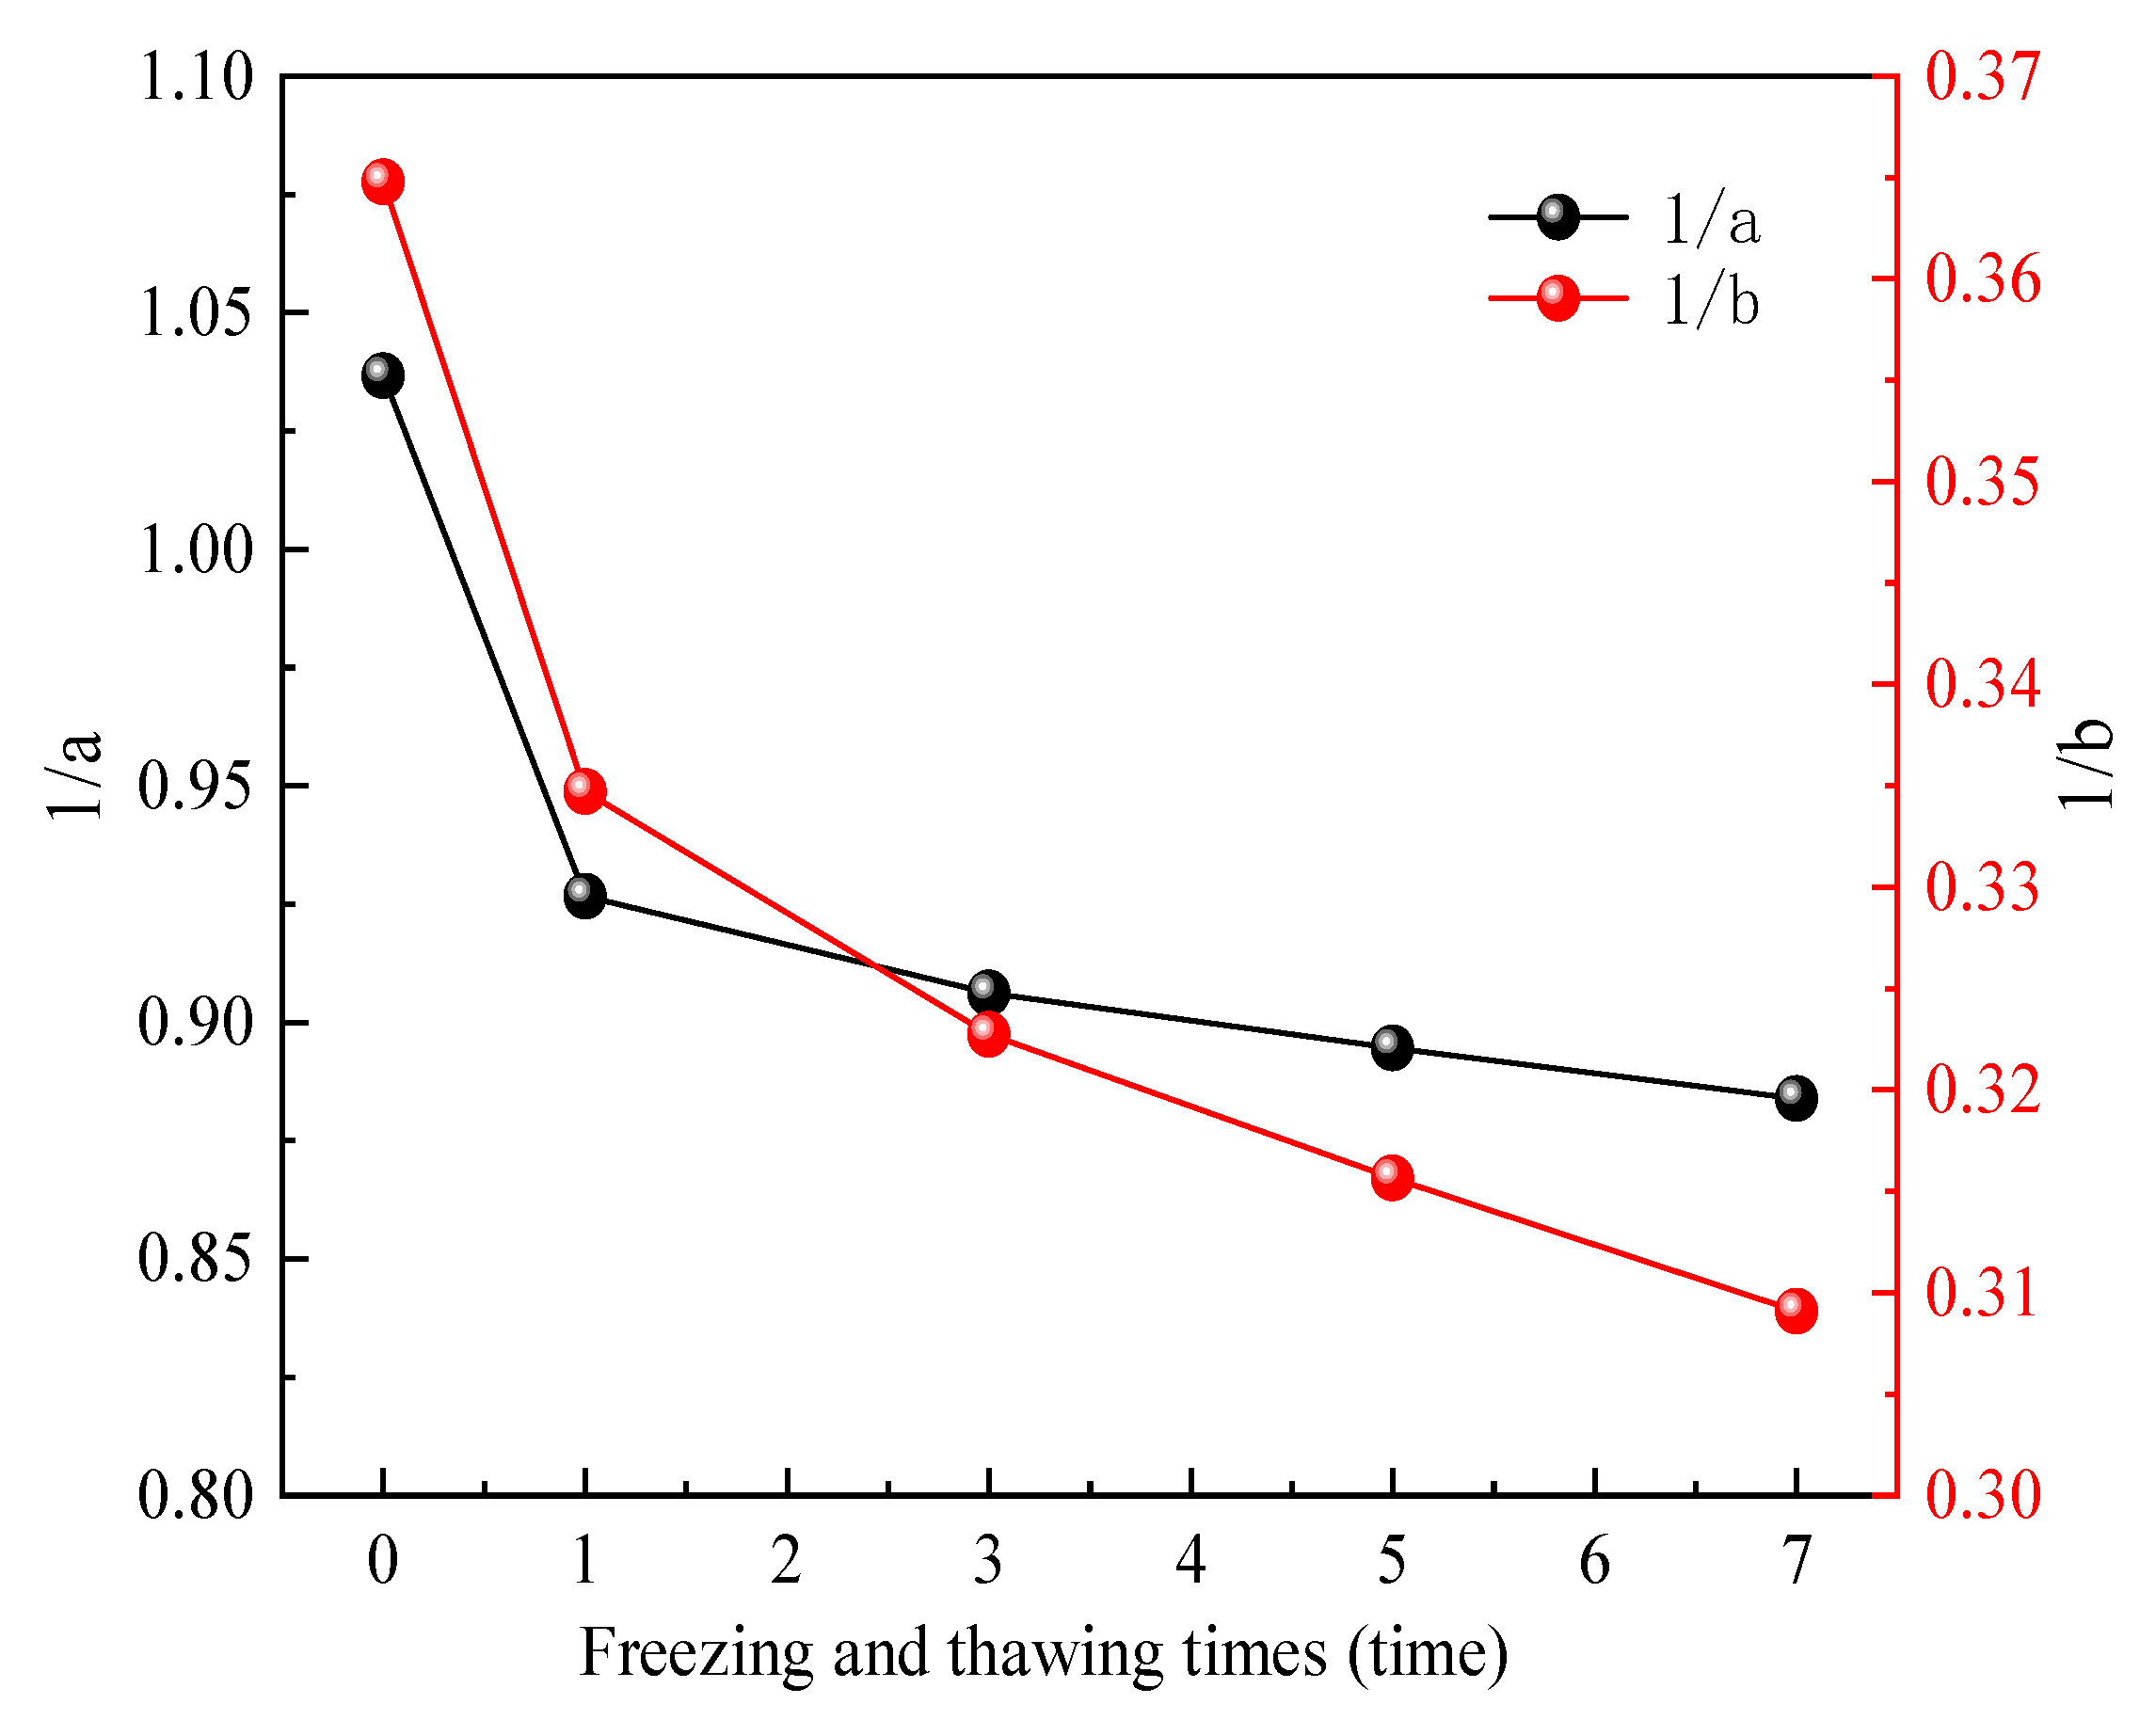
The reciprocal of parameters a and b, which represent the initial tangent modulus and ultimate deviatoric stress, respectively, was plotted against the number of freeze–thaw cycles in Figure 7. From the Figure, it can be observed that after the first freeze–thaw cycle, parameter 1/a decreased by 11.0% and parameter 1/b decreased by 8.2%. After the third freeze–thaw cycle, parameter 1/a decreased by 2.0% and parameter 1/b decreased by 3.3%. Similarly, after the fifth freeze–thaw cycle, parameter 1/a decreased by 1.2% and parameter 1/b decreased by 1.9%. After the seventh freeze–thaw cycle, parameter 1/a decreased by 1.1% and parameter 1/b decreased by 1.8%. These results indicate that the initial tangent modulus gradually decreases with an increasing number of freeze–thaw cycles, while the reduction rate gradually slows down. Similarly, the ultimate deviatoric stress also gradually decreases, but the reduction rate slows down over time.
According to Equation (9), the damage ratio Rf of the soil is the product of the damage stress and the b value. The damage ratio Rf under different numbers of freeze–thaw cycles was calculated using the test data, and the results are shown in Table 5.
It can be observed from the calculations that the soil damage ratio Rf gradually increases with an increasing number of freeze–thaw cycles, albeit at a relatively slow rate. After seven freeze–thaw cycles, the damage ratio Rf of the soil increased by 6.4%. A larger damage ratio Rf indicates that the strength of the soil is closer to its ultimate deviatoric stress. This suggests that as the number of freeze–thaw cycles increases, the strength of the thawed soil approaches its potential ultimate strength.
3.3. Effect of Freezing Temperature on Mechanical Properties
Figure 8 shows the stress–strain curves of thawed subgrade soil under different freezing temperatures (−5 °C, −10 °C, −15 °C) after one freeze–thaw cycle, with a water content of 10% and a peripheral pressure of 100 kPa. From the figure, it can be seen that as the freezing temperature decreases, the stress–strain relationship curves of the roadbed soil have the same morphology, which is hardened curves. Additionally, as the axial strain increases, the axial bias stress also gradually increases without a peak bias stress. Furthermore, the decrease in freezing temperature does not significantly affect the strength change, indicating a weak influence of freezing temperature.
Based on the destructive stress corresponding to a 15% axial strain, the influence of freezing temperature on the destructive stress and modulus of elasticity of the roadbed soil was determined, as shown in Figure 9. As observed from the figure, the destructive stress of the subgrade soil exhibits a slight decreasing trend as the freezing temperature decreases. Specifically, the destructive stress decreases from 303.9 kPa to 290.1 kPa when the freezing temperature drops from −5 °C to −15 °C, resulting in a decrease of 13.8 kPa, which corresponds to about 4.5%. The modulus of elasticity of the subgrade soil also decreases in a roughly linear manner with the decrease in freezing temperature. For instance, as the freezing temperature decreases from −5 °C to −15 °C, the modulus of elasticity of the subgrade soil drops from 0.765 MPa to 0.753 MPa, representing a decrease of 0.012 MPa, which is about 1.6%. Analyzing the test results, it can be concluded that freezing temperature has a weak influence on the destructive stress and elastic modulus of the roadbed soil.
The relationship between ε1/(σ1 − σ3) and ε1 under different freezing temperatures, as shown in Figure 10.
A linear fit to each curve in Figure 10 gives the values of the test parameters “a” and “b” in the model, as shown in Table 6. As can be seen from the table, the coefficient of determination R2 is greater than 0.98, indicating a high fit.
By taking the inverse of the parameters “a” and “b”, the initial tangential modulus and ultimate deviatoric stress versus freezing temperature are obtained, as shown in Figure 11. As can be seen from the Figure, the initial tangent modulus of the soil gradually decreases as the freezing temperature decreases, and the rate of decrease increases. The parameter 1/a decreased by 11.5% when the freezing temperature was reduced from −5 °C to −15 °C. The ultimate deviatoric stress 1/b of the soil decreased approximately linearly, with a decrease of about 4.6%.
Further calculations to obtain the damage ratio Rf of soil at different freezing temperatures are shown in Table 7. It can be seen that as the freezing temperature increases, the damage ratio Rf of the soil fluctuates between 0.90 and 0.91 with no significant trend. This indicates that the freezing temperature has a small effect on the strength utilization of the soil when it melts.
3.4. The Influence of Water Content on Mechanical Properties
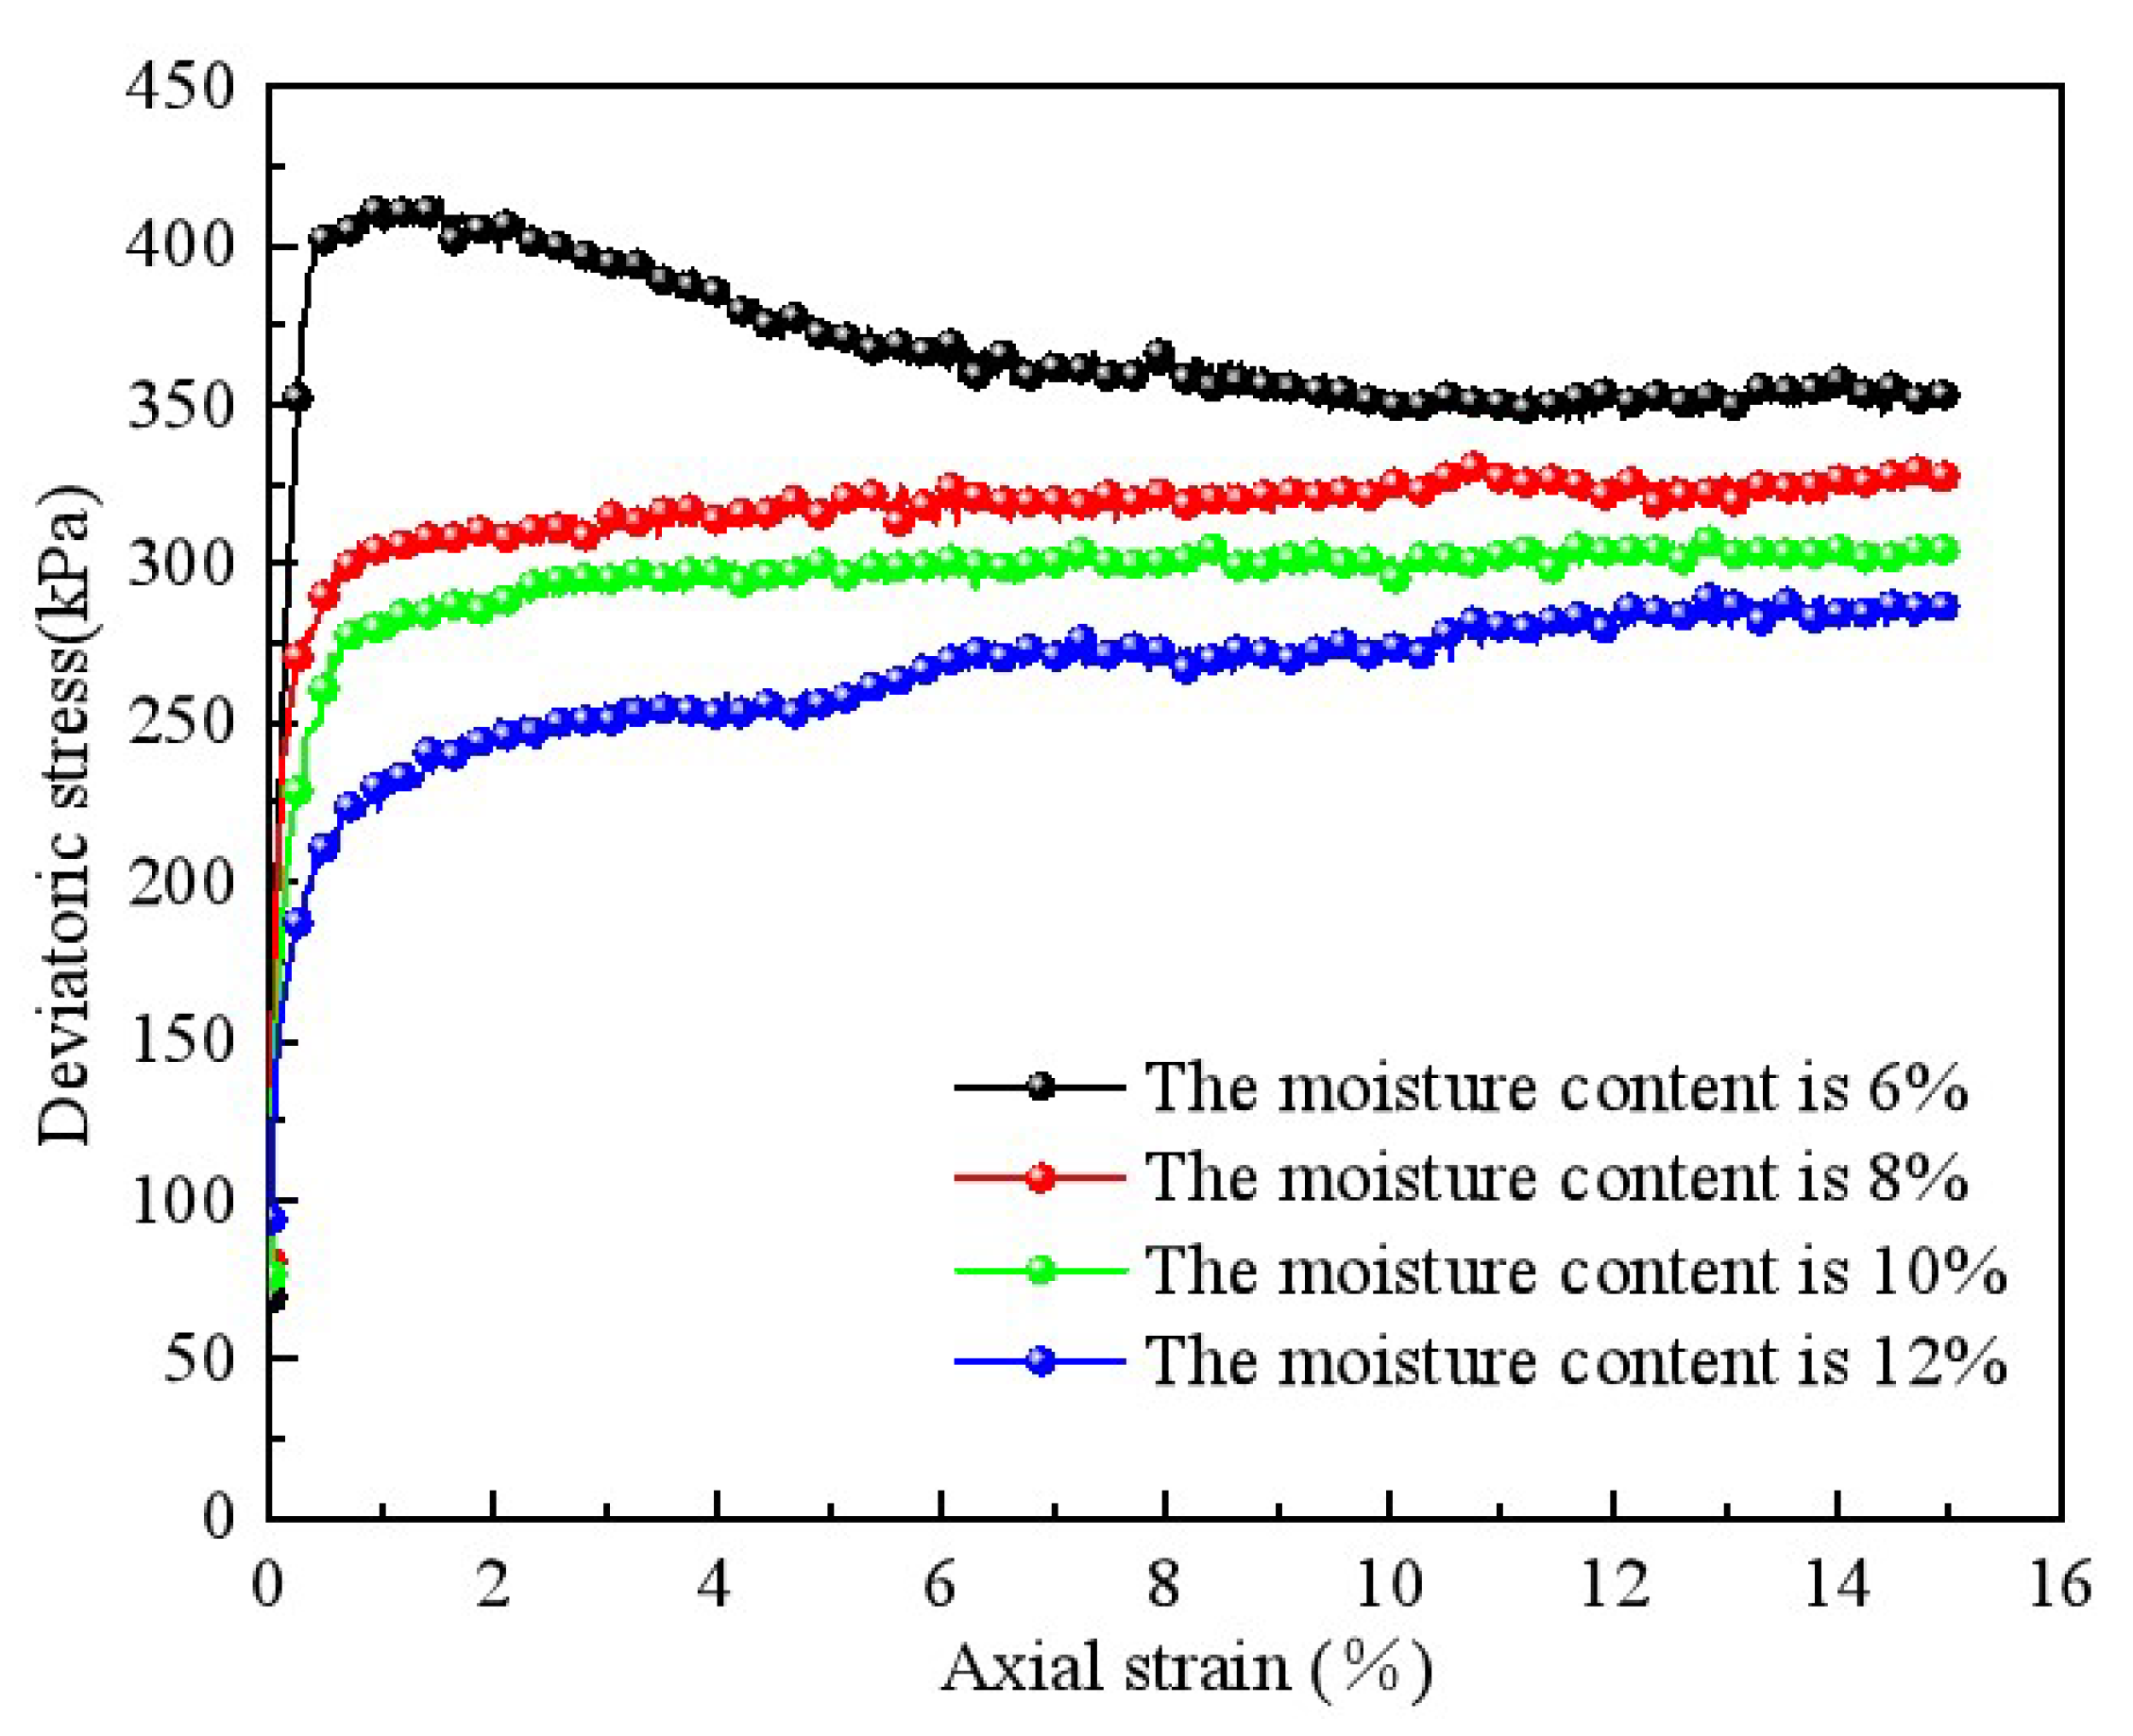
Figure 12 shows the stress–strain curves of the thawed subgrade soil under different water contents (6%, 8%, 10%, and 12%) after one freeze–thaw cycle, with a peripheral pressure of 100 kPa and a freezing temperature of −10 °C. It can be seen from the figure that, as the water content increases, the curve gradually changes from a softening type to a hardening type, and the strength of the roadbed soil decreases significantly with increasing water content. When the water content is 6%, the stress–strain curve of the subgrade soil exhibits the characteristics of a softening curve, which indicates brittle damage. When the water content reaches 8% and above, the stress–strain curve shows the characteristics of a hardening curve.
The influence of water content on the destructive stress of the roadbed soil is shown in Figure 13. As can be seen from the Figure, the destructive stress of the roadbed soil decreases with an increase in water content from 405.43 kPa to 288.4 kPa, which is 28.9% lower. The most significant decrease in destructive stress occurs when the water content increases from 6% to 8%, with a decrease of 19.1%. When the water content increases from 8% to 12%, the destructive stress decreases approximately linearly, with a decrease of 2.4% for every 1% increase in water content. The modulus of elasticity of the subgrade soil also decreases approximately linearly with increasing water content. The modulus of elasticity decreases by an average of 8.4% for every 1% increase in water content. The attenuation of the modulus of elasticity reaches 50.4% when the water content increases from 6% to 12%. Based on the analysis of the test results, it can be concluded that water content has a strong influence on the destructive stress and elastic modulus of the subgrade soil.
The values of test parameters a and b in the model can be obtained by linear fitting of each curve in Figure 14, as shown in Table 8. It can be seen from the table that the determination coefficient R2 > 0.98, and the fitting degree is high.
Calculating 1/a and 1/b, the initial tangent modulus and ultimate deviatoric stress versus moisture content were obtained, as shown in Figure 15. As can be seen from the Figure, the water content increases from 6 to 8 percent, the parameter 1/a decreases by 11.9 percent, and the parameter 1/b decreases by 24.9 percent. The increase in water content from 8 to 10 percent decreased parameter 1/a by 6.1 percent and parameter 1/b by 5.4 percent. The increase in water content from 10 to 12 percent decreased parameter 1/a by 8.5 percent and parameter 1/b by 4.7 percent. The above results show that the initial tangent modulus of the soil gradually decreases with the increase in water content, and its rate of decrease also gradually decreases. Additionally, the ultimate deviatoric stress of the soil gradually decreases, and its rate of decrease slows down gradually.
The damage ratio Rf of the soil at different water contents is calculated, as shown in Table 9. From the Table, it can be seen that with the increase in water content, the damage ratio Rf of the soil gradually increases, and the growth rate is relatively slow. The soil damage ratio Rf increases by 9.3% when the water content increases from 6% to 12%. This indicates that the increase in water content brings the strength of the soil closer to its strength limit, and the utilization of strength increases.
3.5. Effect of Confining Pressure on Mechanical Properties
Figure 16 shows the stress–strain curves of the thawed subgrade soil under different peripheral pressures (50 kPa, 100 kPa, 150 kPa) with a moisture content of 10%, a freezing temperature of −10 °C, and different peripheral pressures (50 kPa, 100 kPa, and 150 kPa) after one freezing and thawing cycle. From the Figure, it can be seen that with the increase of the peripheral pressure, the stress–strain relationship curves of the roadbed soil have the same basic morphology, which are hardened curves. Additionally, with the increase of the axial strain, the axial bias stress also gradually increases, and there is no peak bias stress. Moreover, with the increase of the peripheral pressure, the strength of the roadbed soil increases more, indicating that the influence of the peripheral pressure is more pronounced.
The influence of the perimeter pressure on the destructive stress and modulus of elasticity of the roadbed soil is shown in Figure 17. It can be observed that as the perimeter pressure increases, the destructive stress of the roadbed soil exhibits an approximate linear growth trend. When the perimeter pressure increases from 50 kPa to 150 kPa, the destructive stress of the subgrade soil increases from 194.7 kPa to 367.7 kPa, which represents an increase of 173 kPa, corresponding to a growth rate of approximately 88.8%. Similarly, the modulus of elasticity of the roadbed soil also increases with the increase in the perimeter pressure. Specifically, when the perimeter pressure increases from 50 kPa to 150 kPa, the modulus of elasticity of the roadbed soil increases from 0.366 MPa to 0.931 MPa. This indicates an increase of 0.564 MPa, or about 154.1%.
From the analysis of the above test results, it can be concluded that circumferential pressure has a significant influence on the destructive stress and modulus of elasticity of the roadbed soil. This is because the freezing and thawing effect causes an increase in the internal pore volume of the soil, leading to soil loosening. Consequently, with an increase in perimeter pressure, the roadbed soil becomes compacted and the pore space reduces, resulting in an increase in the strength of the soil structure. Furthermore, the increase in peripheral pressure enhances the degree of consolidation of the subgrade soil, thereby improving the roadbed soil’s resistance to deformation.
Figure 18 is the relationship curve between ε1/(σ1 − σ3) and ε1 under different water content conditions. The values of test parameters a and b in the model can be obtained by linear fitting of each curve in Figure 18, as shown in Table 10. It can be seen from the Table that the determination coefficient R2 > 0.99, and the fitting degree is high.
When calculating 1/a and 1/b, the initial tangent modulus, ultimate deviatoric stress versus the enclosing pressure are obtained, as shown in Figure 19. From the Figure, it can be seen that as the enclosing pressure grows from 50 kPa to 100 kPa, the parameter 1/a increased by 56.0% and the parameter 1/b increased by 50.2%. As the enclosing pressure grows from 100 kPa to 150 kPa, the parameter 1/a increased by 38.2% and the parameter 1/b increased by 26.4%. The above results indicate that the initial tangent modulus of the soil increases approximately linearly with the increase of the confining pressure, while the ultimate deviatoric stress of the soil increases gradually and its growth rate slows down. The damage ratios Rf of the soil at different perimeter pressures were calculated, as shown in Table 11.
Analyzing the calculation results, it can be seen that with the increase in perimeter pressure, the soil damage ratio Rf gradually increases, and the growth rate is relatively slow. The damage ratio Rf increases by 6.9% when the perimeter pressure increases from 50 kPa to 150 kPa. This shows that the increase in perimeter pressure makes the strength of the melted soil gradually approach its strength limit value, and the utilization of the strength increases.
4. Discussion
Scholars around the world have conducted extensive research on the mechanics and deformation mechanisms of railway subgrades in cold regions. These studies have utilized advanced testing techniques and instruments to measure the comprehensive effects of temperature, water content, freeze–thaw cycles, and other factors on the mechanical properties of subgrade soil in cold regions. However, the focus of these studies has been primarily on subgrade soil in a frozen state, with limited research conducted on subgrade soil in a melted state. It is important to consider the stability of subgrades in both frozen and melted states. This study examines the highway subgrade soil under the melted state in cold regions. The research found that the number of freeze–thaw cycles, water content, and confining pressure significantly influenced the mechanical properties of subgrade soil after thawing, while the freezing temperature had a minimal effect. The main reason for this is that during the freezing process, water consolidates into ice, resulting in larger pores between soil particles, which affects soil strength. The study investigated the effects of several factors on the initial tangent modulus, ultimate deviatoric stress, and failure ratio of the soil. In practical engineering, it is crucial to consider the influence of these factors on subgrade stability and take corresponding measures to improve the bearing capacity and durability of the subgrade. However, this study has certain limitations, such as experimental conditions and the complexity of soil mechanical properties, which need further exploration and improvement in future studies. This includes taking into account temperature changes throughout the four seasons and vehicle loads.
5. Conclusions
In order to explore the influence of freeze–thaw cycles, freezing temperature, moisture content, and confining pressure on the mechanical properties of subgrade soil after thawing in cold regions, and to guide how to take corresponding measures to improve the bearing capacity and durability of the subgrade in practical engineering, indoor triaxial tests were conducted to measure the mechanical properties of subgrade soil in cold regions after melting under different conditions. The following conclusions were drawn:
- (1)
- After seven freeze–thaw cycles, the destructive stress of the roadbed soil decreased from 321.7 kPa to 289.9 kPa, representing a decrease of 9.9%, and the elastic modulus decayed by 19.9%. As the number of freeze–thaw cycles increased, the initial tangent modulus and ultimate deviatoric stress gradually decreased, while the damage ratio slowly increased by 6.4%.
- (2)
- When the freezing temperature was lowered from −5 °C to −15 °C, the destructive stress of the roadbed soil decreased from 303.9 kPa to 290.1 kPa, a reduction of 13.8 kPa, or approximately 4.5%, and the elastic modulus decreased by around 1.6%. The initial tangent modulus exhibited a roughly linear increase with the ultimate deviatoric stress, while the damage ratio fluctuated slightly between 0.90 and 0.91.
- (3)
- Increasing the water content from 6% to 12% resulted in a decrease in the destructive stress from 405.43 kPa to 288.4 kPa, representing a reduction of 29.1%. The modulus of elasticity decreased approximately linearly, with a decay of 50.4%. The initial tangent modulus and ultimate deviatoric stress gradually decreased, while the damage ratio increased slowly by 9.0%.
- (4)
- By increasing the peripheral pressure from 50 kPa to 150 kPa, the destructive stress increased from 194.7 kPa to 367.7 kPa, an increase of 173 kPa, corresponding to an 88.8% increase in destructive stress. The modulus of elasticity increased with the rise in circumferential pressure, with an increase of approximately 154.1%. The initial tangent modulus exhibited a roughly linear increase with the ultimate deviatoric stress, while the damage ratio increased slowly by 6.9%.
- (5)
- The strength of thawed soil approaches its potential ultimate strength as the number of freeze–thaw cycles, water content, and confining pressure increase. The freezing temperature has a lesser impact on the strength of thawed soil.
Author Contributions
Conceptualization, Z.W. (Zecheng Wang) and D.L.; methodology, Z.W. (Zecheng Wang) and Z.J.; software, Z.W. (Zecheng Wang); validation, Z.W. (Zecheng Wang), D.L. and Z.W. (Zhenhua Wang); formal analysis, Q.S.; investigation, Z.W. (Zecheng Wang) and Z.J.; resources, D.L. and Z.W. (Zhenhua Wang); data curation, Z.W. (Zecheng Wang); writing—original draft preparation, Z.W. (Zecheng Wang) and Z.J.; writing—review and editing, D.L. and Q.S.; visualization, D.L.; supervision, Z.W. (Zhenhua Wang); project administration, D.L.; funding acquisition, D.L. All authors have read and agreed to the published version of the manuscript.
Funding
The authors are very thankful to the financial support of the National Natural Science Foundation of China (No. 42061011 and 41977236), the Key Research and Development Programs of Jiangxi Province (No. 20232BBE50025 and 20223BBG71W01), and Jiangxi Province Graduate Innovation Special Fund Project (No. YC2023-B209).
Institutional Review Board Statement
Not applicable.
Informed Consent Statement
Not applicable.
Data Availability Statement
The datasets generated and analyzed during the current study are not publicly available, but are available from the corresponding author on reasonable request.
Conflicts of Interest
The authors declare no conflict of interest.
References
- Wang, S.; Niu, F.; Chen, J.; Dong, Y. Permafrost research in China related to express highway construction. Permafr. Periglac. Process. 2020, 31, 406–416. [Google Scholar] [CrossRef]
- Tian, Y.; Yang, Z.; Liu, Y.; Cai, X.; Shen, Y. Long-term thermal stability and settlement of heat pipe-protected highway embankment in warm permafrost regions. Eng. Geol. 2021, 292, 106269. [Google Scholar] [CrossRef]
- De Guzman, E.M.B.; Alfaro, M.C.; Doré, G.; Arenson, L.U.; Piamsalee, A. Performance of highway embankments in the Arctic constructed under winter conditions. Can. Geotech. J. 2021, 58, 722–736. [Google Scholar] [CrossRef]
- Liu, T.; Li, S. Common Diseases and Prevention Techniques of Highway Roadbed Engineering. J. Soc. Sci. Humanit. Lit. 2023, 6, 1–10. [Google Scholar] [CrossRef] [PubMed]
- Dai, K.; Liu, G.; Li, Z.; Ma, D.; Wang, X.; Zhang, B.; Tang, J.; Li, G. Monitoring highway stability in permafrost regions with X-band temporary scatterers stacking InSAR. Sensors 2018, 18, 1876. [Google Scholar] [CrossRef] [PubMed]
- Zhang, H.; Yang, J.; Wang, L.; Xu, Y.; Lan, S.; Luo, J.; Chang, Z. Experimental and numerical investigation on failure mechanism of expansive soil subgrade slope. Sci. Rep. 2023, 13, 19795. [Google Scholar] [CrossRef] [PubMed]
- Deng, Q.; Liu, X.; Zeng, C.; He, X.; Chen, F.; Zhang, S. A Freezing-Thawing Damage Characterization Method for Highway Subgrade in Seasonally Frozen Regions Based on Thermal-Hydraulic-Mechanical Coupling Model. Sensors 2021, 21, 6251. [Google Scholar] [CrossRef]
- Zhang, Y.; Sun, B.; Li, P.; Liang, X.; Yang, J. Analysis of deformation and temperature characteristics of high-speed railway roadbed in seasonal frozen regions. Soil Mech. Found. Eng. 2020, 57, 384–393. [Google Scholar] [CrossRef]
- Zhang, Y.Z.; Dong, Y.Q.; Cao, X.X.; Li, P. A Study on the Train-Induced Vibration Responses of Heavy Haul Railway Subgrade in Seasonally Frozen Regions Using Field Experiments. Sustainability 2022, 14, 15954. [Google Scholar] [CrossRef]
- Lin, Z.; Niu, F.; Li, X.; Li, A.; Liu, M.; Luo, J.; Shao, Z. Characteristics and controlling factors of frost heave in high-speed railway subgrade, Northwest China. Cold Reg. Sci. Technol. 2018, 153, 33–44. [Google Scholar] [CrossRef]
- Zhao, Y.; Ling, X.; Wang, Z.; Shao, X.; Tian, L.; Geng, L. Test on dynamic characteristics of subgrade of heavy-haul railway in cold regions. Sci. Cold Arid. Reg. 2018, 7, 605–610. [Google Scholar] [CrossRef]
- Han, L.; Wei, H.; Zhang, Y.; Zhang, J.; Wang, F. Study on Cold Resistance Performance of Composite Subgrade Structure in Seasonal Frozen Regions. Appl. Sci. 2020, 10, 4681. [Google Scholar] [CrossRef]
- Liu, X.; Cai, D.; Yan, H.; Bi, Z.; Li, Z. Experimental Study on Engineering Characteristics of High-Speed Railway Subgrade Filler in Island Permafrost Regions. Coatings 2023, 13, 429. [Google Scholar] [CrossRef]
- Ren, J.-J.; Zhang, K.-Y.; Zheng, J.-L.; Wei, H.; Zhang, Y.-C.; Du, W.; Ye, W.-L. Railway subgrade thermal-hydro-mechanical behavior and track irregularity under the sunny-shady slopes effect in seasonal frozen regions. J. Central South Univ. 2022, 29, 3793–3810. [Google Scholar] [CrossRef]
- Li, S.-Z.; Ling, X.-Z.; Tian, S.; Ye, Y.-S.; Tang, L.; Cai, D.-G.; Wang, K. In-situ test and analysis of subgrade vibration with ballasted track in deep seasonally frozen regions. Transp. Geotech. 2021, 31, 100658. [Google Scholar] [CrossRef]
- He, Y.; Gao, J.; Wang, H. Variation in Subgrade Temperature of Highway in Seasonal Frozen Soil Region. J. Cold Reg. Eng. 2023, 37, 05023003. [Google Scholar] [CrossRef]
- Kayumov, A.; Salimova, B.; Khakimova, R.; Kayumov, A. Strengthening the roadbed of highways using soil stabilizers. E3S Web Conf. 2021, 264, 02012. [Google Scholar] [CrossRef]
- Trautvain, A.; Yakovlev, E.A.; Gridchin, A.M. Analysis of the Effectiveness of the New Generation of Additives in Improving Physical and Mechanical Properties of Highway Subgrades. In Materials Science Forum; Trans Tech Publications Ltd.: Stafa-Zurich, Switzerland, 2021; pp. 101–110. [Google Scholar] [CrossRef]
- Zhang, K.; Ren, J.; Du, W.; Luo, L.; Liu, J.; Deng, S. Thermal insulation performance and dynamic response of anti-freeze subgrade of high-speed railway in seasonally frozen regions. Transp. Geotech. 2023, 42, 101081. [Google Scholar] [CrossRef]
- Gao, W.; Sun, W.; Wang, X.; Dong, N. Moisture Content Distribution and Variation Law of Highway Subgrade in High-Latitude and Low-Altitude Deep Seasonal Frozen Ground Region. IOP Conf. Ser. Earth Environ. Sci. 2021, 787, 012111. [Google Scholar] [CrossRef]
- Wu, Q.L.; Sheng, Y.; Xie, F. Influence of Moisture Content to the Freeze-Thaw Performance of Roadbed in High-Cold Areas. Appl. Mech. Mater. 2014, 505, 219–222. [Google Scholar] [CrossRef]
- Zhuang, Y.; Hu, S.; Song, X.; Zhang, H.; Chen, W. Membrane Effect of Geogrid Reinforcement for Low Highway Piled Embankment under Moving Vehicle Loads. Symmetry 2022, 14, 2162. [Google Scholar] [CrossRef]
- Qi, H.; Zhang, X.; Liu, J.; Zhang, T.; Lv, G.; Cui, L.; Xie, Q. Study on deformation characteristics of low-highway subgrade under traffic load. Appl. Sci. 2022, 12, 3406. [Google Scholar] [CrossRef]
- Zhang, R.; Liu, Z.; Zheng, J.; Lei, G. Utilisation of expansive soils as highway embankment materials in humid environments. Int. J. Pavement Eng. 2022, 23, 2176–2190. [Google Scholar] [CrossRef]
- Karthik, P.S.R.; Chamberlain, K.S. Strengthening of Subgrade Clayey Soil in Road Construction using Fly ash and Coir Geotextile. IOP Conf. Ser. Mater. Sci. Eng. 2021, 1197, 012042. [Google Scholar] [CrossRef]
- Ramalakshmi; Krishna, S.H. Study On Fly Ash as a Partial Replacement Material in Highway Embankment. IOP Conf. Ser. Mater. Sci. Eng. 2020, 981, 042094. [Google Scholar] [CrossRef]
- Zhang, A.; Liao, J.; Liu, Z.; Zhou, C.; Zhang, L. Optimized Design of Piled Embankment Using a Multi-Effect Coupling Model on a Coastal Highway. J. Mar. Sci. Eng. 2022, 10, 1170. [Google Scholar] [CrossRef]
Figure 1.
MTS triaxial test system.

Figure 2.
Particle analysis curve.

Figure 3.
Appearance of soil samples after loading.

Figure 4.
Influence of freeze–thaw cycles on stress–strain relations.

Figure 5.
The relationship curves of failure stress, elastic modulus, and freezing–thawing times.

Figure 6.
Curves of ε1/(σ1 − σ3) − ε1 of different freeze–thaw cycles.

Figure 7.
The curve of the relationship between limit deviation stress and freezing–thawing times.

Figure 8.
Influence of loading rate on stress–strain relations.

Figure 9.
Loading rate—elasticity modulus relation diagram.

Figure 10.
Curves of ε1/(σ1 − σ3) − ε1 of different loading rate.

Figure 11.
Ultimate deviation stress—loading rate relation diagram.

Figure 12.
Influence of water content on stress—strain relations.

Figure 13.
The relationship curves of failure stress, elastic modulus, and moisture content.

Figure 14.
Curves of ε1/(σ1 − σ3) − ε1 of different water content.

Figure 15.
Ultimate deviation stress—water content relation diagram.

Figure 16.
Influence of confining pressure on stress–strain relations.

Figure 17.
Confining pressure—elasticity modulus relation diagram.

Figure 18.
Curves of ε1/(σ1 − σ3) − ε1 of different confining pressure.

Figure 19.
Ultimate deviation stress—confining pressure relation diagram.


Table 1.
Literature comparison list.
| Author | Comments | Subgrade Type |
|---|---|---|
| Liu X et al. [13] | Three kinds of coarse fillers were studied experimentally, and the best filler for a high-speed railway subgrade was determined. | Railway |
| Ren J et al. [14] | The process and characteristics of soil temperature field and deformation in the freezing process of high-speed railway subgrade are discussed. | Railway |
| Li S et al. [15] | The time domain and frequency domain response of vertical acceleration of Harbin–Jiaxing high-speed railway in thawing period and freezing period are studied. | Railway |
| He Y et al. [16] | The frost resistance of railway subgrade filler in cold region was studied. | Railway |
| Kayumov A et al. [17] | Soil stabilizers are used to reinforce highway subgrades. | Highway |
| I. A T et al. [18] | The influence of additives on the physical and mechanical properties of highway subgrade is studied. | Highway |
Table 2.
Physical parameters of soil samples.
| Soil Sample | Maximum Dry Density ρd/ (g/cm3) | Optimum Moisture Content ω/% | Natural Water Content ω/% | Specific Gravity Gs | Natural Void Ratio e |
|---|---|---|---|---|---|
| silty sand | 2.01 | 10 | 4 | 2.67 | 0.423 |
Table 3.
Triaxial compression test scheme.
| Sample Number | Number of Freeze–Thaw Cycles (Time) | Moisture Content (%) | Confining Pressure (kPa) | Freezing Temperature (°C) |
|---|---|---|---|---|
| D-1 | 0 | 10 | 100 | −10 |
| D-2 | 1 | |||
| D-3 | 3 | |||
| D-4 | 5 | |||
| D-5 | 7 | |||
| H-1 | 1 | 6 | 100 | −10 |
| H-2 | 8 | |||
| H-3 | 10 | |||
| H-4 | 12 | |||
| W-1 | 1 | 10 | 50 | −10 |
| W-2 | 100 | |||
| W-3 | 150 | |||
| F-1 | 1 | 10 | 100 | −5 |
| F-2 | −10 | |||
| F-3 | −15 |
Table 4.
Parameters under different freeze–thaw cycles.
| Freezing and Thawing Times (Time) | a | b | Adjusted R Square |
|---|---|---|---|
| 0 | 0.96465 | 2.74137 | 0.98142 |
| 1 | 1.07915 | 2.98762 | 0.99929 |
| 3 | 1.10352 | 3.09856 | 0.99643 |
| 5 | 1.11787 | 3.16806 | 0.99731 |
| 7 | 1.13136 | 3.2354 | 0.99144 |
Table 5.
Damage ratio of soil under different freeze–thaw cycles.
| Freezing and Thawing Times (Time) | Rf |
|---|---|
| 0 | 0.88177 |
| 1 | 0.90806 |
| 3 | 0.91116 |
| 5 | 0.92186 |
| 7 | 0.93801 |
Table 6.
Parameters under different loading rate.
| Freezing Temperature (°C) | a | b | Adjusted R Square |
|---|---|---|---|
| −5 | 1.07915 | 2.98762 | 0.99929 |
| −10 | 1.17915 | 3.04751 | 0.99863 |
| −15 | 1.21915 | 3.13235 | 0.98912 |
Table 7.
Damage ratio of soil under different loading rate.
| Freezing Temperature (°C) | Rf |
|---|---|
| −5 | 0.90803 |
| −10 | 0.89539 |
| −15 | 0.90869 |
Table 8.
Parameters under different water content.
| Moisture Content (%) | a | b | Adjusted R Square |
|---|---|---|---|
| 6 | 0.88516 | 2.04746 | 0.98135 |
| 8 | 1.00462 | 2.72571 | 0.99972 |
| 10 | 1.07915 | 2.98762 | 0.99929 |
| 12 | 1.20416 | 3.14859 | 0.99961 |
Table 9.
Damage ratio of soil under different water content.
| Moisture Content (%) | Rf |
|---|---|
| 6 | 0.83039 |
| 8 | 0.89376 |
| 10 | 0.90803 |
| 12 | 0.90796 |
Table 10.
Parameters under different confining pressure.
| Confining Pressure (kPa) | a | b | Adjusted R Square |
|---|---|---|---|
| 50 | 1.68317 | 4.48731 | 0.99814 |
| 100 | 1.07915 | 2.98762 | 0.99929 |
| 150 | 0.8669 | 2.54143 | 0.99934 |
Table 11.
Damage ratio of soil under different confining pressure.
| Confining Pressure (kPa) | Rf |
|---|---|
| 50 | 0.87404 |
| 100 | 0.90803 |
| 150 | 0.93441 |
Disclaimer/Publisher’s Note: The statements, opinions and data contained in all publications are solely those of the individual author(s) and contributor(s) and not of MDPI and/or the editor(s). MDPI and/or the editor(s) disclaim responsibility for any injury to people or property resulting from any ideas, methods, instructions or products referred to in the content. |
© 2024 by the authors. Licensee MDPI, Basel, Switzerland. This article is an open access article distributed under the terms and conditions of the Creative Commons Attribution (CC BY) license (https://creativecommons.org/licenses/by/4.0/).
Share and Cite
MDPI and ACS Style
Wang, Z.; Li, D.; Jia, Z.; Wang, Z.; Sun, Q. Experimental Study on Mechanical Properties of Highway Subgrade in Cold Regions under Different Conditions. Appl. Sci. 2024, 14, 3547. https://doi.org/10.3390/app14093547
AMA Style
Wang Z, Li D, Jia Z, Wang Z, Sun Q. Experimental Study on Mechanical Properties of Highway Subgrade in Cold Regions under Different Conditions. Applied Sciences. 2024; 14(9):3547. https://doi.org/10.3390/app14093547
Chicago/Turabian StyleWang, Zecheng, Dongwei Li, Zhiwen Jia, Zhenhua Wang, and Qiao Sun. 2024. "Experimental Study on Mechanical Properties of Highway Subgrade in Cold Regions under Different Conditions" Applied Sciences 14, no. 9: 3547. https://doi.org/10.3390/app14093547
Note that from the first issue of 2016, this journal uses article numbers instead of page numbers. See further details here.