

Sensory Factors Influence Dynamic and Static Bi-Manual Finger Grip Strength in a Real-World Task Context


1
Centre National de la Recherche Scientifique, UMR 7357 CNRS-Strasbourg University, 67200 Strasbourg, France
2
Robotics Department, UMR 7357 CNRS-Strasbourg University, 67200 Strasbourg, France
*
Author to whom correspondence should be addressed.
Appl. Sci. 2024, 14(9), 3548; https://doi.org/10.3390/app14093548
Submission received: 28 February 2024
/
Revised: 9 April 2024
/
Accepted: 15 April 2024
/
Published: 23 April 2024
(This article belongs to the Special Issue Advances in the Biomechanical Analysis of Human Movement)
Abstract
:Individual grip strength provides a functional window into somatosensory processes and their effects on motor behaviour in healthy, impaired, and ageing individuals. Variations in grip strength during hand–tool interaction are therefore exploited in a variety of experimental tasks to study the effects of pathology or ageing-related changes on sensory, motor, and cognitive ability. However, many different factors may influence individual grip strength systematically in a given task context without being explicitly identified and controlled for. Grip strength may vary as a function of the location of the measurement device (sensor) on the fingers/hand, the shape, weight and size of object(s) being gripped, the type of grip investigated (static versus dynamic grip), and the hand (dominant versus non-dominant) used for gripping. This study tests for additional factors such as sight, sound, and interactions with/between any of the other factors in a complex task context. A wearable biosensor system, designed for measuring grip strength variations in operators gripping cylindrical objects bi-manually, was used. Grip force signals were recorded from all sensors of the wearable (glove) system, including three directly task-relevant sensors for bi-manually gripping cylindrical objects with the dominant and non-dominant hands. Five young male participants were tested for the effects of sound, movement, and sight on grip strength. The participants had to pick up two cylindrical objects of identical size and weight, then hold them still (static grip) or move them upwards and downwards (dynamic grip) for ten seconds while listening to soft or hard music, with their eyes open or blindfolded. Significant effects of sensor location, hand, movement, sight, and sound on bi-manual grip strength were found. Stronger grip force signals were produced by task-relevant sensors in the dominant hand when moving the cylindrical handles (dynamic grip) in comparison with the static grip condition, depending, as expected, on whether grip signals were measured from the dominant or the non-dominant hand. Significantly stronger grip strength was produced blindfolded (sight condition), and grips were significantly stronger with exposure to harder music (sound factor). It is concluded that grip strength is significantly influenced by sensory factors and interactions between the other factors tested for, pointing towards the need for identifying and systematically controlling such potential sources of variation in complex study task contexts.
Keywords:
grip strength; bi-manual; cylindrical object; wearable biosensors; vision; sound; dynamic grip; static grip; handedness1. Introduction
Biosensor systems for the measurement of grip strength variations during dynamic or stationary grip tasks with hand–object interaction provide valuable insight into the somatosensory control functions underlying the cognitive and motor skills linked to grip strength deployment [1]. As shown in previous work from our group, grip strength-based performance metrics, such as their variance and its evolution in task time, provide indicators of surgical skill [2,3,4,5,6], adding important insights into individual motor behaviour adjustment beyond the classic measures of task completion times or tool-tip positioning and tool-trajectories. Holding an object or professional tool requires sufficient grip to prevent the tool from dropping/slipping, while avoiding potentially damaging excessive force deployment is a critical aspect of motor performance [7]. The brain learns about the physical properties of weight, shape, sound, texture, and characteristics of contact surfaces, such as their resistance to deformation, during sensitive periods of sensory, cognitive, and motor development for eye–hand–hearing coordination [8,9,10]. Visually guided learning and memory for motor planning are important to the fine-tuning of grip forces [8,10,11,12,13]. Auditory cues [14] have been reported to significantly influence the anticipatory control of deployed grip strength. Handedness, i.e., the privileged use of the left or the right hand, the so-called dominant hand, in motor behaviour is also determined by cognitive development, and it has been shown that grip strength may vary significantly between dominant and non-dominant hands [15,16,17,18,19]. Links between grip strength control and cognition [20], mental health [21], ageing [22,23], or language and emotional factors [24] have been demonstrated. It has even been suggested that decline in multi-finger grip strength would be a marker of brain health [20]. However, hand grip strength can vary significantly as a function of a variety of physical and environmental constraints. Even the linguistic and emotional task context has a measurable effect as shown by evidence that affirmative action-related words trigger a significant increase in grip strength [24]. The hand grip of mothers responding to loud baby cries was reported to be significantly stronger in mothers brought up under conditions of harsh parenting in comparison with controls [25]. Thus, when exploiting grip strength as a study metric to isolate a specific effect, a variety of factors need to be taken into account and controlled for, in particular in real-world contexts and field study tasks outside the classic, well-controlled laboratory settings. This study here addresses the question of complex crosstalk between auditory, visual, and motor variables in a “natural” task context that requires grip strength deployment for the static or dynamic bi-manual manipulation of two identical cylindrical objects. Grip strength signals were recorded from sensors of a fully calibrated glove system with tactile biosensors. The system, developed to study grip strength variations in surgical experts and novices in image-guided tasks, was here exploited to collect grip strength signals from relevant locations in the two hands of five young, healthy male participants, to test for the effects of auditory, visual, and motor factors and their interactions in a complex natural task context of bi-manual active or passive weight lifting such as at home or in a fitness studio.
2. Materials and Methods
2.1. Sensor Glove System
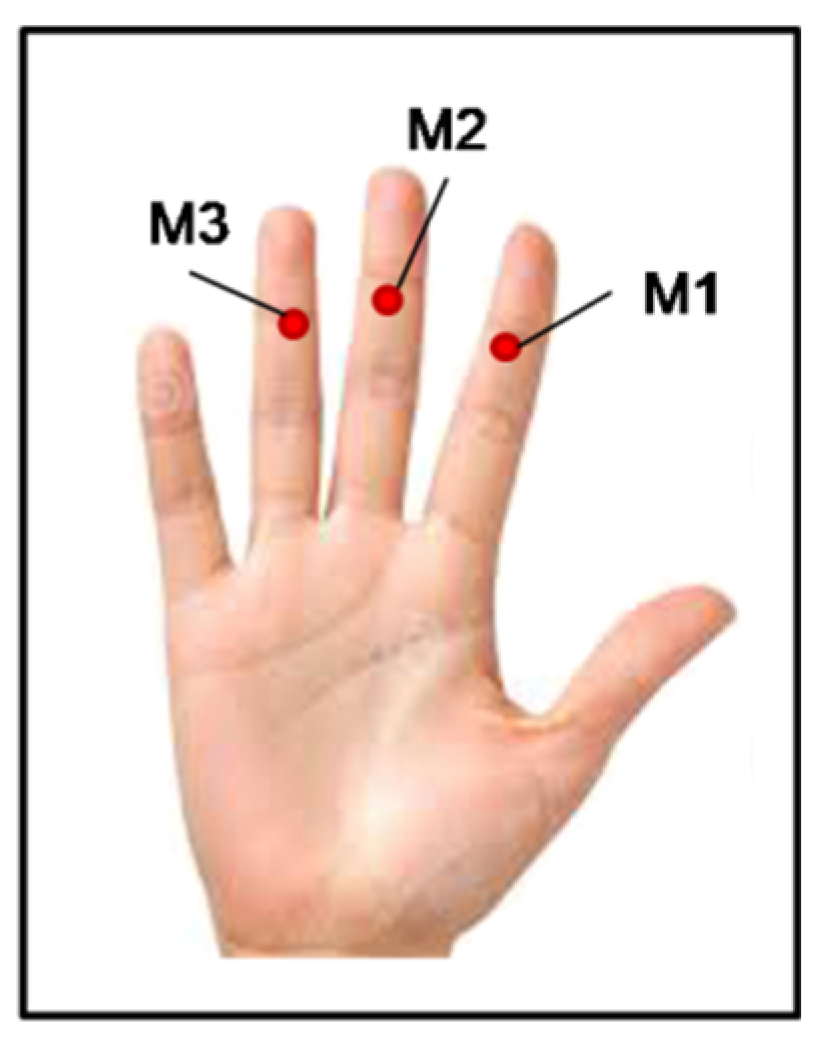
The sensor glove system is a prototype designed to optimally fit the hands of a selected number of male operators with comparable hand dimensions in the context of a study on grip force control in expert surgeons and novices manipulating a robotic assistant for minimally invasive surgery [2,3,4,5,6]. It consists of two sensor gloves, one for the right and one for the left hand, designed to measure hand grip strength. In this study, two identical cylindrical weight handles had to be lifted with dominant and non-dominant hands simultaneously by healthy young male subjects with about equally sized hands. The Force Sensitive Resistors (FSRs) embedded in the gloves permit recording grip force signals locally in twelve different locations of the inner left and right hands in a variety of grip tasks for a variety of different objects. Which sensors will be optimally activated in a given task when gripping objects depends on parameters relative to the size and shape of the object being gripped, and on the type of manipulation required by the task in a given context. This is discussed extensively in our previous work [2,3,4,5,6]. For gripping the cylindrical objects in this experiment, sensors producing consistent and reliable signal sequences during the whole time of task execution were placed on the middle phalanges of the index, middle, and ring fingers of each hand (Figure 1).
The FSR diameter was 5 mm, and each of them was soldered to a 10 KΩ pull-down resistor, creating a voltage divider. The voltage value as read out from the Arduino is given by
where RPD indicates the resistance of the pull-down resistor, RFSR that of the corresponding FSR, and V3.3 the 3.3 V supply voltage. The generated voltage varies monotonically between 0 and 3.22 Volts as a function of the force applied and is assumed to be uniform across the sensor surface. In the experimental task here, forces applied did not exceed 1100 g (g), which corresponds to ~10 Newton. The relation between force and voltage is linear, as shown here below in Figure 2, within the range of millivolt (mV) measured in the experiments.
Vout = RPDV3.3/(RPD + RFSR)
All sensors were individually calibrated prior to the experiments, ensuring that all of them provided reliable output. Regulated 3.3 V was provided to each of the sensors via the Arduino. Power generated by a 4.2 V Li-Po battery enabled using the glove system without any cable connections. The combination of hardware and software design here provides accurate and reliable real-time sensing of grip strength signals by wearable technology. There were no weak current incidents, as the battery voltage levels and the voltages received from the gloves were continuously computer monitored in real time during the duration of all experiments. Values were displayed continuously on the screen of the user interface, and the software design ensured that, in case the battery level drops below 3.7 V, a warning signal is given, indicating to change or re-charge the battery. This never occurred during any of the experiments. Bluetooth-enabled wireless communication at a rate of 115,200 bits per second (bps) ensured communication between the glove system and the CPU of the computer for data storage. The electrical connections of the FSRs were individually routed via the dorsal side of each hand to the Arduino microcontroller on the forearm, as shown here below in Figure 3a. A snapshot view of the right-hand glove in action on a robotic system (a) and the general design chart of hard-to-software operating system (b) are shown.
2.2. Software for Data Collection
The software running on the glove system and the data collection was originally written in Python 2.7. Each of the two gloves sends data to the computer separately, and the software, running on Arduino 1.0.5., reads analogue voltages from each FSR on each glove every 20 milliseconds (at a 50 Hz rate). This permits the generation of 500 signals (in mV) from any given sensor every 20 milliseconds. In each such loop and for each individually identified sensor, the output voltages are merged with their corresponding time stamps. The data, sent to the computer via Bluetooth, are saved with their time stamps in a text file for each individually labelled sensor.
2.3. Participants
Nine healthy men and two healthy women, aged between 20 and 30, all of them right-handed, initially responded to the call for participants in the experiments and were run in test sessions with the sensor gloves. The two women and four of the men had to be finally excluded from the study after this preliminary test phase, which showed that the gloves could not be optimally adjusted to the same positions on the fingers of their hands, which varied noticeably in dimensions between these individuals. This well-known problem of anthropometric factors such as hand dimensions in grip strength measurements is discussed in detail by others elsewhere [18]. Five of the nine men with hands of comparable dimensions and well-adjusted gloves and sensor positions producing coherent and comparable datasets were finally retained as participants in this study. The handedness of each individual was assessed using the Edinburgh inventory [26]. All participants volunteered as part of a study program, and were naive with regard to the study goal. Their identity is not revealed.
2.4. Experimental Design
Hand grip forces were recorded from all the twelve sensors of each glove, but only three of them (see Figure 1) were optimally solicited by the cylindrical grip task studied here and taken into account for data analysis (the sensor factor S3). Recordings from the dominant and non-dominant hands (the hand factor H2) of the five participants were analysed in different experimental conditions. There were short breaks between the different test conditions during which no grip strength signals were recorded. All participants were tested in each of the conditions to each of the four different types of music (the music factor M4), with eyes open receiving visual input from the environment and blindfolded (the eyes factor E2), with hands gripping the handles and holding them still (static grip), and with hands gripping the handles and moving them upwards and downwards (dynamic grip) in slow rhythmic movements (the grip style or grip factor G2). The order of experimental conditions was counterbalanced between individuals. The factor combinations yield a fully balanced Cartesian Design Plan S3 × H2 × M4 × E2 × G2 × P5, P5 being the random, or participant, factor. The tools that were grasped in the experiment were weight handles for individual muscle training, with identical shape and size. Each handle weighed one kilogram. Four sound files were selected for the different music conditions, each one playing for ten seconds per observer and grip condition. Soft tones designed for meditation (subsequently referred to under “meditation”), another more dynamic piece of gentle sounds (subsequently referred to under “jingles”), a piece of classic music (“classic”), and an aggressive heavy metal rock number (subsequently referred to under “rock”). For each file, the sound intensities in decibel were maintained at the same level on the computer and in the loudspeakers. During the tests, which lasted ten seconds for each experimental condition, participants were standing upright, with both eyes open in one set of trials and blindfolded in another, facing a table on which the two handles they had to grip were placed in alignment with the forearm motor axis. In the blindfolded condition, participants were made to explore the position of the handles with their two hands before starting. All subjects were instructed to grab the handles with their two hands as soon as the music started. In one of the two motion conditions, they were told to grab the handles and to hold them still in their hands while the music was playing, in the other condition they were instructed to move the handles upwards and downwards in rhythmic movements while the music was playing. The duration of the grip strength recordings (tests) was ten seconds per participant and experimental condition, which yields a total test duration of 160 s per participants. In these 160 s, with a single grip strength signal (in mV) being recorded every 20 milliseconds, 8000 grip strength signals (data points) were recorded from each of the three sensors in each of the two hands of the five participants, yielding a total of 240,000 grip strength signals (data) in this experiment. The raw data (in mV) from each of the three target sensors and for each participant and experimental condition were committed to Excel files with labelled columns.
3. Results
The range of measurements (recordings in mV) in this experiment being within the linear range of the relationship between force in grams and tension in millivolt (mV), as demonstrated by the original calibration data shown here above in Figure 2, the data analysis was performed directly on the millivolt data without transformation into grams or Newtons. The 240,000 original data are available in three sheets of an excel file (one for each of the three sensors M1, M2, and M3) with labelled lines and columns for the different experimental conditions and participants in Table S1 of the Supplementary Materials section.
3.1. Descriptive Analysis
In a first step, the individual grip strength data of the five participants were analysed as a function of the hand (“dominant” vs “non-dominant”), eye (“eyes open” vs. “eyes shut”), music (“meditation” vs. “jingles” vs. “classic” vs. “rock”), and grip style (“static” vs. “dynamic”) conditions. The results of this descriptive analysis of the raw data are shown in Figure 4, Figure 5 and Figure 6 below. The individual grip strength data reveal consistency as well inter-individual differences, with some participants deploying stronger grip strength compared with others in one and the same condition. This was to be expected given that participants were free to deploy as much or as little grip strength as they wanted, there was no instruction to grip “as hard as you can”, as is the case in standardized tests with pre-calibrated dynamometers that have to be gripped in a specific posture, sequentially with either the dominant or the dominant hand. In the experiments here, both hands were used simultaneously in either the static grip mode, where the two handles were held in both hands without movement, or in the dynamic grip mode, where the handles were moved upwards and downwards with the two hands, in regular, synchronized spontaneously produced movements.
3.1.1. Static Grip
We observe very little intra-individual variability in grip strength during static gripping, regardless of the viewing condition (eyes open vs. eyes shut) or music condition. Some participants applied consistently less force across conditions compared with others. For example, forces recorded from sensor M1 (middle phalanx of the index finger) of the individual represented by the green line in the plots (Figure 4, Figure 5 and Figure 6) are consistently the weakest across conditions in that sensor placed on the dominant hand, compared with the forces recorded from the same hand and sensor of the other individuals. In the non-dominant hand of that same individual, the forces recorded from the same sensor (M1) are generally stronger. This indicates that this individual has a spontaneously stronger static index finger grip with the dominant hand. When looking at the plots for the other two sensors (middle phalanx of the ring and middle fingers) of that same individual, the pattern is similar, revealing a stronger spontaneous static grip in the fingers of the dominant hand. The opposite is observed in the grip patterns shown in the individual data represented by the black line, which display a tendency towards a stronger spontaneous static grip across the three fingers of the non-dominant hand, bearing in mind that all participants were right-handed.
3.1.2. Dynamic Grip
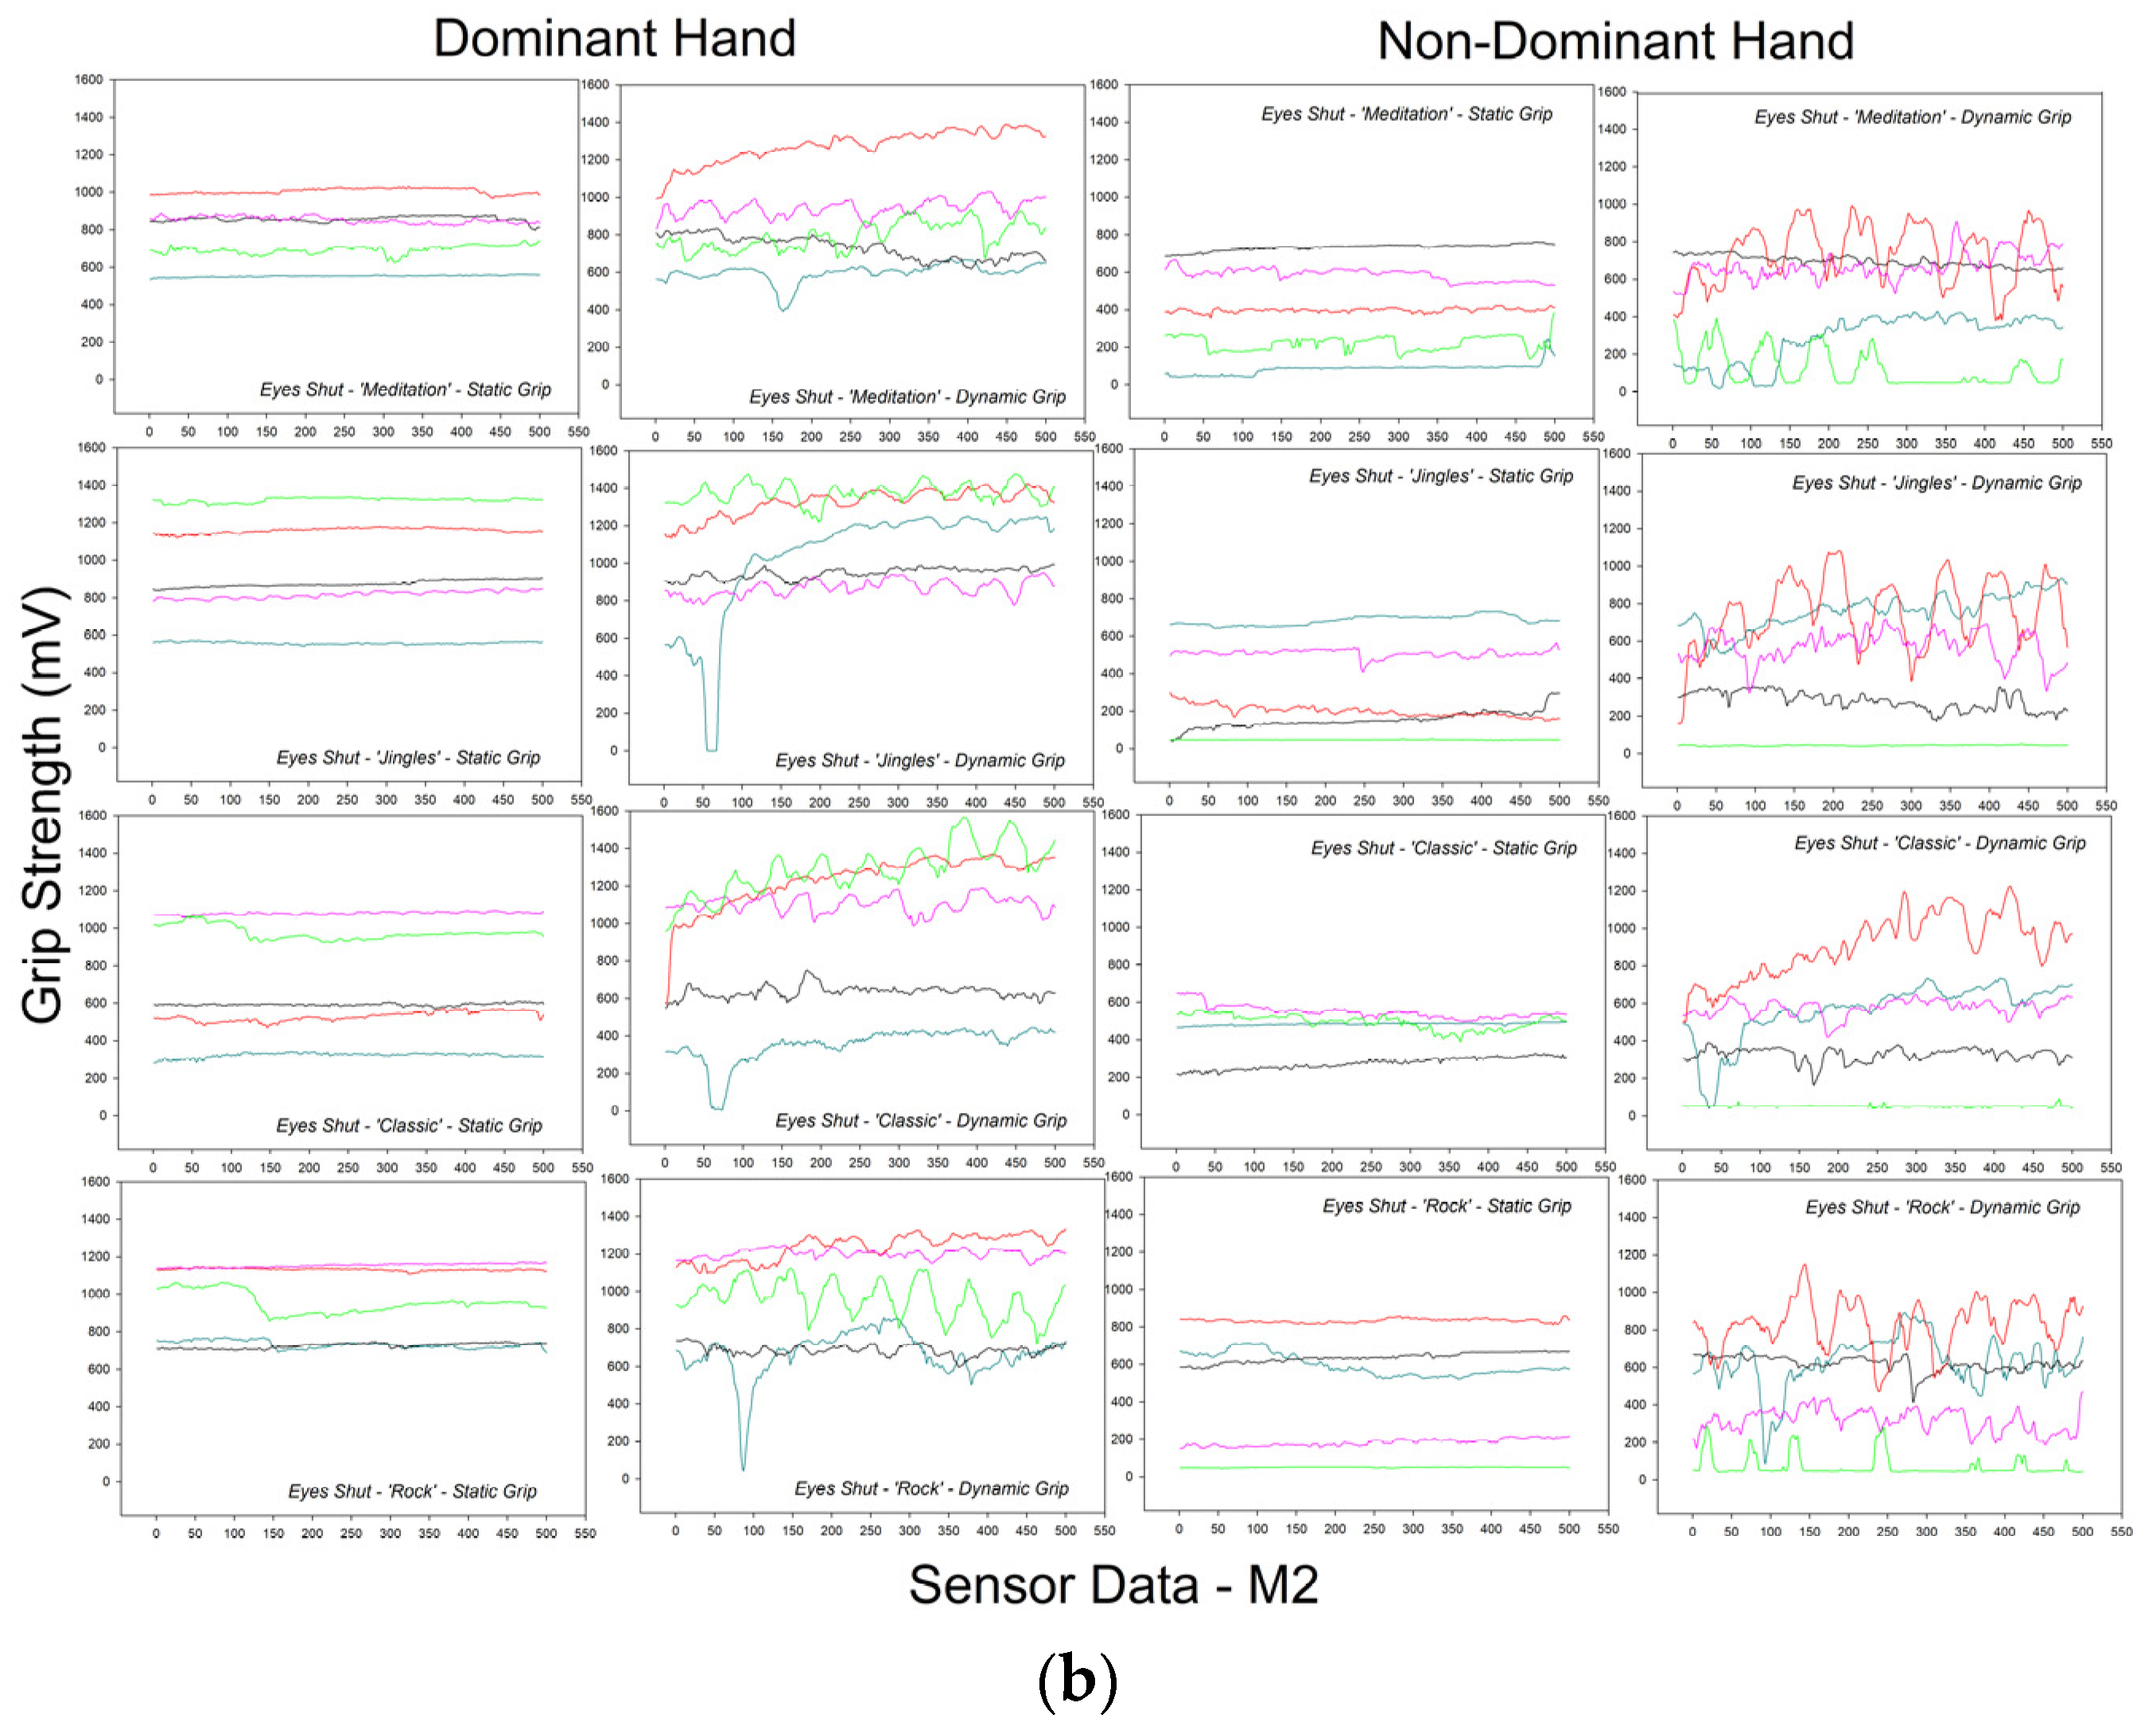
Data recorded in the dynamic grip condition display a considerably larger variability within and between participants compared with the data recorded in the static grip condition, which is coherent with the grip style deployed and was to be expected. In the single data curve, we see clear maximum-to-minimum peak spatio-temporal patterns characteristic of dynamic grip tasks [6] in the finger forces of the five individuals across experimental conditions. At a first glance on the plots, dynamic finger grip forces deployed by the dominant and non-dominant hands of the five participants do not show any systematic differences between the two hands. The dynamic grip condition is the most likely to be influenced by the ambient music factor, given that this condition involves synchronous upward and downward movements that are likely to be influenced by accompanying sounds and rhythms. Differences in grip strength as a function of the eye, music and hand factors are clearly present, but do not show clearly in the plots here, given their complexity. These require further statistical analysis. Grip signals recorded from different sensors in the same participant, hand, and experimental condition are shown to vary across sensors, in some conditions more than in others. The grip strength signals recorded from sensor M2 (Figure 5), for example, display noticeably less inter- and intra-individual variability in comparison with the signals recorded from M1 (Figure 5) and M3 (Figure 6).
To assess the magnitude (effect sizes) of effects of the different factors and their interactions and their statistical significance, an analysis of variance was performed in the next step.
3.2. Statistical Analysis
An analysis of variance (ANOVA) was implemented using the Systat 12 package software in Sigmaplot 12. A five-way ANOVA on the 480 group means (averaged data for each factorial combination) was performed for a Cartesian Analysis Plan S3 × H2 × E2 × M4 × G2 comparing the average data of five participants (random factor P5) from the three sensors recorded from the two hands across two eye, four music, and two grip conditions. The results from this analysis are shown in Table 1 and Table 2 here below.
The five-way ANOVA signals statistically significant effects of sensor position, hand, eye condition, music, and grip style, and a statistically significant interaction between sensor position (S3) and hand (H2). Given this interaction, post-hoc tests using the Holm–Sidak method were performed to determine which of the differences between means (d) for factor level combinations S3 × H2 were statistically significant. The results of these Holm–Sidak tests are shown in Table 3 here below.
In the next step, the average data were plotted graphically, with error bars, to show the direction and magnitude (effect size) of the different effects and interactions. These plots are displayed in Figure 7. They show the direction of significant interactions between the factor levels of the sensor (S3) and hand (H2) factors (Figure 7, top left), where sensor M3 on the middle phalanx of the ring finger produced significantly stronger grip strength signals in the dominant hand, while sensors M1 and M2 on the middle phalanges of index and middle fingers displayed no significant difference between the dominant and non-dominant hands. Sensor M3 produced the strongest signals, sensor M1 the weakest in the dominant, sensor M2 the weakest in the non-dominant hand (Figure 7, middle left). Significantly stronger grip signals were generated in the dynamic grip condition (Figure 7, top right), and with both eyes shut (blindfolded condition) (Figure 7, bottom). No significant interaction between the grip style and the hand, eyes, or music factors were observed. The “rock” condition produced, as might have been expected, the strongest grip signals, the “classic” music condition the weakest grip on average (Figure 7, middle right). To disentangle which of the differences between means (d) are, indeed, statistically significant across the four different levels of the music factor, further post-hoc tests using the Holm–Sidak method were performed. The results of these tests are shown in Table 4 here below. The Holm–Sidak analysis on the differences between the different levels of the music factor reveal that only the difference in means (d) observed between the “classic” and “rock” conditions is, in fact, statistically significant.
4. Discussion
Sensory awareness that fully takes into account the immediate environment is critically important to the adaptive planning and control of behaviour. When gripping objects in real world contexts, the brain does not selectively take into account the physical object properties for anticipating its temperature, sharpness, or weight but the whole context in which it is picked up and manipulated. When we grip objects with a given amount of force for lifting them, or anticipate the consequences thereof, our brain takes into account the whole sensory context at a given moment in time. Such ability is critical to our survival because it enables us to efficiently interact with complex environments that may change from moment to moment. The results of this work here reveal significant interactions between sensor positions and dominant versus non-dominant hand grip strength production in a real-world-like task and sensory context. Significantly stronger grip signals were generated in the dynamic grip condition and with both eyes shut. It is shown that sensor location, grip style, and sensory input from the eyes may critically influence grip strength in a complex task context. In addition, ambient sound had a significant effect on grip strength, with hard rock music producing the strongest grip signals. The findings are consistent with prior evidence that human manual ability and grip strength control have evolved as a function of active sensory and environmental constraints [27], in harmony with other sensory systems including the visual and the auditory senses [28]. Thus, multiple sensory sources may contribute in any ongoing task to anticipatory grip strength control [7,8,11,13,29]. Cues such as visual or auditory input play an important role in grip force scaling by stimulating feedback loops in the somatosensory brain areas [1,28,29] in a process that is critical for anticipating the shape, weight, or texture of objects we grasp [11]. Such feedback helps the development of effective motor control strategies in general. Individuals use memory representations from complex previous sensory events for grip force adjustment [13] to scale and time grip forces adaptively [29], and sensory input contributes steadily to the updating of these memory representations. Such adaptive functions permit adjusting grip forces spontaneously across different object handling tasks on the basis of memory updating and anticipatory control processes. The force with which we grasp objects is also determined by their visually perceived size, shape, and weight [7,8]. Visual as well as auditory cues may help anticipate object dynamics relating to the grip strength required for a given task [14,30]. Complex crosstalk between current sensor input and memory representations contributes to the scaling of grip forces in all motor tasks [13], where control processes may kick in to compensate for anthropometric limitations. While grip force may initially be stronger in the dominant hand, this can reverse spontaneously depending on such anthropometric limitations or the necessity of a given task and specific environmental constraints [15,16,19]. In healthy subjects [15], grip strength is fairly precisely scaled to just a little stronger than the minimum necessary to prevent an object from slipping out of the hand. Adaptive processes in finger force control during motor learning [13,31,32] explain why the contribution of each finger to overall grip strength, coarse adjustments, or finer grip force control may vary across tasks and their requirements for motor planning and execution. The index, middle, and ring fingers are deemed critical for lifting and/or manipulating weighted cylindrical objects, such as the handles in this study, in various directions [2,3,4,5,6,17,33]. The amount of force applied by each digit depends on anthropometric factors in interaction with object constraints, including where exactly the fingers or sensors are placed when picking up or manipulating an object [12,31]. In the absence of such constraints, the complex anatomy of the human hand allows for a large number of postures in the generation of adapted and stable grip modes. These functional synergies, and the complex problem of motor redundancy, have been discussed in detail elsewhere [1,12,31,32,34]. Adaptive constraints and their interaction with anthropometric factors such as hand and finger dimensions explain why sensor position is such a critical factor, as shown in this study here. Sensor M3 on the middle phalanx of the ring finger produced the strongest grip strength signals in both hands, while sensor M1 on the middle phalanx of the index finger produced the weakest signals in the dominant hand. A considerable, statistically highly significant, difference in grip strength between dominant and non-dominant hands was recorded from sensor M2 on the middle phalanx of the middle finger, where forces produced by the dominant hand were statistically as strong as those in sensor M3, while the forces produced by the non-dominant hand were the weakest by comparison with either of the other two sensors.
The sensor glove prototype used here has its own constraints, and, despite the fact that the material the sensors are sewn into stretches a bit, requirements for hand–finger dimensions within a limited range need to be fulfilled for an optimal fit generating the desired optimal positioning of the sensors. The prototype here was developed in 2017 for a highly specific purpose. New biosensor technology may help overcome limitations of this model. During the last few years, polymers for artificial sensors that emulate the properties of natural sense organs, with improved selectivity for finely tuned rapid measurement, have begun to replace classical sensors and materials [35]. Combined with nanotechnology exploiting intrinsic or extrinsic functional advantages of polymers and polymer gels [36], novel generations of biosensor devices now open promising perspectives for robotics [36] and wearable biosensor technology in general [37]. The biomechanical and neurocognitive complexity of motor programs associated with spontaneous grip force anticipation and/or deployment are highly complex. Previous studies have shown that the contribution of any given finger or region of the palm to overall grip strength, coarse adjustments, anticipatory, or fine grip force control may vary across tasks, environments, and context-specific requirements for motor planning and execution, in interaction with anthropometric factors such as hand and finger dimensions. Recent findings suggest that grip control function may be directly linked to cognitive or mental ability [38], and that grip strength could be a reliable biomarker of brain health in general [39,40]. In a cross-sectional study on 1232 participants 18 to 85 years of age from the USA [41], mean maximum grip strength values ranging from 49.7 kg for the dominant hand of young men (25 to 29 years of age) to 18.7 kg for the non-dominant hand of elderly women (75 to 79 years of age) were reported. Normal range values as a function of height, age, and weight are established on these data and used to interpret maximum grip strength measures in health or disease obtained with the same standardized device: a digital dynamometer individuals have to press as hard as they can while seated in an upright posture, with both arms by their sides, elbows flexed to 90° precisely, and forearms in a neutral position.
5. Conclusions
Here, significant interactions between finger (“sensor position”) and dominant versus non-dominant hand grip strength, as well as significant effects of ambient sound and visual input are shown, in a real-world task akin to mild weight lifting. Such factors may need to be taken into account, or controlled for, in grip strength studies, depending on the study goal. Further experiments could, for example, consist of matching sound intensities or feedback, or visual environments, to finger forces in a variety of grip tasks (functional mapping). As shown on the basis of specific individual examples in some of our earlier work [4,6], spatio-temporal grip force profiling in real time by means of wearable sensor technology, for spontaneous dynamic grip modes in particular, as suggested here, permits tracking skill evolution in specific professional settings such as manually commanded robotic tasks. In a clinical context, the same kind of non-standardized multi-digit spatiotemporal grip force profiling in real time could provide specific insights into individualized therapeutic approaches. This would include post-injury digit function recovery of professionals and experts who have to rely on finely tuned grip function, such as surgeons, for example, motor rehabilitation in general [42], or the individual evolution of grip performance in some chronic disease patterns [43].
Supplementary Materials
The following supporting information can be downloaded at: https://www.mdpi.com/article/10.3390/app14093548/s1. Table S1, original data of five participants in the different experimental conditions for the three task-relevant FRS.
Author Contributions
Conceptualization, B.D.-L., R.L. and M.d.M.; Methodology, B.D.-L. and M.d.M.; Validation, B.D.-L. and R.L.; Formal analysis, B.D.-L. and R.L.; Investigation, B.D.-L. and M.d.M.; Resources, M.d.M.; Data curation, B.D.-L. and R.L.; Writing—original draft, B.D.-L.; Writing—review & editing, B.D.-L.; Supervision, B.D.-L.; Project administration, B.D.-L.; Funding acquisition, B.D.-L. All authors have read and agreed to the published version of the manuscript.
Funding
This research received funding from the Initiative D’Excellence (IDEX) program 2020–2021 of Strasbourg University. Grant reference CF/EK/FF/CB/N 2020-204.
Institutional Review Board Statement
Ethical Approval for the study was not required since this study does not involve patients or biological specimen in any way. Student volunteers donned the glove for the study trials on voluntary basis. There is no ethics board approval required for this kind of study in France. To comply with text requirements, below you can find the official CNRS text relating to the CNRS Code of Research Ethics. https://www.insb.cnrs.fr/sites/institut_insb/files/page/2021-03/investigations%20chez%20l%27homme%20-%20notice%20explicative%20-V2021%20-%20VF3.pdf.
Informed Consent Statement
Informed consent was obtained from all subjects involved the study.
Data Availability Statement
All data from this study are available in this article.
Conflicts of Interest
The authors declare no conflicts of interest.
References
- Dresp-Langley, B. Grip force as a functional window to somatosensory cognition. Front. Psychol. 2022, 13, 1026439. [Google Scholar] [CrossRef] [PubMed]
- De Mathelin, M.; Nageotte, F.; Zanne, P.; Dresp-Langley, B. Sensors for expert grip force profiling: Towards benchmarking manual control of a robotic device for surgical tool movements. Sensors 2019, 19, 4575. [Google Scholar] [CrossRef] [PubMed]
- Dresp-Langley, B.; Nageotte, F.; Zanne, P.; de Mathelin, M. Correlating grip force signals from multiple sensors highlights prehensile control strategies in a complex task-user system. Bioengineering 2020, 7, 143. [Google Scholar] [CrossRef] [PubMed]
- Dresp-Langley, B. Wearable Sensors for Individual Grip Force Profiling. In Advances in Biosensors Reviews Volume 3; IFSA Publishing: Barcelona, Spain, 2020; pp. 107–122. [Google Scholar]
- Liu, R.; Dresp-Langley, B. Making Sense of Complex Sensor Data Streams. Electronics 2021, 10, 1391. [Google Scholar] [CrossRef]
- Liu, R.; Wandeto, J.; Nageotte, F.; Zanne, P.; de Mathelin, M.; Dresp-Langley, B. Spatiotemporal Modeling of Grip Forces Captures Proficiency in Manual Robot Control. Bioengineering 2023, 10, 59. [Google Scholar] [CrossRef] [PubMed]
- Johansson, R.S.; Cole, K.J. Sensory-motor coordination during grasping and manipulative actions. Curr. Opin. Neurobiol. 1992, 2, 815–823. [Google Scholar] [CrossRef] [PubMed]
- Jenmalm, P.; Johansson, R.S. Visual and somatosensory information about object shape control manipulative fingertip forces. J. Neurosci. 1997, 17, 4486–4499. [Google Scholar] [CrossRef]
- Borra, E.; Luppino, G. Large-scale temporo-parieto-frontal networks for motor and cognitive motor functions in the primate brain. Cortex 2019, 118, 19–37. [Google Scholar] [CrossRef]
- Buckingham, G.; Cant, J.S.; Goodale, M.A. Living in a material world: How visual cues to material properties affect the way that we lift objects and perceive their weight. J. Neurophysiol. 2009, 102, 3111–3118. [Google Scholar] [CrossRef]
- Flanagan, J.R.; Bowman, M.C.; Johansson, R.S. Control strategies in object manipulation tasks. Curr. Opin. Neurobiol. 2006, 16, 650–659. [Google Scholar] [CrossRef]
- Fu, Q.; Santello, M. Coordination between digit forces and positions: Interactions between anticipatory and feedback control. J. Neurophysiol. 2014, 111, 1519–1528. [Google Scholar] [CrossRef] [PubMed]
- Cole, K.J.; Potash, M.; Peterson, C. Failure to disrupt the ‘sensorimotor’ memory for lifting objects with a precision grip. Exp. Brain Res. 2008, 184, 157–163. [Google Scholar] [CrossRef] [PubMed]
- Gonzalez, D.A.; Dubrowski, A.; Carnahan, H. The use of auditory cues in anticipatory control of grasping forces. Mot. Control 2010, 14, 255–264. [Google Scholar] [CrossRef] [PubMed]
- Cai, A.; Pingel, I.; Lorz, D.; Beier, J.P.; Horch, R.E.; Arkudas, A. Force distribution of a cylindrical grip differs between dominant and nondominant hand in healthy subjects. Arch. Orthop. Trauma Surg. 2018, 138, 1323–1331. [Google Scholar] [CrossRef] [PubMed]
- Bohannon, R.W. Grip strength: A summary of studies comparing dominant and non-dominant limb measurements. Percept. Mot. Skills 2003, 96, 728–730. [Google Scholar] [CrossRef] [PubMed]
- Cha, S.M.; Shin, H.D.; Kim, K.C.; Park, J.W. Comparison of grip strength among six grip methods. J. Hand Surg. Am. 2014, 39, 2277–2284. [Google Scholar] [CrossRef] [PubMed]
- Fallahi, A.A.; Jadidian, A.A. The effect of hand dimensions, hand shape and some anthropometric characteristics on handgrip strength in male grip athletes and non-athletes. J. Hum. Kinet. 2011, 29, 151–159. [Google Scholar] [CrossRef]
- Li, K.W.; Yu, R. Assessment of grip force and subjective hand force exertion under handedness and postural conditions. Appl. Ergon. 2011, 42, 929–933. [Google Scholar] [CrossRef] [PubMed]
- Carson, R.G.; Holton, E. Deficits in rate of force production during multifinger tasks are associated with cognitive status. Int. J. Geriatr. Psychiatry 2022, 37. [Google Scholar] [CrossRef]
- Firth, J.A.; Smith, L.; Sarris, J.; Vancampfort, D.; Schuch, F.; Carvalho, A.F.; Solmi, M.; Yung, A.R.; Stubbs, B.; Firth, J. Handgrip strength is associated with hippocampal volume and white matter hyperintensities in major depression and healthy controls: A UK Biobank study. Psychosom. Med. 2020, 82, 3946. [Google Scholar] [CrossRef]
- Cui, M.; Zhang, S.; Liu, Y.; Gang, X.; Wang, G. Grip strength and the risk of cognitive decline and dementia: A systematic review and meta-analysis of longitudinal cohort studies. Front. Aging Neurosci. 2021, 13, 1. [Google Scholar] [CrossRef] [PubMed]
- Bohannon, R.W. Grip Strength: An Indispensable Biomarker for Older Adults. Clin. Interv. Aging 2019, 14, 1681–1691. [Google Scholar] [CrossRef] [PubMed]
- Aravena, P.; Delevoye-Turrell, Y.; Deprez, V.; Cheylus, A.; Paulignan, Y.; Frak, V.; Nazir, T. Grip force reveals the context sensitivity of language-induced motor activity during «action words» processing: Evidence from sentential negation. PLoS ONE 2012, 7, e50287. [Google Scholar] [CrossRef]
- Bakermans-Kranenburg, M.J.; van Ijzendoorn, M.H.; Riem, M.M.E.; Tops, M.; Alink, L.R.A. Oxytocin decreases handgrip force in reaction to infant crying in females without harsh parenting experiences. SCAN 2012, 7, 951–957. [Google Scholar] [CrossRef] [PubMed]
- Oldfield, R.C. The assessment and analysis of handedness: The Edinburgh inventory. Neuropsychologia 1971, 377, 97–113. [Google Scholar] [CrossRef] [PubMed]
- Young, R.W. Evolution of the human hand: The role of throwing and clubbing. J. Anat. 2003, 202, 165–174. [Google Scholar] [CrossRef] [PubMed]
- Teichert, M.; Bolz, J. How senses work together: Cross-modal interactions between primary sensory cortices. Neural Plast. 2018, 2018, 5380921. [Google Scholar] [CrossRef] [PubMed]
- Parry, R.; Sarlegna, F.R.; Jarrassé, N.; and Roby-Brami, A. Anticipation and compensation for somatosensory deficits in object handling: Evidence from a patient with large fiber sensory neuropathy. J. Neurophysiol. 2021, 126, 575–590. [Google Scholar] [CrossRef]
- Maiello, G.; Schepko, M.; Klein, L.K.; Paulun, V.C.; Fleming, R.W. Humans can visually judge grasp quality and refine their judgments through visual and haptic feedback. Front. Neurosci. 2021, 14, 591898. [Google Scholar] [CrossRef]
- Naceri, A.; Moscatelli, A.; Haschke, R.; Ritter, H.; Santello, M.; Ernst, M.O. Multidigit force control during unconstrained grasping in response to object perturbations. J. Neurophysiol. 2017, 117, 2025–2036. [Google Scholar] [CrossRef]
- Zatsiorsky, V.M.; Latash, M.L. Multifinger prehension: An overview. J. Mot. Behav. 2008, 40, 446–476. [Google Scholar] [CrossRef] [PubMed]
- Kinoshita, H.; Kawai, S.; Ikuta, K. Contributions and co-ordination of individual fingers in multiple finger prehension. Ergonomics 1995, 38, 1212–1230. [Google Scholar] [CrossRef] [PubMed]
- Latash, M.L.; Zatsiorsky, V.M. Multi-finger prehension: Control of a redundant mechanical system. Adv. Exp. Med. Biol. 2009, 629, 597–618. [Google Scholar] [CrossRef] [PubMed]
- Adhikari, B.; Majumdar, S. Polymers in sensor applications. Prog. Polym. Sci. 2004, 29, 699–766. [Google Scholar] [CrossRef]
- Zhang, Z.; Chen, G.; Xue, Y.; Duan, Q.; Liang, X.; Lin, T.; Wu, Z.; Tan, Y.; Zhao, Q.; Zheng, W.; et al. Fatigue-Resistant Conducting Polymer Hydrogels as Strain Sensor for Underwater Robotics. Adv. Funct. Mater. 2023, 33, 2305705. [Google Scholar] [CrossRef]
- Kim, J.; Campbell, A.S.; de Ávila, B.E.; Wang, J. Wearable biosensors for healthcare monitoring. Nat. Biotechnol. 2019, 37, 389–406. [Google Scholar] [CrossRef] [PubMed]
- Jiang, R.; Westwater, M.L.; Noble, S.; Rosenblatt, M.; Dai, W.; Qi, S.; Sui, J.; Calhoun, V.D.; Scheinost, D. Associations between grip strength, brain structure, and mental health in >40,000 participants from the UK Biobank. BMC Med. 2022, 20, 286. [Google Scholar] [CrossRef] [PubMed]
- Dercon, Q.; Nicholas, J.M.; James, S.N.; Schott, J.M.; Richards, M. Grip strength from midlife as an indicator of later-life brain health and cognition: Evidence from a British birth cohort. BMC Geriatr. 2021, 21, 475. [Google Scholar]
- Duchowny, K.A.; Ackley, S.F.; Brenowitz, W.D.; Wang, J.; Zimmerman, S.C.; Caunca, M.R.; Glymour, M.M. Associations Between Handgrip Strength and Dementia Risk, Cognition, and Neuroimaging Outcomes in the UK Biobank Cohort Study. JAMA Netw. Open 2022, 5, e2218314. [Google Scholar] [CrossRef]
- Wang, Y.; Bohannon, R.W.; Li, X.; Sindhu, B.; Kapellusch, J. Hand-Grip Strength: Normative Reference Values and Equations for Individuals 18 to 85 Years of Age Residing in the United States. J. Orthop. Sports Phys. Ther. 2018, 48, 685–693. [Google Scholar] [CrossRef]
- Milton, A.J.; Kwok, J.C.F.; McClellan, J.; Randall, S.G.; Lathia, J.D.; Warren, P.M.; Silver, D.J.; Silver, J. Recovery of Forearm and Fine Digit Function After Chronic Spinal Cord Injury by Simultaneous Blockade of Inhibitory Matrix Chondroitin Sulfate Proteoglycan Production and the Receptor PTPσ. J. Neurotrauma 2023, 40, 2500–2521. [Google Scholar] [CrossRef] [PubMed]
- Endo, K.; Kakisaka, K.; Kuroda, H.; Miyasaka, A.; Takikawa, Y.; Matsumoto, T. Annual changes in grip strength and skeletal muscle mass in chronic liver disease: Observational study. Sci. Rep. 2023, 13, 1648. [Google Scholar] [CrossRef] [PubMed]
Figure 1.
The three task-relevant force-sensitive resistors (FSR) of the glove system for which recordings were analysed, located on the middle phalanges of index (M1), middle (M2), and ring fingers (M3) at identical, mirror-symmetric positions of the five participants’ compatibly dimensioned dominant and non-dominant hands.

Figure 2.
Static force in grams is related by a linear function (blue line) to tension output in the range from 50 mV to 1500 mV.
Figure 2.
Static force in grams is related by a linear function (blue line) to tension output in the range from 50 mV to 1500 mV.

Figure 3.
The right-hand sensor glove in action on a robotic command console (a); design chart of the single-sensor-to-software operating system (b).
Figure 3.
The right-hand sensor glove in action on a robotic command console (a); design chart of the single-sensor-to-software operating system (b).

Figure 4.
Individual grip strength data recorded from sensor M1 in the dominant and non-dominant hands, with eyes open (a) and with eyes shut (b), in the different music and grip style conditions. Results from the five different participants are displayed in different colours in the plots.
Figure 4.
Individual grip strength data recorded from sensor M1 in the dominant and non-dominant hands, with eyes open (a) and with eyes shut (b), in the different music and grip style conditions. Results from the five different participants are displayed in different colours in the plots.


Figure 5.
Individual grip strength data recorded from sensor M2 in the dominant and non-dominant hands, with eyes open (a) and with eyes shut (b), in the different music and grip style conditions. Results from the five different participants are displayed in different colours.
Figure 5.
Individual grip strength data recorded from sensor M2 in the dominant and non-dominant hands, with eyes open (a) and with eyes shut (b), in the different music and grip style conditions. Results from the five different participants are displayed in different colours.


Figure 6.
Individual grip strength data recorded from sensor M3 in the dominant and non-dominant hands, with eyes open (a) and with eyes shut (b), in the different music and grip style conditions. Results from the five different participants are displayed in different colours in the plots.
Figure 6.
Individual grip strength data recorded from sensor M3 in the dominant and non-dominant hands, with eyes open (a) and with eyes shut (b), in the different music and grip style conditions. Results from the five different participants are displayed in different colours in the plots.


Figure 7.
Average grip strength data plotted as a function of the factor levels of the main sources of variations tested for showing the direction and magnitude of the statistically significant effects, and of the statistically significant interaction (top left) between the sensor (S3) and hand (H2) factors.


Table 1.
Results of the five-way ANOVA in terms of F values signalling significant effects of factors or interaction thereof, degrees of freedom (df) associated with the metric, and probability limits (p).
Table 1.
Results of the five-way ANOVA in terms of F values signalling significant effects of factors or interaction thereof, degrees of freedom (df) associated with the metric, and probability limits (p).
| Cartesian Analysis Plan S3 × H2 × E2 × M4 × G2 | |||
|---|---|---|---|
| Factor/Interaction | df | F | p |
| Sensor (S3) | 2/479 | 119.73 | <0.001 |
| Hand (H2) | 1/479 | 41.66 | <0.01 |
| Grip (G2) | 1/479 | 10.34 | <0.01 |
| Music (M4) | 3/479 | 3.71 | <0.05 |
| Sensor × Hand (S3 × H2) | 2/479 | 55.39 | <0.01 |
Table 2.
Results of the five-way ANOVA in terms of F values signalling non-significant (NS) effects of factors or interaction thereof, degrees of freedom (df), and probability limits (p).
Table 2.
Results of the five-way ANOVA in terms of F values signalling non-significant (NS) effects of factors or interaction thereof, degrees of freedom (df), and probability limits (p).
| Cartesian Analysis Plan S3 × H2 × G2 × M4 × E2 | |||
|---|---|---|---|
| Factor/Interaction | df | F | p |
| Eyes (E2) | 1/479 | 0.39 | <0.54 NS |
| Hand × Eyes (H2 × E2) | 1/479 | 0.02 | <0.89 NS |
| Grip × Eyes (G2 × E2) | 1/479 | 0.13 | <0.72 NS |
| Music × Eyes (M4 × E2) | 3/479 | 0.22 | <0.89 NS |
| Sensor × Eyes (S3 × E2) | 2/479 | 0.27 | <0.77 NS |
| Sensor × Grip (S3 × G2) | 2/479 | 0.99 | <0.38 NS |
| Hand × Grip (H2 × G2) | 1/479 | 0.05 | <0.83 NS |
| Sensor × Music (S3 × M4) | 6/479 | 0.51 | <0.81 NS |
| Grip × Music (G2 × M4) | 3/479 | 0.48 | <0.70 NS |
| Hand × Music (H2 × M4) | 3/479 | 0.59 | <0.62 NS |
Table 3.
Results of the Holm–Sidak post-hoc comparisons for interactions between H2 and S3.
| Comparison | d | t | p (Unadj.) | Threshold | Significance |
|---|---|---|---|---|---|
| hand factor in sensor M1 | |||||
| dominant vs. non | 52.73 | 1.36 | <0.18 | 0.050 | no |
| hand factor in sensor M2 | |||||
| dominant vs. non | 476.74 | 12.27 | <0.001 | 0.050 | yes |
| hand factor in sensor M3 | |||||
| dominant vs. non | 10.42 | 0.27 | <0.79 | 0.050 | no |
Table 4.
Results of the Holm–Sidak post-hoc comparisons for factor differences between levels of the music factor M4.
Table 4.
Results of the Holm–Sidak post-hoc comparisons for factor differences between levels of the music factor M4.
| Comparison | d | t | p (Unadj.) | Threshold | Significance |
|---|---|---|---|---|---|
| ‘rock’ vs. ‘classic’ | 115.61 | 3.17 | <0.002 | 0.009 | yes |
| ‘jingles’ vs. ‘classic’ | 87.45 | 2.40 | <0.017 | 0.010 | no |
| ‘meditation’ vs. ‘classic’ | 54.65 | 1.50 | <0.135 | 0.017 | no |
| ‘rock’ vs. ‘meditation’ | 60.96 | 1.67 | <0.095 | 0.013 | no |
| ‘jingles’ vs. ‘meditation’ | 32.797 | 0.90 | <0.369 | 0.025 | no |
| ‘rock’ vs. ‘jingles’ | 28.17 | 0.77 | <0.440 | 0.050 | no |
Disclaimer/Publisher’s Note: The statements, opinions and data contained in all publications are solely those of the individual author(s) and contributor(s) and not of MDPI and/or the editor(s). MDPI and/or the editor(s) disclaim responsibility for any injury to people or property resulting from any ideas, methods, instructions or products referred to in the content. |
© 2024 by the authors. Licensee MDPI, Basel, Switzerland. This article is an open access article distributed under the terms and conditions of the Creative Commons Attribution (CC BY) license (https://creativecommons.org/licenses/by/4.0/).
Share and Cite
MDPI and ACS Style
Dresp-Langley, B.; Liu, R.; de Mathelin, M. Sensory Factors Influence Dynamic and Static Bi-Manual Finger Grip Strength in a Real-World Task Context. Appl. Sci. 2024, 14, 3548. https://doi.org/10.3390/app14093548
AMA Style
Dresp-Langley B, Liu R, de Mathelin M. Sensory Factors Influence Dynamic and Static Bi-Manual Finger Grip Strength in a Real-World Task Context. Applied Sciences. 2024; 14(9):3548. https://doi.org/10.3390/app14093548
Chicago/Turabian StyleDresp-Langley, Birgitta, Rongrong Liu, and Michel de Mathelin. 2024. "Sensory Factors Influence Dynamic and Static Bi-Manual Finger Grip Strength in a Real-World Task Context" Applied Sciences 14, no. 9: 3548. https://doi.org/10.3390/app14093548
Note that from the first issue of 2016, this journal uses article numbers instead of page numbers. See further details here.