Research of Park and Ride Parking Spaces Tiered Pricing Methodology Based on Subway Ride Distance


1
Faculty of Urban Construction, Beijing University of Technology, Beijing 100124, China
2
Beijing Key Laboratory of Traffic Engineering, Beijing University of Technology, Beijing 100124, China
*
Author to whom correspondence should be addressed.
Appl. Sci. 2024, 14(9), 3550; https://doi.org/10.3390/app14093550
Submission received: 21 March 2024
/
Revised: 18 April 2024
/
Accepted: 19 April 2024
/
Published: 23 April 2024
(This article belongs to the Section Transportation and Future Mobility)
Abstract
:Park and Ride (P&R) as a demand management tool has the effect of reducing traffic congestion in urban centers, saving energy and reducing pollutant emissions. Since 2000, many cities in China have been constructing P&R facilities, which have partially alleviated urban traffic congestion and provided a time-reliable mode of travel for commuters heading to urban centers. However, in recent years, due to the pricing policy of the P&R facility, there has been an insufficient supply of P&R facilities in many places. In fact, the P&R system prefers to welcome travelers who make long-distance subway rides and does not want those who make short-distance subway rides to occupy more parking spaces. To address this, this paper proposes a tiered pricing strategy that considers charging parking fees based on the distance traveled by commuters after switching to public transportation, to improve the utilization of P&R. That is, charge less for parking for long-distance subway riders and more for short-distance subway riders. Firstly, based on questionnaire data from SP surveys, a fixed pricing mixed logit model (FP model) and a tiered pricing mixed logit model (TP model) for P&R facilities are constructed. Utilizing two models, we explored the mechanisms underpinning traveler’s mode choice influenced by daily habits and travel considerations through the comparison of the two models to validate the effectiveness of the tiered pricing for P&R facilities. The study found that the implementation of a tiered pricing method for P&R facilities increases its attractiveness to long-distance subway ride travelers, resulting in a higher proportion of long-distance subway riders among P&R commuters. In the study’s last section, a marginal effect analysis was conducted on the per-kilometer cost (Pkm) within the P&R model. This analysis determined the optimal Pkm for three subway travel distances within the P&R model. Consequently, it calculated the corresponding P&R parking fees for these three subway travel distances. Additionally, we have predicted the implementation effects of the tiered pricing scheme.
1. Introduction
The expansion of urbanization and economic growth has given rise to an escalating need for travel, thereby magnifying the urgency of resolving transportation challenges in many cities. This predicament is particularly pronounced within urban core zones, where severe road congestion and a dearth of parking spaces significantly impede daily routines. The P&R travel paradigm, initially introduced by American scholar Austin MacDonald as a strategic demand management tool, encourages commuters to initially drive to city peripheral transfer parking facilities before seamlessly transitioning to subway or bus services for the following journey. This approach aims to curtail the volume of inner-city car trips, thereby alleviating traffic congestion and ameliorating the strain on parking resources. The travel illustration is shown in Figure 1. Conclusive findings from academic investigations conducted in the United Kingdom and Hong Kong underscore the practical efficacy of the P&R model in ameliorating traffic congestion [1,2,3]. A striking illustration can be observed in Oxford, where the establishment of a P&R system has elicited a notable 20% reduction in vehicular journeys originating from the circumferential ring road and destined for the city center [4]. Since the 1960s, the P&R model has gained widespread traction in cities across the globe. Scholars from various nations have undertaken comprehensive research to refine the implementation of the P&R model. Some researchers have delved into optimizing the placement of P&R facilities. With the objective of covering as much potential demand as possible with P&R facilities, as close as possible to major roads, a multi-objective spatial optimization model was developed, taking into account the existing transport system [5]. Felipe Aros-Vera built a hybrid linear program to maximize the utility of fixed quantity facilities [6]. Joana Cavadas has established a P&R facility site selection model with the objective of minimizing car use in urban areas [7]. Furthermore, an array of studies has proactively prognosticated the post-construction demand for P&R facilities, to better scale P&R facilities [5,8,9,10,11].
With the global proliferation of P&R facilities, scholars have begun to look at the selection behavior of P&R facilities and the current status of facility usage as an entry point for exploring ways to maximize the use of existing P&R facilities [12]. Through a comparative analysis of the two main P&R facility sites in Kuala Lumpur, Norlida Abdul Hamid revealed that travelers using P&R facilities are predominantly long-term users [13]. Through interviews, Arne Risa Hole perceived that parking restrictions downtown would increase P&R usage [14]. Ibrahim A.N.H found that trust positively affects attitudes toward using P&R facilities and perceived behavioral control, while perceived behavioral control positively affects intent to use P&R facilities, thus advocating increased reliability of P&R facilities [15]. By analyzing travelers’ personal characteristics and driving travel barriers on the choice of P&R modality, Baohong He considers that an increase in age and driving experience negatively affects travelers’ choice of P&R mode, while traffic congestion and a lack of parking in downtown areas boosts people’s P&R use [16]. In Poland, scholars have meticulously probed the existing usage of P&R parking, extending prior research through the application of multinomial logit models to unravel the drivers underpinning the park-and-ride selection process [17], and found that most users of P&R facilities are commuters with relatively low holiday usage, while travel time is the most important factor for users of P&R facilities [18]. Shahi Taphsir Islam studied the effects of travel costs and travel time on P&R choices and found that transfer times and parking prices significantly affect people’s choices [19]; Xiaopeng Shen reached similar conclusions after a model study of a Beijing subway station [20]. In summary, factors affecting travelers’ mode choice include individual-related variables such as age, gender, and underlying psychological factors and travel mode-related variables such as time, price, and road traffic conditions. Among these, parking prices is a key factor in regulating the effectiveness of P&R facilities [21]. Therefore, it is important to understand the role of parking prices in regulating P&R use.
Some scholars have studied P&R site selection and parking fee strategies with the goals of maximizing profits and minimizing costs [22,23]. In Vancouver, Habib K.N. conducted an SP survey among users of P&R facilities, through an analysis of parking cost elasticity, it was discerned that an escalation in parking fees at transfer stations would likely lead current P&R users to shift their preference towards utilizing public transportation [24]. Hua Wang’s research focused on the optimal pricing method for P&R networks with multiple starting points and a single destination under limited parking supply at the destination [25]. In Xiaopeng Shen’s research based on factors impacting travelers’ mode selection, with construction costs and reducing pollution emissions as optimization objectives, an optimal P&R parking fee policy and construction location model was established [20]. Jing Wang investigated strategies for combining parking charges and destination parking restrictions in a P&R network, and it was found that parking permits reduced system costs by eliminating competition for insufficient parking spaces, and that a management scheme combining parking permits and parking charges outperformed a management scheme using only parking charges [21]. P&R facilities face supply shortages in San Francisco. Sarah Syed examined how travelers react to the introduction of parking fee policies in P&R services, and found that the implementation of fees increases the availability of parking spaces without causing significant shifts in travel mode preferences. Moreover, as P&R facilities’ service quality was enhanced, the majority of travelers seemed more inclined to accept the introduction of new fees [26].
However, most of the previous studies on P&R are based on the local transportation status quo, and the research optimization methods are not sufficient to solve the problems faced by P&R facilities in China. As the world’s most populous country, China’s residents have an even greater need to travel, and the problem of insufficient parking is even more pronounced. Chinese scholars have studied P&R in China and found that the inadequate supply of P&R parking facilities has resulted in a large amount of unmet demand for interchange parking [27,28,29,30]. Ange Wang believes that on-street parking for short-term and temporary parking and P&R facilities for longer-term parking is a more scientific way of parking [31]. KeKe Liang analyzes the short supply of P&R facilities, analyzing the daily evolution pattern of P&R facility saturation to guide travelers in making rational travel choices [32]. Furthermore, Hongzhi Guan analyzes the responses of P&R travelers following unsuccessful transfer parking endeavors and proposes a strategy involving secondary transfers to nearby public parking lots to alleviate the oversupply of P&R facilities [33]. Using parking facilities other than P&R to increase the parking supply is not a lasting solution to the problem. The parking pricing policy for P&R facilities has led to excessive demand. This paper considers that the positive impact of P&R facilities on urban transport, whether easing urban traffic congestion, reducing carbon emissions or boosting suburban public transport revenues, is positively correlated with the distance travelled by cars, which is reduced by the P&R travel process. Combined with China’s current situation of an oversupply of P&R parking spaces, we believe that when the proportion of long-distance and medium-distance subway ride P&R users among all P&R users increases, the travelling distances of cars will be reduced, which in turn will enhance the role of P&R facilities in relieving traffic congestion. Therefore, we attempt to propose a tiered pricing methodology for P&R facilities based on subway ride distance to enhance the effectiveness of P&R facilities and to alleviate the problem of oversupply of P&R parking spaces from a demand management perspective. Firstly, we designed and distributed a P&R travel SP survey questionnaire, and then based on the questionnaire data, we investigated the travel mode choice behavior of travelers using a four-mode transport network of cars, P&R, public transport and taxis, with different total travel distances. We explored how variables spanning travel attributes, personal characteristics, daily travel habits, and travel considerations impacted mode preferences through a comparative analysis of the two models. Ultimately, the marginal effect of the P&R mode per kilometer cost (Pkm) was calculated, and the optimal Pkm of P&R mode was determined for the three subway ride distances, which was converted to obtain the P&R parking fee for the three subway ride distances.
2. Materials and Methods
2.1. Survey Design
The survey questionnaire employed an SP survey approach, encompassing three primary segments: Current Status of P&R Travel, Mode Choice Preferences, and Personal Characteristics Survey. To enhance the credibility of the data, an illustrative depiction of P&R services was presented before the commencement of formal questioning, ensuring that respondents without prior P&R travel exposure could grasp a lucid understanding of P&R services.
The questionnaire was made public on platforms such as WeChat and Questionnaire Star and was used to collect data. Interested viewers could click on the link to fill out the questionnaire, and in order to be able to collect enough data, after verifying the validity of the questionnaire, we offered a cash incentive to the respondents who completed the questionnaire. The questionnaire survey lasted for two weeks, from 16 March to 30 March 2023. A total of 711 questionnaires were collected, with 592 valid responses, resulting in an effective response rate of 83.3%. The sources of questionnaire data are illustrated in Figure 2. Data analysis results indicate that fewer than 42% of the respondents had engaged in P&R travel. The initial section of the questionnaire focused on the current status of P&R travel. It included questioning whether respondents had previous P&R travel experience, the purposes of their trips, and the relative importance of several factors influencing their travel choices. These factors encompassed travel time, P&R parking fees, travel comfort, road traffic conditions, and more. Furthermore, respondents with prior P&R travel experiences were specifically queried about their most recent P&R travel encounter.
The questionnaire’s section Mode Choice Preferences is a central focus of this study. We designed this part with an orthogonal arrangement involving two parking pricing options for P&R facilities (fixed and tiered) and three total travel distances: short (4 km), medium (10 km), and long (20 km). Within these settings, we presented respondents with ten scenario-based questions [34]. Each scenario offered four travel choices: private car, metro, taxi, and P&R services. To simplify the scenario, we assumed that all car trips headed to a public parking lot near their destination for parking. A schematic diagram of the scenario is depicted in Figure 3.
Participants were informed about the travel attributes associated with each mode, including travel time, costs, walking/cycling distance, and the likelihood of available parking spaces at the P&R facility. In order to align the attributes as closely as possible with real-world scenarios, we determined the settings of some of the attributes that could be observed such as parking cost and walking distance by means of a field survey. The rest of the attributes such as fuel cost and travelling speed were determined by reviewing the relevant information and literature. The set rules are outlined in Table 1. It should be noted that under the tiered pricing strategy, a significant increase in parking prices caused some travelers to stop travelling by P&R [24], which in turn caused the probability of there being an available parking space in P&R to rise. However, the interviewees in this study have not experienced P&R trips under the tiered pricing strategy. To help them make a more accurate judgement, we drew on P&R parking demand survey data and the price elasticity of P&R parking demand from previous studies [33,35]. Using the formula (probability of having an available parking space in P&R = P&R parking demand/number of P&R parking spaces) we set the probability of there being an available parking space in P&R in our scenarios to be 50% under the fixed pricing strategy and 90% under the tiered pricing strategy.
The final section of the questionnaire inquired about the respondents’ personal attributes, including their preferred modes of daily travel and socio-economic characteristics such as gender, age, occupation, driving experience, household income, and number of household vehicles.
2.2. Statistical Analysis
The SP questionnaire data provided information related to individual respondents such as daily travel habits, individual characteristics and information related to travel modes such as distance travelled and cost of travel. Based on this information and the factors identified in previous studies as having a serious impact on travel mode choice behavior, the model variables were selected as shown in Table 2.
Given that the independent variables encompass two types, the most suitable statistical approach is the mixed logit model. Therefore, both the FP model and the TP model in this paper are modeled using the mixed logit model, and the difference between the two models lies in the different travel attributes in the corresponding scenario of the questionnaire; the setting rules are shown in Table 1.
In different choice scenarios, each respondent n (n = 1, 2, …, N) can preferentially choose one out of four modes of travel m (m = 1, 2, …, M). These individual preferences culminate in a preferred combination Cn = {m1, m2, …, mM}. Each element in combination Cn, denoted as mM, represents a binary choice. If mode m is selected by traveler n, m = 1; otherwise, m = 0.
Hence, this paper establishes two preference models for mode selection based on fixed and tiered pricing methods. These models predict the probabilities of different modes of travel being chosen by travelers across various travel distances.
Defining the utility function , representing respondent n’s preference for travel mode m, can be expressed as follows:
In this equation, represents the deterministic term, which depends on parameters , and conforms to a general normal distribution (GND), used to indicate the heterogeneity of each traveler [36], while denotes the stochastic term. The deterministic term’s utility function comprises and , and are model attribute explanatory variables whose coefficients are the stochastic parameters . are variables other than model attribute explanatory variables in Table 2. For individual characteristics, daily travel habits and travel consideration explanatory variables, their coefficients are unknown parameter .
The overall utility function of traveler n’s travel mode choice preference combination Cn can be expressed as Equation (2):
Assuming the error term follows a Gumbel distribution and conditional on β = , the probability that individual n will choose among all possible preference combinations can be written in the usual multinomial logit form [37]:
The unconditional probability can be subsequently obtained as Equation (4):
In this equation, is the density function for the random distribution of , and is the vector of parameters that define the density function.
In the verification phase of the tiered pricing strategy, the effectiveness of the implementation is assessed using two indicators: the proportion of different subway ride distances of P&R users δ and the average revenue per parking session Wp at P&R facilities. δ represents the proportion of individuals using P&R facilities for a specific public transportation ride distance relative to the entire population of P&R facility users. Wp represents the average revenue generated per parking spot at a P&R facility per parking session.
θgj represents the proportion of users for three different subway ride distances under the fixed pricing strategy (θjj represents the proportions under the tiered pricing strategy). Pgi represents the probability of choosing the P&R travel mode under the fixed pricing strategy (Pjj represents the probability under the tiered pricing strategy), where g and j denote different pricing models, and i represents various subway ride distances. Then, the ratio δi of the demand of different subway ride distances to the total demand is calculated as in Equation (5):
The percentage of users of each subway ride distance θjj under the stepped fare model is calculated as in Equation (6):
The formula for obtaining the average revenue Wp for a single vehicle stop is given in Equation (7); pi represents the P&R car parking pricing for each subway ride distance under the tiered pricing strategy.
3. Results and Discussion
In the process of establishing two mixed logit models, it is essential to account for the pronounced correlation between travel costs and the overall travel distance. To mitigate the distorting effect of travel distance on the cost analysis, the modeling will be based on the concept of the travel per kilometer cost (Pkm). Additionally, the probability of there being an available parking space in a P&R facility solely relates to the parking fee strategy of the P&R facility. As a result, when constructing the FP model and the TP model separately, this variable’s standard deviation will be 0, and, therefore, it has not been integrated as a contributing factor in the model. However, the influence of this factor will be considered during the comparative discussion of the two models. Employing stepwise regression, the mixed logit models underwent a refinement process. Variables lacking statistical significance at the 0.1 threshold were pruned, culminating in the selection of 14 pertinent explanatory variables for fitment within the two mixed logit models. The final segment of the study quantitatively examines the impact of P&R fees on commuters across varying travel distances by calculating the marginal effects of the P&R facility Pkm. Subsequently, based on specific principles, it offers tiered pricing recommendations and predicts their implementation outcomes.
3.1. Factor Analysis
In establishing the mixed logit model, the choice of the P&R mode is used as a reference group to fit the preferences for car, metro, and taxi options. The fitted coefficients indicate the preference for choosing a certain transportation mode relative to the P&R mode under the influence of explanatory variables. The McFadden’s R2 values for the two models, respectively, stand at 0.247 and 0.201, underscoring the models’ robust goodness of fit. In presenting the results, this paper will showcase the goodness-of-fit tests for the models, along with the modeling outcomes for mode attributes and individual characteristics, daily travel habits, and travel considerations. These findings will be presented in Table 3, Table 4 and Table 5, respectively. Furthermore, a separate discussion of the results will be provided for each category.
3.1.1. Individual Characteristics
Table 3 presents the goodness-of-fit tests and findings pertaining to mode attributes and individual characteristics. It can be observed that the insignificance of Pkm fitting is apparent in the FP model, while in the TP model, the fitted coefficient for Pkm is negative. This phenomenon might arise from the fact that, under the fixed pricing mode, the P&R travel costs remain largely unchanged, causing respondents to take other factors into account more in making their travel decisions. In the TP model, travelers’ choices are adversely affected by the negative impact of Pkm. Both models consistently feature negative coefficients in relation to the total walking distance variable. This could be because walking represents a slow speed and less serviced mode of travel. As such, it is natural for most travelers to seek to minimize prolonged walking distances in the course of their journeys. The fitting coefficients of gender, occupation, and travel purpose exhibit no significant distinction between the two models. In the context of gender, negative coefficients are associated with metro and taxi choices, while the coefficient corresponding to car usage lacks statistical significance. This indicative pattern suggests a prevailing trend: female travelers exhibit a preference for taxi and metro alternatives over the P&R mode, while their male counterparts are more inclined towards P&R or car travel. This divergence might potentially be attributed to a greater fondness among male travelers for the act of driving itself. The presence of a stable job has a negative impact on the preference for the metro in the FP model. However, in the TP model, a stable job negatively affects the preference for the metro and positively affects the preference for cars and taxis. The fitting coefficients for travel purpose yield positive values across both models, underscoring a clear trend. This reveals that the P&R mode resonates predominantly with travelers embarking on official duties or daily commutes. Conversely, leisure and recreational travelers manifest a proclivity for alternative transportation modes beyond the P&R. This distinction can be attributed to the distinct exigencies of diverse travel intents. Commuters and those engaged in official obligations prioritize efficiency and punctuality, with their paramount concern being reaching their destinations in a timely manner. Driving a car in suburban areas and utilizing P&R for commuting to densely populated urban centers by the subway precisely caters to the requirements of commuters and business travelers. In contrast, travelers seeking leisure and recreational pursuits exhibit a heightened sensitivity to the experiential aspects of their journey. The intermediate mode shift in the P&R approach might potentially disrupt their travel experience. The overall travel distance has a positive impact on travelers’ preferences for choosing metro and car travel, while negatively affecting their preference for taxi travel in the FP model. Differently, in the TP model, travelers’ preferences for all three modes of travel are negatively impacted. This indicates that within the fixed pricing mode, an increase in travel distance corresponds to a stronger preference among travelers for the metro, followed by car travel, and the weakest preference for taxi travel. However, in the tiered pricing mode, an extended travel distance leads to an intensified preference for the P&R mode, and the weakest preference was still taxi travel. This demonstrates the effectiveness of the tiered pricing mode in regulating the proportion of commuters at varying subway ride distances. It successfully encourages a greater number of long-distance subway ride travelers to opt for P&R facilities, thereby enhancing the overall effectiveness of such facilities.
3.1.2. Daily Travel Habits
Table 4 displays the fitted outcomes, illustrating the impact of daily travel habits on preferences for transportation modes. By querying respondents about their customary travel methods, travelers were categorized into four groups based on their habitual choices: the “C” group, consisting of those who primarily engage in driving for their daily commuting; the “T” group, consisting individuals with a habitual preference for taxis; the “P” group, consisting those who mainly utilize public transportation; and the “W” group, consisting of travelers who opt for walking or cycling. This categorization offers insights into the connections between habitual behaviors and mode preferences for travel.
The results revealed that individuals who habitually choose walking or cycling for their daily travel demonstrate a more neutral mode preference in the scenario-based survey section. Hence, we incorporated the W group as a control variable for model fitting. Within the FP model, the preference coefficient for the metro among individuals categorized as the “C” group exhibits a negative value. Conversely, the coefficients for preferences towards car and taxi travel are positive. However, under the TP model, the “C” group display negative preference coefficients across all three travel modes. This indicates that under a fixed pricing strategy, the “C” group remains inclined towards car or taxi travel, displaying limited motivation to transition to the P&R mode. Nevertheless, with the introduction of a tiered pricing structure, the “C” group demonstrates a pronounced interest in the P&R mode. Their inclination towards the P&R mode outstrips preferences for all other three transportation modes. This phenomenon could be attributed to the prevailing traffic congestion in urban areas of China and the state of P&R parking facilities. The exceptionally high population density and the abundance of motor vehicles have led to profound road congestion issues in Chinese cities. Consequently, driving often consumes a substantial amount of time due to traffic bottlenecks. While the original intent behind establishing P&R facilities was to provide car users with an alternative route to bypass congestion and reach their destinations more expediently, the fixed pricing strategy has led to an overwhelming demand for many P&R parking lots. The limited availability of parking spaces has perpetuated the “C” group’s travelers towards car travel. The tiered pricing strategy regulates prices to decrease the parking demand for travelers with shorter subway ride distances. This reduction in demand enhances the likelihood of available parking spaces at P&R facilities, providing assurance for the “C” group to efficiently and promptly reach their destinations. Consequently, this encourages the “C” group to choose the P&R mode of travel under the tiered pricing scheme. The “T” group strongly favors taxi travel in both pricing models, with fitted coefficients of 2.819 in the FP model and 1.542 in the TP model. This signifies that under the fixed pricing strategy, the likelihood of the “T” group opting for taxi travel is nearly 17 times higher than that of choosing the P&R mode and nearing 5 times under the tiered pricing strategy. This suggests the “T” group is exceptionally persistent, showcasing a resounding choice of their established daily travel routines. Within the fixed pricing strategy, the “P” group demonstrates a favorable inclination towards PT travel. Simultaneously, this group displays a disinclination towards car travel. Transitioning to the tiered pricing strategy, the “P” group reveals a negative preference for both car and taxi travel. This observed pattern aligns seamlessly with the tendency of “P” users to opt for environmentally conscious and budget-friendly public transportation alternatives. Of particular interest, the “P” group’s response in the FP model yields a fitted coefficient of −1.054 for private car travel, a value lower than the −0.860 derived from the TP model. This discrepancy indicates that, under the tiered pricing strategy, the “P” group’s preference for the P&R mode is comparatively weaker than their preference under the fixed model. This nuanced shift might be attributed to the “P” group’s pursuit of economic frugality, as the tiered pricing strategy escalates the cost associated with the P&R mode.
3.1.3. Travel Consideration
Table 5 displays the fitted results, showcasing how travel considerations influence mode preference. In this section, travelers can be categorized using four classification methods based on whether they take specific factors into consideration during their journeys. The “PP” group, emphasizing parking costs; the “SW” group, valuing seasonal and weather conditions; the “CF” group, focusing on comfort; and the “PS” group, considering the availability of P&R parking spaces.
The results revealed that the PP group shows a greater inclination towards choosing the P&R mode of travel compared to the other three modes in the fixed pricing scheme. Under the tiered pricing scheme, the PP group leans towards selecting the P&R mode over the private car mode. This group’s heightened focus on parking prices to some extent signifies their inclination towards economically viable travel choices. The consistently low travel cost associated with the P&R mode in both pricing models provides a plausible rationale for the “PP” group’s preference for this mode of travel. Within the TP model, the “SW” group’s fitted preference for taxi travel is not statistically significant; however, these data have been retained for comparative analysis. Notably, under both pricing models, the “SW” group displays a consistently stronger preference for private car and taxi travel over the P&R mode. Intriguingly, preserving the non-significant fitted outcome of the “CF” group’s preference for taxi travel in the FP model results in a preference pattern strikingly similar to that of the “SW” group. This implies that, within travelers’ perceptions, the comfort and weather resilience of the P&R mode appear relatively inferior when compared to private car and taxi travel. This corresponds to reality, particularly during transfers from P&R parking facilities, and the journey from the subway station to the destination lacks adequate assurance. In the fixed pricing strategy, the “PS” group tends to favor taxi travel over the P&R mode, while conversely, under the tiered pricing strategy, they exhibit a leaning towards the P&R mode over both private car and taxi travel. This marked divergence in preference between the two models emerges as a consequence of disparities in P&R parking space availability. The decision making process of the “PS” group places significant weight on the presence of accessible parking spaces when contemplating the adoption of the P&R mode. The increased availability of P&R parking spaces under the tiered pricing strategy acts as a draw for the “PS” group towards selecting the P&R mode for their travel. In other words, numerous travelers within the PS group are compelled to opt for alternative modes of transportation due to inadequate availability of P&R parking spaces. This observation resonates with the initial conjecture put forth in this study, which posited that the insufficiency of P&R parking spaces might drive numerous travelers to forgo the P&R mode in favor of alternative transportation options.
3.2. Marginal Effects Analysis
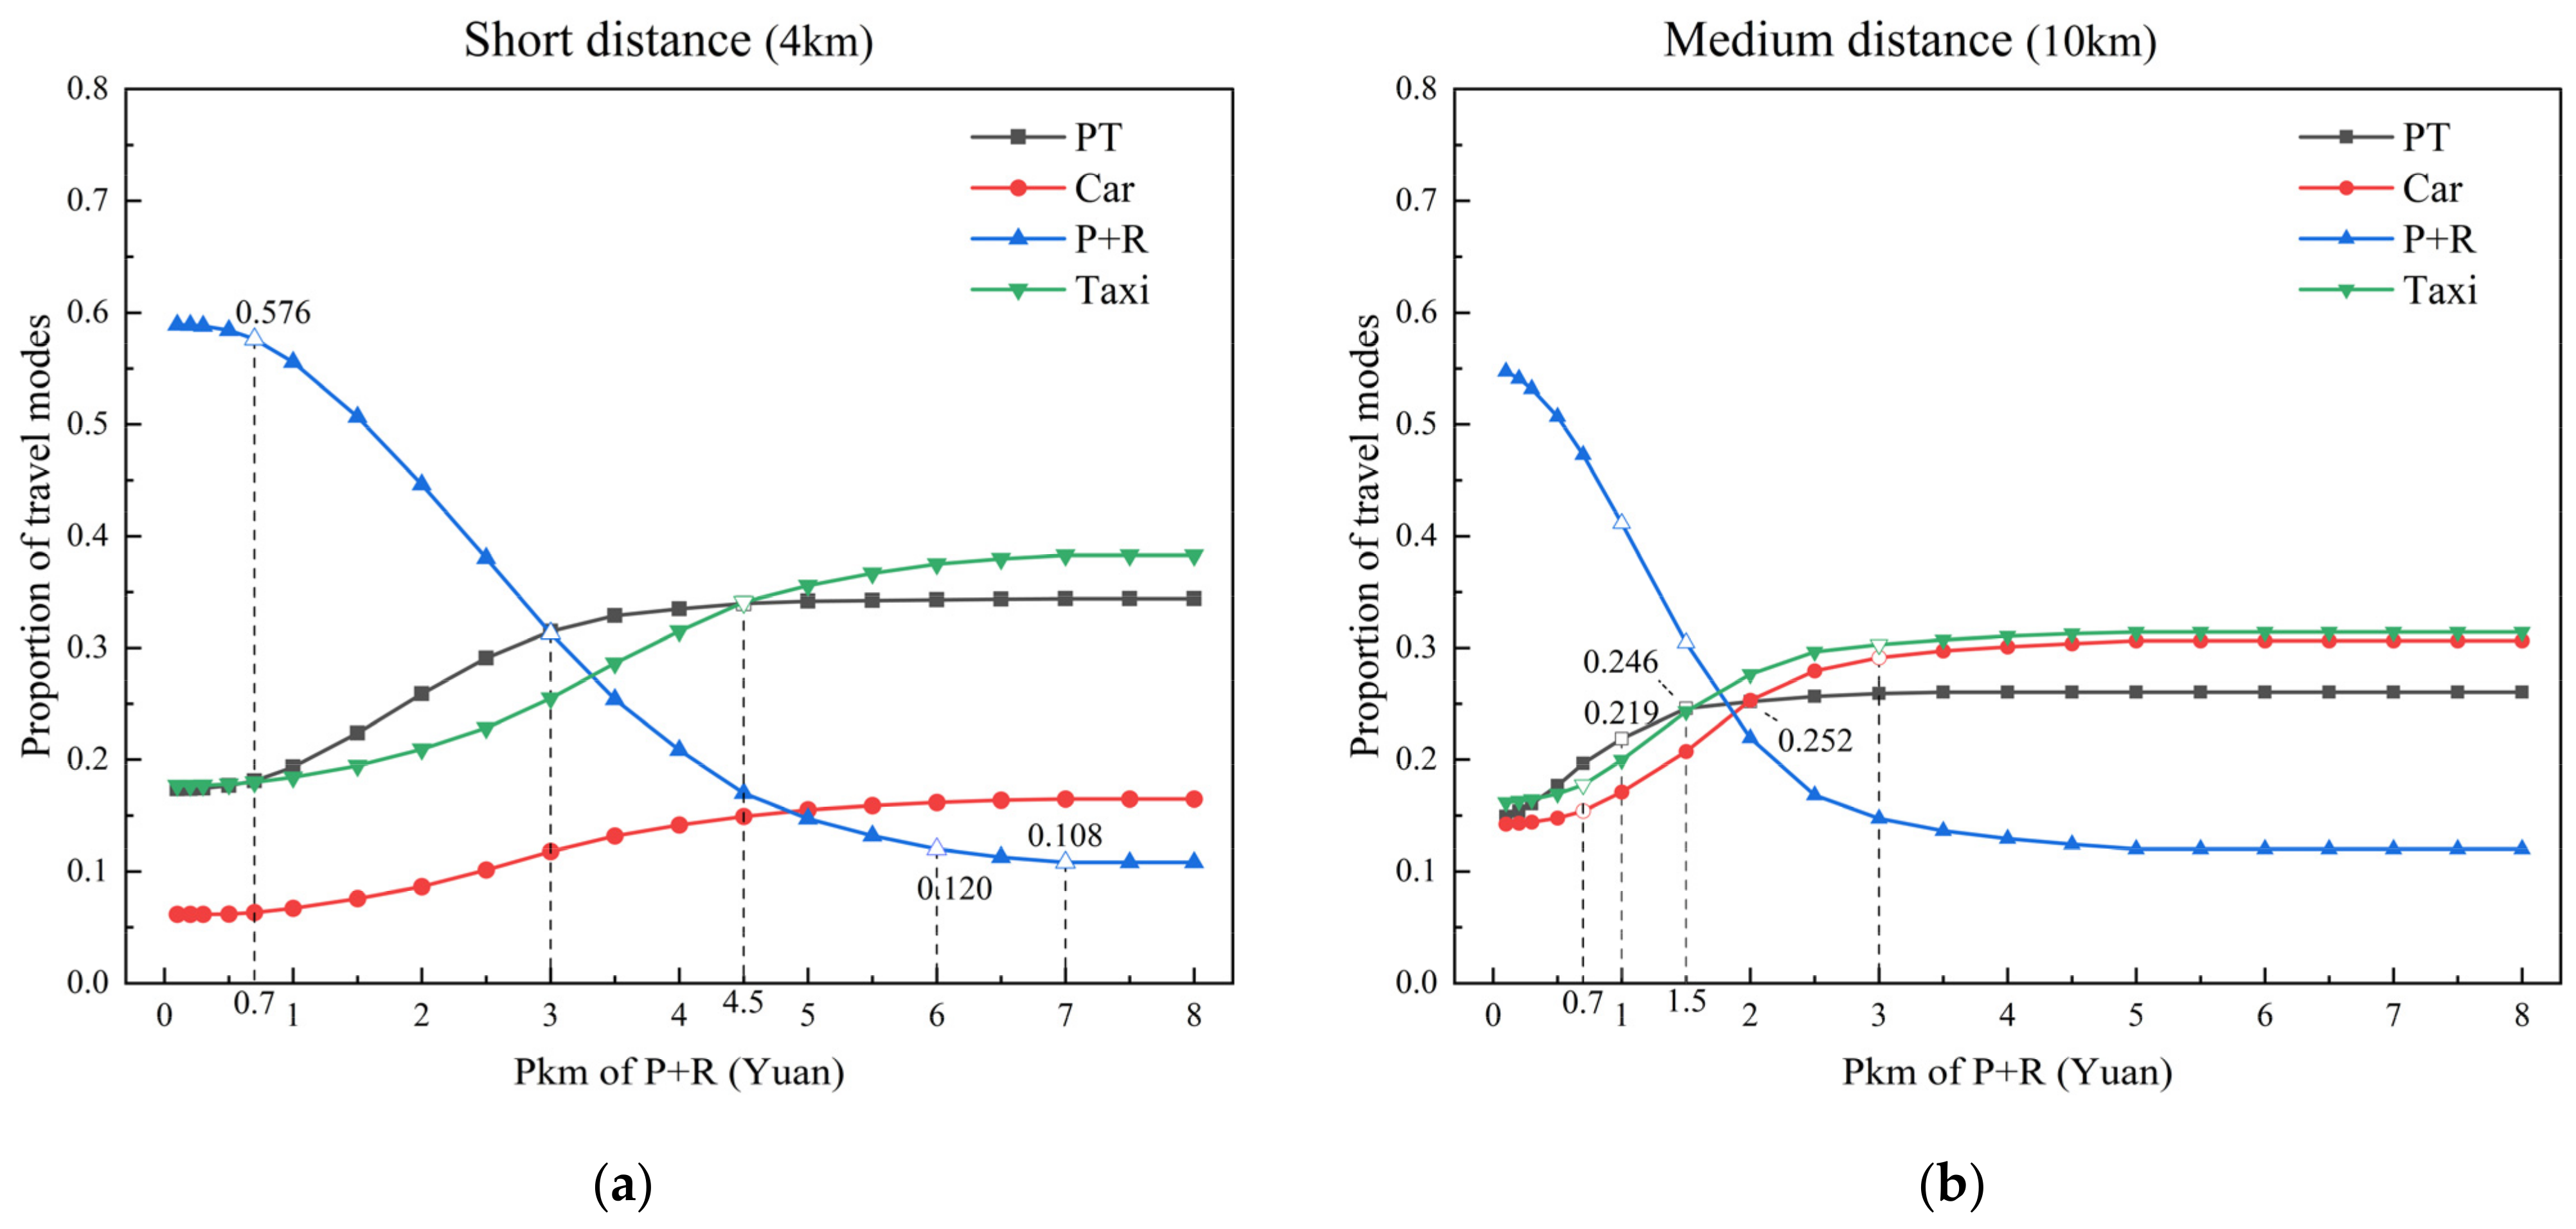
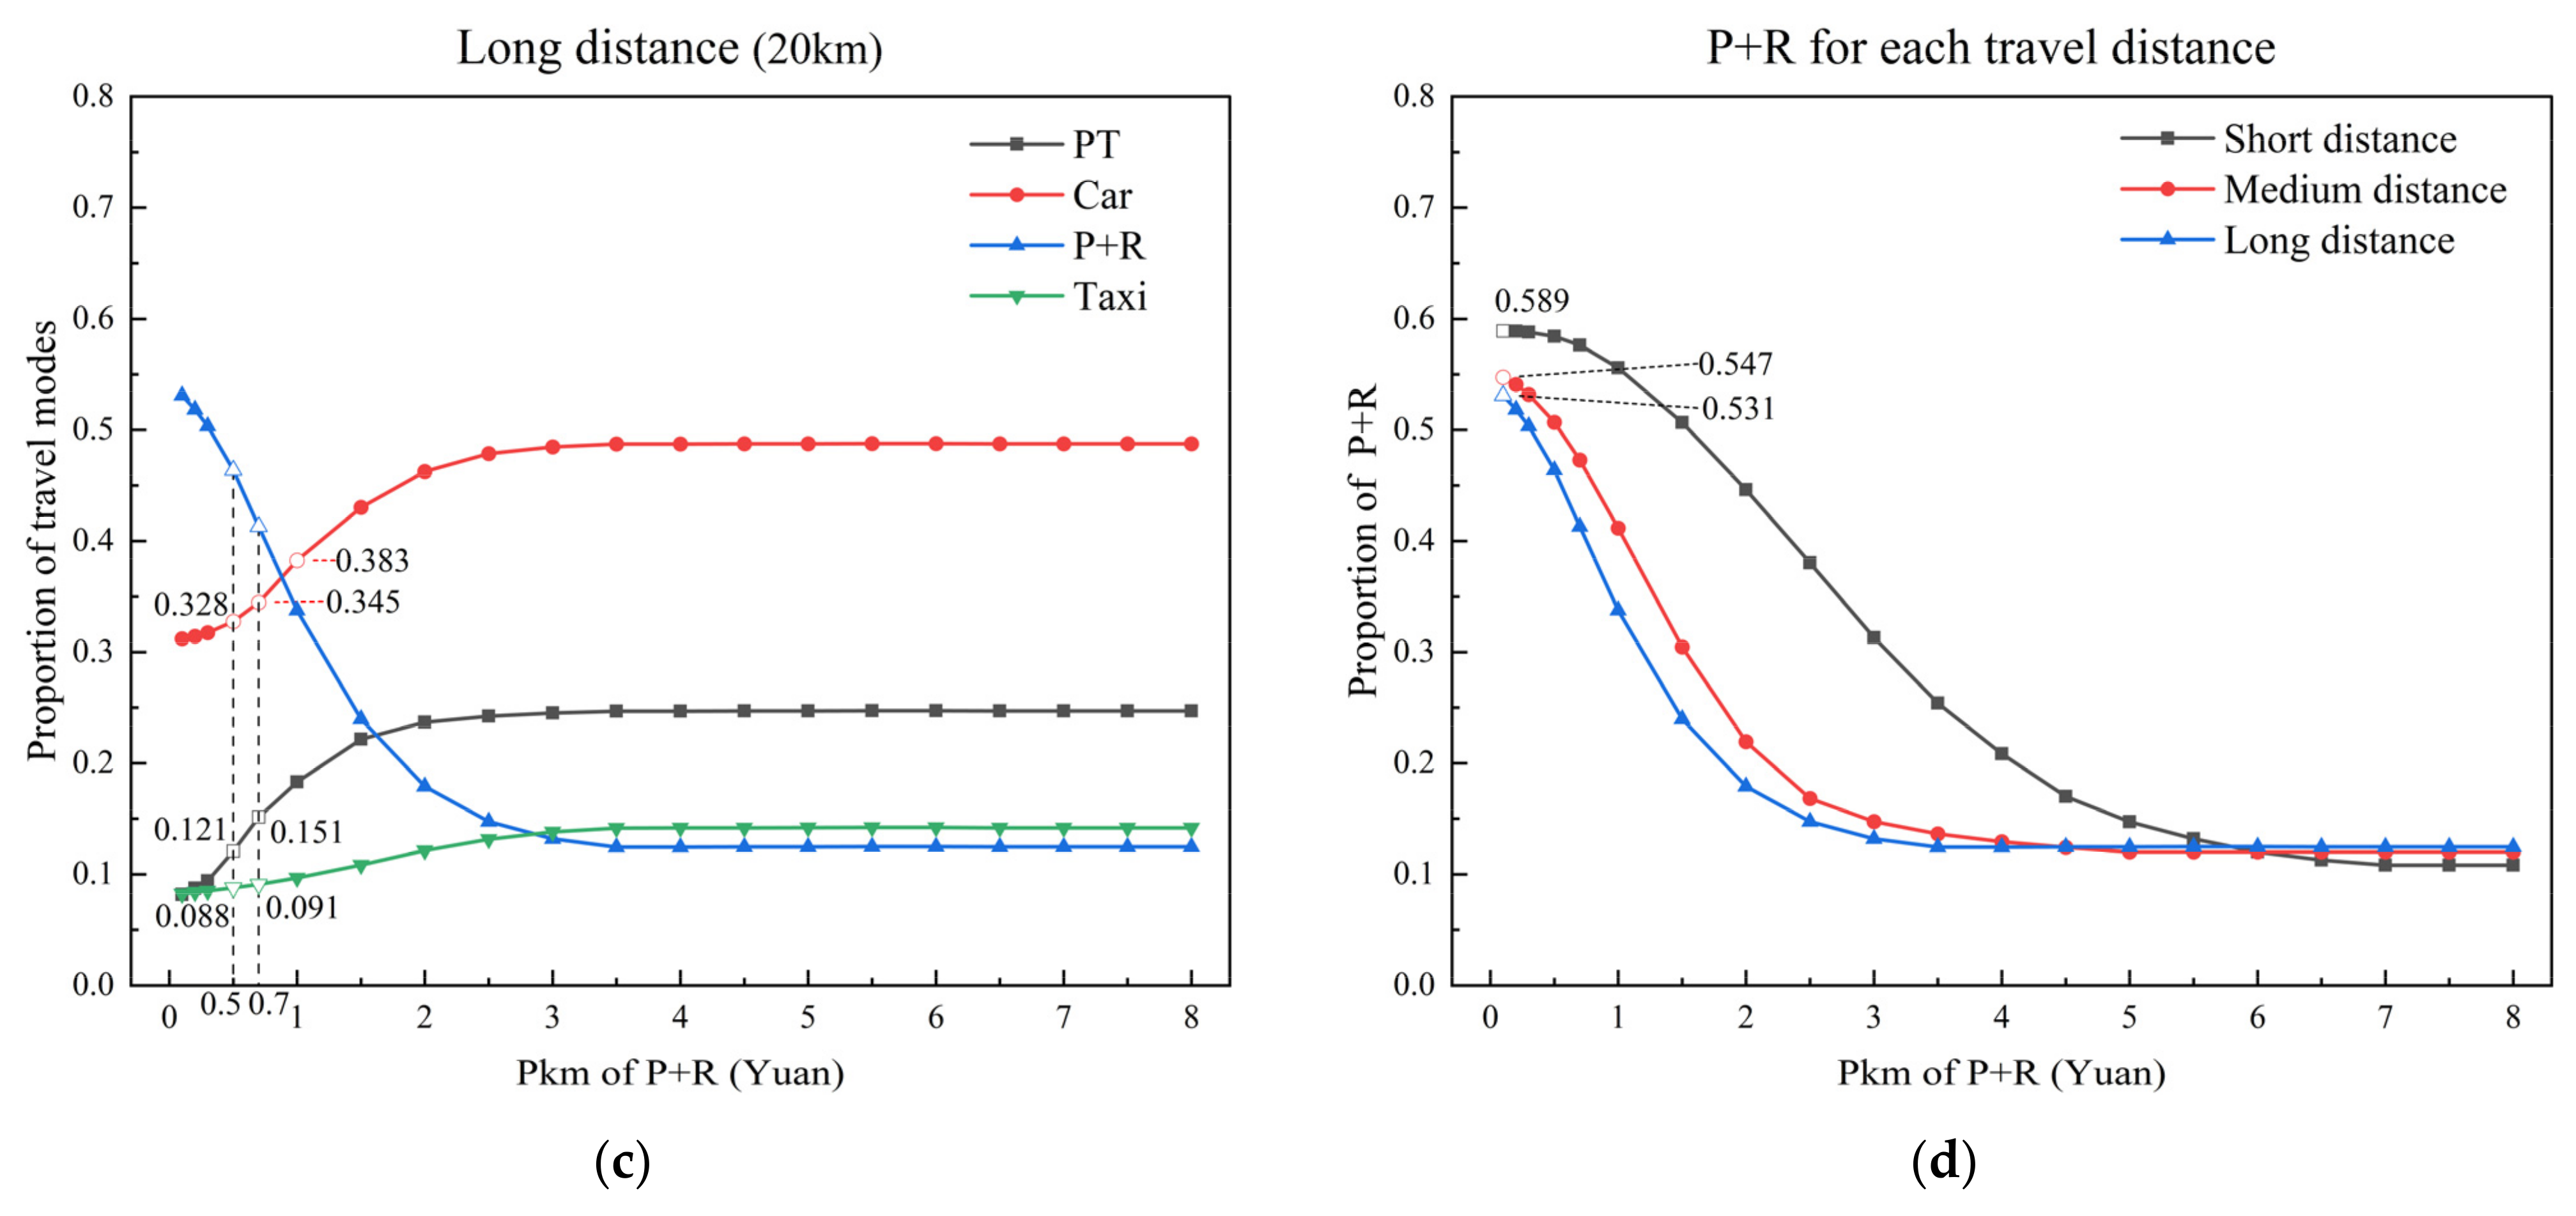
A crucial consideration when designing P&R parking facilities with tiered pricing based on different subway ride distances is to assess the price elasticity of travelers regarding P&R parking charges. In this study, the cost of adopting the P&R mode encompasses three distinct components: P&R parking fees, expenses for subway tickets, and fuel costs. In constructing the mixed logit model, Pkm has been included as an explanatory variable. The TP model’s fitted outcomes for Pkm demonstrate statistical significance at the 99.9% level, rendering the pursuit of further marginal effect analysis on Pkm a valid endeavor. As a result, this section focuses on marginal effects of Pkm, aiming to derive the P&R parking price through a reverse calculation grounded in Pkm. Furthermore, we hypothesize a positive correlation between subway ride distance and total travel distance; a total travel distance of D = 4 km represents a short-distance subway ride; D = 10 km represents a medium-distance subway ride; D = 20 km represents a long-distance subway ride. Marginal effect computations for Pkm are conducted individually for each of these three total travel distances. Figure 4a–c illustrate the shifting proportions of traveler preferences among P&R, private car, taxi, and PT modes for short-range D = 4 km, medium-range D = 10 km, and long-range D = 20 km trips as Pkm P&R mode varies. For a more visual comparative analysis of the changing proportions of selecting the P&R mode for various travel distances, we have integrated the choice proportion curves for the P&R mode across the three travel distances into a single graph, depicted in Figure 4d.
For short-distance travel, the proportions of PT and taxi mode selections are comparable. When Pkm falls between RMB 1 and 4.5, the proportion of those selecting the PT mode outweighs that of the taxi mode. Yet, as the Pkm surpasses RMB 4.5, more travelers choose the taxi mode, making it the most favored option among the four travel modes. The choice proportion for the car mode remains consistently low and exhibits a low increase. This pattern is primarily attributed to the substantial parking fees charged in public parking facilities, rendering the car mode a considerably less economical choice for short-distance travel. The proportion of P&R mode selection shows a slow shift when the Pkm is below RMB 0.7. At this range, approximately 60% of travelers favor the P&R mode. With the Pkm surpassing RMB 0.7, the rate of decline in P&R mode selection accelerates, reaching its steepest slope at Pkm = RMB 3. Following this point, as the Pkm continues to increase, the decrease in P&R mode selection becomes more gradual, and beyond a Pkm value of 6, the curve levels off. For short-distance travel, our objective is to minimize P&R mode selections. It is evident that when the Pkm increases by RMB 1 at Pkm = RMB 6, the proportion of P&R mode selection decreases by a mere 1.2%. Hence, setting the Pkm for P&R at RMB 6 is deemed suitable. According to the scenario outlined in this study, we can further compute that the optimal P&R mode short-distance subway ride parking fee would be approximately RMB 20.
For medium-distance travel, the selection proportion curves for car and taxi demonstrate resemblances. This similarity can be attributed to their similar travel costs and preferences among travelers. Following a Pkm threshold of RMB 0.7, the choice proportions for both modes start increasing, and once the Pkm exceeds RMB 3, the curves plateau. Beyond a Pkm value of RMB 5, there are no further changes in the selection proportions. The proportion of choosing the P&R mode demonstrates a notable declining pattern right from the start, with the sharpest decline occurring at Pkm = RMB 1.5. After exceeding a Pkm value of RMB 5, the P&R mode’s selection proportion levels off and ceases to decrease. On the other hand, the proportion of those selecting the PT mode experiences a rapid surge before reaching a Pkm threshold of RMB 1. Beyond a Pkm value of RMB 2, incremental increases in the cost of P&R travel have a minimal influence on the PT mode selection proportion. Considering the prevailing challenge of limited availability in P&R parking spaces, we designate a Pkm value of RMB 1.5 as the optimal rate for mid-distance P&R travel, corresponding to an approximate P&R parking fee of RMB 10. At this point, the proportion of those selecting the PT mode reaches its highest, while subsequent increments in the cost of P&R travel predominantly steer P&R commuters towards opting for car and taxi modes.
For long-distance travel, the car mode exhibits a consistently elevated selection proportion in the graph, indicating a prevalent inclination towards using the car mode for such journeys. The taxi mode consistently maintains a lower position in the graph, primarily due to the distance-based fare calculation method, which results in higher charges for longer trips. The proportion of those selecting the P&R mode shows a swift decline with rising Pkm values until they exceed RMB 2, and thereafter, it undergoes minimal fluctuations beyond a Pkm value of RMB 3.5. For long-distance travel, the goal is to establish P&R parking prices that encourage a high proportion of PT mode selection while maintaining relatively lower proportions for car and taxi choices. Notably, there is a significant increase in the proportion of PT mode usage when the Pkm is between 0.5 and 0.7 RMB, while the growth in car and taxi selections is less pronounced. Beyond a Pkm value of RMB 0.7, a further increase in P&R travel costs leads to a noticeable rise in the car mode selection. Hence, setting the Pkm for the P&R mode at RMB 0.7 is appropriate for long-distance travel, resulting in a calculated P&R long-distance subway ride parking fee of RMB 6.
Comparing the proportions of P&R mode choices across the three travel distances in Figure 4d, it is evident that at the initial point where Pkm = RMB 0.2, the preference for the P&R mode is higher for short distances, followed by medium distances, and then long distances. This trend emerges due to the methodology employed in calculating marginal effects, with the Pkm being used as the independent variable. Consequently, when the Pkm assumes the same value, the total travel cost for short distances is significantly lower, and the overall travel cost remains a crucial consideration for travelers when determining their mode of transportation. For the same reason, the same increment change in Pkm results in more pronounced alterations in the overall travel costs for medium- and long-distance trips, thereby resulting in a more conspicuous descending trend in the curves associated with these distances.
3.3. Prediction of Effectiveness
Here, we assess the practical impact of implementing a tiered pricing scheme in P&R facilities by predicting two factors: the proportion (δ) of subway commuters based on the distance traveled using P&R facilities and the average revenue (Wp) per parking session. This evaluation aims to validate the effectiveness of tiered pricing for P&R facilities. In the survey section, 244 respondents who have utilized P&R facilities were asked about the distance they traveled by subway during their last P&R trip. The distribution of subway travel distances for P&R trips is illustrated in Figure 5.
All travelers are categorized into three groups: short-distance subway ride P&R travelers, medium-distance subway ride P&R travelers, and long-distance subway ride P&R travelers. Figure 5 reveals that short-, medium-, and long-distance subway commutes using P&R facilities constitute 19.7%, 56.5%, and 23.8% of all P&R travel, respectively. These data are utilized as the θgj value under the fixed pricing strategy. Based on the marginal effect analysis in the previous section, we can ascertain the probabilities of respondents choosing P&R modes with varying parking fees. And from the statistics of the results of the fixed pricing scenario questions in the questionnaire, we can obtain the probability of the P&R trip choice for short-, medium-, and long-distance subway rides under the fixed pricing and tiered pricing modes, as shown in Table 6.
Calculated by Equation (5), the proportions of the potential demand of P&R travelers for each distance of subway ride are depicted in Figure 6. It is evident that the largest potential user group is medium-distances subway ride P&R users, accounting for 57% of the overall total. The long-distance and short-distance subway ride P&R users exhibit a similar proportion, constituting approximately 21% and 22% of the total, respectively.
Calculated by Equation (6), the proportions of different distance subway ride P&R users under the tiered pricing strategy are displayed in Figure 7. It is notable that following the implementation of tiered pricing, the proportion of short-distance subway ride P&R users is the lowest, accounting for less than 10% of the total.
In Figure 8, a comparison between the proportions of P&R travelers based on the subway ride distance traveled under fixed and tiered pricing strategies is presented. It is evident that following the implementation of tiered pricing, there is a decrease of over 10% in the proportion of short-distance subway ride P&R users. Simultaneously, there is an increase in the proportions of medium- and long-distance subway ride P&R users. This indicates that the implementation of tiered pricing effectively frees up over ten percent of P&R parking spaces for use by medium- and long-distance subway ride P&R users.
In analyzing the composition of P&R facility users on the basis of exploring the P&R facility revenue under the tiered pricing strategy, Equation (7) can be used to predict the parking revenue. Under the condition of a tiered pricing strategy for P&R facilities, the average revenue Wp for parking a single car is RMB 9.7, which is an increase of RMB 7.7 in the revenue of the P&R facility operator on average for each car that parks in the facility compared with the fixed charge of RMB 2 per car that is currently in force.
4. Conclusions
In order to more fully utilize the role of P&R facilities in energy conservation, pollutant emission reduction and traffic congestion relief, this study proposes and validates a tiered pricing methodology based on subway ride distance for P&R. The main findings after research and analysis are as follows:
- The implementation of a tiered pricing strategy increases the attractiveness of P&R facilities to long-distance travelers, increases the proportion of medium- and long-distance travelers among P&R users, and makes the utilization of P&R facilities more effective.
- The lower comfort of P&R modes, especially the lack of security in parking during both the walk to a public transport station and the walk from a public transport station to the destination, is the reason why travelers choose to travel by car or taxi in bad weather. At the same time, the shortage of parking spaces at P&R facilities is an important reason why many travelers choose to travel by other modes.
- Based on the research scenarios in this paper, the optimal P&R tiered pricing mode is proposed: RMB 20 for short-distance subway ride P&R parking, RMB 10 for medium-distance subway ride parking, and RMB 6 for long-distance subway ride parking. The effect of implementation is also predicted; a tiered pricing strategy can greatly increase the income of P&R operators and reduce the amount of government subsidies to save social resources.
The limitations of this study include the following two points. First, during scenario setup, an underlying assumption was made, implying that all car travelers, upon reaching their destinations, must seek nearby public parking areas for paid parking. This assumption diverges from actual practice. Future research could encompass a broader range of parking options for car travelers. At the same time, a more detailed design can be carried out in terms of travel mode attributes, such as increasing the consideration of seeking time for car travel and the frequency of metro departures, facilitating a more realistic analysis. Second, assessing the effectiveness of the tiered pricing strategy solely using the percentage of different subway ride distance P&R users may not be clear and accurate enough. Future analytical studies could attempt to assess this through a combination of congestion modeling and behavioral analysis.
Author Contributions
Data curation, Y.H. and H.W.; formal analysis, H.G.; funding acquisition, H.G.; investigation, H.M. and H.W.; methodology, H.M. and H.G.; project administration, H.G.; software, H.M. and H.W.; supervision, H.G.; visualization, Y.H. and H.W.; writing—original draft, H.M.; writing—review and editing, Y.H. All authors have read and agreed to the published version of the manuscript.
Funding
This research was funded by the National Natural Science Foundation of China (grant number 71971005) and the project sponsored by the Natural Science Foundation of Beijing, China (grant number 8202003).
Data Availability Statement
The raw data supporting the conclusions of this article will be made available by the authors on request.
Conflicts of Interest
The authors declare no conflicts of interest.
References
- Lam, W.H.K.; Holyoak, N.M.; Lo, H.P. How Park-and-Ride Schemes Can Be Successful in Eastern Asia. J. Urban Plan. Dev. 2001, 127, 63–78. [Google Scholar] [CrossRef]
- Robinson, C. Bristol Park and Ride to Assist in Reducing Traffic Congestion. Highw. Transp. 1994, 41, 14–15. [Google Scholar]
- Parkhurst, G. lead to an increase in car traffic? Transp. Policy 1995, 2, 15–23. [Google Scholar] [CrossRef]
- Williams, R. OXFORD’S Park-and-Ride System. Proc. Inst. Civ. Eng.-Munic. Eng. 1999, 133, 127–135. [Google Scholar] [CrossRef]
- Farhan, B.; Murray, A.T. Siting park-and-ride facilities using a multi-objective spatial optimization model. Comput. Oper. Res. 2008, 35, 445–456. [Google Scholar] [CrossRef]
- Aros-Vera, F.; Marianov, V.; Mitchell, J.E. p-Hub approach for the optimal park-and-ride facility location problem. Eur. J. Oper. Res. 2013, 226, 277–285. [Google Scholar] [CrossRef]
- Cavadas, J.; Antunes, A.P. Optimization-based study of the location of park-and-ride facilities. Transp. Plan. Technol. 2019, 42, 201–226. [Google Scholar] [CrossRef]
- Ortega, J.; Tóth, J.; Péter, T.; Moslem, S. An Integrated Model of Park-And-Ride Facilities for Sustainable Urban Mobility. Sustainability 2020, 12, 4631. [Google Scholar] [CrossRef]
- Holguı’n-Veras, J.; Yushimito, W.F.; Aros-Vera, F.; Reilly, J. User rationality and optimal park-and-ride location under potential demand maximization. Transp. Res. Part B Methodol. 2012, 46, 949–970. [Google Scholar] [CrossRef]
- Hendricks, S.; Outwater, M. Demand Forecasting Model for Park-and-Ride Lots in King County, Washington. Transp. Res. Rec. 1998, 1623, 80–87. [Google Scholar] [CrossRef]
- Wang, W.; Sun, Z.; Wang, Z.; Liu, Y.; Chen, J. Multi-Objective Optimization Model for P + R and K + R Facilities’ Collaborative Layout Decision. Sustainability 2020, 12, 8833. [Google Scholar] [CrossRef]
- Qin, H.; Guan, H.; Zhang, G. Analysis of the Travel Intent for Park and Ride Based on Perception. Discret. Dyn. Nat. Soc. 2012, 2012, 516197. [Google Scholar] [CrossRef]
- Hamid, N.A. Utilization patterns of park and ride facilities among Kuala Lumpur commuters. Transportation 2009, 36, 295–307. [Google Scholar] [CrossRef]
- Hole, A.R. Forecasting the demand for an employee Park and Ride service using commuters’ stated choicesq. Transp. Policy 2004, 11, 355–362. [Google Scholar] [CrossRef]
- Ibrahim, A.N.H.; Borhan, M.N.; Rahmat, R.A.O.K. Understanding Users’ Intention to Use Park-and-Ride Facilities in Malaysia: The Role of Trust as a Novel Construct in the Theory of Planned Behaviour. Sustainability 2020, 12, 2484. [Google Scholar] [CrossRef]
- He, B.; He, W.; He, M. The Attitude and Preference of Traveler to the Park & Ride Facilities: A Case Study in Nanjing, China. Procedia-Soc. Behav. Sci. 2012, 43, 294–301. [Google Scholar]
- Macioszek, E.; Kurek, A. The Use of a Park and Ride System—A Case Study Based on the City of Cracow (Poland). Energies 2020, 13, 3473. [Google Scholar] [CrossRef]
- Macioszek, E.; Kurek, A. The Analysis of the Factors Determining the Choice of Park and Ride Facility Using a Multinomial Logit Model. Energies 2021, 14, 203. [Google Scholar] [CrossRef]
- Islam, S.T.; Liu, Z.; Sarvi, M.; Zhu, T. Exploring the Mode Change Behavior of Park-and-Ride Users. Math. Probl. Eng. 2015, 2015, 282750. [Google Scholar] [CrossRef]
- Shen, X.; Chen, F.; Su, B.; Chen, Q.; Yao, J. Optimization of park-and-ride system: A case study of Shunyi in Beijing. Adv. Mech. Eng. 2017, 9, 1–8. [Google Scholar] [CrossRef]
- Wang, J.; Wang, H.; Zhang, X. A hybrid management scheme with parking pricing and parking permit for a many-to-one park and ride network. Transp. Res. Part C Emerg. Technol. 2020, 112, 153–179. [Google Scholar] [CrossRef]
- Wang, J.Y.T.; Yang, H.; Lindsey, R. Locating and pricing park-and-ride facilities in a linear monocentric city with deterministic mode choice. Transp. Res. Part B Methodol. 2004, 38, 709–731. [Google Scholar] [CrossRef]
- Zhu, C.; Jia, B.; Han, L.; Gao, Z. Parking Pricing and Model Split under Uncertainty. Discret. Dyn. Nat. Soc. 2014, 2014, 679719. [Google Scholar] [CrossRef]
- Habib, K.N.; Mahmoud, M.S.; Coleman, J. Effect of Parking Charges at Transit Stations on Park-and-Ride Mode Choice. Transp. Res. Rec. J. Transp. Res. Board 2013, 2351, 163–170. [Google Scholar] [CrossRef]
- Wang, H.; Meng, Q.; Zhang, X.-N. Optimal Parking Pricing in Many-to-One Park-and-Ride Network with Parking Space Constraints. Transp. Res. Rec. 2017, 2498, 99–108. [Google Scholar] [CrossRef]
- Syed, S.; Golub, A.; Deakin, E. Response of Regional Rail Park-and-Ride Users to Parking Price Changes. Transp. Res. Rec. 2009, 2110, 155–162. [Google Scholar] [CrossRef]
- Liu, Y.; Qin, H.M. Investigation and Analusis of Beijing Park & Ride Demand. J. Transp. Eng. Inf. 2011, 9, 118–124. [Google Scholar]
- Zhu, C.; Jia, B.; Han, L.; Gao, Z. Commuting Pattern with Park-and-Ride Option for Heterogeneous Commuters. Discret. Dyn. Nat. Soc. 2013, 2013, 185612. [Google Scholar] [CrossRef]
- Li, Y.; Zhang, X.Y. Park & Ride Demand Forecasting at Tiantong Yuan Area along Beijing Subway Line Five. Urban Transp. China 2010, 8, 57–64. [Google Scholar]
- Ge, X.C.; Shi, C.F. Dynamic optimization model of curbside parking and park after ride in central business district. Sci. Technol. Eng. 2021, 21, 13163–13169. [Google Scholar]
- Wang, A.; Guan, H.; Qin, Z.; Zhu, J. Study on the Intention of Private Parking Space Owners of Different Levels of Cities to Participate in Shared Parking in China. Discret. Dyn. Nat. Soc. 2021, 2021, 9955686. [Google Scholar] [CrossRef]
- Liang, K.K.; Li, B.Q. Study on the Day-to-Day Evolution of Saturation Moments of Park-and-Ride Facilities. J. Wuhan Univ. Technol. 2022, 46, 587–591. [Google Scholar]
- Guan, H.Z.; Liu, R.Y. Park-and-Ride Transfer Behaviors Under the Circumstances of Insufficient Park-and-Ride Parking Space. J. Beijing Univ. Technol. 2019, 45, 593–600. [Google Scholar]
- Qin, H.; Guan, H.; Yan, H. Study on Decision Process and Strategy Choice Behavior under Multimode Choice. Discret. Dyn. Nat. Soc. 2015, 2015, 410752. [Google Scholar] [CrossRef]
- Azari, K.A.; Arintono, S.; Hamid, H. Modelling demand under parking and cordon pricing policy. Transp. Policy 2013, 25, 1–9. [Google Scholar] [CrossRef]
- Train, K. Discrete Choice Methods with Simulation, 2nd ed.; Cambridge University Press: Cambridge, UK, 2009. [Google Scholar]
- Mcfadden, D. Modelling the Choice of Residential Location. Transp. Res. Rec. 1977, 477, 72–77. [Google Scholar]
Figure 1.
Schematic diagram of P&R travel process.

Figure 2.
Statistics on the sources of questionnaires.

Figure 3.
Schematic diagram of P&R travel process traveling scenario.

Figure 4.
(a) Marginal effect of Pkm for proportion of travel modes under short-distance travel; (b) marginal effect of Pkm for proportion of travel modes under medium-distance travel; (c) marginal effect of Pkm for proportion of travel modes under long-distance travel; (d) marginal effect of Pkm for proportion of P&R modes under each travel distance.


Figure 5.
Distribution of P&R travel subway ride distance statistics.

Figure 6.
Percentage of potential demand for subway ride distance.

Figure 7.
Percentage of subway ride distance users across the tiered pricing strategy.

Figure 8.
Comparison chart of the percentage of users of fixed pricing and tiered pricing strategies.
Figure 8.
Comparison chart of the percentage of users of fixed pricing and tiered pricing strategies.


Table 1.
Scenario attributes set rules.
| Count parameters | Fuel cost | RMB 0.64/km |
| Parking fees for public parking lots | First hour RMB 6, RMB 10 per hour after the first hour | |
| Parking price for P&R | Fixed pricing standard: RMB 2 per time; Tiered pricing standard: subway ride distance lower than 5 km RMB 20 per time; 5–15 km RMB 8 per time; more than 15 km RMB 4 per time; | |
| Speed | Metro: 35 km/h; walk: 4 km/h; ride: 12 km/h Drive: city center area: 20 km/h; suburban area: 40 km/h (within a 10 km radius of the destination is the city center area) | |
| Probability of having an available parking space in P&R | Fixed pricing standard: 50% Tiered pricing standard: 90% | |
| Walking distance | Car | 300 m |
| Taxi | 0 m | |
| Metro | Walking distance = basic distance + level distance Basic distance: 500 m for short-distance (4 km); 1000 m for medium-distance (4 km); 3000 m for long-distance (4 km); Level distance: 0 m; 300 m; 600 m | |
| P&R | Walking distance = basic distance + level distance Basic distance: 300 m Level distance: 0 m; 300 m; 600 m | |
| Travel costs | Car | Costs = fuel cost + parking fees for public parking lots (this study considers a parking duration of 4 h). |
| Taxi | Cost calculated based on the taxi fare standard. Travel distance lower than 3 km, starting price RMB 10; 3–15 km plus RMB 2 per kilometer beyond; more than 15 km plus RMB 3 per kilometer beyond; | |
| Metro | RMB 3 for short-distance (4 km); RMB 5 for medium-distance (10 km); RMB 7 for long-distance (20 km); | |
| P&R | Costs = fuel cost + parking fees for + metro fare Metro fare as above | |
| Travel times | Car | Travel time = driving time + walking time Driving time = distance/speed; walking time = walking distance/speed; |
| Taxi | Travel time = waiting time + driving time Waiting time: 5 min; driving time as above | |
| Metro | Travel time = walking or riding time + metro time Walking or riding time = distance/speed; metro time = metro distance/speed | |
| P&R | Travel time = driving time + walking time + metro time | |
Table 2.
Variables and their codes.
| Variables | Code | Ratios | |
|---|---|---|---|
| Mode attributes | Travel cost per kilometer (Pkm) | Scene Setting Values | — |
| Walking distance | Scene Setting Values | — | |
| Individual characteristics | Gender | 0 = Feale | 48.0% |
| 1 = Male | 52.0% | ||
| Age | 0 = Less than 24 | 25.8% | |
| 1 = 25~44 years | 59.2% | ||
| 2 = Older than 45 | 15.0% | ||
| Purpose | 0 = Official business and study | 53.2% | |
| 1 = Leisure and entertainment | 46.8% | ||
| Occupation | 0 = Student or no stable job | 43.5% | |
| 1 = Have a stable job | 56.5% | ||
| Daily travel habits | Car | 0 = not | 72.1% |
| 1 = yes | 27.9% | ||
| Public transportation (PT) | 0 = not | 43.0% | |
| 1 = yes | 57.0% | ||
| Taxi | 0 = not | 91.1% | |
| 1 = yes | 8.9% | ||
| Cycling or Walking | 0 = not | 93.8% | |
| 1 = yes | 6.2% | ||
| Travel consideration | Prices in public parking lots (PP group) | 0 = non-consider | 23.6% |
| 1 = consider | 76.3% | ||
| Traveling comfort (CF group) | 0 = non-consider | 51.5% | |
| 1 = consider | 48.5% | ||
| Season and weather (SW group) | 0 = non-consider | 52.5% | |
| 1 = consider | 47.5% | ||
| Availability of spaces in the P&R parking lot (PS group) | 0 = non-consider | 13.1% | |
| 1 = consider | 86.9% | ||
Table 3.
Results of mode attributes and individual characteristics (values in parentheses indicate the standard error of the random parameters).
Table 3.
Results of mode attributes and individual characteristics (values in parentheses indicate the standard error of the random parameters).
| Variable | Mode | Fixed Pricing Strategy | Tiered Pricing Strategy | |||
|---|---|---|---|---|---|---|
| Coef. (p > |z|) | Odds Ratio | Coef. (p > |z|) | Odds Ratio | |||
| Mode attributes | Pkm | — | — | −0.148 (0.363) *** | 0.863 | |
| Walking distance | −0.936 (0.951) *** | 0.392 | −0.292 (0.637) ** | 0.747 | ||
| Individual characteristics | Gender | PT | −0.568 *** | 0.567 | −0.458 *** | 0.633 |
| Car | — | — | — | — | ||
| Taxi | −0.738 *** | 0.478 | −0.323 * | 0.724 | ||
| Age | PT | 0.220 * | 1.246 | −0.438 *** | 0.645 | |
| Car | — | — | −0.215 * | 0.806 | ||
| Taxi | — | — | −0.241 * | 0.786 | ||
| Occupation | PT | −0.903 *** | 0.405 | −0.394 ** | 0.675 | |
| Car | — | — | 0.240 * | 1.271 | ||
| Taxi | — | — | 0.269 * | 1.308 | ||
| Purpose | PT | 0.640 *** | 1.896 | 0.278 * | 1.321 | |
| Car | 0.426 *** | 1.532 | 0.218 * | 1.244 | ||
| Taxi | 0.376 ** | 1.456 | 0.829 *** | 2.290 | ||
| Travel distance | PT | 0.249 *** | 1.282 | −0.052 # | 0.949 | |
| Car | 0.075 ** | 1.078 | −0.039 *** | 0.962 | ||
| Taxi | −0.102 *** | 0.903 | −0.163 *** | 0.849 | ||
| Constant | PT | −0.230 | 0.794 | 1.792 *** | 6.003 | |
| Car | −2.244 *** | 0.106 | 1.699 *** | 5.467 | ||
| Taxi | −0.584 | 0.558 | 2.418 *** | 11.223 | ||
| Mode | LL(0) | −4088.653 | −4011.655 | |||
| LL(Final) | −3080.158 | −3204.084 | ||||
| McFaddens R2 | 0.247 | 0.201 | ||||
| BIC | 6488.027 | 6735.880 | ||||
Note: #: p < 0.1; *: p < 0.05; **: p < 0.01; ***: p < 0.001.
Table 4.
Results of daily travel habits.
| Variable | Mode | Fixed Pricing Strategy | Tiered Pricing Strategy | |||
|---|---|---|---|---|---|---|
| Coef. (p > |z|) | Odds Ratio | Coef. (p > |z|) | Odds Ratio | |||
| Daily travel habits | Car | Metro | −1.031 ** | 0.357 | −1.028 ** | 0.358 |
| Car | 1.041 *** | 2.832 | −0.436 # | 0.646 | ||
| Taxi | 0.908 ** | 2.479 | −0.818 ** | 0.441 | ||
| Taxi | Metro | — | — | — | — | |
| Car | 1.101 ** | 3.007 | — | — | ||
| Taxi | 2.819 *** | 16.756 | 1.542 *** | 4.675 | ||
| PT | Metro | 0.736 ** | 2.088 | — | — | |
| Car | −1.054 *** | 0.349 | −0.860 *** | 0.423 | ||
| Taxi | — | — | −1.740 *** | 0.176 | ||
Note: #: p < 0.1; **: p < 0.01; ***: p < 0.001.
Table 5.
Results of travel consideration.
| Variable | Mode | Fixed Pricing Strategy | Tiered Pricing Strategy | |||
|---|---|---|---|---|---|---|
| Coef. (p > |z|) | Odds Ratio | Coef. (p > |z|) | Odds Ratio | |||
| Travel consideration | PP group | Metro | −0.667 *** | 0.513 | — | — |
| Car | −1.147 *** | 0.318 | −0.679 *** | 0.507 | ||
| Taxi | −0.967 *** | 0.380 | −0.199 | 0.820 | ||
| SW group | Metro | — | — | — | — | |
| Car | 0.521 *** | 1.684 | 0.710 *** | 2.034 | ||
| Taxi | 0.348 ** | 1.417 | 0.210 | 1.233 | ||
| CF group | Metro | — | — | — | — | |
| Car | 0.400 ** | 1.492 | 0.726 *** | 2.066 | ||
| Taxi | 0.146 | 1.157 | 0.474 *** | 1.606 | ||
| PS group | Metro | — | — | — | — | |
| Car | — | — | −1.080 *** | 0.339 | ||
| Taxi | 0.491 * | 1.633 | −0.662 ** | 0.516 | ||
Note: *: p < 0.05; **: p < 0.01; ***: p < 0.001.
Table 6.
Probability of P&R mode choice for travelers according to subway ride distance.
| Near-Distance | Medium-Distance | Long-Distance | |
|---|---|---|---|
| Fixed pricing | 25.8% (Pg1) | 28.0% (Pg2) | 33.6% (Pg3) |
| Tiered pricing | 12.0% (Pj1) | 30.4% (Pj2) | 41.3% (Pj3) |
Disclaimer/Publisher’s Note: The statements, opinions and data contained in all publications are solely those of the individual author(s) and contributor(s) and not of MDPI and/or the editor(s). MDPI and/or the editor(s) disclaim responsibility for any injury to people or property resulting from any ideas, methods, instructions or products referred to in the content. |
© 2024 by the authors. Licensee MDPI, Basel, Switzerland. This article is an open access article distributed under the terms and conditions of the Creative Commons Attribution (CC BY) license (https://creativecommons.org/licenses/by/4.0/).
Share and Cite
MDPI and ACS Style
Miao, H.; Guan, H.; Han, Y.; Wang, H. Research of Park and Ride Parking Spaces Tiered Pricing Methodology Based on Subway Ride Distance. Appl. Sci. 2024, 14, 3550. https://doi.org/10.3390/app14093550
AMA Style
Miao H, Guan H, Han Y, Wang H. Research of Park and Ride Parking Spaces Tiered Pricing Methodology Based on Subway Ride Distance. Applied Sciences. 2024; 14(9):3550. https://doi.org/10.3390/app14093550
Chicago/Turabian StyleMiao, Hao, Hongzhi Guan, Yan Han, and Hongfei Wang. 2024. "Research of Park and Ride Parking Spaces Tiered Pricing Methodology Based on Subway Ride Distance" Applied Sciences 14, no. 9: 3550. https://doi.org/10.3390/app14093550
Note that from the first issue of 2016, this journal uses article numbers instead of page numbers. See further details here.