1. Introduction
The HTB is situated between the Alxa Plate and the Ordos Block in the northwest of the North China Craton (NCC), the Langshan and Liupanshan Mountains, and the Qinling Orogenic Belt to the north and south, respectively (
Figure 1). As an important N–S trending tectonic belt, geologists pay more attention [
1,
2,
3,
4,
5,
6,
7,
8,
9] and find that the HTB experienced complicated intracontinental deformation during the Mesozoic and Cenozoic. In addition, the HTB is near the northeastern Tibetan Plateau (TP) and its neighboring region, which are the hot spots for investigating Meso–Cenozoic denudation history [
10,
11,
12,
13,
14] and the far-field effects from the subduction between the Eurasian and Indian Plates during the Cenozoic. However, the specific Meso–Cenozoic deformation ages, mechanisms, and dynamics still need to be addressed due to insufficient thermochronology evidence of uplift, exhumation, and deformation in the past for the HTB.
The HTB occurred along the western margin of the Ordos Block, and their geological processes were interconnected according to basin–range theory. Prior research suggests that the HTB and Ordos Block experienced the subsequent phases: (1) the N–S to NNE–SSW trending extension in the Early Jurassic [
8,
15], which was induced by the post-collapse after the Triassic collision between the North China Craton with the South China Block [
16]; (2) the multi-directional compression in the Late Jurassic (mainly in the E–W direction [
1,
6,
17]), which was effected by the subduction of the Pacific Plate in the east, the growth of the Qiangtang-Lhasa Block in the southwest and Siberian Block in the north; (3) a WNW-trending extension in the Early Cretaceous [
3,
8,
15], correlated to the roll-back of subduction of the east Pacific Plate; (4) the NW–SE trending compression in the Late Cretaceous [
4,
8], transmitted from the growing subduction boundary of the Pacific Plate; and (5) the NE-trending compression in the Late Miocene [
3,
18,
19], resulting from the uplift and NE-directed growth of the TP.
Some important AFT data were used by Zhao et al. (2007) [
20] and Liu et al. (2010) [
5]. However, their samples were limited to the northern and central HTB (
Figure 2) and the ZFT data were insufficient. Therefore, the main objective of this study is to examine the exhumation history of the southern and central HTB using a combination of AFT and ZFT thermochronology, and the existing FT data obtained from previous studies were designed to be complemented. These newly acquired FT data will be utilized to enhance comprehension of the far-field impact resulting from the subduction of the Pacific Plate in the eastern region, as well as the collision between the Indian Plate and the Eurasian Plate.
2. Geological Setting
The Helanshan Mountain tectonic belt (HTB), an important tectonic boundary between East and West China with an abrupt geophysical field, trends NNE and forms the northwestern margin of the Ordos Block. The eastern Yinchuan Block is a Cenozoic rift basin with over 7000 m of Cenozoic deposits.
The Neoarchean–Paleoproterozoic metamorphic basement rocks and the Meso–Neoproterozoic strata consist of sandstone and dolostone and are mainly exposed in the northern HTB. The Cambrian rocks include phosphorus sandstone, limestone with mudstone, and dolomitic limestone. The Ordovician rocks consist of dolomite, sandstone, limestone, and conglomerate. They mainly occur in the southern HTB and the central HTB and have experienced multiple tectonic deformations from the Paleozoic to the Cenozoic [
21,
22]. The Permian rocks mainly involve quartz sandstones, shales, and siltstone interbedded with coal layers in the central and the northern HTB [
23].
The Triassic succession is characterized by quartz sandstones interlayered with shales in the central HTB, and angular unconformity is found between the Late Triassic shale rocks and the Middle Jurassic sandstone and conglomerate. The Jurassic rocks are fluvial-lacustrine deposits, which comprise predominantly sandstones, siltstones, and mudstones with coal beds. The Late Jurassic Fengfang River Formation consists of conglomerate and sandstone, which is scarcely distributed in the north of the HTB. The Early Cretaceous coarse-grained conglomerates and sandstones are unconformably overlying the previous strata in the central HTB and southern HTB.
The Cenozoic sedimentary section has three primary groups: the Qingshuiying Group, the Hongliugou Group, and the Ganhegou Group [
23]. The Oligocene Qingshuiying Group is composed of mudstone and sandstone and belongs to fluvial-lacustrine deposits. The Miocene Hongliugou Group comprises mudstone and clay. Moreover, the Pliocene Ganhegou Group consists of sandstone, siltstone, and mudstone. In addition, the Miocene strata developed several parallel unconformity sections with the lower Oligocene in Dingjia from Tongxin Country and in Hongliugou from Zhongning Country.
The East Piedmont Fault of the HTB is located on the east edge of the range belt and is a significant boundary between the uplifted HTB and the rifted Yinchuan Block. In the Late Jurassic and Early Cretaceous, a WNW–ESE horizontal shortening [
6] developed, causing west- or east-directed folds and thrusts [
1]. During the Late Jurassic, the Upper Jurassic comprising sandstone and mudstone was overlapped by the Early Paleozoic formation due to the compression and movement of the Xiaosongshan thrust nappe. The West Piedmont Fault of the HTB dipped to WNW and the East Piedmont Fault of the HTB dipped to SE, both of which are normal boundary faults from the NNE-trending HTB. Meanwhile, the West Piedmont Fault and the East Piedmont Fault controlled the Cretaceous sedimentation in the Bayinhaote Basin and Yinchuan Basin (
Figure 2), respectively [
3]. Moreover, the East Piedmont Fault of the HTB has developed different lithologic strata in the corresponding wall since Cenozoic. While the upper (east) wall has fluvial and lacustrine facies deposits, a piedmont deposit exists in the lower (west) wall. During the Cenozoic, the NE–SW extension along the HTB formed the arc-shaped Hetao graben and the NNE–SSW trending Yinchuan Block [
2]. The above geology and structure suggest that the HTB underwent intense extensional deformation and exhumation during the Cenozoic.
Since the Phanerozoic, the HTB has exhibited little magmatic activity. In the Rujigou region, only a few Late Triassic–Early Jurassic basaltic beds developed [
3,
24,
25].
3. Sampling and Analyses
3.1. Sampling
This study collected eight samples for zircon and apatite fission-track analysis from the southern and central HTB (
Figure 2). The sample information is displayed in
Table 1. Sample LS–82 is from an Archean gneiss, which is composed of migmatitic granite and K-feldspar granite. Sample LS–86 is attributed to an Archean granitic gneiss, characterized by a red color and composed of K-feldspar granite. The samples LS–82 and LS–86 were collected from the central HTB (
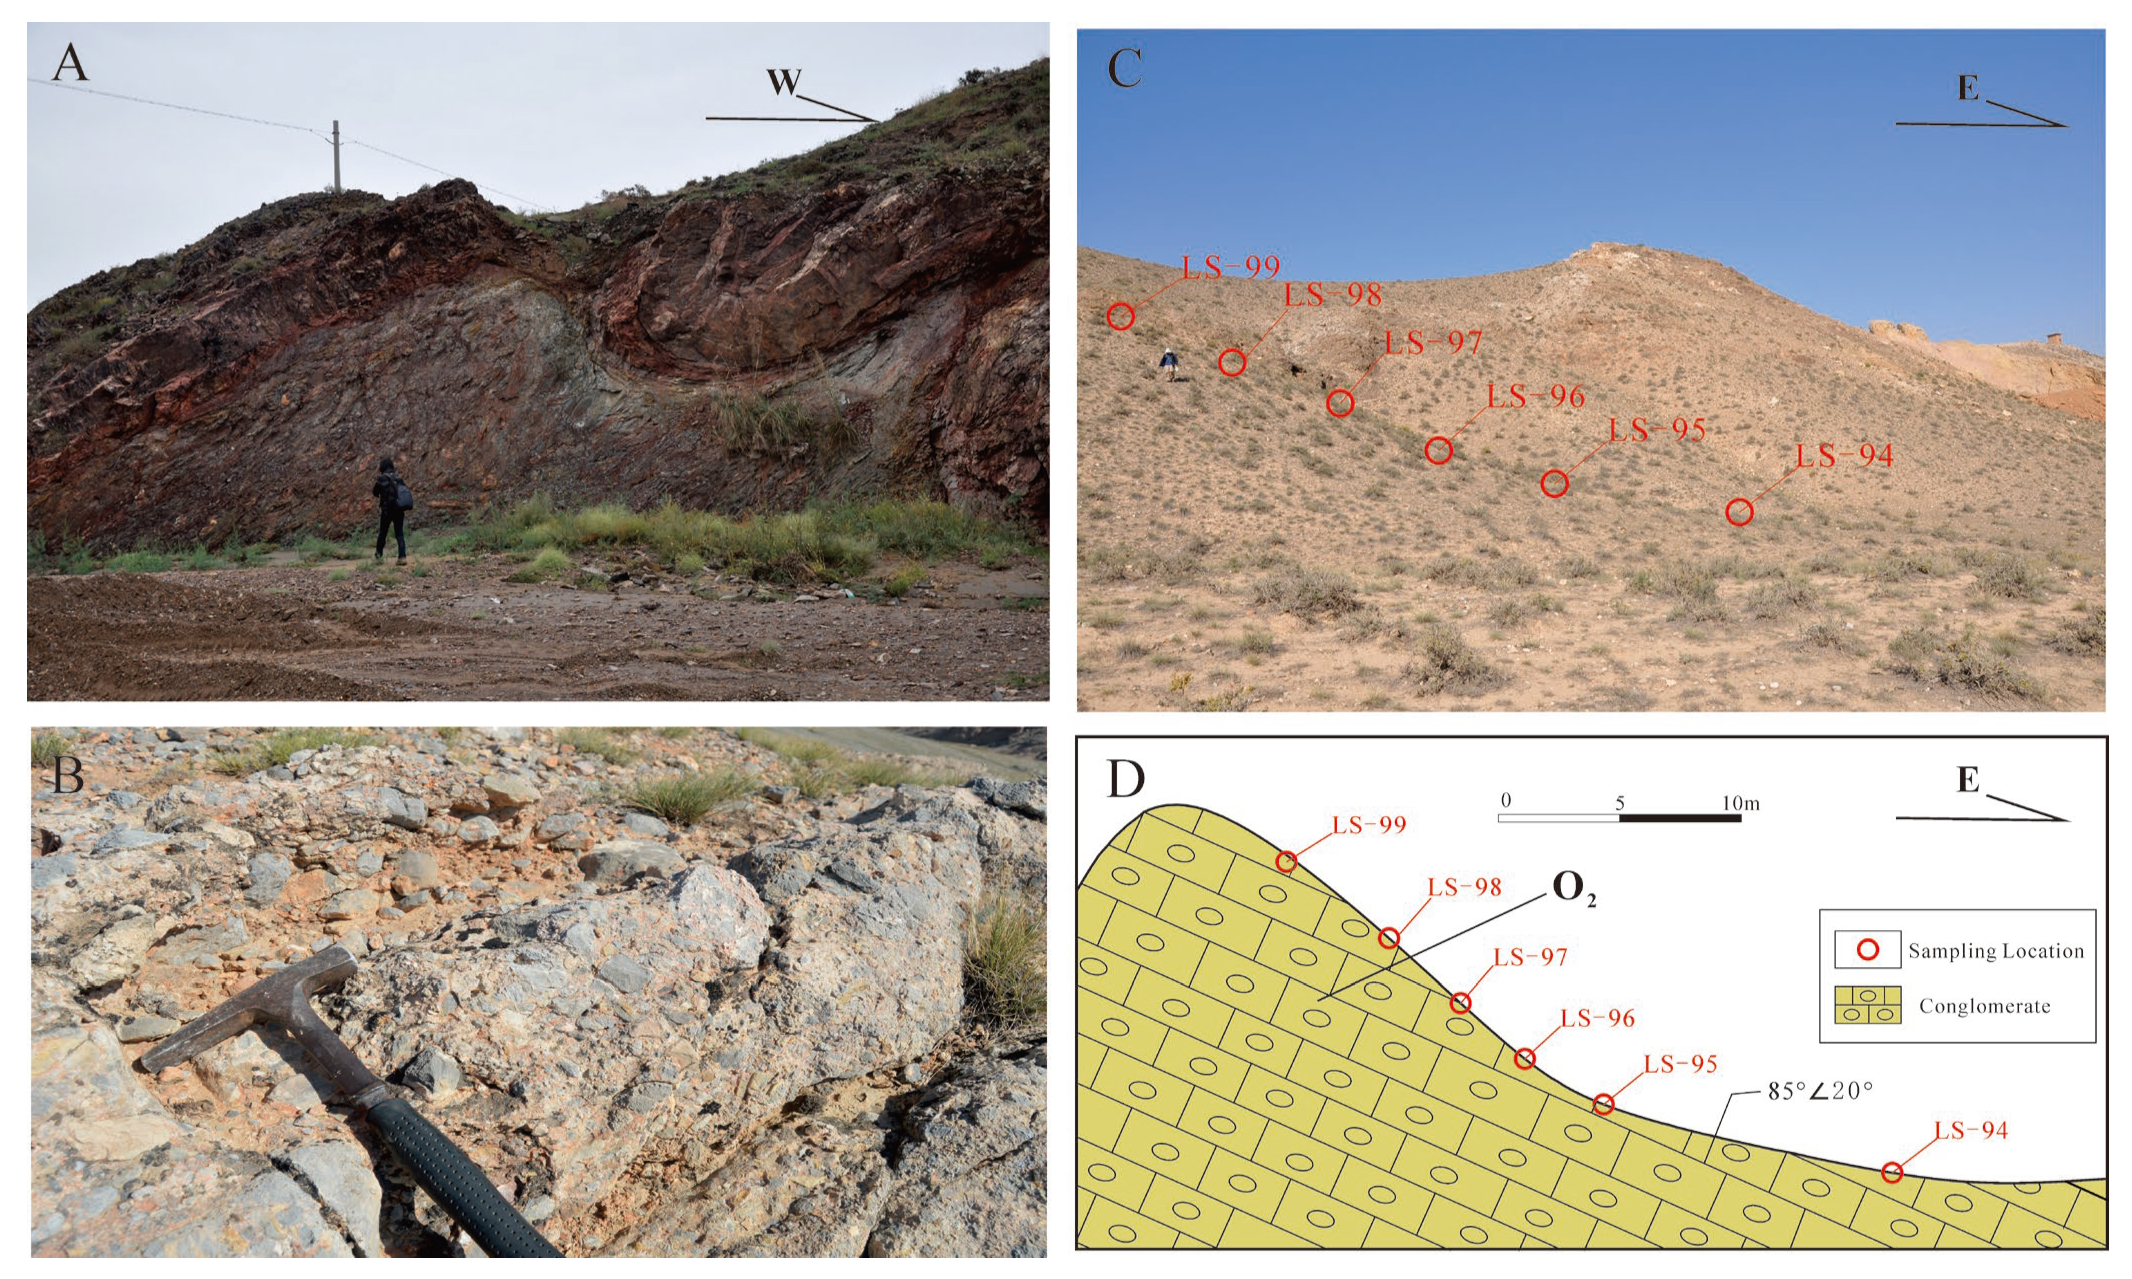
Figure 2), while samples LS–94, LS–95, LS–96, LS–97, LS–98, and LS–99 were collected in the southern HTB from the Ordovician conglomerates (
Figure 3), characterized by breccia structure and gray color, among which the gravels mainly comprise limestones and dolomites.
3.2. FT Analysis
AFT and ZFT methods were used to analyze samples. The fission track analyses were conducted at the Beijing Anputaide Technology Co. Ltd., Beijing, China. Apatite and zircon grains were obtained from crushed rock samples using standard magnetic and heavy liquids separation techniques. Zircon was mounted in FEP Teflon wafers on glass slides, polished, and etched to reveal the spontaneous tracks in a eutectic (1:1) mixture of KOH and NaOH at 220 °C for about 22 h. Apatite grains were mounted in epoxy resin on glass slides, and polished to expose grain surfaces to etching in 5% HNO
3 for 20 s at 21 °C [
26]. This study employed the external detector method for zircon and apatite fission-track analysis. The muscovite flake was then irradiated with thermal neutrons in the well-thermalized (Cd value for Au > 100) hot neutron nuclear reactor at the Beijing Institute of High Energy Physics, Chinese Academy of Sciences. After irradiation, the muscovite grains were etched in 40% HF for 20 min at 25 °C to reveal the induced fission tracks. Using a 100× dry objective and a magnification of 1500, the density of spontaneous and induced fission track populations was determined. The lengths of horizontally confined fission tracks in apatite grains were determined using methods like those employed for age determinations [
27]. Neutron fluence was monitored using CN
2 and CN
5 uranium dosimeter glasses for the zircon and apatite samples, respectively.
The Zeta calibration method [
28,
29,
30] was applied to calculate the fission-track central ages. Green’s (1981) [
31] error calculation approach was used, and the χ
2 test of Galbraith (1981) [
28] was applied to judge whether or not all the grains are attributed to a single population. The P(χ
2) < 5% represents that the single-grain ages of the sample are homogeneous, which means they experienced a single thermal event. The P(χ
2) < 5% denotes that the single-grain ages differ and should be decomposed into several groups.
4. Results and Interpretation
4.1. AFT Age Data
The central ages, mean track lengths, and mean Dpars of the apatite fission track are listed in
Table 2. The seven samples (LS–82, LS–86, LS–94, LS–95, LS–96, LS–97, and LS–98) have been dated with the AFT methods. The mean track lengths vary from 11.8 ± 1.8 μm to 12.8 ± 1.8 μm, and the central ages of the AFT are between 52 and 118 Ma. The standard deviation (SD) ranges between 1.5 and 1.8 μm for the AFT track lengths. The mean Dpar values of the AFT range from 1.25 to 1.49 μm.
All AFT ages in this paper are younger than their strata ages, indicating that all single-grain ages have been reset after deposition (
Figure 4A). Most of the samples experienced multiple annealing processes because the χ
2 value is <5%, except sample LS–82, for which the χ
2 value of apatite is >5%. Apatite fission track age was decomposed by using Radial Plotter [
32] with the automatic mixture model (
Figure 5), and then divided into 4 age groups (
Figure 4A and
Figure 5): 147 Ma, 120–109 Ma, 92–77 Ma, and 65–50 Ma.
According to Gleadow’s collection and conclusion [
33], we could divide the apatite tracks into three types with different dispersions of the track lengths and standard deviations: (i) the freshly induced tracks in all apatites with a narrow and symmetrical length distribution of 16.3 μm track length and 0.9 μm SD; (ii) the track lengths in apatite from undisturbed ‘volcanic’ rocks with track lengths ranging from 14 to 16 μm and SD ranging from 0.7 to 1.3 μm; and (iii) the track lengths in apatite from crystalline basement rocks with track lengths ranging from 12.2 to 13.9 μm and SD ranging from 1 to 1.6 μm. For type (ii), if the mean length is <13 μm and SD > 2 μm, a bimodal distribution will exist. Therefore, the tracks in this study belong to type (iii) with <14 μm track length and 1.8~1 μm SD, indicating that the southern HTB has crystalline basement rocks.
4.2. ZFT Age Data
The central ages and χ
2 values of the zircon fission track are listed in
Table 2. The samples LS–94, LS–95, LS–96, LS–97, LS–98, and LS–99 have been dated with the ZFT methods. ZFT central ages range from 133 to 171 Ma. All ZFT ages are younger than their corresponding strata ages (
Figure 4B), indicating that all single-grain ages have been reset. Because the χ
2 value of all zircon samples is <5%, the Radial Plotter [
32] with binomial peak-fitting method is used to help us distinguish the cooling age population.
Figure 4B and
Figure 6 reveal that these six zircon grain ages can be divided into 5 groups: 279 Ma, 222–213 Ma, 193–169 Ma, 151 Ma, and 130–110 Ma.
4.3. FT Age Data
The fission track ages of samples in the HTB were classified into 7 distinct groups: 279 Ma, 222–213 Ma, 193–169 Ma, 151 Ma, 130–109 Ma, 92–77 Ma, and 65–50 Ma, by the integration of AFT and ZFT analysis, facilitated by the utilization of Radial Plotter with a two mixture model.
4.4. Thermal History
Based on the distribution of AFT lengths and age data, the HeFTy software (Version. 1.8.3, Ketchman, 2005) [
34] was used to better constrain the exhumation history. The time–temperature (t–t) history was calculated using the multi-kinetic annealing model of Ketchman et al. (2007a) [
35] and the c-axis projected length of Ketchman et al. (2007b) [
36]. Samples were modeled with at least 100 track-length measurements. The inverse models were executed with 10,000 randomly chosen time–temperature histories for each sample, which in all cases resulted in N > 1000 acceptable paths. A goodness-of-fit parameter (GOF) estimated the degree to which modeled data matched measured values. A path was accepted if the GOF value was >0.05; a good fit was indicated if the GOF value was >0.5 [
34]. The initial simulation temperature was set at 130 °C, which is slightly higher than the AFT annealing temperature (120–60 °C). The lower limit of simulation temperature was set at 15 °C, based on the present-day mean surface temperature in the Helanshan Mountains. Because the age of sample LS–97 is old, the fission-track simulation initial time is set at 170 Ma. Furthermore, to explicitly illustrate the temporal pattern of sample LS–98’s t–t history spanning from 120 to 110 Ma, the initial time of sample LS–98 is established at 130 Ma, while the other samples start at 120 Ma.
The modeling t–t paths of AFT samples from the central and southern HTB, cooling since 130 °C, are shown in
Figure 7. Except for samples LS–82 and LS–86, the cooling paths for most samples share a three-stage cooling history. These three cooling paths include two episodes of rapid cooling that bracket an episode of slow cooling. Samples LS–94 and LS–95 share almost the same t–t history. They have the AFT ages of ~120 Ma when they pass across the upper limit of the partial annealing zone. Samples LS–94 and LS–95 underwent the first rapid cooling until 95 Ma with a cooling rate of 1.6 °C/Ma. Following this rapid cooling stage, a relatively stable episode occurred from 95 Ma to 10~8 Ma at a rate of 0.12 °C/Ma. The third fast cooling existed from 10~8 Ma, which is almost the same time when they entered into the lower limit of partial annealing zone until the present with the rapid cooling rate of 4.5 °C/Ma. The first relatively fast cooling stage of sample LS–97 lasts from 170 Ma to 120 Ma with a cooling rate of 0.47 °C/Ma, and its second rapid cooling episode developed from 10–8 Ma until the present at a rate of 4.5 °C/Ma. The sample LS–98 exhibits two rapid cooling episodes: the first one occurs from 130 Ma to 105 Ma, during which the temperature decreases from 115 to 70 °C with a cooling rate of 1.8 °C/Ma; the second one occurs from ~5 Ma to the present, recorded the temperature drop from 60 °C to 15 °C at a rate of 9 °C/Ma. The LS–82 and LS–86 samples have two- and four-stage cooling histories, respectively. Specifically, sample LS–82 experienced a period of stable cooling from 120 Ma to 60 Ma and entered the rapid cooling path from 60 Ma at a rapid cooling rate of 1.58 °C/Ma. Meanwhile, the sample LS–86 developed two rapid cooling histories from 66 to 60 Ma and from ~8 Ma to the present at a rate of 6.67 °C/Ma and 6.87 °C/Ma, respectively.
Overall, the inverse modeling of AFT revealed four rapid cooling episodes: 170–120 Ma, 120–95 Ma, 66–60 Ma, and ~10–8 Ma to the present. The first episode is mainly developed in the sample LS–97. The second rapid cooling stage occurred between the samples LS–94, LS–95, and LS–97. The third one is derived from the sample LS–86, which aligns with the outcome of AFT obtained using the radial plot. Finally, the majority of samples, except sample LS–82, exhibit the presence of the fourth accelerated cooling interval (8–0 Ma), indicating a widespread cooling event in the Late Miocene.
5. Discussion
5.1. Exhumation and Deformation History
The Ordos Block and its margins (HTB) have exhibited mechanical contrasts since the Early Paleozoic [
37]. The transmission of stress from the continent margins to its interior is influenced by mechanical anisotropy, which, once established, localizes strain [
1]. The Ordos Block is strong compared to HTB, so the strata in the Ordos Basin remain undeformed. There are three important geological progress around the Eurasian continent: the Paleo-Pacific subduction occurring along the eastern margin of the continent, the subduction/collision zone between the Siberian Plate, and the Mongolia-North China Block to the north of the HTB, involving Qiangtang and Lhasa Blocks to the southwest of the HTB. Due to such a sophisticated tectonic background on the central Eurasian Plate, it is challenging and impractical to connect deformation in the HTB with a single convergent plate boundary. Therefore, the subsequent segmented discussions will try to consider a wide range of geological circumstances surrounding the HTB within the same period.
5.1.1. Early Permian (279 Ma)
Sample LS–99 is the solo specimen in this research with a peak age of 279 Ma from ZFT analysis. Meanwhile, a few relevant age data are found and used in the HTB. However, the extensional back-arc basin was developed in the West Qinling [
38], supported by the presence of deep-water sediments and geological structures in the Permian to Middle Triassic [
39,
40]. The geochronology of this intra-plate extension environment has been better defined by zircon LA-ICP-MS data from a diabase in the southern Alxa Block (276 Ma) [
41], an AFT age of 277–267 Ma in the southwestern Alxa Block [
42], and zircon LA-ICP-MS data of 278 Ma in the West Qinling Orogenic Belt [
43]. The majority of the northern HTB was deposited with sandstone and shale during the Early Permian, indicating a weak structural environment [
23]. Moreover, a series of Permian volcanic interlayers existed in drill holes of the southwestern Ordos Block [
23,
44]. Consequently, there was a potential reduction in structural intensity from south to north. The activation of the back-arc extension on the south margin of the HTB and southern Alxa Block occurred during the Early–Middle Permian, as a result of the collision between the North China Block and the South China Block [
45,
46].
5.1.2. Late Triassic (222–213 Ma)
The peak age of Samples 98 and 96, as determined by ZFT analysis with the Radial Plotter, was 222–213 Ma. It is coherent with samples having ZFT ages of 230–210 Ma collected in the central HTB [
47], where the Triassic strata were denudated during this interval. Several angular unconformities were observed in the Lower Jurassic Yanan and the Upper Triassic Yanchang Formations [
23]. The rapid cooling event in the Late Triassic was revealed as 230–210 Ma in the north of the West Qinling Orogenic Belt with the feldspar multi-diffusion domain method and the AFT method [
48]. The adakite and Himalaya-type granite (264–216 Ma) in the West Qinling Orogenic Belt were analyzed using zircon LA-ICP-MS dating, and the results suggested that the thickened crust was formed by continent–continent collision [
49]. The presence of the Late Triassic unconformity associated with the NNE–SSE shortening was caused by the Qinling–Dabie orogeny [
1,
6], a consequence of the collision between the South China Block and the North China Craton.
5.1.3. Early-Middle Jurassic (193–169 Ma)
The Early to Middle Jurassic period was characterized by the development of coal-bearing formations, indicating that the HTB had a period of relative inactivity and experienced extension, with extension direction in the N–S to NNE–SSW [
8,
9]. Further deformation occurred around the Ordos Basin within the same tectonic context. The E–W-trending extensional basins in the north of Ordos Basin were delineated by normal growth faults along the Daqingshan Mountains [
50]. The Early–Middle Jurassic basins in the Alxa Block to the west of the HTB were confined by E–W-striking normal faults [
51]. Meanwhile, volcanic activities were developed around 170 Ma in the western Ordos Basin [
52], Taihang Mountain [
53], and Qinshui Basin [
54]. We prefer to attribute this extensional stress regime to the result of post-orogenic collapse, followed by the collision between the North and South China blocks in the Triassic. Meanwhile, this period signifies the tectonic shift from the Triassic period, characterized by a collisional tectonic system with a strong N–S trend, to the Late Jurassic period with nearly E–W-trending compression.
5.1.4. Late Jurassic (151–147 Ma)
By integrating the AFT and ZFT results obtained from the Radial Plotter analysis and the FT data from the prior research, it can be concluded that the Late Jurassic is another important geological episode in the HTB. In the northeastern HTB, Zhuozi Shan and Helanshan Mountain were separated by a left-lateral strike-slip fault system between the Late Jurassic and the Middle Cretaceous [
1]. Meanwhile, the Lower Paleozoic carbonates were thrust southeastwards atop the folded Upper Jurassic, composed of sandstone and mudstone. Xiaosongshan thrust nappe places the Early Paleozoic formation upon the Jurassic strata in the north of HTB [
55]. The Lower and Upper Jurassic layers exhibited denudation and absence, while the southwest of Ordos Basin displayed the development of complex thrust and reverse faults [
56]. The Fengfang River Formation, consisting of sandstone and conglomerate in the Late Jurassic, was discovered in the north part of Ordos Basin by seismic profile [
15] and at the base of the Kexue Mountain to the south of the HTB [
57]. It denotes that the HTB experienced an intense structural uplift event in the Late Jurassic.
Moreover, various geochronology techniques were employed in the Late Jurassic around the HTB area. The age of 150–140 Ma marked the initiation of structural mechanism conversion, and this conclusion is drawn from a comprehensive analysis, including structural deformation, volcanic activity, and basin migration [
58,
59]. The 150–145 Ma is one of the peak age intervals from fission track analysis in the west of the Ordos Basin [
60]. The study was undertaken in the southwestern Ordos Basin [
61] and in the Qilianshan Mountains [
62] to determine the similar peak ZFT age of 154–147 Ma and peak AFT age of 153–135 Ma, respectively. The peak FT age of ~145 Ma in the southwestern Ordos Basin is closely connected with the thrust nappe in the Late Jurassic [
56]. Zhao et al. [
20] conducted the ZFT experiment of samples in the HTB and concluded that the HTB underwent a transition from extensive fault depression to a compression environment during 157–139 Ma. Crust shortening along the HTB in the Late Jurassic caused the shift from the expansion (Early–Middle Jurassic) to the compression environment (Late Jurassic). The eastward migration is indicated by the Xiaosongshan thrust nappe and the left-slip motion of the NW-trending strike fault. Therefore, the dominant factor responsible for the Late Jurassic deformation in the HTB is the eastward extrusion resulting from the subduction belt between the Qiangtang and Lhasa blocks in the TP [
63,
64].
5.1.5. Early Cretaceous (130–109 Ma)
Based on previous analytical procedures (AFT age data, ZFT age data, and the inverse modeling of thermal history), the denudation event between 130 and 110 Ma of HTB is confirmed to represent a significant geological episode in the Late Mesozoic. The Jurassic sandstones are unconformably overlain by the lower Cretaceous strata, constrained by the West Piedmont Fault of the HTB. The Late Jurassic Fengfang River Formation is interbedded with sandstone, and the Lower Cretaceous overlies conglomerate to the southeast of Yinchuan Basin [
23]. In addition, a series of angular unconformity interfaces between the pre-Cretaceous and the Late Cretaceous formation is found in the southern HTB [
65]. Early Cretaceous strata in Bayinhaote Basin to the west of the HTB were controlled by the West Piedmont Fault of the HTB. Meanwhile, the East Piedmont Fault restricted the development of Cretaceous formation in the Yinchuan Basin [
3]. Therefore, both of these two faults were active during the Early Cretaceous. The maximum principal stress direction shifted from a nearly N–S trend in the Mid–Late Jurassic on the eastern margin of Ordos Basin [
66], to an E–W oriented extension of the HTB in the Early Cretaceous. Furthermore, the basalt geochronological data obtained from Gugutai in the HTB provides evidence of the extensional tectonic setting and dynamic during the Early Cretaceous [
25,
67].
In addition to the HTB, the presence of angular unconformity between the Late Jurassic strata and the Early Cretaceous strata has been identified in several adjacent regions, including northern North China Craton [
68], South China [
69,
70], and the Korean Peninsula [
71]. Tectonic and geochronological data indicate that the NW–SE-trending extensional event occurred throughout the NCC and its adjacent area during the Early Cretaceous. Liupanshan Basin, restricted by the normal faults, was characterized by the 3 km thickness of sediments, indicating a strong rapid uplift event in the Early Cretaceous, supported by the FT age of ~130 Ma [
52]. The Early Cretaceous (140–120 Ma) saw fast cooling events, using the feldspar multi-diffusion domain approach and the AFT method [
48] in the West Qinling Orogenic Belt. Meanwhile, the MDD technique revealed the same 140–120 Ma ages in the East Kunlun Orogenic belt [
72]. The weak young trend of Late Mesozoic crustal extension initiated in Mongolia and northern China (ca. 150–145 Ma) [
73,
74,
75], then progressively developed southeastwards (140–130 Ma) [
76,
77], and finally spread throughout all of NE Asia (130–120 Ma) [
78].
Based on the above evidence, the HTB and the North China Craton were affected by uniform geodynamics during the Early Cretaceous. Prior numerous investigations prefer to link the Early Cretaceous extension of the HTB with the northwestward subduction of the Paleo-Pacific Plate ([
3,
6]). However, the fast conversion of structural settings should not be ignored. Specifically, the lithospheric thickening caused by the Late Jurassic compression implies the Early Cretaceous extension deformation in North China Craton (including HTB) [
8,
74,
79]. Therefore, we conclude that the Early Cretaceous extension of the HTB and the North China Craton is not influenced by a solitary factor. Since the remote effect from the rollback of the Paleo-Pacific Plate in the east, the collapse of the thickened lithosphere also played a significant role.
5.1.6. Late Cretaceous (92–77 Ma)
The AFT sample analysis from the southern HTB (LS–94, 95, 96, 97, 98) with Radial Plotter suggests that a rapid cooling event was developed during 92–77 Ma. It is almost synchronized with the AFT data from the central HTB samples (90–70 Ma) [
4] and Zhao’s research [
20] in HTB (88–76 Ma). Meanwhile, the nearly identical AFT ages of 104–81 Ma were developed in the Qilianshan Mountains [
62]. The strata formed in the Late Cretaceous are absent in the HTB [
23] and Alax Block. Additionally, other basins in eastern Asia, such as Hailar Basin [
80] and Songliao Basin [
81], also experienced an uplift in the Late Cretaceous, resulting in the formation of strata lacuna. The above evidence with lacked strata indicates that this event is prevalent in the eastern North China Plate as well. The findings of the AFT research conducted around 90 Ma were disseminated across several regions in eastern China, such as the Songliao Basin [
82], Jiaolai Basin [
5,
83], and Qinling-Dabie orogenic belts [
84]. Due to this extensive deformation that occurred in Eastern China simultaneously, we believe that the exhumation of HTB in the Late Cretaceous is caused by the convergence between the Pacific and Eurasian Plates.
5.1.7. Early Cenozoic (65–50 Ma)
The AFT radial plot results (
Figure 5) demonstrate that the HTB has a rapid denudation event during the Early Cenozoic (mainly in 58–50 Ma). Few relevant ages existed in the HTB, but some were located in the periphery of the Ordos Basin. Huang et al. [
85] conducted the ZFT and AFT analysis in the southeastern Ordos Basin and East Qinling Orogenic Belt, and their research shows that the AFT had a rapid uplift age of 66–59 Ma. Meanwhile, the apatite and zircon samples collected from the Kou Zhen area in the south of Ordos Basin exhibit a strong correlation in cooling ages ranging from 63 to 59 Ma [
56]. The majority of AFT radial plot ages fall into the interval of 58–50 Ma, and they are close to the rapid cooling events derived from AFT and ZFT data in East Kunlun (~56–45 Ma) [
86,
87] and Qilian Shan Mountains (~60–50 Ma) [
88]. Therefore, the presence of comparable FT ages in the southern East Kunlun Orogenic Belt, North Qinling Orogenic Belt, and the northern HTB suggests that this Early Cenozoic deformation can be attributed to the transfer of the far-field stress from the Eurasian and Indian plates collision boundary. Hence, we suggest that the comparable Early Cenozoic event observed in the HTB could be recognized as a correspondence to the far-field effect of the collision between the Eurasian and Indian Plates.
5.1.8. Miocene (10–8 Ma)
According to the t–t plots described above, the majority of samples experienced rapid cooling initiated at ~10–8 Ma. Moreover, this timing agrees with the study of Yang (2018) [
3] and Liu (2010) [
5]. Although Zhao’s (2007) [
20] research of uplift time from AFT has many discrepancies from our results, the differences in sampling location and analytical method could be the main causes, as mentioned earlier. However, 15 Ma is one of the key age groups achieved in their study. According to field observations, the Ordovician strata thrust northeastward over the Eocene Sikouzi Formation in the southwest HTB [
7]. In the meantime, an open syncline dipping southwest of the Eocene developed in the footwall, indicating a contraction in the NE–SW direction. Based on the regional geology report of BGMRNXHAR [
23], the Miocene strata developed several parallel unconformity sections with the lower Oligocene. Since the Cenozoic, the east boundary fault’s corresponding wall has distinct lithologic strata. In detail, the upper (east) wall has a different petrological deposit compared to the lower (west) wall, indicating a denudation phase in HTB.
Analysis of apatite fission tracks provides a method to constrain the cooling history of the HTB and adjacent areas. The uplift of Qilianshan Mountains was initiated from the Early Miocene with coarsen sediments and experienced an acceleration event with a higher denudation rate from the Late Miocene to Pliocene [
64], implying that Qilian Shan Mountains was affected by the far-field stress between the Indian Plate and Eurasian Plate. The provenance analysis of sediments from the West Hexi Corridor indicates that the uplift of the North Qilian Shan Mountains began in the Late Miocene [
89]. The cooling episode in the northwestern Qilian Shan Mountains occurred 20–10 Ma ago [
90]. Tapponnier et al. (2001) [
91] noted that TP grows along the Altyn Tagh Fault branches from the Miocene. Meanwhile, the underthrusting of the Indian Plate beneath the southern TP after the Middle Miocene could be demonstrated by the seismic and GPS data [
92] and the
40Ar/
39Ar thermochronological constraints [
93]. In summary, the contraction of the Indian and Eurasian Plates not only had a significant impact on the solid deformation and the uplift of the southern TP during the Late Miocene, but also accelerated the growth of the northeastern TP. Meantime, the eastward extrusion of the TP squeezed the adjacent areas, including HTB, Qilian Shan Mountains, and the West Hexi Corridor. Therefore, the aforementioned NE-SE direction contraction in HTB could be interpreted as a consequence of the uplift and NE-directed growth of the TP in the Late Miocene caused by the collision between the Indian Plate and the Eurasian Plate.
5.2. Comparative FT Analysis with Previous Study in HTB
This investigation has identified the following eight rapid cooling events as described above: Early Permian (279 Ma), Late Triassic (222–213 Ma), Early–Middle Jurassic (193–169 Ma), Late Jurassic (151–147 Ma), Early Cretaceous (130–109 Ma), Late Cretaceous (92–77 Ma), Early Cenozoic (65–50 Ma), and Late Miocene (10–8 Ma). The comparative FT analysis of the HTB with previous works is necessary to better understand the evolution of the HTB. Liu et al.’s (2010) [
5] AFT analysis reveals that the HTB experienced an accelerated exhumation beginning at 12–10 Ma, which is in accordance with our result at 10–8 Ma. They concluded that HTB exhibited a southwestward titling pattern during the Late Miocene, based on the AFT data. Specifically, the date of the rapid uplift event is older in the south and younger in the north. However, our samples collected in the southern HTB exhibited a nearly identical young event of 10–8 Ma to their results (12–10 Ma) from the northern HTB, implicating that their FT evidence of hypothesis is insufficient. Zhao et al. (2007) [
20] proposed the 4 fast cooling stages in HTB based on the FT analysis: 157–139 Ma, 121–97 Ma, 88–76 Ma, and 50–37 Ma. The chronology of the other rapid cooling events partially coincided with our research, suggesting a strong coherence as a whole, except for the youngest event in the Eocene (50–37 Ma). While their research indicates an extension or compression geological environment, a comprehensive geodynamic explanation for most episodes is lacking. Shi et al. (2019) [
4] discovered two distinct periods of exhumation in HTB using AFT data: the Late Cretaceous (90–70 Ma) and after 30 Ma. The first stage coincides with this study and both of them have a similar geodynamic, resulting from the horizontal shortening transmitted by the subduction between the Pacific and Eurasian Plates. These two studies in the second stage share the same geodynamics (northeastward expansion of the TP) but differ in timing. In summary, the FT ages in the Early Permian (279 Ma), the Late Triassic (222–213 Ma), the Early–Middle Jurassic (193–169 Ma), and the Early Cenozoic (65–50 Ma) have not been extensively convinced in the prior papers. Meanwhile, new ideas or additions to geodynamics are proposed, such as events that happened in the Late Jurassic (151–147 Ma), the Early Cretaceous (130–109 Ma), the Late Cretaceous (92–77 Ma) and the Late Miocene (10–8 Ma).
6. Conclusions
In this study, we conducted AFT and ZFT techniques to study Meso–Cenozoic thermal-tectonic evolution in the central and southern HTB. AFT analysis of 7 samples with the radial plot could be divided into 4 age groups: 147 Ma, 120~109 Ma, 92~77 Ma, and 65~50 Ma. The inverse modeling of AFT suggests the presence of 4 rapid cooling stages: 170–120 Ma, 120–95 Ma, 66–60 Ma, and 8–0 Ma. In addition, based on the ZFT analysis of 6 samples with radial plots, the following 5 age groups could be discovered: 279 Ma, 222~213 Ma, 193 ~169 Ma, 151 Ma, and 130~110 Ma. In summary, the analysis of the ZFT and AFT ages could be categorized into the following 8 age groups: 279 Ma, 222–213 Ma, 193–169 Ma, 151–147 Ma, 130–109 Ma, 92–77 Ma, 65–50 Ma, and ~10–8 to the present.
This FT analysis reveals that the central and southern HTB has undergone a series of tectonic thermal events. The Early Permian of 279 Ma was characterized by a weak structural episode, representing the back-arc extension in the south HTB and southern Alxa block. The Late Triassic age group of 222–213 Ma was marked with NNE–SSE trending contraction between the South China and North China cratons. The weak extension event in the Early–Middle Jurassic of 193–169 Ma corresponded to the post-orogenic collapse after the Triassic strong compression event. The 151–147 Ma event was caused by the eastward extrusion of the Alax and HTB, resulting from the far-field effect of the subduction between the Qiangtang and Lhasa blocks. The Early Cretaceous (130–109 Ma) event has multiple dynamic origins, from the rollback of the Pacific Plate in the east and the collapse of the thickened lithosphere formed in the Late Jurassic. The Late Cretaceous (92–77 Ma) was ascribed to the convergence between the Pacific and Eurasian Plates. The event during 65–50 Ma was a far-field correspondence to the onset subduction of the Indian Plate under the Eurasian Plate. From 10–8 Ma to the present, the progressive collision of the Indian and Eurasian Plates had a significant impact on the northeastern TP. Meanwhile, the growth and eastward escape of TP developed substantial deformation in the HTB.
Author Contributions
C.W., Y.W. and L.Z. designed and initiated the research. C.W. and Y.W. were responsible for fieldwork. All authors were responsible for discussion. C.W., Y.W. and W.Y. prepared the manuscript. All authors have read and agreed to the published version of the manuscript.
Funding
This research is supported by the Chinese NSF (41602213) and the fundamental Research Funds for the Central Universities (2-9-2017-052).
Institutional Review Board Statement
Not applicable.
Informed Consent Statement
Not applicable.
Data Availability Statement
The raw data supporting the conclusions of this article will be made available by the authors on request.
Acknowledgments
We are grateful to Liang Zhang, Yunlei Feng, and Yajuan Huang for their critical advice of this manuscript. And we sincerely thank reviewers and editors for their thoughtful comments to improve the quality of the manuscript.
Conflicts of Interest
The authors declare no conflicts of interest.
References
- Darby, B.J.; Ritts, B.D. Mesozoic contractional deformation in the middle of the Asian tectonic collage: The intraplate Western Ordos fold-thrust belt, China. Earth Planet. Sci. Lett. 2002, 205, 13–24. [Google Scholar] [CrossRef]
- Zhang, Y.Q.; Ma, Y.S.; Yang, N.; Shi, W.; Dong, S.W. Cenozoic extensional stress evolution in North China. J. Geodyn. 2003, 36, 591–613. [Google Scholar]
- Yang, X.Y.; Dong, Y.P. Mesozoic and Cenozoic multiple deformations in the Helanshan Tectonic Belt, Northern China. Gondwana Res. 2018, 60, 34–53. [Google Scholar] [CrossRef]
- Shi, G.Z.; Shen, C.B.; Zattin, M.; Wang, H.; Yang, C.Q.; Liang, C. Late Cretaceous-Cenozoic exhumation of the Helanshan Mt Range, western Ordos fold-thrust belt, China: Insight from structural and apatite fission track analyses. J. Asian Earth Sci. 2019, 176, 196–208. [Google Scholar] [CrossRef]
- Liu, J.H.; Zhang, P.Z.; Zheng, D.W.; Wan, J.L.; Wang, W.T.; Du, P.; Lei, Q.Y. Pattern and timing of late Cenozoic rapid exhumation and uplift of the Helan Mountain, China. Sci. China Ser. D-Earth Sci. 2010, 53, 345–355. [Google Scholar] [CrossRef]
- Huang, X.F.; Shi, W.; Chen, P.; Li, H.Q. Superposed deformation in the Helanshan Structural Belt: Implications for Mesozoic intracontinental deformation of the North China Plate. J. Asian Earth Sci. 2015, 114, 140–154. [Google Scholar] [CrossRef]
- Bao, X.W.; Xu, M.J.; Wang, L.S.; Mi, N.; Yu, D.Y.; Li, H. Lithospheric structure of the Ordos Block and its boundary areas inferred from Rayleigh wave dispersion. Tectonophysics 2011, 499, 132–141. [Google Scholar] [CrossRef]
- Zhang, Y.Q.; Shi, W.; Dong, S.W. Changes of Late Mesozoic Tectonic Regimes around the Ordos Basin (North China) and their Geodynamic Implications. Acta Geol. Sin.-Engl. Ed. 2011, 85, 1254–1276. [Google Scholar]
- Zhang, Y.Q.; Liao, C.Z.; Shi, W.; Zhang, T.; Guo, F.G. Jurassic Deformation in and Around the Ordos Basin, North China. Earth Sci. Front. 2007, 14, 182–196. [Google Scholar] [CrossRef]
- Lease, O.R.; Burbank, W.D.; Clark, K.M.; Farley, A.K.; Zheng, D.W.; Zhang, H.P. Middle Miocene reorganization of deformation along the northeastern Tibetan Plateau. Geology 2015, 39, 359–362. [Google Scholar] [CrossRef]
- Lu, H.J.; Fu, B.H.; Shi, P.L.; Ma, Y.X.; Li, H.B. Constraints on the uplift mechanism of northern Tibet. Earth Planet. Sci. Lett. 2016, 453, 108–118. [Google Scholar]
- Feng, Z.R.; Yuan, W.M.; Zhao, Z.D.; Dong, G.C.; Li, X.W.; Sun, W.L.; Yang, L.; Hong, S.J.; Zhao, M.M.; Hu, C.X.; et al. Mesozoic-Cenozoic cooling, exhumation and tectonic implications of Chaqiabeishan-Shaliuquan Li-Be ore district in the northeastern Qinghai-Tibet Plateau. Tectonophysics 2023, 866, 230040. [Google Scholar] [CrossRef]
- Yuan, D.Y.; Ge, W.P.; Chen, Z.W.; Li, C.Y.; Wang, Z.C.; Zhang, H.P.; Zhang, P.Z.; Zheng, D.W.; Zheng, W.J.; Craddock, H.W.; et al. The growth of northeastern Tibet and its relevance to large-scale continental geodynamics: A review of recent studies. Tectonics 2013, 32, 1358–1370. [Google Scholar] [CrossRef]
- Hu, C.X.; Yuan, W.M.; Zhao, Z.D.; Yang, L.; Feng, Z.R.; Hong, S.J.; Zhao, M.M.; Li, S.Y. Uplift and exhumation of the Chakabeishan ore district in the northern margin of the Qaidam Basin, China: Constraints from fission track thermochronology. J. Asian Earth Sci. 2023, 247, 105596. [Google Scholar] [CrossRef]
- Liu, C.Y.; Zhao, H.G.; Zhao, J.F.; Wang, J.Q.; Zhang, D.D.; Yang, M.H. Temporo-spatial coordinates of evolution of the Ordos basin and its mineralization responses. Acta Geol. Sin. 2008, 82, 1229–1243. [Google Scholar]
- Xiao, W.Z.; Liu, C.Y.; Tan, K.X.; Duan, X.Z.; Shi, K.T.; Sui, Q.L.; Feng, P.; Sami, M.; Ahmed, M.S.; Zi, F. Two Distinct Fractional Crystallization Mechanisms of A-Type Granites in the Nanling Range, South China: A Case Study of the Jiuyishan Complex Massif and Xianghualing Intrusive Stocks. Minerals 2023, 13, 605. [Google Scholar] [CrossRef]
- Yuan, Y.S.; Hu, S.B.; Wang, H.J.; Sun, F.J. Meso-Cenozoic tectonothermal evolution of Ordos basin, central China: Insights from newly acquired vitrinite reflectance data and a revision of existing paleothermal indicator data. J. Geodyn. 2007, 44, 33–46. [Google Scholar] [CrossRef]
- Zhang, J.; Dickson, C.; Cheng, H.Y. Sedimentary characteristics of Cenozoic strata in central-southern Ningxia, NW China: Implications for the evolution of the NE Qinghai–Tibetan Plateau. J. Asian Earth Sci. 2010, 39, 740–759. [Google Scholar]
- Liu, X.B.; Shi, W.; Hu, J.M.; Fu, J.L.; Yan, J.Y.; Sun, L.L. Magnetostratigraphy and tectonic implications of Paleogene-Neogene sediments in the Yinchuan Basin, western North China Craton. J. Asian Earth Sci. 2019, 173, 61–69. [Google Scholar] [CrossRef]
- Zhao, H.G.; Liu, C.Y.; Wang, F.; Wang, J.Q.; Li, Q.; Yao, Y.M. Uplift and evolution of Helan Mountain. Sci. China Ser. D-Earth Sci. 2007, 50, 217–226. [Google Scholar] [CrossRef]
- Zhao, H.G. Structural Characteristics and the Evolution in Western Ordos Basin. Ph.D. Thesis, Northwest University, Xi’an, China, 2003. [Google Scholar]
- Li, T.B. The Characteristics and Evolution of Thrust Nappe Structure in the West Margin of Ordos Basin. Ph.D. Thesis, China University of Geosciences (Beijing), Beijing, China, 2006. [Google Scholar]
- BGMRNXHAR. Bureau of Geological and Mineral Resource of Ningxia Hui Autonomous Region. In Regional Geology of the Ningxia Hui Autonomous Region; Geology Publishing House: Beijing, China, 1990; pp. 1–522, (In Chinese with English Abstract). [Google Scholar]
- Wang, F.; Liu, C.Y.; Yang, X.K.; Su, C.Q. Geologic geochemical features of Basalt in Ruqi Clough of Helan Mountain and its structural environmental significance. Pet. Geol. Oilfield Dev. Daqing 2005, 24, 25–27. [Google Scholar]
- Yang, H.; Fu, J.H.; Ouyang, Z.J.; Sun, L.Y.; Ma, Z.R. U-Pb Zircon Dating of the Daling-Gugutai Basalt in Rujigou on the Western Margin of Ordos Basin. Acta Geosci. Sin. 2010, 31, 229–236, (In Chinese with English abstract). [Google Scholar]
- Carlson, W.D.; Donelick, R.A.; Ketcham, R.A. Variability of apatite fission-track annealing kinetics: I. Experimental results. Am. Miner. 1999, 84, 1213–1223. [Google Scholar] [CrossRef]
- Green, P.F.; Duddy, I.R.; Gleadow, A.J.W.; Tingate, P.R.; Laslett, G.M. Thermal annealing of fission tracks in apatite: 1. A qualitative description. Chem. Geol. 1986, 59, 237–253. [Google Scholar] [CrossRef]
- Galbraith, R.F. On statistical models for fission-track counts. J. Int. Assoc. Math. Geol. 1981, 13, 471–478. [Google Scholar] [CrossRef]
- Hurford, A.J.; Green, P.F. A users’ guide to fission track dating calibration. Earth Planet. Sci. Lett. 1982, 59, 343–354. [Google Scholar] [CrossRef]
- Hurford, A.J. Standardization of fission track dating calibration: Recommendation by the Fission Track Working Group of the IUGS Subcommission on Geochronology. Chem. Geol. 1990, 80, 171–178. [Google Scholar] [CrossRef]
- Green, P.F. A new look at statistics in fission-track dating. Nucl. Tracks 1981, 5, 77–86. [Google Scholar] [CrossRef]
- Vermeesch, P. Radial Plotter: A Java application for fission track, luminescence and other radial plots. Radiat. Meas. 2009, 44, 409–410. [Google Scholar] [CrossRef]
- Gleadow, A.J.W.; Duddy, I.R.; Green, P.F.; Lovering, J.F. Confined fission track lengths in apatite: A diagnostic tool for thermal history analysis. Contrib. Miner. Petrol. 1986, 94, 405–415. [Google Scholar] [CrossRef]
- Ketchman, R.A. Forward and inverse modeling of low-temperature thermochronometry data. Rev. Mineral. Geochem. 2005, 58, 275–314. [Google Scholar] [CrossRef]
- Ketchman, R.A.; Carter, A.; Donelick, R.A.; Barbarand, J.; Hurford, A.J. Improved measurement of fission-track annealing in apatite using c-axis projection. Am. Miner. 2007, 92, 789–798. [Google Scholar] [CrossRef]
- Ketchman, R.A.; Carter, A.; Donelick, R.A.; Barbarand, J.; Hurford, A.J. Improved measurement of fission-track annealing in apatite. Am. Miner. 2007, 92, 799–810. [Google Scholar] [CrossRef]
- Lin, C.; Yang, Q.; Li, S. Basin Filling and Evolution Analysis of Helan Aulacogen, Northwest China; Geologic Publishing House: Beijing, China, 1995; p. 143, (In Chinese with English summary). [Google Scholar]
- Li, X.W.; Mo, X.X.; Huang, X.F.; Dong, G.C.; Yu, X.H.; Luo, M.F.; Liu, Y.B. U–Pb zircon geochronology, geochemical and Sr–Nd–Hf isotopic compositions of the early Indosinian Tongren pluton in west Qinling: Petrogenesis and geodynamic implications. J. Asian Earth Sci. 2015, 97, 38–50. [Google Scholar] [CrossRef]
- Pullen, A.; Kapp, P.; Gehrels, G.E.; Vervoort, J.D.; Ding, L. Triassic continental subduction in central Tibet and Mediterranean-style closure of the Paleo-Tethys Ocean. Geology 2008, 36, 351–354. [Google Scholar] [CrossRef]
- Wu, G.L.; Meng, Q.R.; Duan, L.; Li, L. Early Mesozoic structural evolution of the eastern west Qinling, northwest China. Tectonophysics 2014, 630, 9–20. [Google Scholar] [CrossRef]
- Zhang, Y.P.; Zhang, J.; Chen, X.H.; Wang, Y.N.; Zhao, H.; Nie, F.J.; Zhang, B.H. Late Paleozoic tectonic setting of southern Alxa Block, NW China: Constrained by age and composition of diabase. Int. Geol. Rev. 2016, 59, 1028–1046. [Google Scholar] [CrossRef]
- Song, D.F.; Glorie, S.; Xiao, W.J.; Collins, A.S.; Gillespie, J.; Jepson, G.; Li, Y.C. Tectonic-thermal evolution of the southwestern Alxa Tectonic Belt, NW China: Constrained by apatite U-Pb and fission track thermochronology. Tectonophysics 2017, 722, 577–594. [Google Scholar] [CrossRef]
- Zhang, B.H.; Zhang, J.; Zhao, H.; Nie, F.J.; Wang, Y.N.; Zhang, Y.P. Tectonic evolution of the western Ordos Basin during the Palaeozoic-Mesozoic time as constrained by detrital zircon ages. Int. Geol. Rev. 2018, 61, 461–480. [Google Scholar] [CrossRef]
- Xu, L.M.; Zhou, L.F.; Deng, K.; Yang, W.J. Geochemical characteristics of Permian event strata in western margin of Ordos basin. Coal Geol. Explor. 2006, 34, 4–8, (In Chinese with English abstract). [Google Scholar]
- Zhang, G.W.; Zhang, B.R.; Yuan, X.C.; Xiao, Q.H. Continental Dynamics of Qinling Orogen; Science Press: Beijing, China, 2001; pp. 1–855, (In Chinese with English abstract). [Google Scholar]
- Meng, Q.R.; Zhang, G.W. Timing of collision of the North and South China blocks: Controversy and reconciliation. Geology 1999, 27, 123–126. [Google Scholar] [CrossRef]
- Shi, G.Z.; Soares, C.J.; Shen, C.B.; Wang, H.; Yang, C.Q.; Liang, C.; Liu, M.H. Combined detrital zircon fission track and U-Pb dating of the Late Paleozoic to Early Mesozoic sandstones in the Helanshan, western Ordos fold-thrust belt: Constrains for provenance and exhumation history. J. Geodyn. 2019, 130, 57–71. [Google Scholar] [CrossRef]
- Zheng, D.W.; Zhang, P.Z.; Wan, J.L.; Li, D.M.; Wang, F.; Yuan, D.Y.; Zhang, G.L. The 40Ar/39Ar, fission track evidence of Mesozoic tectonic in northern margin of west Qinling mountain. Acta Petrol. 2004, 20, 697–706, (In Chinese with English abstract). [Google Scholar]
- Xu, X.Y.; Chen, J.L.; Gao, T.; Li, P.; Li, T. Granitoid magmatism and tectonic evolution in northern edge of the Western Qinling terrane, NW China. Acta Petrol. Sin. 2014, 30, 371–389. [Google Scholar]
- Ritts, B.D.; Darby, B.J.; Cope, T. Early Jurassic extensional basin formation in the Daqing Shan segment of the Yinshan belt, northern China Block, Inner Mongolia. Tectonophysics 2001, 339, 239–258. [Google Scholar] [CrossRef]
- Li, M.J.; Zheng, M.L.; Cao, C.C. Evolution of superposed Jurassic and Cretaceous basins in Beishan-Alxa area. Oil Gas. Geol. 2004, 25, 54–57, (In Chinese with English abstract). [Google Scholar]
- Gao, F.; Wang, Y.J.; Liu, S.S.; Hu, B.Q. Thermal history study in the west of the Ordos basin using apatite fission track analysis. Geotecton. Metallog. 2000, 24, 87–91, (In Chinese with English abstract). [Google Scholar]
- Zhao, M.W.; Behr, H.J. Vitrinite reflectance in Triassic with relation to geothermal history of Ordos basin. Acta Pet. Sin. 1996, 13, 1–9, (In Chinese with English abstract). [Google Scholar]
- Ren, Z.L.; Zhao, Z.Y.; Chen, G. Tectonic thermal events of Late Mesozoic in Qinshui basin. Oil Gas. Geol. 1999, 20, 46–48, (In Chinese with English abstract). [Google Scholar]
- Huang, X.F.; Qian, Z.Z.; Sun, B.P.; Wu, W.K.; Lu, Y.J.; Wang, C. Characteristics and evolution of the thrust-nappe structure in the area of Xiaosongshan in the north section of Helan Mountain. J. Northwest Univ. (Nat. Sci. Ed.) 2011, 41, 273–277, (In Chinese with English abstract). [Google Scholar]
- Chen, G.; Wang, Z.W.; Bai, G.J.; Sun, J.B.; Zhang, H.R.; Li, X.D. Meso-Cenozoic peak-age events and their tectono-sedimentary response in the Ordos basin. Geol. China 2007, 34, 375–383, (In Chinese with English abstract). [Google Scholar]
- He, Z.X. Petroleum and Evolution in Ordos Basin; Petroleum Industry Press: Beijing, China, 2003; pp. 121–123, (In Chinese with English abstract). [Google Scholar]
- Zhai, M.G.; Zhu, R.X.; Liu, J.M.; Meng, Q.R.; Hou, Q.L.; Hu, S.B.; Liu, W.; Li, Z.; Zhang, H.F.; Zhang, H.F. Time range of Mesozoic tectonic regime inversion in eastern North China Block. Sci. China Ser. D Earth Sci. 2004, 47, 151–159, (In Chinese with English abstract). [Google Scholar] [CrossRef]
- Zhai, M.G.; Meng, Q.R.; Liu, J.M. Geological features of Mesozoic tectonic regime inversion in Eastern North China and implication for geodynamics. Earth Sci. Front. 2004, 11, 285–298, (In Chinese with English abstract). [Google Scholar]
- Liu, C.Y.; Zhao, H.G.; Wang, F.; Chen, H. Attributes of the Mesozoic structure on the west margin of the Ordos basin. Acta Geol. Sin. 2005, 79, 737–747. [Google Scholar]
- Chen, Y.; Li, J.G.; Miao, P.S.; Chen, L.L.; Zhao, H.L.; Wang, C.; Yang, J. Relationship between the tectono-thermal events and sandstone-type uranium mineralization in the southwestern Ordos Basin, Northern China: Insights from apatite and zircon fission track analyses. Ore Geol. Rev. 2022, 143, 104792. [Google Scholar] [CrossRef]
- Chen, L.H.; Wang, Y.D.; He, P.J.; Song, C.H.; Meng, Q.Q.; Feng, W.; Chen, W.Q.; Wang, X.H. Mesozoic-Cenozoic multistage tectonic deformation of the Qilian Shan constrained by detrital apatite fission track and zircon U-Pb geochronology in the Yumu Shan area. Tectonophysics 2021, 822, 229151. [Google Scholar] [CrossRef]
- Yin, A.; Harrison, T.M. Geologic Evolution of the Himalayan-Tibetan orogen. Annu. Rev. Earth Planet. Sci. 2000, 28, 211–280. [Google Scholar] [CrossRef]
- Jia, C.Z.; Wei, G.Q.; Li, B.L. Yanshanian tectonic features in west-central China and their petroleum geological significance. Oil Gas. Geol. 2005, 26, 9–15, (In Chinese with English abstract). [Google Scholar]
- Ma, J.H.; He, D.F. Meso-Cenozoic tectonic events in the Helanshan Tectonic Belt and its adjacent areas: Constraints from unconformity and fission track data. Acta Petrol. Sin. 2019, 35, 1121–1142, (In Chinese with English abstract). [Google Scholar]
- Li, Z.H.; Dong, S.W.; Qu, H.J. Timing of the initiation of the Jurassic Yanshan movement on the North China Craton: Evidence from sedimentary cycles, heavy minerals, geochemistry, and zircon U–Pb geochronology. Int. Geol. Rev. 2014, 56, 288–312. [Google Scholar] [CrossRef]
- Gao, S.L.; Li, F.; Li, T.B.; Lv, C.G.; Lu, Y.J. Discussion of the relationship between coal metamorphism and the Late Mesozoic basalt in Rujigou Area. Coal Geol. Explor. 2003, 31, 8–10, (In Chinese with English abstract). [Google Scholar]
- Zhao, Y.; Cui, S.Q.; Guo, T.; Xu, G. Evolution of a Jurassic basin of the Western Hills, Beijing, North China and its tectonic implications. Geol. Bull. China 2002, 21, 211–217, (In Chinese with English abstract). [Google Scholar]
- Cui, J.J.; Zhang, Y.Q.; Dong, S.W.; Jahn, B.M.; Xu, X.B.; Ma, L.C. Zircon U–Pb geochronology of the Mesozoic metamorphic rocks and granitoids in the coastal tectonic zone of SE China: Constraints on the timing of Late Mesozoic orogeny. J. Asian Earth Sci. 2013, 62, 237–252. [Google Scholar] [CrossRef]
- Li, J.H.; Zhang, Y.Q.; Dong, S.W.; Johnston, S.T. Cretaceous tectonic evolution of South China: A preliminary synthesis. Earth-Sci. Rev. 2014, 134, 98–136. [Google Scholar] [CrossRef]
- Lim, C.; Cho, M. Two-phase contractional deformation of the Jurassic Daebo Orogeny, Chungnam Basin, Korea, and its correlation with the early Yanshanian movement of China. Tectonics 2011, 31. [Google Scholar] [CrossRef]
- Mock, C.; Arnaud, N.O.; Cantagrel, J.M. An early unroofing in northeastern Tibet? Constraints from 40Ar/39Ar thermochronology on granitoids from the eastern Kunlun range (Qinghai, NW China). Earth Planet. Sci. Lett. 1999, 171, 107–122. [Google Scholar] [CrossRef]
- Davis, G.A.; Qian, X.L.; Zheng, Y.D.; Tong, H.M.; Yu, H.; Wang, C.; Gehrels, G.E.; Shafiquallah, M.; Fryxell, J.E. Mesozoic deformation and plutonism in the Yungmeng Shan: A metamorphic core complex north of Beijing, China. In The Tectonic Evolution of Asia; Yin, A., Harrison, T.A., Eds.; Cambridge University Press: New York, NY, USA, 1996; pp. 253–280. [Google Scholar]
- Davis, G.A.; Darby, B.J. Early Cretaceous overprinting of the Mesozoic Daqing Shan fold-and-thrust belt by the Hohhot metamorphic core complex, Inner Mongolia, China. Geosci. Front. 2010, 1, 1–20. [Google Scholar] [CrossRef]
- Lin, W.; Faure, M.; Monie, P.; Scharer, U.; Panis, D. Mesozoic extensional tectonics in eastern Asia: The South Liaodong Peninsula Metamorphic Core Complex (NE China). J. Geol. 2008, 116, 134–154. [Google Scholar] [CrossRef]
- Zhu, G.; Xie, C.L.; Chen, W.; Xiang, B.W.; Zhao, Q.H. Evolution of the Hongzhen metamorphic core complex: Evidence for Early Cretaceous extension in the eastern Yangtze craton, eastern China. Geol. Soc. Am. Bull. 2010, 122, 506–516. [Google Scholar] [CrossRef]
- Faure, M.; Sun, Y.; Shu, L.; Monie, P.; Charvet, J. Extensional tectonics within a subduction-type orogen. The case study of the Wugongshan dome (Jiangxi Province, SE China). Tectonophysics 1996, 263, 77–106. [Google Scholar] [CrossRef]
- Wang, T.; Guo, L.; Zheng, Y.D.; Donskaya, T.; Gladkochub, D.; Zeng, L.S.; Li, J.B.; Wang, Y.B.; Mazukabzov, A. Timing and processes of late Mesozoic mid-lower crustal extension in continental NE Asia and implications for the tectonic setting of the destruction of the North China Craton: Mainly constrained by zircon U–Pb ages from metamorphic core complexes. Lithos 2012, 154, 315–345. [Google Scholar] [CrossRef]
- Dong, S.W.; Zhang, Y.Q.; Long, C.X.; Yang, Z.Y.; Ji, Q.; Wang, T.; Hu, J.M.; Chen, X.H. Jurassic tectonic revolution and new interpretation of Yanshan Movement. Acta Geol. Sin.-Engl. Ed. 2008, 82, 334–347. [Google Scholar]
- Min-Na, A.; Zhang, F.Q.; Yang, S.F.; Chen, H.L.; Batt, G.E.; Sun, M.D.; Meng, Q.A.; Zhu, D.F.; Cao, R.C.; Li, J.S. Early Cretaceous provenance change in the southern Hailar Basin, northeastern China and its implication for basin evolution. Cretac. Res. 2013, 40, 21–42. [Google Scholar]
- Song, Y.; Ren, J.Y.; Stepashko, A.A.; Li, J.G. Post-rift geodynamics of the Songliao Basin, NE China: Origin and significance of T11 (Coniacian) unconformity. Tectonophysics 2014, 634, 1–18. [Google Scholar] [CrossRef]
- Song, Y.; Stepashko, A.; Liu, K.Y.; He, Q.K.; Shen, C.B.; Shi, B.J.; Ren, J.Y. Post-rift tectonic history of the Songliao Basin, NE China: Cooling events and post-rift unconformities driven by orogenic pulses from plate boundaries. J. Geophys. Res. Solid Earth 2018, 123, 2363–2395. [Google Scholar] [CrossRef]
- Xia, Z.M.; Liu, J.L.; Ni, J.L.; Zhang, T.T.; Shi, X.M.; Wu, Y. Structure, evolution and regional tectonic implications of the Queshan metamorphic core complex in eastern Jiaodong Peninsula of China. Sci. China Earth Sci. 2016, 59, 997–1013. [Google Scholar] [CrossRef]
- Chen, H.; Hu, J.M.; Wu, G.L.; Shi, W.; Geng, Y.Y.; Qu, H.J. Apatite fission-track thermochronological constraints on the pattern of late Mesozoic-Cenozoic uplift and exhumation of the Qinling Orogen, central China. J. Asian Earth Sci. 2015, 114, 649–673. [Google Scholar] [CrossRef]
- Huang, Z.G.; Ren, Z.L.; Gao, L.G. Evidence from detrital zircon and apatite fission track for tectonic evolution since Cretaceous in southeastern margin of Ordos basin. Chin. J. Geophys. 2016, 59, 3753–3764, (In Chinese with English abstract). [Google Scholar]
- Wang, G.C.; Xiang, S.Y.; Wang, A.; Garver, J.I.; Wintsch, R.P. Thermochronological constraint to the processes of the East Kunlun and adjacent areas in Mesozoic–early Cenozoic. Earth Sci. 2007, 32, 605–614, (In Chinese with English abstract). [Google Scholar]
- Wang, A.; Wang, G.; Zhang, K.; John, G.I. An early Cenozoic tectonic event in Eastern Kunlun Orogen, evidence from detrital fission track geochronology. Earth Sci. 2010, 35, 737–746, (In Chinese with English abstract). [Google Scholar]
- He, P.J.; Song, C.H.; Wang, Y.D.; Chen, L.H.; Chang, P.F.; Wang, Q.Q.; Ren, B. Cenozoic exhumation in the Qilian Shan, northeastern Tibetan Plateau, Evidence from detrital fission track thermochronology in the Jiuquan Basin. J. Geophys. Res. Solid Earth 2017, 122, 6910–6927. [Google Scholar] [CrossRef]
- Bovet, P.M.; Ritts, B.D.; Gehrels, G.; Abbink, A.O.; Darby, B.; Hourigan, J. Evidence of Miocene crustal shortening in the North Qilian Shan from Cenozoic stratigraphy of the western Hexi Corridor, Gansu Province, China. Am. J. Sci. 2009, 309, 290–329. [Google Scholar] [CrossRef]
- George, A.D.; Marshallsea, S.J.; Wyrwoll, K.H.; Chen, J.; Lu, Y.C. Miocene cooling in the northern Qilian Shan, northeastern margin of the Tibetan Plateau, revealed by apatite fission-track and vitrinite-reflectance analysis. Geology 2001, 29, 939–942. [Google Scholar] [CrossRef]
- Tapponnier, P.; Xu, Z.Q.; Roger, F.; Meyer, B.; Arnaud, N.; Wittlinger, G.; Yang, J.S. Oblique stepwise rise and growth of the Tibet Plateau. Science 2001, 294, 1671–1677. [Google Scholar] [CrossRef]
- Zhang, X.M.; Wang, Y. Seismic and GPS evidence for the kinematics and the state of stress of active structures in south and south-central Tibetan Plateau. J. Asian Earth Sci. 2007, 29, 283–295. [Google Scholar] [CrossRef]
- Wang, Y.; Li, Q.; Qu, G.S. 40Ar/39Ar Thermochronological Constraints on the Cooling and Exhumation History of the South Tibetan Detachment System, Nyalam Area, Southern Tibetan; Special Publications; Geological Society: London, UK, 2006; Volume 268, pp. 327–354. [Google Scholar]
| Disclaimer/Publisher’s Note: The statements, opinions and data contained in all publications are solely those of the individual author(s) and contributor(s) and not of MDPI and/or the editor(s). MDPI and/or the editor(s) disclaim responsibility for any injury to people or property resulting from any ideas, methods, instructions or products referred to in the content. |
© 2024 by the authors. Licensee MDPI, Basel, Switzerland. This article is an open access article distributed under the terms and conditions of the Creative Commons Attribution (CC BY) license (https://creativecommons.org/licenses/by/4.0/).


