Article

Influence of Transport Distance, Animal Weight, and Muscle Position on the Quality Factors of Meat of Young Bulls during the Summer Months

1
DIL German Institute of Food Technologies, Professor-von-Klitzing-Straße 7, 49610 Quakenbrück, Germany
2
Department of Food Material Science, University of Hohenheim, Garbenstraße 25, 70599 Stuttgart, Germany
*
Authors to whom correspondence should be addressed.
Appl. Sci. 2024, 14(9), 3557; https://doi.org/10.3390/app14093557
Submission received: 13 February 2024 / Revised: 19 April 2024 / Accepted: 20 April 2024 / Published: 23 April 2024
(This article belongs to the Special Issue Advances in Meat Quality and Processing)

Abstract

:
This study investigated the potential effects of transport distance, animal weight, and muscle position on meat quality in young bulls under commercial conditions across four slaughtering weeks during the summer months (May to September). Data on transport distance, lairage time, and ambient temperature during slaughtering days were collected from 80 young bulls from North German farms. Meat quality parameters, including pH, temperature, and meat color were also recorded at several post-mortem times from two different carcass locations (shoulder clod and silverside). Meat texture was evaluated both by sensory and instrumental analysis, and their values were compared to find possible correlations between them. All of the aforementioned main factors (transport distance, animal weight, and muscle position), as well as the interaction between animal weight and transport distance, significantly influenced (p < 0.01) meat quality traits. The results of the assessment of the meat texture from the cooked meat patties suggested that silverside cuts were consistently harder than shoulder clod cuts, despite having lower pH48 values.

1. Introduction

The perceptions of consumers regarding meat quality could be influenced by the origins of meat, its appearance, sensory attributes, nutritional intake, health benefits, and microbiological safety [1,2]. Some of these parameters are realized through biochemical and physical transformations in post-mortem muscle once animal metabolism and respiration cease [3,4]. From a sensory point of view, meat appearance and texture seem to be the most determinant factors in consumer satisfaction [5]. Meat color is of major importance in meat marketability, since it plays a prominent role in the first impressions that meat products make on consumers and thus influences their buying decisions [6]. Meat color correlates with the amount of myoglobin in the muscle, the redox status of the heme group, and the sixth ligand attached to the iron ion of myoglobin. Depending on these mechanisms, meat can take on a purplish-red color (deoxymyoglobin); a bright cherry-red color (oxymyoglobin); or a dull-brown color (metmyoglobin) [7,8]. Conventionally, three color coordinates have been used to evaluate the color of oxidative changes occurring on the meat surface: L* (lightness), a* (redness), and b* (yellowness) [9,10]. More accurate results related to human color perception can be calculated using hue angle (hab) and chroma or color saturation (C*), which are values derived from the a* and b* parameters. hab refers to overall color in relationship to wavelength, while C* indicates the intensity (saturation) of the red color in meat [11,12].
Meat texture also plays a fundamental role in informing the opinions of consumers about a particular meat product, and in influencing their willingness to buy it on repeat occasions [4,13]. Tenderness and/or hardness are arguably the most important palatability attributes in meat, even more so than juiciness or flavor, as consumers are willing to pay premium prices for tender beef [14,15]. The degree of tenderness in meat can be variably influenced by ultimate pH, muscle fiber type, sarcomere length, and by the breakdown of myofibrillar proteins and connective tissue [16,17,18]. A significant improvement in meat tenderness can be achieved using the wet-aging process, which comprises the storage of beef meat sub-primal cuts at low residual oxygen pressures and at working temperatures between −1 and 2 °C [19] for around 7 to 21 days [20]. As compared to dry-aging, wet-aging has been proven to be a more economic, more efficient, and safer practice (from a microbiological point of view) for the improvement of meat quality [19]. Previous research has also suggested that the reduced oxygen exposure during wet-aging can enhance the proteolytic activity of meat, resulting in a more tender outcome [21].
Due to the high specialization of the current meat industry, the transport of live cattle is in most cases an unavoidable step in the production chain [22]. Diverse stress situations can arise during transport, lairage, and slaughter that may negatively affect the physiological and psychological status of the animals [23,24]. The type, severity, and duration of ante-mortem stressors, combined with the responses of individual animals to these stimuli, can variably compromise meat quality [24,25]. Greater chronic pre-mortem stress conditions in cattle may result in a post-mortem defect known as dark, firm, and dry (DFD) meat. DFD meat is characterized as having higher ultimate pH values, increased water holding capacity, and lower L*, a*, and b* color readings [26,27]. DFD-related problems are mostly due to reduced lactic acid accumulation in post-mortem muscle, which is precipitated by insufficient pre-mortem glycogen reserves [28,29,30]. This situation may also trigger the release of catecholamines in post-mortem muscle and negatively affect meat texture [31,32]. Regardless of the biochemical changes in myoglobin, light reflectance proportionally decreases in DFD meat, which contributes to darker aspect of this meat [28,33]. For these reasons, the aim of this study is to investigate the effects of different intrinsic and extrinsic factors on beef quality. To the best of our knowledge, only a few studies have correlated meat quality traits with the effects of animal weight, transport distances, and/or muscle position. The hypothesis of this research study is that beef color and texture can be influenced by any of these three main factors, either individually or through their interactions with each other, as depicted in Figure 1. Therefore, records of animal transport, along with the physicochemical parameters of fresh meat, such as pH, temperature, and color, were measured and analyzed. To find possible comparisons between instrumental and sensory texture analysis and meat quality, Warner–Bratzler shear force (WBSF) values for cooked meat patties were calculated, and sensory analysis was performed on both meat cuts for the purposes of evaluation and comparison.

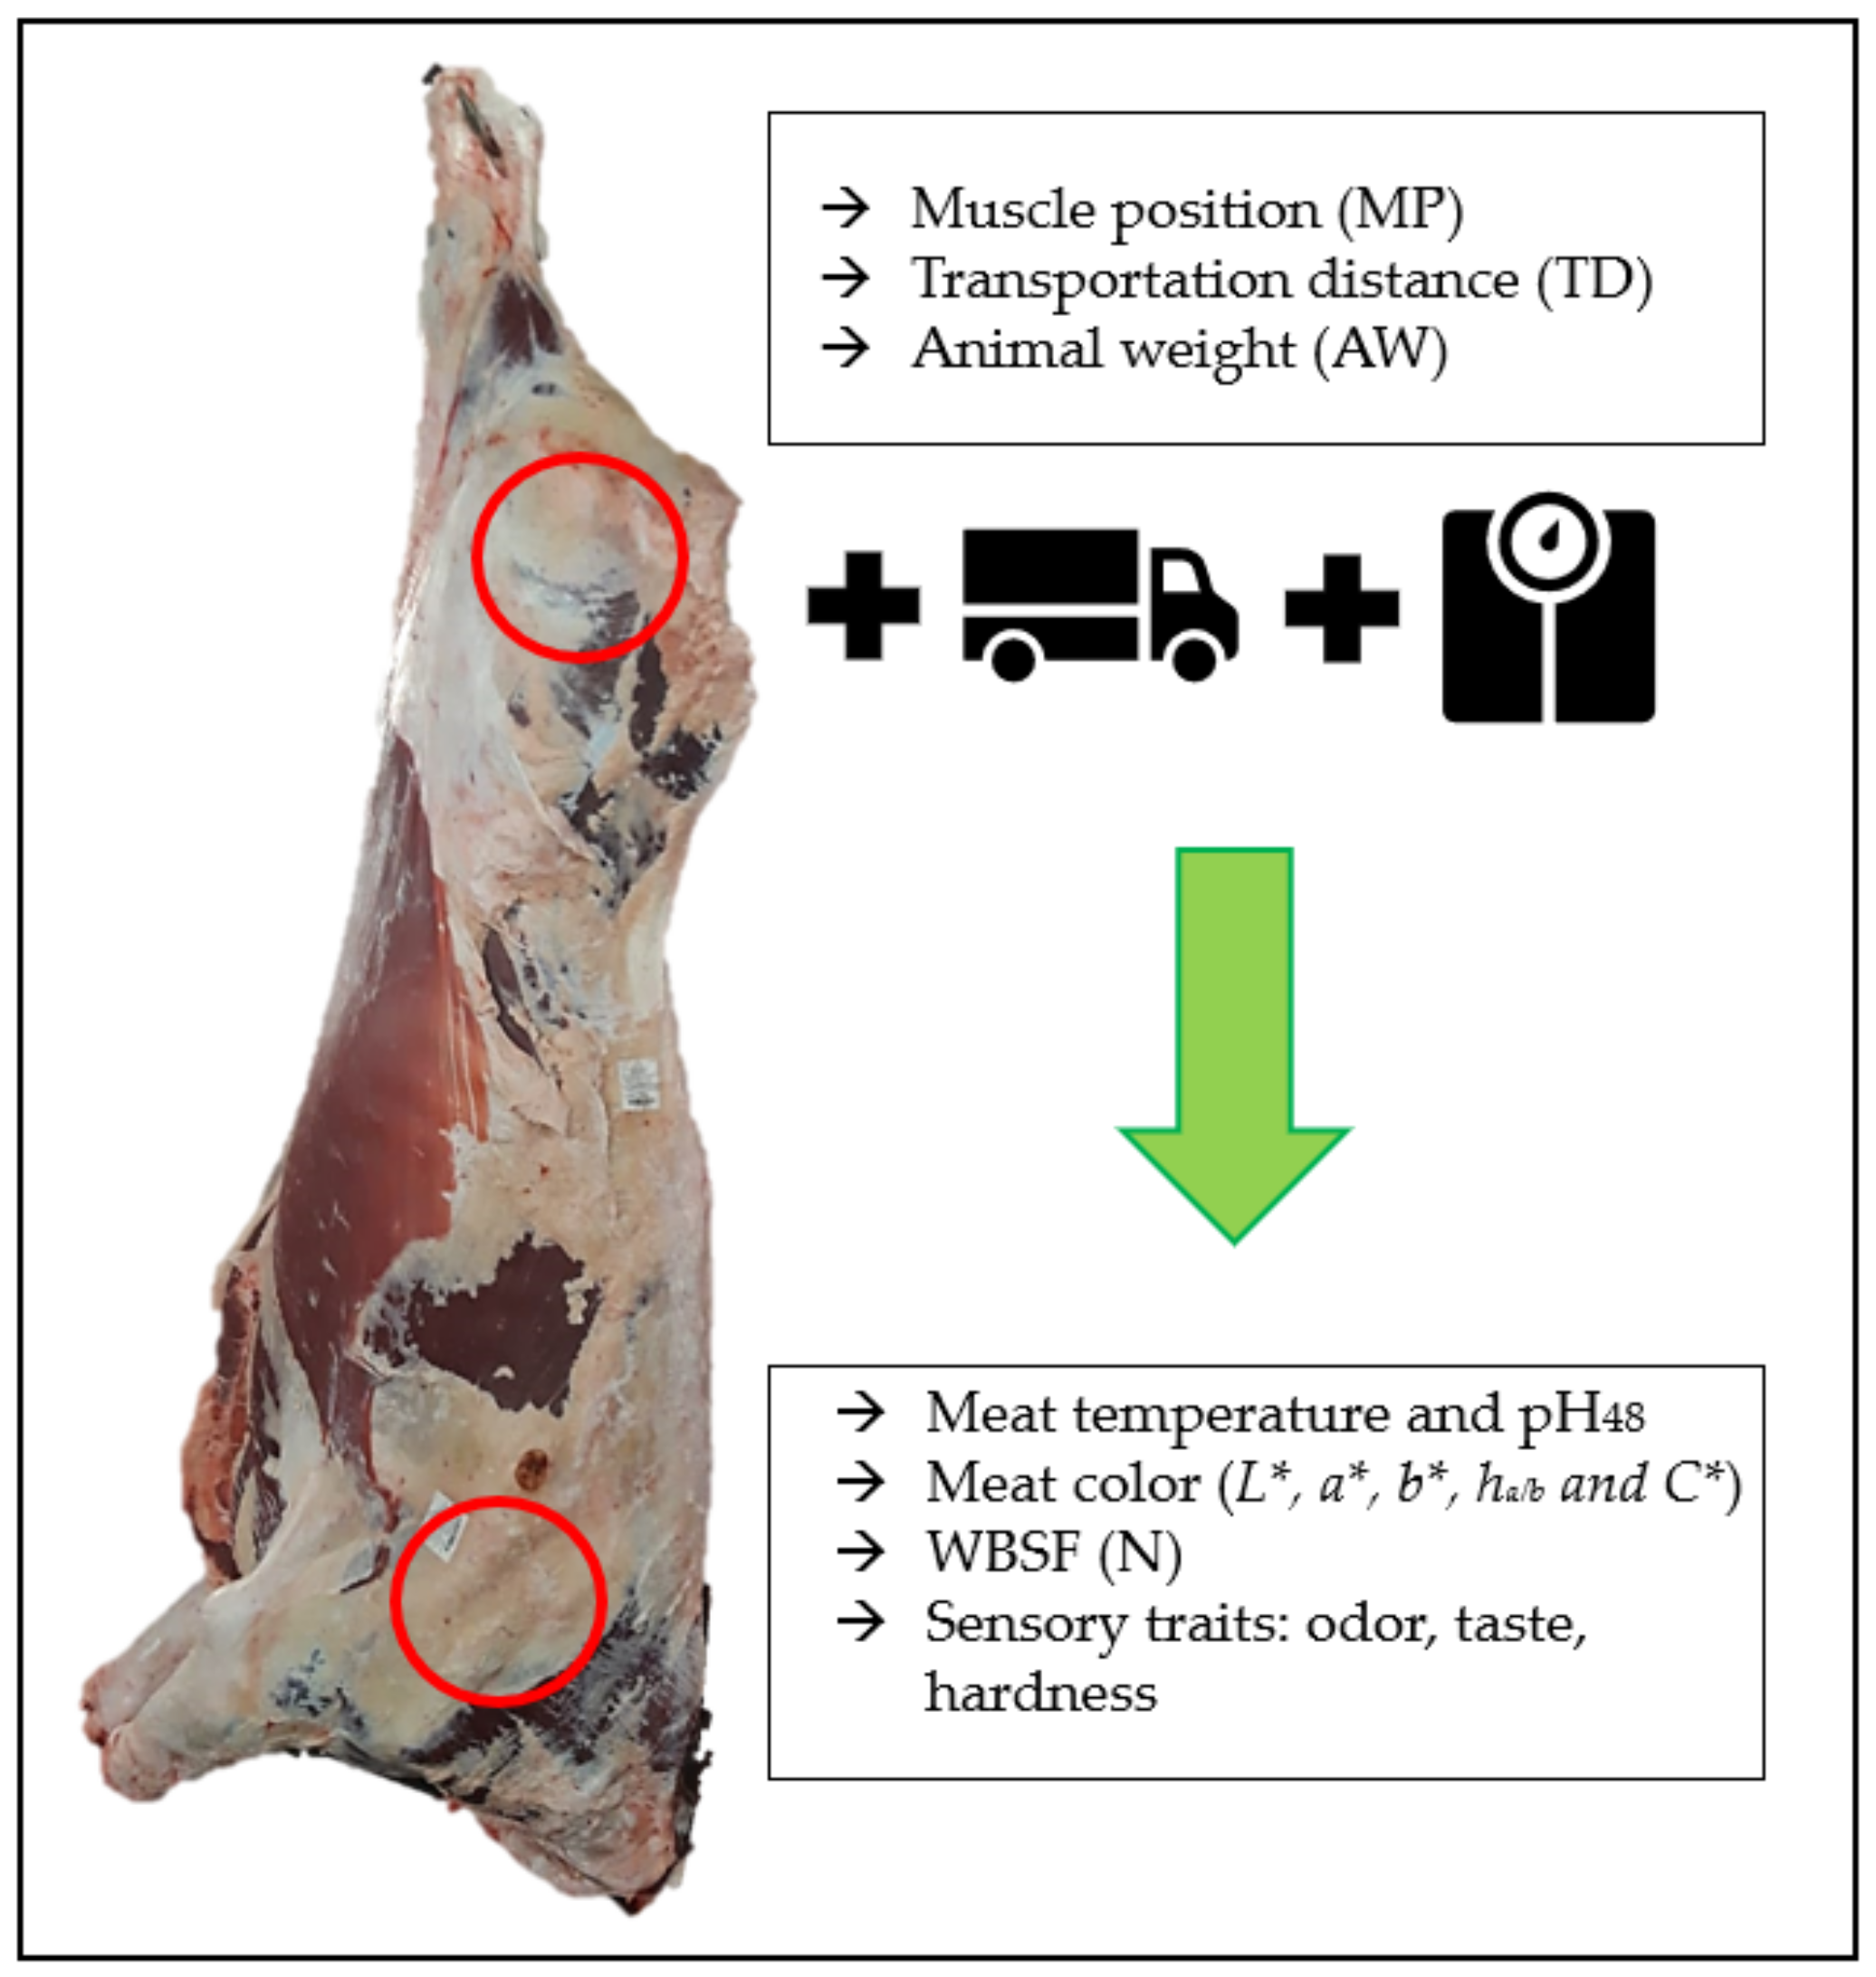
2. Materials and Methods

2.1. Data Collection

A total of 80 young bulls from northern German farms were processed under standard commercial conditions in a specialized cattle slaughterhouse (Böseler Goldschmaus, Niedersachsen, Germany). The experiment was conducted over four different working weeks during the summer months of 2022 (May to September). Average daytime temperatures between 7 and 25 °C were recorded throughout the experimental period. The slaughtering of the bulls exclusively occurred on Mondays and Tuesdays, spanning from 6:00 until 18:00 h. This operation involved the processing of 10 young bulls per working day, totaling 20 animals slaughtered within the course of a working week. Fleckvieh (Simmental) was the predominant breed in this study, representing 65% of the young bulls, followed by a cross of dairy × meat breeds (28.75%), Holstein–Friesian (2.5%), and other local breeds (3.75%), as displayed in Table 1. The animals traveled between 9.9 km and 83.8 km to reach the slaughterhouse, with transport times between 20 min and 80 min. The slaughter weight of the animals was between 316 kg and 534 kg, and the slaughter age was between 16.2 and 24.3 months, as presented in Table 2.
Upon arrival at the slaughterhouse, animals from the same truck were moved, distributed, and kept in lairage for between 33 min and 184 min. This was conducted in separate pens to prevent mixing with strange cattle (Table 2). Then, the young bulls were slaughtered after being stunned using a captive bolt, suspended by a hind leg, and exsanguinated. Carcasses were later classified by a trained inspector according to hot carcass weight, as detailed in Table 2. Backfat thickness and conformation scores were also assessed, considering the EU classification system scores of 1, 2, 3, 4, and 5 to represent the degree of fatness (with 1 representing carcasses with the lowest fat content, and 5 the highest), and E-U-R-O-P conformation scores (with E being the best and P the poorest), as described in Table 1. Samples were then collected from the left side of the hanging carcass after 45 min post-mortem, which was the usual time that it took for an animal to be processed (from exsanguination until the carcass entered the cooling rooms). From each individual carcass, samples totaling approximately 0.5 kg in weight were collected from the forequarter (shoulder clod) and the hindquarter (silverside). These samples were then immediately vacuum-packed. Shoulder clod (SC) samples primarily consisted of parts of M. triceps branchii, M. deltoideus, and M. supraspinatus, while the silverside (SS) samples encompassed M. gluteobiceps, M. tensor fasciae latae, and M. lateral vastus components. The meat temperature and pH were measured exactly at 0 h, 3 h, 5 h, and 24 h post-mortem at the same points of the carcasses from which the samples were extracted. In this way, more reliable data could be obtained. After 48 h, a new sample was cut from the hanging carcass, and instrumental color, temperature, and pH48 were determined. Then, the meat samples underwent a two-week wet-aging process at an average temperature of 2.5 °C. Immediately after that, the samples were promptly frozen for an additional eight-week period, maintaining an average temperature of −18.5 °C, after which the sensory analysis was conducted. In both cases, the temperature of the room was automatically regulated by a sensor that activated the compressor for cold air recirculation when necessary. The packaging material used for wet-aging was a polyamide–polyethylene mixture supplied by VF Verpackungen GmbH (Sulzberg, Germany). This material effectively prevented the exchange of oxygen and water between the samples and the environment.

2.2. Color Measurement

At 48 h post-slaughter, a different portion of shoulder clod and silverside muscles were removed from the carcasses, and the samples were placed with the freshly cut side facing upwards for 1 h of blooming at 2 °C. Then, instrumental L*, a*, and b* values were measured before vacuum-packaging the steaks for aging. Briefly, color measurements were performed using a portable ColorLite sph870 colorimeter (Katlenburg-Lindau, Germany), with 45°/0°measuring geometry and 8 mm aperture size. The illuminant used was D65 with the aperture set to 10°. The instrument had been previously calibrated using black and white ceramic tiles according to the manufacturer’s specifications. Measurements were taken directly over the surface of freshly cut meat, with 15 readings being taken every time, and the means of these readings were used for data analysis. Additionally, hab and C* were calculated using Equations (1) and (2) [34], as follows:
h a b = a r c t a n ( b * a * )
C * = a * 2 + b * 2

2.3. pH Measurement

The pH of each sample was measured by inserting the sensor of a portable Testo 205 pH meter (Lenzkirch, Germany) directly into the meat at 0, 3, 5, 24, and 48 h post-mortem. Previously, the glass sensor had been calibrated using standardized chilled buffer solutions with pH values of 4.00 and 7.00. The temperature of the buffer solution reflected the working temperature at the slaughterhouse. The pH measurement was performed at three different points inside the muscle, and the mean was calculated.

2.4. Sensory Analysis

After the samples were collected and packaged at the slaughterhouse, they were aged for two weeks. The samples were carefully inspected throughout this period for any possible surface color changes. Following the aging period, the meat samples were frozen for an additional eight weeks, after which the sensory analysis was performed. To prepare samples for this assessment, they were thawed at 2 °C for 48 h and trimmed of excess visible fat, cut, and minced using a 2 mm plate on a MADO Primus meat grinder MEW 713 (MADO GmbH, Dornhan/Schwarzwald, Germany). For every working week, four different groups were established between shoulder clod and silverside from the first (Monday) and the second (Tuesday) slaughter days as follows: day 1/shoulder clod; day 2/shoulder clod; day 1/silverside; and day 2/silverside. Each group was numbered with a three-digit number for internal records. Finally, the minced meat was formed manually into 35 g spherical meatballs of approximately 5 cm in diameter, flattened to 1.5–2 cm thickness, and fried in a two-plate contact fryer until the core temperature of the meat patties reached 72 °C. Then, the meat patties obtained from a single working week were randomly presented in each session to ten judges to assess differences in odor, taste, and hardness. The samples were kept in paper cups with a lid, which preserved the heat and the odor from the fresh fried meat patties. The judges were selected from a group of scientific workers that had previous experience with meat sensory analysis. Before the initial session, there was a short introduction to the topic and an explanation was provided as to how meat quality traits needed to be measured. A total of 40 replicates were prepared for every sensory evaluation session, which resulted in 160 samples being used in this study overall. Taste, odor, and hardness were measured using the a 1 to 100 scale, with 1 signifying “not perceptible” and 100 representing “intense” in all cases. The questionary for sensory evaluation both in German and English was added as Supplementary Materials.

2.5. Shear Force

The method for shear force measurement was adapted from Witte et al. [35]. Briefly, after each sensory analysis, ten technical replicates of every group of samples of the fried meat patties were preserved and analyzed for shear force measurement (n = 40). The meat patties were first cooled down to 4 °C and vacuum-packaged. Following overnight storage, the meat patties were cut down to a 2 cm thick block to ensure that the variation in thickness did not affect the results. Then, the samples were placed in a Stable Micro Systems texture analyzer TA-XT2 (Surrey, UK) equipped with a Warner–Bratzler (WSBF) blade and sheared at a constant speed of 2 mm/s until they were broken. The shear force, expressed in newtons, was processed using Stable Micro Systems Texture Expert Exceed software, version 2.64 (Surrey, UK).

2.6. Statistical Analysis

Descriptive statistics were used to calculate and compare different variables in our study (n = 160). Additionally, a multivariate analysis of variance (MANOVA) was carried out using SPSS software (version 23.0, IBM Corporation, Armonk, NY, USA). Data were previously inspected for univariate and multivariate normality using the Mahalanobis distance regression test with an alpha level of 0.001 [36]. Ten of the data were discarded; two were outliers and did not fit the conditions for normal distribution, and the other eight values were considered as being missing from the sensory analysis, since the relevant participants were not present at one of the appointments. For the rest of the data (n = 150), the statistical processing was based on the differences and interactions between the relevant independent variables, i.e., transport distance (TD), animal weight (AW), and muscle position (MP), and their effects on meat quality traits. Transport distances were divided into three groups: (i) short distance (TD < 34.5 km); (ii) medium distance (34.5 km < TD < 59.1 km); and (iii) long distance (TD > 59.1 km). Animal weight was also split between light (AW < 445 kg) and heavy animals (AW > 445 kg). Muscle position was determined either as shoulder clod (SC) or silverside (SS).
The dependent variables in the MANOVA model were the meat color scores (L*, a*, b*, hab, and C*), pH48, the WBSF values obtained from the instrumental texture determination, and the sensory quality traits (odor, taste, and hardness) obtained from the sensory analysis. Medias between treatments were compared using a Tukey post-hoc test at a significance level of 0.05. Additionally, a Pillay’s Trace test was used to find correlations between the different factors that may affect meat quality, at a significance level of 0.01.

3. Results and Discussion

Pre-slaughter stress during transport, lairage, and slaughtering may play a decisive role in determining beef quality. After stressful transport incidents, resting time is essential for glycogen repletion, tissue rehydration, and electrolyte restoration [37,38]. In Europe and North America, cattle slaughtering activities generally occur on the same day that the animals arrive to the abattoir. This guarantees agile carcass management and shorter processing times, which might eventually increase meat quality [24]. Implementing this system can potentially prevent negative behavioral reactions resulting from prolonged lairage time, especially when animals suffer from dehydration and feed deprivation, which can contribute to further glycogen decline [38,39]. It was established that even if animals had ad libitum access to food and water, stress reactions associated with exposure to new environments and new personnel might decrease their necessity for drinking and eating [24].
The mixing of unfamiliar animals before slaughter can also compromise meat quality, especially when cattle are repeatedly loaded and unloaded [28]. It has been reported that the meat from cattle commercialized through saleyards and auctions often exhibits higher pH and lower consumer acceptability than the meat from animals directly sold to the abattoir. It is possible that these animals are more often exposed to multiple stress situations caused by strange environments, animals, and operators [40,41]. It has also been argued that cattle exhibit more aggressive behavior when mixed during pre-mortem operations, which increases the probability of finding carcass bruises, thus affecting the carcass output and compromising meat quality [41,42]. Keeping animals between their familiar partners during finishing, loading, transporting, and slaughtering has been demonstrated as providing a calming effect for the animals, which can result in improved meat quality [38,43].
Another reason for increased pre-slaughter stress relates to the exposure of animals to extreme cold or hot environments. Cold weather combined with precipitation, along with large temperature fluctuations during slaughtering days, might increase involuntary movements experienced by animals (shivering) [44]. It has been hypothesized that these involuntary movements could lead to more intense mitochondrial biogenesis and cause higher mitochondrial oxygen consumption and lower color values in fresh meat [32]. Negative effects on the physical and physiological status of the animals have been linked to slaughtering temperatures higher than 21 °C or lower than 5 °C [45,46]. A previous study showed that up to 30% of the meat of young bulls slaughtered during the summer season had pH ≥ 6.2, which denoted DFD-related issues [47]. In our experiment, the average daily temperatures throughout the slaughtering days were between 10 and 18.8 °C, with temperature fluctuations no higher than 8 °C, which probably contributed to the observation of meat samples with pH48 < 5.8 in all treatments.

3.1. Combined Effects of Transport Distance (TD), Animal Weight (AW) and Muscle Position (MP) on Meat Quality Traits

The results of the combination of factors yielded a statistically significant difference (p < 0.01) between different TD, AW, and MP levels using the Pillay’s Trace test. Based on these findings, there was enough evidence to show that TD, AW, and MP influenced meat quality parameters, as shown in Table 3.
The interaction between factors resulted in only significant differences for AW × TD. This combination of factors indicated that heavy animals (AW > 445 kg) transported over medium distances (34.5 < TD < 59.1 km) produced meat with the highest average pH48 values, and this combination also yielded steaks with the lowest hardness scores from all treatments, according to the results from the sensory analysis. In this case, the instrumental texture measured in N as force values tended to be smaller and did not show any correlation with the sensory analysis. Light animals (AW < 445 kg) transported for short distances (TD < 34.5 km) exhibited meat with higher significant hab and non-significant C* values, which resulted in meat with a more saturated red color than the rest of the treatments.
The statistical results of the MANOVA analysis showed that there was a significant effect of transport distance (TD), animal weight (AW), and muscle position (MP) on meat pH48 values, and on L*, b*, and hab scores, but none of the other dependent variables were significantly impacted, as shown in Table 4. Interestingly, none of the sensorial characteristics, instrumental texture analysis, or a* and C* color parameters were found to be significantly influenced by any of these three main factors. Also, the information elicited from the multivariate test for the three-factor combination did not show any significant effect on meat quality, as shown in Table 3. These results confirmed that there was an overall irrelevant influence of the factor combination on meat quality.

3.2. Spearman Rank-Order Correlations between TD, AW, and MP on Meat Quality Traits

The Spearman rank-order correlations between TD, AW, and MP on meat quality are shown in Table 5. These correlations greatly differed based on the factor and on the dependent variable that was measured.
This output confirmed that there was a significant positive relationship between TD and meat pH48 and L* values, but a negative non-significant relationship with a*, b*, hab, and C* WBSF, along with sensory traits. This information suggests that increasing TD causes pH48 and L* values to significantly increase.
AW showed weak non-significant relationships with many of the meat quality parameters analyzed in this study. However, negative relationships between AW and pH48, L*, a*, b*, hab, and C* values suggest that increasing AW may result in decreases these variables.
MP had a significant negative relationship with pH48 values. Since the numerical interpretation for MP in the MANOVA model was SC = 1 and SS = 2, it showed that SS steaks exhibited significantly decreasing pH48 values. MP also showed non-significant positive relationships with all color variables (L*, a*, b*, hab, and C*), suggesting that SS cuts tended to produce brighter, redder, and more vibrant colors than SC cuts. There was also a positive significant relationship between MP and sensory hardness determination, showing that SS may be consistently tougher than SC. The same relationship was determined between MP and WBSF values, but in this case, those values were not significant.

3.3. Transport Distance (TD)

Transport of livestock has been recognized as one of the most important pre-mortem factors affecting meat quality. Extensive handling during transport implies that animals need to expend extra energy to move and to maintain balance [48]. This can have potential effects on calpain-mediated proteolysis, glycogen amounts, and ultimate meat pH [24,48]. For instance, studies have shown that cattle transported over extreme long distances (up to 1800 km) suffer a high degree of stress, raising the probability of finding DFD-related problems in post-mortem meat. This effect was found to have been particularly intense when lairage time was insufficient for the animals to recover after long journeys [39,49]. Another study confirmed that bulls transported over long distances (300 km) produced meat with a significantly higher pH than bulls transported for only 125 km [50]. It was also concluded that animals transported over longer distances (850 km) exhibited higher exhaustion symptoms, increased blood glycogenolysis levels, and higher meat pH in comparison with animals transported over medium distances (450 km) [48]. In our experiment, transport conditions did not appear to be a significant source of animal stress; this was likely because the young bulls were only transported average distances (shorter than 50 km) from the farms to the slaughterhouse over time periods spanning less than 2 h (Table 2). The transport conditions were also in compliance with German legislation, which states that livestock should not be transported for more than 8 h before they reach the slaughterhouse [51]. Our results agree with previous opinions, which have argued that transport times less than 6 h do not imply serious risks for meat quality [24,52]. In our experiment, it was observed that short TD (<34.5 km) resulted in significant lower pH48 and lower L* values, which agreed with previous publications showing the same effect in fresh beef meat [53,54]. However, a different working group found exactly the opposite effect, showing that lower pHu can cause L* values to increase [27]. This contradiction in the L* values found across the literature is most likely related to the pHu limits set for every experiment. It was proposed in one study that depending on the pHu range, the recorded L* value can also change accordingly [53]. TD also did not show any important differences in a* values; however, shorter TD was related to higher significant b* and hab, but not C*, values. These values showed that the meat from animals that had undergone short TD tended to be yellowish with intense and vivid colors, when compared with the meat pieces of animals that underwent medium and long TD. No significant differences were found for meat hardness between different TDs, according to both sensory analysis and WBSF results. There were also no significant differences observed for odor and taste judgement between treatments. A similar study that compared various pre-slaughter transport times and the sensory characteristics of beef found that there were no discernible correlations between the meat’s sensory traits, including hardness, flavor, or odor, when animal transport lasted less than 6 h [55].

3.4. Animal Weight (AW)

Usually, higher animal weight can be attained in those cattle that were fed high-calorie diets [56,57]. It has also been reported that heavier animals generally receive a high-calorie meal before leaving for the abattoir. This practice may contribute to their ability to withstand pre-mortem stress and maintain high pre-mortem glycogen levels. Consequently, lower meat pH values and better meat quality are favored [58]. Conversely, lighter animals may be more sensitive to pre-mortem stress, due to lower pre-mortem glycogen reserves [26], which may result in lower intra-muscular lactic acid accumulation. Such circumstances can often be associated with higher ultimate meat pH values [30]. Our findings confirmed that heavier animals (AW > 445 kg) tended to achieve slightly lower meat pH values (Table 6). Slightly increased L* values were also found in the meat from heavier animals, which aligns with the results of prior investigations [56,59]. This color enhancement may be attributed to the higher shrinkage of muscle fibers, potentially leading to higher light scattering in the meat [60]. Reduced a* values in the meat of light cattle (AW < 445) also produced increased hab and C*, which agreed with previous reports that predicted similar results [11,20]. It was also found that heavier animals (AW > 445) produced softer meat, determined by both sensory and instrumental analysis, and increased taste scores, as shown in Table 6.

3.5. Muscle Position (MP)

Specific meat cuts, such as those used for animal locomotion, could be more prone to superficial metmyoglobin accumulation during wet-aging, due to higher mitochondrial abundance and activity [32,61,62]. Since post-mortem muscle is not inert, mitochondria can continue to metabolize the remaining oxygen in vacuum-packaged meat for several weeks [63]. A critical point can be reached during wet-aging when oxygen concentration levels achieve values between 0.5 and 1%, which triggers a maximum metmyoglobin formation [34,63]. Higher mitochondrial activity may also decrease oxygen availability to bind with myoglobin, which is a crucial step for imparting meat its bright red color [32,64]. The observation of higher myoglobin contents associated to the two studied carcass positions suggested that a greater oxidative capacity might also result in discoloration problems [53]. Beef muscles primarily composed from oxidative rather than from glycolytic fibers tend to have higher levels of pro-oxidants, such as heme iron and phospholipids, that can lead to gray, greenish, or brownish muscles [65]. Since visual stimuli have a major impact on consumer’s judgment of meat, muscles which are not red in color might be misinterpreted by consumers as lacking freshness and wholesomeness [7,66]. SC muscles showed higher ultimate pH than SS, which was probably related to poorer color readings (L*, a*, b*, hab, and C*), as shown in Table 5. Interestingly, higher pH values in the SC were not correlated neither with WBSF values nor with sensory hardness values, and it was shown that SC muscles were rated as softer muscles. This finding might be related to the increased release of catecholamines in the SS muscles, leading to potential adverse effects on meat texture [31]. Taste and odor values were also higher for SC than SS, and reaffirmed that in this case, these sensory traits were mostly unrelated to pH development in meat.

4. Conclusions

Our study suggested that reduced animal stress may be one of the reasons why the physical and physiological states of the young bulls were not seriously affected during transport, lairage, and slaughtering in this experiment. Several factors may have played a role in these results. Firstly, the animals had to wait in the lairage pens for less than two hours until being slaughtered. Secondly, the cattle were kept in small lots of familiar animals during transport and lairage. Finally, the average daily temperatures during the slaughtering days were between 10 and 18.8 °C, with temperature fluctuations no higher than 8 °C in all cases. These conditions may have potentially contributed to the obtaining of meat with pH48 values lower than 5.8 and a* threshold values higher than 14.5, which is the limit recommended for consumer acceptability. Improved meat quality traits could be obtained from animals with the shortest transport journeys (TD < 34.5 km) and the highest animal weight (AW > 445). It seems that this factor combination could have been significantly beneficial in developing acceptable quality characteristics from both of the meat cuts analyzed in this manuscript. None of the treatments produced any DFD-related issues, even if muscles from both muscle positions were catalogued as being more prone to discoloration processes during wet-aging due to higher myoglobin and mitochondrial content. Higher pH48 values tended to be obtained from the SC, which resulted in lower L*, a*, and b* readings. Unexpectedly, lower meat pH48 values in SS likely contributed to tougher meat when assessed through instrumental or sensory texture analysis. This information coincided with the measurements obtained from the Spearman nonparametric correlations. It was also concluded that the two texture analysis methods highly correlated with each other in this experiment. Further research should emphasize the implementation of more robust traceability, which would significantly enhance the quality and reliability of the results. This could be accomplished through extending this project to a larger number of animals and conducting the experiment during different seasons throughout the year.

Supplementary Materials

The following supporting information can be downloaded at: https://www.mdpi.com/article/10.3390/app14093557/s1.

Author Contributions

Conceptualization, M.G., I.T., V.H. and N.T.; methodology, A.P.-A., M.G. and I.T.; validation, M.G., V.H. and N.T.; formal analysis, A.P.-A.; investigation, A.P.-A. and A.B.; resources, A.B., J.K., M.G., V.H. and N.T.; data curation, A.P.-A.; writing—original draft preparation, A.P.-A.; writing—review and editing, M.G., I.T., J.K.,V.H. and N.T.; supervision, M.G., I.T., V.H. and N.T.; funding acquisition, M.G., V.H. and N.T. All authors have read and agreed to the published version of the manuscript.

Funding

This IGF Project of the FEI was supported via AiF within the program for promoting the Industrial Collective Research (IGF) of the German Ministry of Economics and Climate Action (BMWK) based on a resolution of the German Parliament. Project AiF 22142 N.

Institutional Review Board Statement

Not applicable.

Informed Consent Statement

Not applicable.

Data Availability Statement

The data presented in this study are available on request from the corresponding author.

Conflicts of Interest

The authors declare no conflicts of interest.

References

  1. Bures, D.; Bartoň, L. Growth performance, carcass traits and meat quality of bulls and heifers slaughtered at different ages. Czech J. Anim. Sci. 2018, 57, 34–43. [Google Scholar] [CrossRef]
  2. Nethra, P.V.; Sunooj, K.V.; Aaliya, B.; Navaf, M.; Akhila, P.P.; Sudheesh, C.; Mir, S.A.; Shijin, A.; George, J. Critical factors affecting the shelf life of packaged fresh red meat—A review. Meas. Food 2023, 10, 100086. [Google Scholar] [CrossRef]
  3. Ke, Y.; Mitacek, R.M.; Abraham, A.; Mafi, G.G.; VanOverbeke, D.L.; DeSilva, U.; Ramanathan, R. Effects of muscle-specific oxidative stress on cytochrome c release and oxidation-reduction potential properties. J. Agric. Food Chem. 2017, 65, 7749–7755. [Google Scholar] [CrossRef] [PubMed]
  4. Koohmaraie, M.; Geesink, G.H. Contribution of postmortem muscle biochemistry to the delivery of consistent meat quality with particular focus on the calpain system. Meat Sci. 2006, 74, 34–43. [Google Scholar] [CrossRef] [PubMed]
  5. Font, I.F.M.; Guerrero, L. Consumer preference, behavior and perception about meat and meat products: An overview. Meat Sci. 2014, 98, 361–371. [Google Scholar] [CrossRef] [PubMed]
  6. Tomasevic, I.; Tomovic, V.; Ikonić, P.; Lorenzo, J.M.; Barba, F.; Djekic, I.; Nastasijevic, I.; Stajić, S.; Zivkovic, D. Evaluation of poultry meat colour using computer vision system and colourimeter: Is there a difference? Br. Food J. 2019, 121, 1078–1087. [Google Scholar] [CrossRef]
  7. Mancini, R.A.; Hunt, M.C. Current research in meat color. Meat Sci. 2005, 71, 100–121. [Google Scholar] [CrossRef] [PubMed]
  8. Ruedt, C.; Gibis, M.; Weiss, J. Meat color and iridescence: Origin, analysis, and approaches to modulation. Compr. Rev. Food Sci. Food Saf. 2023, 22, 3366–3394. [Google Scholar] [CrossRef] [PubMed]
  9. Hernández, B.; Sáenz Gamasa, C.; Diñeiro Rubial, J.M.; Alberdi Odriozola, C. CIELAB color paths during meat shelf life. Meat Sci. 2019, 157, 107889. [Google Scholar] [CrossRef]
  10. Girolami, A.; Napolitano, F.; Faraone, D.; Braghieri, A. Measurement of meat color using a computer vision system. Meat Sci. 2013, 93, 111–118. [Google Scholar] [CrossRef]
  11. Maciel, I.; Schweihofer, J.; Fenton, J.; Hodbod, J.; McKendree, M.; Cassida, K.; Rowntree, J. Influence of beef genotypes on animal performance, carcass traits, meat quality and sensory characteristics in grazing or feedlot-finished steers. Transl. Anim. Sci. 2021, 5, txab214. [Google Scholar] [CrossRef] [PubMed]
  12. Gagaoua, M.; Hughes, J.; Terlouw, C.; Warner, R.; Purslow, P.; Lorenzo, J.M.; Picard, B. Proteomic biomarkers of beef colour. Trends Food Sci. Technol. 2020, 101, 234–252. [Google Scholar] [CrossRef]
  13. Grunert, K.G.; Bredahl, L.; Brunsø, K. Consumer perception of meat quality and implications for product development in the meat sector—A review. Meat Sci. 2004, 66, 259–272. [Google Scholar] [CrossRef] [PubMed]
  14. Warner, R.; Wheeler, T.L.; Ha, M.; Li, X.; Bekhit, A.E.-D.; Morton, J.; Vaskoska, R.; Dunshea, F.R.; Liu, R.; Purslow, P.; et al. Meat tenderness: Advances in biology, biochemistry, molecular mechanisms and new technologies. Meat Sci. 2022, 185, 108657. [Google Scholar] [CrossRef] [PubMed]
  15. Sun, X.; Chen, K.J.; Maddock-Carlin, K.R.; Anderson, V.L.; Lepper, A.N.; Schwartz, C.A.; Keller, W.L.; Ilse, B.R.; Magolski, J.D.; Berg, E.P. Predicting beef tenderness using color and multispectral image texture features. Meat Sci. 2012, 92, 386–393. [Google Scholar] [CrossRef] [PubMed]
  16. Costa, P.; Simões, J.A.; Costa, A.S.H.; Lemos, J.P.C.; Navas, D.; Hocquette, J.F.; Calkins, C.R.; Bessa, R.J.B. Repercussions of growth path on carcass characteristics, meat colour and shear force in Alentejana bulls. Anim. Int. J. Anim. Biosci. 2015, 9, 1414–1422. [Google Scholar] [CrossRef] [PubMed]
  17. Carrasco, A.; Pardío-Sedas, V.; León-Banda, G.; Ahuja, C.; Paredes-Ramos, P.; Bertha, H.; Vega-Murillo, V. Effect of stress during slaughter on carcass characteristics and meat quality in tropical beef cattle. Asian-Australas. J. Anim. Sci. 2020, 33, 1656–1665. [Google Scholar] [CrossRef] [PubMed]
  18. Bischof, G.; Witte, F.; Terjung, N.; Heinz, V.; Juadjur, A.; Gibis, M. Metabolic, proteomic and microbial changes postmortem and during beef aging. Crit. Rev. Food Sci. Nutr. 2022, 64, 1076–1109. [Google Scholar] [CrossRef] [PubMed]
  19. Terjung, N.; Witte, F.; Heinz, V. The dry aged beef paradox: Why dry aging is sometimes not better than wet aging. Meat Sci. 2021, 172, 108355. [Google Scholar] [CrossRef]
  20. Suman, S.P.; Hunt, M.C.; Nair, M.N.; Rentfrow, G. Improving beef color stability: Practical strategies and underlying mechanisms. Meat Sci. 2014, 98, 490–504. [Google Scholar] [CrossRef]
  21. Holman, B.W.B.; Kerry, J.P.; Hopkins, D.L. Meat packaging solutions to current industry challenges: A review. Meat Sci. 2018, 144, 159–168. [Google Scholar] [CrossRef]
  22. Zhao, G.; Bai, X.; Tian, W. The effect of shower time, electrolyte treatment, and electrical stimulation on meat quality of cattle longissimus thoracis muscle in cold weather. Meat Sci. 2022, 184, 108664. [Google Scholar] [CrossRef]
  23. Gonzalez-Rivas, P.A.; Chauhan, S.S.; Ha, M.; Fegan, N.; Dunshea, F.R.; Warner, R.D. Effects of heat stress on animal physiology, metabolism, and meat quality: A review. Meat Sci. 2020, 162, 108025. [Google Scholar] [CrossRef]
  24. Ferguson, D.M.; Warner, R.D. Have we underestimated the impact of pre-slaughter stress on meat quality in ruminants? Meat Sci. 2008, 80, 12–19. [Google Scholar] [CrossRef]
  25. Xing, T.; Gao, F.; Tume, R.K.; Zhou, G.; Xu, X. Stress effects on meat quality: A mechanistic perspective. Compr. Rev. Food Sci. Food Saf. 2019, 18, 380–401. [Google Scholar] [CrossRef] [PubMed]
  26. Neethling, N.; Suman, S.; Sigge, G.; Hunt, M.C. Exogenous and endogenous factors influencing color of fresh meat from ungulates. Meat Muscle Biol. 2017, 1, 253–275. [Google Scholar] [CrossRef]
  27. Abril, M.; Campo, M.M.; Önenç, A.; Sañudo, C.; Albertí, P.; Negueruela, A.I. Beef colour evolution as a function of ultimate pH. Meat Sci. 2001, 58, 69–78. [Google Scholar] [CrossRef] [PubMed]
  28. Mahmood, S.; Roy, B.; Larsen, I.; Aalhus, J.; Dixon, W.; Bruce, H. Understanding the quality of typical and atypical dark cutting beef from heifers and steers. Meat Sci. 2017, 133, 75–85. [Google Scholar] [CrossRef] [PubMed]
  29. Ijaz, M.; Li, X.; Zhang, D.; Hussain, Z.; Ren, C.; Bai, Y.; Zheng, X. Association between meat color of DFD beef and other quality attributes. Meat Sci. 2020, 161, 107954. [Google Scholar] [CrossRef]
  30. Poveda-Arteaga, A.; Krell, J.; Gibis, M.; Heinz, V.; Terjung, N.; Tomasevic, I. Intrinsic and Extrinsic Factors Affecting the Color of Fresh Beef Meat—Comprehensive Review. Appl. Sci. 2023, 13, 4382. [Google Scholar] [CrossRef]
  31. Marenčić, D.; Ivanković, A.; Pintić, V.; Kelava, N.; Jakopović, T. Effect of the transport duration time and season on some physicochemical properties of beef meat. Arch. Anim. Breed. 2012, 55, 123–131. [Google Scholar] [CrossRef]
  32. Ramanathan, R.; Kiyimba, F.; Gonzalez, J.; Mafi, G.; DeSilva, U. Impact of up- and downregulation of metabolites and mitochondrial content on pH and color of the longissimus muscle from normal-pH and dark-cutting beef. J. Agric. Food Chem. 2020, 68, 7194–7203. [Google Scholar] [CrossRef]
  33. English, A.; Wills, K.; Harsh, B.; Mafi, G.; VanOverbeke, D.; Ramanathan, R. Effects of aging on the fundamental color chemistry of dark-cutting beef. J. Anim. Sci. 2016, 94, 4040–4048. [Google Scholar] [CrossRef]
  34. Hunt, M.C.; King, D. AMSA Meat Color Measurement Guidelines; American Meat Science Association: Champaign, IL, USA, 2012; pp. 1–135. [Google Scholar]
  35. Witte, F.; Sawas, E.; Berger, L.M.; Gibis, M.; Weiss, J.; Röser, A.; Upmann, M.; Joeres, E.; Juadjur, A.; Bindrich, U.; et al. Influence of Finely Chopped Meat Addition on Quality Parameters of Minced Meat. Appl. Sci. 2022, 12, 10590. [Google Scholar] [CrossRef]
  36. Sheridan, C. SPSS Version 20.0 for Windows; John Wiley & Sons Australia, Ltd.: Brisbane, QLD, Australia, 2013. [Google Scholar]
  37. Loudon, K.M.W.; Tarr, G.; Lean, I.J.; Polkinghorne, R.; McGilchrist, P.; Dunshea, F.R.; Gardner, G.E.; Pethick, D.W. The impact of pre-slaughter stress on beef eating quality. Animals 2019, 9, 612. [Google Scholar] [CrossRef] [PubMed]
  38. Clariget, J.; Banchero, G.; Luzardo, S.; Fernández, E.; Pérez, E.; La Manna, A.; Saravia, A.; del Campo, M.; Ferrés, A.; Canozzi, M.E.A. Effect of pre-slaughter fasting duration on physiology, carcass and meat quality in beef cattle finished on pastures or feedlot. Res. Vet. Sci. 2021, 136, 158–165. [Google Scholar] [CrossRef] [PubMed]
  39. Gallo, C.; Lizondo, G.; Knowles, T.G. Effects of journey and lairage time on steers transported to slaughter in Chile. Vet. Rec. 2003, 152, 361–364. [Google Scholar] [CrossRef]
  40. Ferguson; Shaw, F.; Stárka, L. Effect of reduced lairage duration on beef quality. Aust. J. Exp. Agr. 2007, 47, 770–773. [Google Scholar] [CrossRef]
  41. Romero, M.; Uribe-Velásquez, L.F.; Sanchez, J.; Miranda-de la Lama, G. Risk factors influencing bruising and high muscle pH in Colombian cattle carcasses due to transport and pre-slaughter operations. Meat Sci. 2013, 95, 256–263. [Google Scholar] [CrossRef]
  42. Brennecke, K.; Zeferino, C.; Soares, V.; Orlandi, C.; Bertipaglia, L.; Sgavioli, S.; Dian, P.; de Castro Amancio, W.D. Welfare during pre-slaughter handling and carcass lesions of beef cattle submitted to different loading densities. Pesqui. Vet. Bras. 2020, 40, 985–991. [Google Scholar] [CrossRef]
  43. Mounier, L.; Dubroeucq, H.; Andanson, S.; Veissier, I. Variations in meat pH of beef bulls in relation to conditions of transfer to slaughter and previous history of the animals. J. Anim. Sci. 2006, 84, 1567–1576. [Google Scholar] [CrossRef]
  44. Scanga, J.A.; Belk, K.E.; Tatum, J.D.; Grandin, T.; Smith, G.C. Factors contributing to the incidence of dark cutting beef. J. Anim. Sci. 1998, 76, 2040–2047. [Google Scholar] [CrossRef] [PubMed]
  45. Kadim, I.T.; Mahgoub, O.; Al-Ajmi, D.S.; Al-Maqbaly, R.S.; Al-Mugheiry, S.M.; Bartolome, D.Y. The influence of season on quality characteristics of hot-boned beef m. longissimus thoracis. Meat Sci. 2004, 66, 831–836. [Google Scholar] [CrossRef] [PubMed]
  46. Kim, Y.H.; Yoon, S.; Song, Y.; Lee, S. Effect of season on color of Hanwoo (Korean native cattle) beef. Meat Sci. 2003, 63, 509–513. [Google Scholar] [CrossRef] [PubMed]
  47. Węglarz, A. Meat quality defined based on pH and colour depending on cattle category and slaughter season. Czech J. Anim. Sci. 2010, 55, 548–556. [Google Scholar] [CrossRef]
  48. Abubakar, A.; Idrus, Z.; Goh, Y.; Kaka, U.; Sabow, A.B.; Imlan, J.; Awad, E.; Othman, A.; Raghazli, R.; Mitin, H.; et al. Effects of stocking and transport conditions on physicochemical properties of meat and acute-phase proteins in cattle. Foods 2021, 10, 252. [Google Scholar] [CrossRef]
  49. Teke, B.; Akdag, F.; Ekiz, B.; Ugurlu, M. Effects of different lairage times after long distance transportation on carcass and meat quality characteristics of Hungarian Simmental bulls. Meat Sci. 2014, 96, 224–229. [Google Scholar] [CrossRef] [PubMed]
  50. Karaca, S.; Arik, E. The effect of some pre-slaughter factors on meat quality of bulls slaughtered in a commercial abattoir in Turkey. Indian J. Anim. Res. 2016, 51, 557–563. [Google Scholar] [CrossRef]
  51. Nicolaisen, S.; Langkabel, N.; Thoene-Reineke, C.; Wiegard, M. Animal welfare during transport and slaughter of cattle: A systematic review of studies in the European legal framework. Animals 2023, 13, 1974. [Google Scholar] [CrossRef]
  52. Villarroel, M.; María, G.; Sañudo, C.; García-Belenguer, S.; Chacón, G.; Gebre-Senbet, G. Effect of commercial transport in Spain on cattle welfare and meat quality. Dtsch. Tieraerztl. Wochenschr. 2003, 110, 105–107. [Google Scholar]
  53. McKeith, R.O.; King, D.A.; Grayson, A.L.; Shackelford, S.D.; Gehring, K.B.; Savell, J.W.; Wheeler, T.L. Mitochondrial abundance and efficiency contribute to lean color of dark cutting beef. Meat Sci. 2016, 116, 165–173. [Google Scholar] [CrossRef] [PubMed]
  54. Page, J.K.; Wulf, D.M.; Schwotzer, T.R. A survey of beef muscle color and pH. J. Anim. Sci. 2001, 79, 678–687. [Google Scholar] [CrossRef]
  55. Lacerda, N.G.; Mezzomo, R.; de Oliveira, I.M.; Alves, K.S.; de Oliveira, L.R.S.; Santos, M.C.A.; Lima, R.R.F.; Gomes, D.I. Pre-slaughter road transportation times: Meat quality and sensory properties of Nellore bull meat. Can. J. Anim. Sci. 2021, 102, 30–38. [Google Scholar] [CrossRef]
  56. Honig, A.C.; Inhuber, V.; Spiekers, H.; Windisch, W.; Götz, K.-U.; Ettle, T. Influence of dietary energy concentration and body weight at slaughter on carcass tissue composition and beef cuts of modern type Fleckvieh (German Simmental) bulls. Meat Sci. 2020, 169, 108209. [Google Scholar] [CrossRef] [PubMed]
  57. Gómez, J.; Antonelo, D.; Beline, M.; Pavan, B.; Bambil, D.; Fantinato-Neto, P.; Saran-Netto, A.; Leme, P.; Goulart, R.; Gerrard, D.; et al. Feeding strategies impact animal growth and beef color and tenderness. Meat Sci. 2021, 183, 108599. [Google Scholar] [CrossRef] [PubMed]
  58. Mahmood, S.; Dixon, W.T.; Bruce, H.L. Cattle production practices and the incidence of dark cutting beef. Meat Sci. 2019, 157, 107873. [Google Scholar] [CrossRef]
  59. Siphambili, S.; Moloney, A.P.; O’Riordan, E.G.; McGee, M.; Monahan, F.J. The effects of graded levels of concentrate supplementation on colour and lipid stability of beef from pasture finished late-maturing bulls. Anim. Int. J. Anim. Biosci. 2020, 14, 656–666. [Google Scholar] [CrossRef]
  60. Hughes, J.; Clarke, F.; Purslow, P.; Warner, R. A high rigor temperature, not sarcomere length, determines light scattering properties and muscle colour in beef M. sternomandibularis meat and muscle fibres. Meat Sci. 2018, 145, 1–8. [Google Scholar] [CrossRef] [PubMed]
  61. Bekhit, A.; Morton, J.; Bhat, Z.; Kong, L.M. Meat colour: Factors affecting colour stability. In Encyclopedia of Food Chemistry; Academic Press: Cambridge, MA, USA; Elsevier Publications: Amsterdam, The Netherlands, 2019; Volume 2, pp. 202–210. [Google Scholar]
  62. Hur, S.J.; Jin, S.K.; Park, J.H.; Jung, S.W.; Lyu, H.J. Effect of Modified Atmosphere Packaging and Vacuum Packaging on Quality Characteristics of Low Grade Beef during Cold Storage. Asian-Australas. J. Anim. Sci. 2013, 26, 1781–1789. [Google Scholar] [CrossRef]
  63. Faustman, C.; Cassens, R.G. The Biochemical Basis for Discoloration in Fresh Meat: A Review. J. Muscle Foods 1990, 1, 217–243. [Google Scholar] [CrossRef]
  64. Ramanathan, R.; Nair, M.N.; Hunt, M.C.; Suman, S. Mitochondrial functionality and beef colour: A review of recent research. S. Afr. J. Anim. Sci. 2019, 49, 9–19. [Google Scholar] [CrossRef]
  65. Canto, A.; Costa-Lima, B.R.C.; Suman, S.P.; Monteiro, M.L.G.; Viana, F.M.; Salim, A.; Nair, M.N.; Silva, T.J.P.; Conte-Junior, C.A. Color attributes and oxidative stability of longissimus lumborum and psoas major muscles from Nellore bulls. Meat Sci. 2016, 121, 19–26. [Google Scholar] [CrossRef] [PubMed]
  66. Van Rooyen, L.A.; Allen, P.; Crawley, S.M.; O’Connor, D.I. The effect of carbon monoxide pretreatment exposure time on the colour stability and quality attributes of vacuum packaged beef steaks. Meat Sci. 2017, 129, 74–80. [Google Scholar] [CrossRef] [PubMed]
Figure 1. Experimental design of the factors affecting meat quality.
Applsci 14 03557 g001
Table 1. Carcass conformation scores according to the EUROP system (E = very good and P = very poor), carcass fat scores (5 = very fat and 1 = very lean), and breed frequency for all cattle from the four different working weeks.
ItemnFrequency (%)
Breed type
Fleckvieh5265
Dairy × meat cross2328.75
Holstein Friesian22.5
Others33.75
Conformation
E00
U3746.25
R4151.25
O22.5
P00
Carcass fat
100
23037.5
35062.5
400
500
Table 2. Information regarding pre-mortem conditions in the weeks of slaughtering.
ItemMeanSDSEMinimumMaximum
Animals
Age (months)20221623.9
Weight (kg)444.337.34.17316534
Transport conditions
Distance (km)45.319.62.199.983.8
Duration (min)39 1580
Air temperature at slaughter days(°C)
Working week 110.754.572.29816
Working week 217.254.992.51324
Working week 318.755.192.591425
Working week 4102.451.22712
Slaughterhouse
Lairage time (min)104 33184
Table 3. Multivariate tests showing the effects from the means of TD, AW, and MP on meat quality and their interactions using the Pillay’s Trace test. Multivariate F-probability value is also included in the table.
FactorsFSignificance
Transport distance (TD)3.838<0.01
Animal weight (AW)3.101<0.01
Muscle position (MP)6.144<0.01
Interactions
MP × AW0.210.989
MP × TD1.170.29
AW × TD2.29<0.01
MP × AW × TD0.350.991
Table 4. Combined effects of transport distance (TW), animal weight (AW), and muscle position (MP) on beef quality attributes (mean ± standard deviation). SC refers to shoulder clod, and SS refers to silverside. Superscripts not sharing a common letter, within lines, were significantly different (p < 0.05). WBSF measurement and sensory analysis were conducted for cooked meat samples. Taste, odor, and hardness were measured using a 1 to 100 scale, where 1 stands for “not perceptible” and 100 stands for “intense”.
TDShort (<34.5 km)Medium (34.5 < TD < 59.1)Long (>59.1)
AWLight (<445kg)Heavy (>445kg)Light (<445kg)Heavy (>445kg)Light (<445kg)Heavy (>445kg)
MPSCSSSCSSSCSSSCSSSCSSSCSSSEMp Value
Number of Samples11111817778819181313
Beef Quality Traits
pH485.64 ± 0.21 a5.52 ± 0.14 b5.59 ± 0.13 a5.47 ± 0.37 b5.74 ± 0.14 a5.56 ± 0.13 a5.78 ± 0.06 a5.67 ± 0.15 a5.77 ± 0.22 a5.57 ± 0.13 a5.66 ± 0.24 a5.48 ± 0.14 b0.015<0.01
L*31.4 ± 2.01 a30.6 ± 4.13 b33.2 ± 2.73 a33.2 ± 2.71 a33.6 ± 5.69 a35.4 ± 5.52 a32.8 ± 3.07 a34.1 ± 1.9 a33.5 ± 2.24 a35.1 ± 2.57 a32.7 ± 2.58 a34.8 ± 2.08 a0.2590.046
a*16.5 ± 2.65 a17.0 ± 2.38 a14.8 ± 3.62 a15.8 ± 3.31 a15.1 ± 2.20 a16.0 ± 3.7 a16.4 ± 3.19 a15.1 ± 2.6 a15.3 ± 2.47 a16.5 ± 3.77 a15.5 ± 2.74 a18.7 ± 4.59 a0.2680.494
b*10.6 ± 6.80 a12.0 ± 7.9 a5.1 ± 4.85 b6.2 ± 5.5 b4.5 ± 3.38 b4.9 ± 2.62 b3.8 ± 1.93 b3.5 ± 2.33 b3.8 ± 1.72 b4.9 ± 2.78 b3.4 ± 2.77 b5.7 ± 3.15 b0.395<0.01
hab29.9 ± 17.1 a31.2 ± 18.4 a18.4 ± 16.4 b19.7 ± 16.7 b15.7 ± 10.7 b16.5 ± 7.2 b12.6 ± 3.3 b12.1 ± 6.3 b13.43 ± 4.2 b15.4 ± 5.7 b11.5 ± 8.3 b15.8 ± 5.7 b1.035<0.01
C*20.4 ± 4.7 a21.6 ± 5.5 a16.1 ± 4.1 a17.6 ± 4.2 a16 ± 2.7 a16.8 ± 4 a16.9 ± 3.6 a15.6 ± 3.1 a15.8 ± 2.8 a17.3 ± 4.4 a16 ± 3.1 a19.6 ± 5.3 a0.3540.063
WBSF (N)17.2 ± 4.45 a16.7 ± 5.57 a17.6 ± 4.6 a17.7 ± 4.35 a20.7 ± 2.9 a21.2 ± 5.25 a17.3 ± 3.49 a18.0 ± 6.96 a16.9 ± 4.72 a18.1 ± 2.72 a16.9 ± 4.12 a17.3 ± 4.9 a0.3680.200
Sensory Analysis
Odor55.9 ± 18.59 a66.8 ± 11.44 a58.8 ± 22.25 a55.8 ± 20.91 a64.3 ± 21.33 a53.4 ± 21.61 a64.3 ± 21.32 a46.4 ± 20.24 a52.5 ± 22.08 a56.1 ± 22.36 a56.9 ± 19.3 a54.7 ± 16.74 a1.620.965
Taste58.3 ± 15.82 a55.9 ± 11.55 a60.3 ± 22.51 a58.3 ± 21.36 a55.4 ± 21.23 a46.6 ± 9.9 a55.8 ± 27.64 a48.5 ± 23.12 a50.0 ± 21.12 a56.8 ± 22.14 a79.9 ± 20.35 a56.8 ± 21.10 a1.650.309
Hardness45.1 ± 12.83 a53.2 ± 11.04 a50.7 ± 17.32 a57.5 ± 19.97 a46.7 ± 20 a57.7 ± 16.85 a38.3 ± 15.17 a53.5 ± 21.44 a43.0 ± 12.71 a55.9 ± 15.63 a42.1 ± 19.05 a51.3 ± 17.17 a1.390.861
Table 5. Spearman nonparametric correlations (Rho) between transport distance (TD), animal weight (AW), and muscle position (MP) on beef quality and sensory attributes (single-tailed). WBSF measurement and sensory analysis were conducted for cooked meat samples. Taste, odor, and hardness were measured using a 1 to 100 scale, where 1 stands for “not perceptible” and 100 stands for “intense”.
Transporation Distance (TD)Animal Weight (AW)Muscle Position (MP)
Beef Quality TraitsRhoSignificance (p Value)RhoSignificance (p Value)RhoSignificance (p Value)
pH480.225<0.01−0.120.132−0.429<0.01
L*0.211<0.01−0.0050.9480.1980.071
a*−0.0570.476−0.0020.9810.1450.068
b*−0.120.13−0.1380.0810.1270.11
hab−0.1200.143−0.1640.0440.1180.150
C*−0.1740.033−0.0490.5500.1360.096
WBSF−0.240.758−0.0560.4810.0170.833
Sensory Analysis
Odor−0.1560.56−0.0440.591−0.0030.967
Taste−0.0560.4960.0760.3580.0220.792
Hardness−0.080.3290.0270.7420.313<0.01
Table 6. Average mean values (± standard deviations) of the effects of transport distance (TD), animal weight (AW), and muscle position (MP) on beef quality and sensory attributes. SC refers to shoulder clod and SS refers to silverside. Superscripts not sharing a common letter, within lines, were significantly different (p < 0.05). WBSF measurement and sensory analysis were conducted for cooked meat samples. Taste, odor, and hardness were measured using a 1 to 100 scale, where 1 stands for “not perceptible” and 100 stands for “intense”.
TDAWMP
Beef Quality TraitsShortMediumLongLightHeavySCSS
pH485.56 ± 0.07 b5.69 ± 0.08 a5.62 ± 0.11 a5.63 ± 0.095.61 ± 0.095.70 ± 0.075.55 ± 0.07
L*32.10 ± 1.16 b33.98 ± 0.97 a34.02 ± 0.98 a33.28 ± 1.7933.46 ± 1.6432.87 ± 0.7433.87 ± 1.65
a*16.05 ± 0.79 a15.66 ± 0.57 a16.49 ± 1.34 a16.06 ± 0.6816.06 ± 0.7015.61 ± 0.6416.51 ± 1.11
b*8.48 ± 2.93 a4.19 ± 0.54 b4.43 ± 0.89 b6.79 ± 3.264.62 ± 2.915.21 ± 2.486.20 ± 2.74
hab23.51 ± 17.48 a14.08 ± 7.09 b14.06 ± 6.01 b19.58 ± 12.9315.82 ± 12.2416.79 ± 12.6718.54 ± 12.71
C*18.43 ± 4.93 a16.33 ± 3.24 a17.04 ± 4.09 a17.84 ± 4.5217.03 ± 4.1516.7 ± 3.818.18 ± 4.74
WBSF (N)17.31 ± 0.41 a19.31 ± 1.68 a17.31 ± 0.52 a18.47 ± 1.8317.48 ± 1.5217.77 ± 1.3418.18 ± 1.44
Sensory Analysis
Odor59.33 ± 4.48 a57.10 ± 7.61 a55.04 ± 1.68 a58.16 ± 5.4356.15 ± 4.6958.78 ± 4.3355.53 ± 6.01
Taste58.20 ± 1.57 a51.56 ± 4.09 a60.84 ± 11.32 a53.82 ± 4.1459.92 ± 10.1359.93 ± 9.4653.80 ± 4.52
Hardness51.63 ± 4.45 a49.04 ± 7.36 a48.06 ± 5.78 a50.27 ± 5.5948.88 ± 7.1344.31 ± 3.8854.84 ± 2.36
Disclaimer/Publisher’s Note: The statements, opinions and data contained in all publications are solely those of the individual author(s) and contributor(s) and not of MDPI and/or the editor(s). MDPI and/or the editor(s) disclaim responsibility for any injury to people or property resulting from any ideas, methods, instructions or products referred to in the content.

