Article

The Distribution and Health Risk Assessment of Potential Toxic Elements in Atmospheric Deposition from Ion-Adsorption Rare Earth Mining Areas in the Ganzhou City of Southeast China

1
School of Earth Sciences and Resources, China University of Geosciences (Beijing), Beijing 100083, China
2
National Research Center for Geoanalysis, Beijing 100037, China
3
Key Laboratory of Eco-Geochemistry, Ministry of Natural Resources, Beijing 100037, China
4
MOE Key Laboratory of Groundwater Circulation and Environmental Evolution, School of Water Resources and Environment, China University of Geosciences (Beijing), Beijing 100083, China
*
Authors to whom correspondence should be addressed.
Appl. Sci. 2024, 14(9), 3585; https://doi.org/10.3390/app14093585
Submission received: 16 March 2024 / Revised: 18 April 2024 / Accepted: 20 April 2024 / Published: 24 April 2024
(This article belongs to the Special Issue New Advances, Challenges, and Illustrations in Applied Geochemistry)

Abstract

:
Potential toxic elements (PTEs), including Pb, Cr, Cd, Ni, Cu, As, and Mo, are common pollutants in ion-adsorption rare earth mines (IAREEMs), and atmospheric deposition is an important method of PTE migration. However, the level of PTE atmospheric deposition in and around IAREEMs remains unknown. We established 25 stations at typical sites in the Ganzhou city of southeast China. An exposure assessment model was used to evaluate the health risks for adults and children. The results show that the concentration and fluxes of atmospheric deposition of PTEs follow the order of Pb > Cu > Cr > Ni > As > Mo > Cd, and most PTEs present no human health risk. However, due to the high toxicty of As, it poses both carcinogenic and non-carcinogenic risks to children as indicated by the analysis of an exposure assessment model of heavy rare earth minerals in Longnan county, Ganzhou city. The As concentration in atmospheric deposition ranged from 3.18 to 251.87 mg kg−1, and the As atmospheric fluxes in atmospheric deposition ranged from 0.11 to 39.4 mg m−2 y−1. This is because As-rich materials (e.g., arsenic-adsorbing clay zones and chernovite-(Y) (Y[AsO4])) are exposed in fully weathered layers, and the formed suspended particulate matter is transported into the atmosphere at Longnan county. Consequently, restoring vegetation to reduce particulate matter transport is an important method for controlling the spread of pollutants. These results provide significant insights into pollution characteristics and prevention in and around mining areas under the influence of atmospheric deposition.

1. Introduction

Ion-adsorption rare earth element mines (IAREEMs) are widely distributed in Jiangxi, Guangdong, and Fujian in southern China [1], with the first discovery and mining in Ganzhou taking place in 1969 [2]. The use of heap leaching and in-situ leaching in these areas has led to significant ecological and environmental issues, including vegetation destruction, delayed vegetation recovery, and pollution from potentially toxic elements (PTEs) [3,4]. Particulate matter from mining operations, such as mining, beneficiation, smelting, and waste, plays a crucial role in migration of pollutants, impacting nearby areas [5,6]. Atmospheric pollution, distinct from soil and water pollution, disperses rapidly over longer distances [7,8], and atmospheric deposition is a key route for pollutants to enter soil, biological, and other media [9,10]. However, current studies are mainly focused on soil and water pollution, and researches on atmospheric deposition are limited [4,11].
Mine atmospheric deposition contains various PTEs, including metals and metalloids (e.g., As, Cd, Cr, Cu, Mo, Ni, and Pb). These elements are concerning due to their persistence, toxicity, and potential for bioaccumulation [12,13,14]. Usually, human activities contribute significantly to the atmospheric deposition of PTEs in mining areas [15]. For IAREEM areas, the distribution of PTEs through atmospheric deposition remains unknown.
Given the bioaccumulation of PTEs [16,17], human exposure near IAREEM areas could pose substantial health risks. This study employs the exposure assessment model developed by the United States Environmental Protection Agency (USEPA) to evaluate these risks [18]. The model is widely used and is an effective tool for assessing human health risks, and the results of the assessment can provide a reference and basis for environmental governance policies [19,20,21]. Our analysis focuses on the spatial distribution and pollution levels of PTEs in atmospheric deposition around IAREEM areas. We also assess the human health risks associated with PTE exposure and provide insights for environmental management in IAREEM regions. In this study, we first investigate PTEs of atmospheric deposition in IAREEM areas, offering valuable information for managing atmospheric deposition pollution in these regions.

2. Materials and Methods

2.1. Study Area

The study area is located in Ganzhou city of Jiangxi Province (Southeast China), having a subtropical monsoon climate (Figure 1e). Large-scale mining in Ganzhou city began in the late 20th century. The IAREEMs in Ganzhou city, known as the first discovered and mined IAREEM region in the world, are categorized into two types: the heavy rare earth (Gd, Tb, Dy, Ho, Er, Tm, Yb, Lu, Y, HREE) type in Longnan county and the light rare earth (La, Ce, Pr, Nd, Pm, Sm, Eu) type in Xunwu county [11,22,23]. Currently, most IAREEMs have been abandoned and wind erosion of the mine’s surface soil poses a risk of spreading PTEs [4,11].

2.2. Sample Collection

Eight major IAREEM areas in Ganzhou city were selected for atmospheric deposition sampling. Based on prevailing wind directions (N-W), each mining area was equipped with three atmospheric deposition stations (Figure 1a,b). The atmospheric deposition was successively collected using a self-designed collector from sampling stations at 25 sites in the study area (Figure 1a). Samples of atmospheric deposition were collected over the course of a year from August 2019 to August 2020 and sampled at the end. Collected samples were stored in PVC plastic bottles (Figure 1d), which were cleaned with Milli-Q water and 1:1 HNO3 before use. The collection bottles were placed and fixed in an open area, such as on a roof or a broad balcony. The collected atmospheric deposition samples (including wet and dry deposition) were transferred into a clean tank. Sparse collectors due to evaporation were replenished with pure water, ensuring complete sample transfer. Additionally, a typical regolith sample was collected at a depth of 50 cm below the surface to minimize anthropogenic influence in fully weathered layers (Figure 1a,b). Since the surface layer is potentially subject to disturbances from exogenous substances and exhibits high variability, soil sampling at a depth of 50 cm can better represent the basic conditions of the surface soil in this region [24].

2.3. Sample Treatment and Analysis

The wet and dry samples were collected and transferred to the laboratory within 72 h. They were filtered through a 0.45 μm quartz fiber membrane, which was pre-measured and recorded. The filtrates (wet deposition) were acidified with 1:1 HNO3 in a 30 mL aliquot and ready for analysis. Both the membrane and its precipitate were dried below 65 °C until the mass difference between the two measurements was under 0.5 mg. The dried precipitates (dry deposition) could then be used for analysis.
Samples were analyzed for Pb, Cr, Cd, Ni, Cu, and Mo. About 50 mg of each sample was digested in a mixture of HCl, HNO3, HF, and HClO4 [12], and analyzed using Inductively Coupled Plasma Mass Spectrometry (ICP-MS, NexION 300Q, PerkinElmer, Waltham, MA, USA) and Atomic Fluorescence Spectrometry (AFS, AFS-8330, Titan Instruments, Beijing, China) for As concentration.
Quality assurance and control involved standard reference substances (soil, GSS21–GSS26) from the National Institute of Metrology, China. Table 1 shows the detection limits of the wet and dry depositions. The sample recoveries ranged from 90% to 110%, and the analyses were performed in triplicate, ensuring levels of accuracy and precision that meet the quality requirements [25].
The Mineral Liberation Analyzer (MLA) is a process mineralogy automatic analysis and testing equipment developed by the University of Queensland, Australia. Equipped with an energy spectrometer, we can achieve automatic scanning and energy spectrum analysis, accurately identify mineral types, and determine content. Regolith sample observations were made with the aid of an MLA in the Institute of Resource Utilization and Rare Earth Development, Guangdong Academy of Sciences in China. The MLA 650 system consisted of an FEI Quanta 650 scanning electron microscope, Bruker Quanta 200 dual probe electric refrigeration energy spectrometer, and MLA software version 3.1. The working conditions were an acceleration voltage of 20 kV, a working distance of 10 mm, and high vacuum mode.

2.4. Data Analysis

2.4.1. Concentrations and Flux of Trace Elements

The concentrations of PTEs in the atmospheric deposition samples were calculated using Equation (1):
C i j = V i × p i j + M i × w i j M i
where Cij (mg kg−1) is the concentration of the j-th PTE of the i-th atmospheric deposition sample; Vi (L) is the volume of the filtrate of the i-th sample; pij (mg/L) is the concentration of the j-th PTE of the filtrate of the i-th sample; Mi (kg) is the mass of the i-th sample deposition; wij (mg kg−1) is the concentration of the j-th PTE of the i-th sample deposition.
The annual deposition flux of PTEs from the atmospheric deposition samples was calculated using Equation (2):
f i j = C i j × M i S a
where fij (mg m−2 y−1) is the deposition flux of the j-th trace element of the i-th atmospheric deposition sample; S (m2) is the collection area of the atmospheric deposition collection device; a (y) is the collection time of the atmospheric deposition sample.

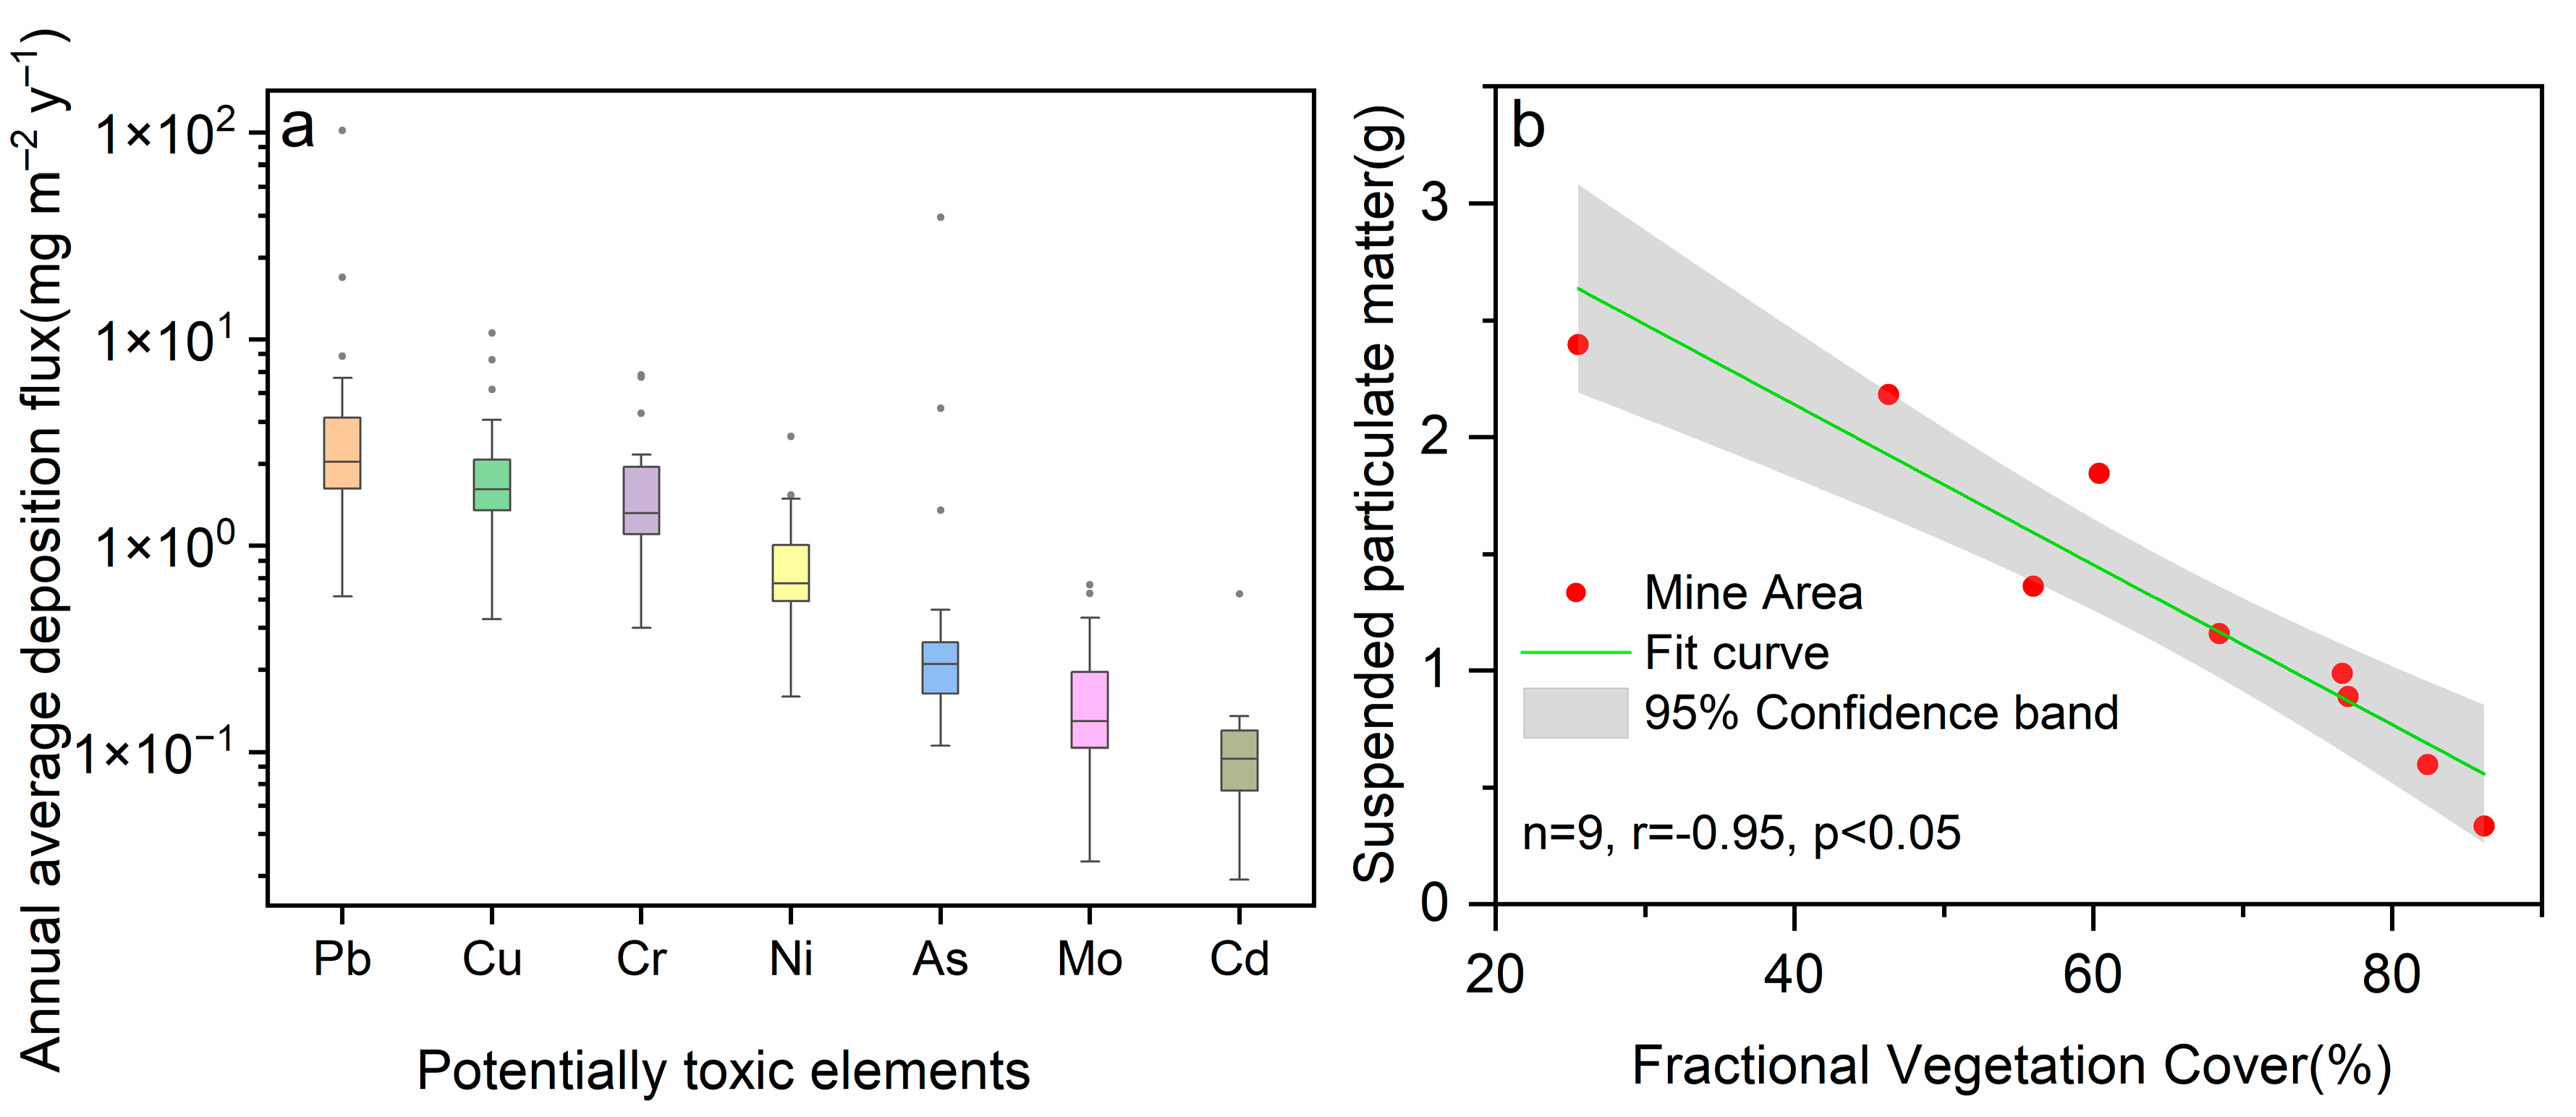
2.4.2. Fractional Vegetation Cover

Utilizing Landsat 8 data (refer to Table 2), the fractional vegetation cover (FVC) was calculated using the normalized difference vegetation index (NDVI) in conjunction with the image dichotomy method [26]. The calculations involved the following Equations (3) and (4):
NDVI = ( NIR R ) / ( NIR + R )
FVC = ( NDVI NDVI soil ) / ( NDVI veg NDVI soil )
where NDVI is the normalized vegetation index of a mixed image element; NIR is the near-infrared band reflectance; R is the red band reflectance. NDVIsoil and NDVIveg represent a pure soil and pure vegetation image element value, respectively [26,27]. NDVIsoil and NDVIveg vary in time and space due to different environmental backgrounds, photographic conditions, and image quality. In the actual calculation process, 5% and 95% confidence levels were used to select the maximum and minimum thresholds for NDVI data for the corresponding periods [27,28,29].

2.4.3. Human Health Risk Assessment

Human health risks from exposure to PTEs in atmospheric deposition, as identified by the United States Environmental Protection Agency (USEPA), are categorized into non-carcinogenic and carcinogenic risks [18]. These risk assessments are conducive to quantifying exposure to PTEs [14,20]. Exposure routes include unintentional oral ingestion and inhalation. We conducted a human health risk assessment of PTEs in atmospheric deposition from IAREEs for two demographic groups (adults and children). The primary exposure routes to PTEs in atmospheric deposition are ingestion and inhalation [18]. This assessment evaluates both carcinogenic and non-carcinogenic risks from atmospheric deposition of PTEs at mine sites. Carcinogenicity assessments were conducted for ingestion (As, Cr, Pb) and inhalation (As, Cd, Cr, Ni) pathways due to the unavailability of carcinogenic slope factors for other PTEs [19,20].
The non-carcinogenic risk (HQ) of PTEs to the human via the ingestion and inhalation routes was calculated using the following Equations (5) and (6) [30]:
H Q ingestion   = C i I R R B A E F E D B W A T R f D 0 10 6
H Q inhalation   = C i I n h R E F E D P M 10 A T R f C
The carcinogenic risk (CR) of PTEs to the population via the ingestion and inhalation routes was calculated using the following Equations (7) and (8) [30]:
C R ingestion   = C i I R R B A E F E D C S F B W A T 10 6
C R i n h a l a t i o n = C i I n h R E F E D I U R P M 10 1000 A T
The total non-carcinogenic risk (HI) of PTEs to the population was calculated [30] using the following Equation (9):
H I = H Q ingestion   + H Q inhalation      
The total carcinogenic risk (TCR) of PTEs to the population was calculated [30] using the following Equation (10):
T C R = C R ingestion   + C R inhalation      
The relevant calculation parameters for human health risk assessment are shown in Table 3 and Table 4.
If the values of HQ and HI are below 1, it is assumed that no non-carcinogenic risk will occur. If the values are higher than 1, there is a potential health risk to human health [20,29]. Besides, no greater carcinogenic risk is expected if the carcinogenic risk value does not exceed 10−4 [20,29].

3. Results and Discussion

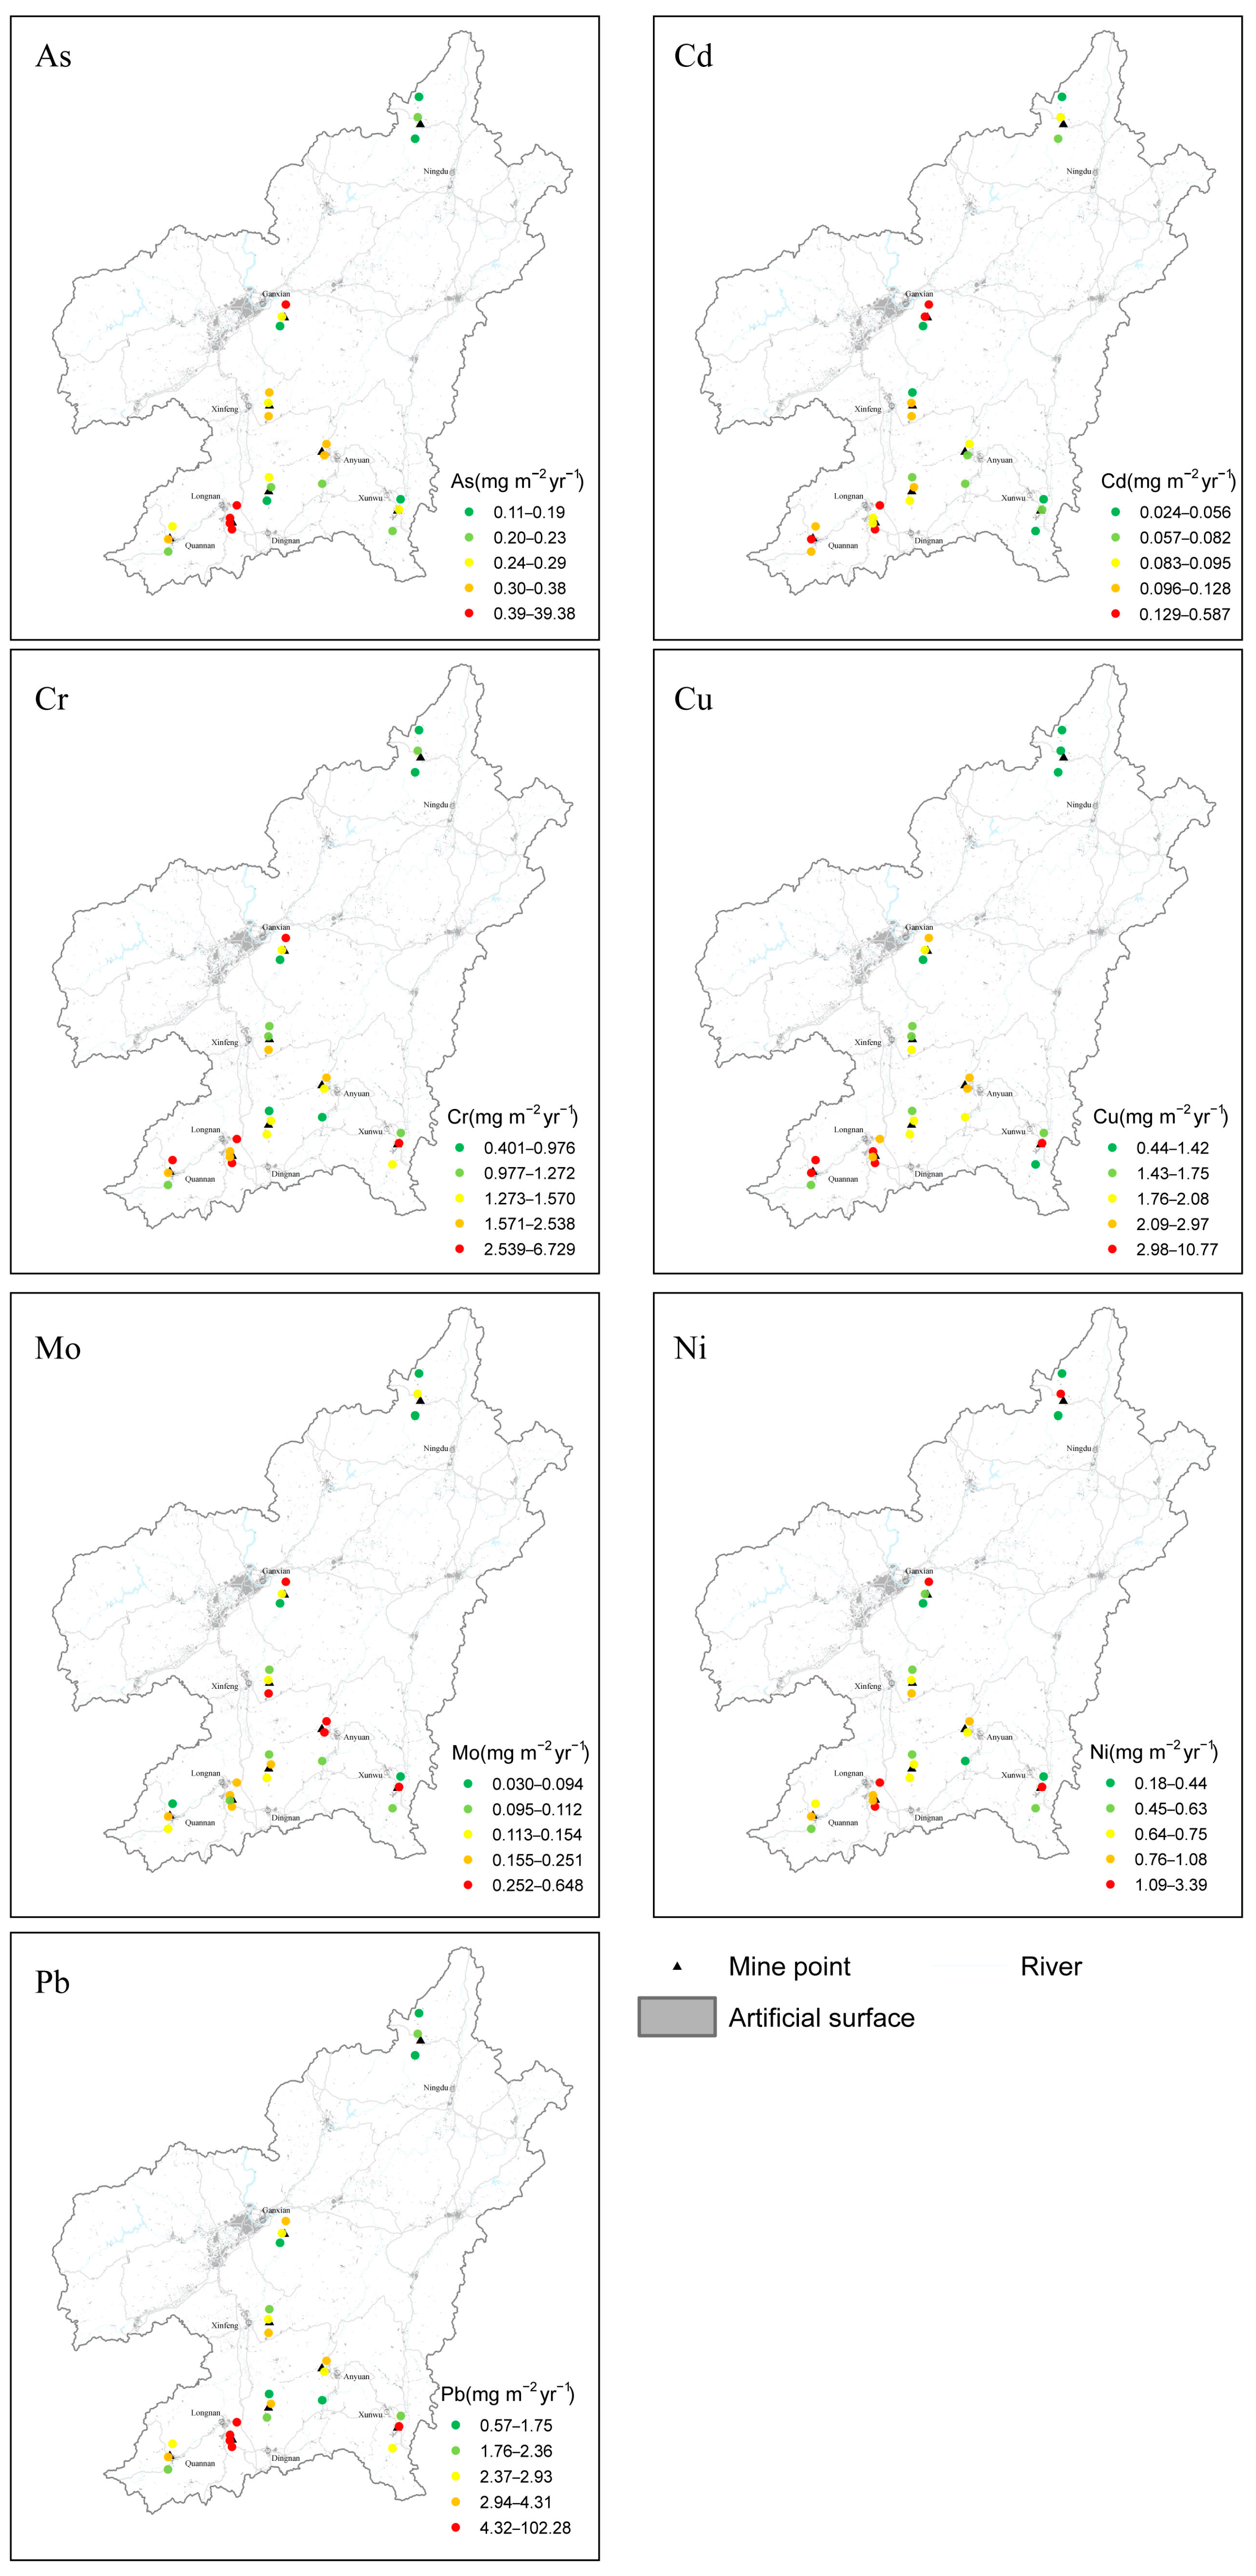
3.1. Spatial Distribution Characteristics of PTEs

The statistical analysis of PTEs in atmospheric deposition is summarized in Table 4. All skewness coefficients for PTEs exceed 1, indicating a right-skewed distribution, where median concentrations are lower than mean concentrations. Due to the presence of concentrations skewed towards lower values, the median provides a more reliable measure than the mean for PTEs in atmospheric deposition in and around IAREEM areas [35,36]. The median concentrations of PTEs followed the order of Pb > Cu > Cr > Ni > As > Mo > Cd. It is clear that spatial variability in PTE concentrations for atmospheric deposition near IAREEM areas is minimal (shown in Table 5). This is probably because elements dominated by natural sources typically exhibit low coefficients of variation, while those influenced by anthropogenic sources have higher coefficients [37,38]. In this study area, most atmospherically deposited PTEs show low spatial variability. Notably, the coefficients of variation for As and Pb are greater than 1, with higher concentrations at mining regions containing heavy rare earth elements in Longnan county (Figure 2), suggesting mining influences concentration of these elements.
Compared to open-pit coal mining areas [40], atmospheric deposition of PTE concentrations of As are significantly higher in IAREEM areas. However, compared to the average level of PTEs in urban areas in China and the world [41,42], the concentration of PTEs in IAREEM areas is at a relatively low level. In addition, the PTE concentrations of Pb, Cr, Cd, Ni, Cu, and As in the IAREEM areas are slightly lower compared to those in the rural areas of Shanghai and the Taihu Lake forest region in the Yangtze River Delta Economic Zone [14,43]. IAREEMs have a relatively low impact on the concentration levels of atmospheric-deposited PTEs (Table 6), and we found that they had the characteristics of atmospheric PTE deposition in other rural regions of China.

3.2. Human Health Risks Assessment

The assessment of Hazard Quotients (HQ), Hazard Indexes (HI), and Total Hazard Indexes (THI) for adults revealed all values are below 1 (Figure 3a–c). This indicates no significant non-carcinogenic health risk from PTEs absorbed via ingestion and inhalation routes in atmospheric deposition in and around IAREEM areas. The ranking of elements by non-carcinogenic risk is Pb > As > Cr > Cd > Cu > Ni > Mo for adults. However, HQingestion values for Pb and As exceed 1 for children in mining regions containing heavy rare earth elements (Figure 3e), suggesting potential adverse health effects from exposure to atmospheric deposition containing Pb and As.
In terms of carcinogenic risk, the values for CRingestion, CRinhalation, and combined exposure were all below 1 × 10⁻⁴, indicating that the carcinogenic risk for adults from PTEs in atmospheric deposition is within acceptable limits. Regarding carcinogenic risk, the values for CRingestion, CRinhalation, and CR were less than 1 × 10⁻⁴ (Figure 4a–d). The ranking of elements by non-carcinogenic risk followed the order of Pb > As > Cr > Cd > Cu > Ni > Mo (Figure 4c,g). Carcinogenic risk to children from single exposure routes also falls within an acceptable range (Figure 4e,h). Only As poses a significant risk in certain areas for children.
Regarding different exposure routes, the human health risks of ingestion is higher than that of inhalation (Figure 3d,h and Figure 4d,h), and ingestion is the primary exposure route. Non-carcinogenic risks are higher in children compared with adults (Figure 3d,h), and this trend is similar for carcinogenic risks (Figure 4d,h). Children are potentially more susceptible to health risks and are more sensitive to PTEs than adults, and this is consistent with the findings of other researchers [20]. Due to the low oral reference dose and high oral slope factor of As (Table 3), As has high toxicity characteristics. The high concentration areas of As are mainly distributed in Longnan county (Figure 2), posing both carcinogenic and non-carcinogenic risks.

3.3. Source of As

Overall, based on human health risk assessment, As in the atmospheric deposition of this study area poses the greatest risk to humans and is mainly distributed in HREE mines and surrounding areas. Therefore, it was necessary to analyze the sources of As in these atmospheric depositions.

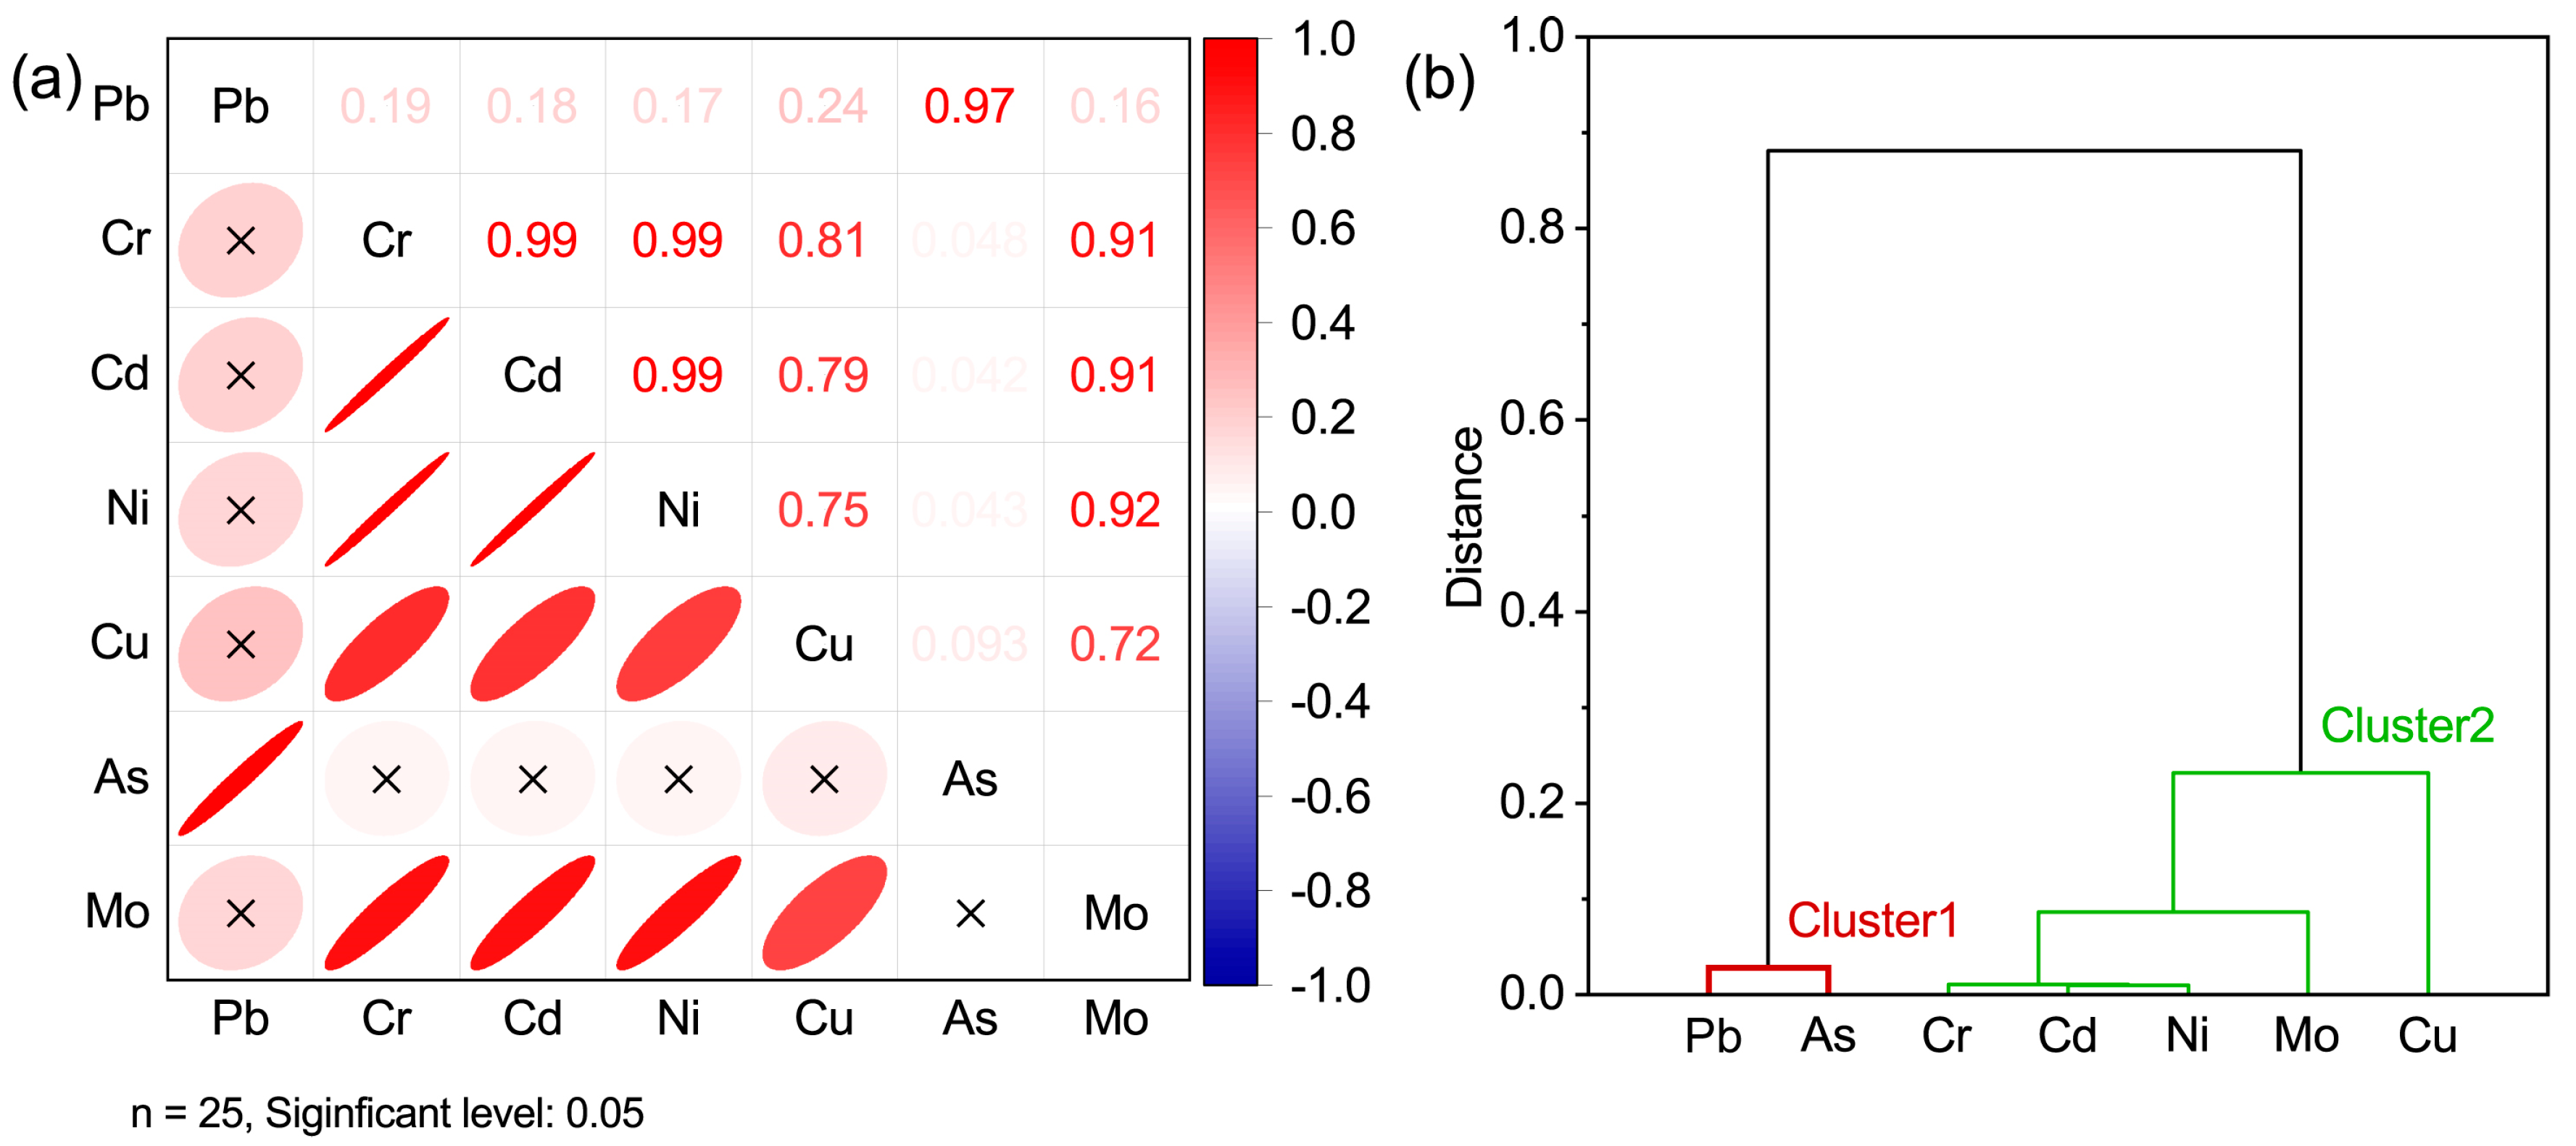
3.3.1. Correlation Analysis and Cluster Analysis

A correlation analysis of elements offers insights into their origins and migration pathways. Strong positive correlations indicate similar sources [15,44]. Following Jacob’s correlation grading [45], strong correlations were observed among Cd, Cr, Ni, Mo, and Cu (Figure 5a, r > 0.71, p ≤ 0.05), suggesting a common origin. They may have the exact same origin. Pb and As also showed a significant positive correlation (Figure 5a, r = 0.97, p ≤ 0.05). Cluster analysis further classifies trace elements based on their similarity in concentration and assesses the correlation between elements by constructing a tree diagram to help determine the source of the elements [37,38]. The Pearson clustering method clusters the elements; the results are shown in Figure 3b. The distance indicates the degree of correlation between elements. The lower the value on the distance cluster, the more significant the correlation. According to the cluster analysis diagram, the seven elements can be classified into two categories (Figure 5b) Pb and As forming a distinct cluster at a distance of approximately 0.02; and Cd, Cr, Ni, Mo and Cu forming a distinct cluster at a distance of approximately 0.25. Most importantly, As and Pb may have a common source. Meanwhile, many studies have reported that IAREEMs may be a significant source of Pb contamination in the surrounding areas [4,11]. Based on previous findings, As is predominantly distributed around mines containing heavy rare earth elements in Longnan county (Figure 2), suggesting that these mines may be the principal source of As in atmospheric deposition in the area.

3.3.2. Transport of Arsenic

The median annual deposition fluxes of PTEs at IAREEMs followed the order of Pb > Cu > Cr > Ni > As > Mo > Cd (Figure 6a). The deposition flux of Pb was the highest (7.60 mg m−2 y−1), and that of Cd was the lowest (0.11 mg m−2 y−1). Mining in IAREEMs resulted in land exposure and vegetation destruction, posing a risk of PTE migration through atmospheric deposition [3]. High atmospheric deposition fluxes of Pb and As around IAREEM areas are shown in Figure 7. In areas with low vegetation coverage near an IAREEM, significant quantities of suspended particulates have been collected from atmospheric deposition (Figure 6b). The transport and deposition of PTEs in the atmospheric deposition of mining areas are controlled by the PTE concentrations in the surrounding soil particulates and vegetation [46,47]. The scarcity of vegetation may facilitate the resuspension of soil particles into the atmosphere, resulting in an increase in arsenic deposition in the IAREEM area.

3.3.3. Mineralogy of the Regolith

In Ganzhou city, IAREEMs are divided into heavy and light rare earth types, with significant As content in the semi-differentiated layer of the heavy rare earth deposit in Longnan county, exceeding China’s agricultural land soil safety standards [22,25]. The minerals in the regolith are listed in Table 7. The main minerals in the regolith are kaolinite\illite (46.00%) and quartz (45.89%). Among them, is a type of As-containing mineral called chernovite-(Y) occuring as micron-sized pseudocubic crystals in the regolith (Figure 8a). The chemical composition of chernovite-(Y) is shown in Figure 8b. It is clear that there is a high content (over 25%) of As in chernovite-(Y) of semi-weathered regolith samples. This results in a high background value of As in the heavy rare earth deposit. Under the ongoing surface fluid–mineral interaction, As and REEs precipitate to generate chernovite-(Y) [22,48]. Additionally, the fully weathered layer of IAREEM contains 46% kaolinite and other clay minerals. Studies have shown As being readily adsorbed by clay minerals such as kaolinite [22,49]. Therefore, the As in atmospheric deposition in Longnan county and surrounding areas is highly likely to come from heavy rare earth minerals. Rare earth mining activities have led to vegetation destruction and soil erosion [3,4,11], exposing weathered layers beneath the soil humus and resulting in wind-borne transport of fine-grained arsenic-adsorbing clay minerals and chernovite-(Y), thereby increasing the risk of As exposure.
Therefore, it is necessary to carry out ecological restoration and restore vegetation in mining areas, which can inhibit the migration of pollutants in mining areas, and reduce the risk to children, especially those exposed to As.

4. Conclusions

In this study, we investigated atmospheric deposition of PTEs from typical IAREEMs in Ganzhou city, China. The study reveals the distribution and human health risks associated with PTEs from atmospheric deposition in IAREEM areas. The results show that As concentrations in atmospheric deposition ranged from 3.18 to 251.87 mg kg−1, and As atmospheric fluxes varied from 0.11 to 39.4 mg m−2 y−1. The concentration and fluxes of atmospheric deposition of PTEs in Ganzhou and its surrounding areas followed the order of Pb > Cu > Cr > Ni > As > Mo > Cd. Human health risk assessments for ingestion and inhalation routes indicate that ingestion is the primary exposure route posing health risks. There are no significant non-carcinogenic or unacceptable carcinogenic risks to adults from atmospheric deposition of PTEs in IAREEM areas. However, children are more vulnerable to PTEs than adults, suffering from potential non-carcinogenic and greater carcinogenic risks at mines containing heavy rare earth elements in Longnan county. Pb and As are the primary contributors to non-carcinogenic risks, and As is the main contributor to carcinogenic risks because of its low oral reference dose and high oral slope factor. Because As-rich materials (e.g., arsenic-adsorbing clay zones and chernovite-(Y)) are exposed in fully weathered layers, and the formed suspended particulate matter is transported into the atmosphere at heavy rare earth mineral sites in Longnan county, As poses both carcinogenic and non-carcinogenic risks to children. PTEs are primarily transmitted to surrounding areas through fine particulate matter. Vegetation recovery plays a crucial role in controlling the migration of suspended particulate matter and inhibiting the outward movement of PTEs from mines through atmospheric transmission. Therefore, it is necessary to carry out ecological restoration and restore vegetation in mining areas, for inhibiting the migration of pollutants in mining areas, and reducing the risk to children, especially those exposed to As. Our results provide a deep understanding of the pollution in and around mining areas under the influence of atmospheric deposition, and provide support for pollution prevention.

Author Contributions

J.W.: conceptualization, methodology, data curation, writing—original draft; S.L.: conceptualization, writing—review and editing, supervision, project administration, funding acquisition; T.C.: formal analysis; G.Y.: supervision; M.X.: investigation, resources; Y.H.: investigation, formal analysis; Q.S.: supervision; C.M.: data curation, visualization; Q.X.: conceptualization, writing—review and editing, supervision. All authors have read and agreed to the published version of the manuscript.

Funding

This research was funded by the project of China Geological Survey Study on National Comprehensive Survey and Evaluation of Mining Geological Environment, grant number DD20190703, the project of China Geological Survey Study on Typical Regional Health Geological Survey, grant number DD20230118, and the National Natural Science Foundation of China, grant number 42177061.

Institutional Review Board Statement

Not applicable.

Informed Consent Statement

Not applicable.

Data Availability Statement

The data that support the findings of this study are available on request from the corresponding author S. Liu. The data are not publicly available due to them containing information that could compromise rese arch participant privacy.

Acknowledgments

The authors greatly appreciates the helpful suggestions provided by the editors and reviewers, which have greatly improved the quality of the manuscript.

Conflicts of Interest

The authors declare that they have no conflicts of interest.

References

  1. Bao, Z.; Zhao, Z. Geochemistry of mineralization with exchangeable REY in the weathering crusts of granitic rocks in South China. Ore Geol. Rev. 2008, 33, 519–535. [Google Scholar] [CrossRef]
  2. Feng, W.; Guo, Z.; Peng, C.; Xiao, X.; Shi, L.; Zeng, P.; Ran, H.; Xue, Q. Atmospheric bulk deposition of heavy metal(loid)s in central south China: Fluxes, influencing factors and implication for paddy soils. J. Hazard. Mater. 2019, 371, 634–642. [Google Scholar] [CrossRef] [PubMed]
  3. Li, H.; Xu, F.; Li, Q. Remote sensing monitoring of land damage and restoration in rare earth mining areas in 6 counties in southern Jiangxi based on multisource sequential images. J. Environ. Manag. 2020, 267, 110653. [Google Scholar]
  4. Liu, J.H.; Chen, L.K.; Liu, C.Y.; Qiu, L.R.; He, S. Pb speciation in rare earth minerals and use of entropy and fuzzy clustering methods to assess the migration capacity of Pb during mining activities. Ecotox. Environ. Saf. 2018, 165, 334–342. [Google Scholar] [CrossRef]
  5. Guo, G.; Zhang, D.; Wang, Y. Characteristics of heavy metals in size-fractionated atmospheric particulate matters and associated health risk assessment based on the respiratory deposition. Environ. Geochem. Health 2021, 43, 285–299. [Google Scholar] [CrossRef]
  6. Castillo, S.; de la Rosa, J.D.; Sánchez De La Campa, A.M.; González-Castanedo, Y.; Fernández-Caliani, J.C.; Gonzalez, I.; Romero, A. Contribution of mine wastes to atmospheric metal deposition in the surrounding area of an abandoned heavily polluted mining district (Rio Tinto mines, Spain). Sci. Total Environ. 2013, 449, 363–372. [Google Scholar] [CrossRef] [PubMed]
  7. Zhang, Y.; Zhang, S.; Zhu, F.; Wang, A.; Dai, H.; Cheng, S.; Wang, J.; Tang, L. Atmospheric heavy metal deposition in agro-ecosystems in China. Environ. Sci. Pollut. Res. 2018, 25, 5822–5831. [Google Scholar] [CrossRef]
  8. Braune, B.M.; Outridge, P.M.; Fisk, A.T.; Muir, D.C.G.; Helm, P.A.; Hobbs, K.; Hoekstra, P.F.; Kuzyk, Z.A.; Kwan, M.; Letcher, R.J.; et al. Persistent organic pollutants and mercury in marine biota of the Canadian Arctic: An overview of spatial and temporal trends. Sci. Total Environ. 2005, 351–352, 4–56. [Google Scholar] [CrossRef] [PubMed]
  9. Wang, J.; Zhang, X.; Yang, Q.; Zhang, K.; Zheng, Y.; Zhou, G. Pollution characteristics of atmospheric dustfall and heavy metals in a typical inland heavy industry city in China. J. Environ. Sci.-China 2018, 71, 283–291. [Google Scholar] [CrossRef]
  10. Wong, C.S.C.; Li, X.D.; Zhang, G.; Qi, S.H.; Peng, X.Z. Atmospheric deposition of heavy metals in the Pearl River Delta, China. Atmos. Environ. 2003, 37, 767–776. [Google Scholar] [CrossRef]
  11. Qiao, J.; Tang, J.; Xue, Q. Study on Pb release by several new lixiviants in weathered crust elution-deposited rare earth ore leaching process: Behavior and mechanism. Ecotox. Environ. Saf. 2020, 190, 110138. [Google Scholar] [CrossRef] [PubMed]
  12. Siddiqui, A.U.; Jain, M.K.; Masto, R.E. Distribution of some potentially toxic elements in the soils of the Jharia Coalfield: A probabilistic approach for source identification and risk assessment. Land Degrad. Dev. 2022, 33, 333–345. [Google Scholar] [CrossRef]
  13. Li, L.; Zhang, B.; Jiang, B.; Zhao, Y.; Qian, G.; Hu, X. Potentially toxic elements in weathered waste-rocks of Fushun western opencast mine: Distribution, source identification, and contamination assessment. Environ. Geochem. Health 2021, 44, 1813–1826. [Google Scholar] [CrossRef] [PubMed]
  14. Chen, L.; Zhou, S.; Wu, S.; Wang, C.; He, D. Concentration, fluxes, risks, and sources of heavy metals in atmospheric deposition in the Lihe River watershed, Taihu region, eastern China. Environ. Pollut. 2019, 255, 113301. [Google Scholar] [CrossRef] [PubMed]
  15. Tian, S.; Liang, T.; Li, K.; Wang, L. Source and path identification of metals pollution in a mining area by PMF and rare earth element patterns in road dust. Sci. Total Environ. 2018, 633, 958–966. [Google Scholar] [CrossRef]
  16. Haghnazar, H.; Belmont, P.; Johannesson, K.H.; Aghayani, E.; Mehraein, M. Human-induced pollution and toxicity of river sediment by potentially toxic elements (PTEs) and accumulation in a paddy soil-rice system: A comprehensive watershed-scale assessment. Chemosphere 2023, 311, 136842. [Google Scholar] [CrossRef]
  17. Li, Y.; Chen, H.; Song, L.; Wu, J.; Sun, W.; Teng, Y. Effects on microbiomes and resistomes and the source-specific ecological risks of heavy metals in the sediments of an urban river. J. Hazard. Mater. 2021, 409, 124472. [Google Scholar] [CrossRef]
  18. Exposure Assessment Tools by Media–Soil and Dust; Office of Solid Waste and Emergency Response: Washington, DC, USA, 2022.
  19. Guo, G.; Wang, Y.; Zhang, D.; Li, K.; Lei, M. Human health risk apportionment from potential sources of heavy metals in agricultural soils and associated uncertainty analysis. Environ. Geochem. Health 2023, 45, 881–897. [Google Scholar] [CrossRef]
  20. Ivaneev, A.I.; Brzhezinskiy, A.S.; Karandashev, V.K.; Ermolin, M.S.; Fedotov, P.S. Assessment of sources, environmental, ecological, and health risks of potentially toxic elements in urban dust of Moscow megacity, Russia. Chemosphere 2023, 321, 138142. [Google Scholar] [CrossRef]
  21. Xu, J.; Gui, H.; Chen, J.; Li, C.; Li, Y.; Zhao, C.; Guo, Y. A combined model to quantitatively assess human health risk from different sources of heavy metals in soils around coal waste pile. Hum. Ecol. Risk Assess. Int. J. 2021, 27, 2235–2253. [Google Scholar] [CrossRef]
  22. Li, M.Y.H.; Zhou, M.; Williams-Jones, A.E. The Genesis of Regolith-Hosted Heavy Rare Earth Element Deposits: Insights from the World-Class Zudong Deposit in Jiangxi Province, South China. Econ. Geol. 2019, 114, 541–568. [Google Scholar] [CrossRef]
  23. Tian, J.; Tang, X.; Yin, J.; Chen, J.; Luo, X.; Rao, G. Enhanced Leachability of a Lean Weathered Crust Elution-Deposited Rare-Earth Ore: Effects of Sesbania Gum Filter-Aid Reagent. Metall. Mater. Trans. B 2013, 44, 1070–1077. [Google Scholar] [CrossRef]
  24. Bockheim, J.G. Classification and development of shallow soils (<50 cm) in the USA. Geoderma Reg. 2015, 6, 31–39. [Google Scholar]
  25. DZ/T 0295-2016; Specification of Land Quality Geochemical Assessment. Ministry of Land and Resources of the People’s Republic of China: Beijing, China, 2016.
  26. Gutman, G.; Ignatov, A. The derivation of the green vegetation fraction from NOAA/AVHRR data for use in numerical weather prediction models. Int. J. Remote Sens. 1998, 19, 1533–1543. [Google Scholar] [CrossRef]
  27. Sun, X.; Liu, S.; Jiang, J.; Bai, X.; Chen, Y.; Zhu, C.; Guo, W. Coordination inversion methods for vegetation cover of winter wheat by multi-source satellite images. Trans. Chin. Soc. Agric. Eng. (Trans. CSAE) 2017, 33, 161–167. [Google Scholar]
  28. Yan, Y.; Liu, H.; Bai, X.; Zhang, W.; Wang, S.; Luo, J.; Cao, Y. Exploring and attributing change to fractional vegetation coverage in the middle and lower reaches of Hanjiang River Basin, China. Environ. Monit. Assess. 2022, 195, 131. [Google Scholar] [CrossRef] [PubMed]
  29. Yan, L.; Franco, A.; Elio, P. Health risk assessment via ingestion and inhalation of soil PTE of an urban area. Chemosphere 2021, 281, 130964. [Google Scholar] [CrossRef] [PubMed]
  30. Regional Screening Levels (RSLs)—Equations; Office of Solid Waste and Emergency Response: Washington, DC, USA, 2022.
  31. Regional Screening Levels (RSLs)—User’s Guide; Office of Solid Waste and Emergency Response: Washington, DC, USA, 2022.
  32. Regional Screening Level (RSL) Summary Table; Office of Solid Waste and Emergency Response: Washington, DC, USA, 2022.
  33. Lu, X.; Wu, X.; Wang, Y.; Chen, H.; Gao, P.; Fu, Y. Risk assessment of toxic metals in street dust from a medium-sized industrial city of China. Ecotox. Environ. Saf. 2014, 106, 154–163. [Google Scholar] [CrossRef]
  34. Annual Average Value of the Concentration of Six Pollutants by County (City, District) in Jiangxi Province in 2020, 2021. Available online: http://sthjt.jiangxi.gov.cn/art/2021/3/12/art_42079_3315206.html (accessed on 1 March 2024).
  35. Zhong, C.; Yang, Z.; Jiang, W.; Hu, B.; Hou, Q.; Yu, T.; Li, J. Ecological geochemical assessment and source identification of trace elements in atmospheric deposition of an emerging industrial area: Beibu Gulf economic zone. Sci. Total Environ. 2016, 573, 1519–1526. [Google Scholar] [CrossRef]
  36. Xia, X.; Chen, X.; Liu, R.; Liu, H. Heavy metals in urban soils with various types of land use in Beijing, China. J. Hazard. Mater. 2011, 186, 2043–2050. [Google Scholar] [CrossRef]
  37. Yuan, G.L.; Sun, T.H.; Han, P.; Li, J.; Lang, X.X. Source identification and ecological risk assessment of heavy metals in topsoil using environmental geochemical mapping: Typical urban renewal area in Beijing, China. J. Geochem. Explor. 2014, 136, 40–47. [Google Scholar] [CrossRef]
  38. Huang, S.; Tu, J.; Liu, H.; Hua, M.; Liao, Q.; Feng, J.; Weng, Z.; Huang, G. Multivariate analysis of trace element concentrations in atmospheric deposition in the Yangtze River Delta, East China. Atmos. Environ. 2009, 43, 5781–5790. [Google Scholar] [CrossRef]
  39. Xi, X.; Hou, Q.; Yang, Z.; Ye, J.; Yu, T.; Xia, X.; Cheng, H.; Zhou, G.; Yao, L. Big data based studies of the variation features of Chinese soil’ s background value versus reference value: A paper written on the occasion of Soil Geochemical Parameters of China’ s publication. Geophys. Geochem. Explor. 2020, 45, 1095–1108. [Google Scholar]
  40. Wu, H.; Shi, C.; Zhang, Y.; Zhao, T.; Hu, P.; Liu, Y.; Chen, T. Characteristics and Source Apportionment of Dustfall Pollution in the Coal Mine Area and Surrounding Areas of Wuhai City in Spring. Environ. Sci. 2020, 41, 1167–1175. [Google Scholar]
  41. Kai, J.; Wang, C.; Niu, Y.; Li, C.; Zuo, Z. Distribution characteristics and source analysis of atmospheric fallout elements in Yinchuan City. Environ. Sci. Technol. 2020, 43, 96–103. [Google Scholar]
  42. Weerasundara, L.; Magana-Arachchi, D.N.; Ziyath, A.M.; Goonetilleke, A.; Vithanage, M. Health risk assessment of heavy metals in atmospheric deposition in a congested city environment in a developing country: Kandy City, Sri Lanka. J. Environ. Manag. 2018, 220, 198–206. [Google Scholar] [CrossRef] [PubMed]
  43. Shi, G.; Chen, Z.; Teng, J.; Bi, C.; Zhou, D.; Sun, C.; Li, Y.; Xu, S. Fluxes, variability and sources of cadmium, lead, arsenic and mercury in dry atmospheric depositions in urban, suburban and rural areas. Environ. Res. 2012, 113, 28–32. [Google Scholar] [CrossRef] [PubMed]
  44. Li, W.; Zuo, Y.; Wang, L.; Wan, X.; Yang, J.; Liang, T.; Song, H.; Weihrauch, C.; Rinklebe, J. Abundance, spatial variation, and sources of rare earth elements in soils around ion-adsorbed rare earth mining areas. Environ. Pollut. 2022, 313, 120099. [Google Scholar] [CrossRef] [PubMed]
  45. Jacob, C. Statistical Power Analysis for the Behavioral Sciences; Lawrence Erlbaum Associates: Mahwah, NJ, USA, 1988. [Google Scholar]
  46. Corona Sánchez, J.E.; González Chávez, M.D.C.A.; Carrillo González, R.; Scheckel, K.; Tapia Maruri, D.; García Cue, J.L. Metal(loid) bioaccessibility of atmospheric particulate matter from mine tailings at Zimapan, Mexico. Environ. Sci. Pollut. Res. 2021, 28, 19458–19472. [Google Scholar] [CrossRef]
  47. Ao, M.; Qiu, G.; Zhang, C.; Xu, X.; Zhao, L.; Feng, X.; Qin, S.; Meng, B. Atmospheric deposition of antimony in a typical mercury-antimony mining area, Shaanxi Province, Southwest China. Environ. Pollut. 2019, 245, 173–182. [Google Scholar] [CrossRef]
  48. Smedley, P.L.; Kinniburgh, D.G. A review of the source, behaviour and distribution of arsenic in natural waters. Appl. Geochem. 2002, 17, 517–568. [Google Scholar] [CrossRef]
  49. Borst, A.M.; Smith, M.P.; Finch, A.A.; Estrade, G.; Villanova-De-Benavent, C.; Nason, P.; Marquis, E.; Horsburgh, N.J.; Goodenough, K.M.; Xu, C.; et al. Adsorption of rare earth elements in regolith-hosted clay deposits. Nat. Commun. 2020, 11, 4386. [Google Scholar] [CrossRef] [PubMed]
Figure 1. (a) Overview of the study area (Ganzhou city, China) including sampling location, Fractional Vegetation Cover (FVC), and wind rose diagram. (b) Shows the places of atmospheric deposition samples in typical IAREEMs. (c) Shows the landform and vegetation of ionic rare earth mines. (d) Shows the collection methods of atmospheric deposition. (e) Shows precipitation and wind speed.
Applsci 14 03585 g001
Figure 2. The regional distribution of seven potentially toxic elements (PTEs) in atmospheric deposition. Each dot in the legend symbolizes a sampling site. The color of each dot categorizes PTE concentrations into five distinct groups, based on quartile divisions.
Applsci 14 03585 g002
Figure 3. Non-cancer Hazard Quotients (HQ) and Hazard Indexes (HI) of PTEs via ingestion and inhalation exposure pathways calculated for adults (ad) and for children (eh). In detail: (a) HQ of each element through ingestion; (b) HQ of each element through inhalation; (c) HI of each element through ingestion and inhalation; (d) HQ and HI of combined elements through ingestion and inhalation. Figure 3e–h is similar to Figure 3a–d. The red dotted line reflects the safety threshold for potential non-carcinogenic risks. Dark solid circles represent outliers.
Applsci 14 03585 g003
Figure 4. Carcinogenic Risk (CR) of PTEs via ingestion and inhalation exposure pathways calculated for adults (ad) and for children (eh). In detail: (a) CR of each element through ingestion; (b) CR of each element through inhalation; (c) CR of each element through ingestion and inhalation; (d) TCR of combined elements through ingestion and inhalation. Figure 4e–h is similar to Figure 4a–d. The red dotted line reflects the safety threshold for carcinogenic risk. Dark solid circles represent outliers.
Applsci 14 03585 g004
Figure 5. (a) Correlation for the concentration of PTEs in atmospheric deposition (n = 25). × indicates no significant correlation. (b) Cluster for the concentration of PTEs in atmospheric deposition (n = 25). Distance reflects the degree of correlation between different elements.
Applsci 14 03585 g005
Figure 6. (a) Boxplot of atmospheric deposition fluxes for PTEs. The box reflects the 25th and 75th quantiles. Whiskers are the maximum and minimum values within 1.5 times the interquartile range. The dark line inside the box represents the median. Dark solid circles outside the whisker are outliers. (b) The correlation of Fractional Vegetation Cover with suspended particulate matter collected from atmospheric deposition. The remote sensing images used for the FVC calculations and the calculation process are shown in Table 1.
Applsci 14 03585 g006
Figure 7. This figure depicts the regional distribution of seven potentially toxic elements (PTEs) in atmospheric deposition. The dots in the legend indicate the locations of sampling sites. The color coding of each dot corresponds to PTE fluxes, which are classified into five tiers based on quartile analysis.
Applsci 14 03585 g007
Figure 8. (a) Backscattered electron images of HREE minerals in the regolith. Yellow arrows indicate chernovite-(Y). (b) Chemical composite of chernovite-(Y) of four points in Figure 8a (yellow arrow). The bar chart represents the mean. Whiskers outside the bar chart are the maximum and minimum values within 1.5 times the interquartile range.
Applsci 14 03585 g008
Table 1. Detection limits of dry and wet deposition of atmosphere.
ElementTypeUnitPbCrCdNiCuMoAs
Limit Drymg kg−10.110.0110.20.010.02
Wetmg/L0.010.0040.050.030.050.0010.05
Table 2. The information of Landsat 8 remote sensing images.
SensorDatePath/RawResolution (m)
Landsat OLI22 October 2019 121/4130
Landsat OLI22 October 2019 121/4230
Landsat OLI20 September 2019 121/4330
Landsat OLI14 November 2019 122/4230
Landsat OLI18 February 2020122/4330
Table 3. Relative bioavailability factor, oral reference dose, oral slope factor, inhalation reference concentration, and inhalation unit risk values for each potential toxic element.
ElementAsCdCrCuMoNiPbReference
Relative bioavailability factor (RBA) (unitless)0.6111111[31]
Oral reference dose (RfDo) (mg kg−1 day−1)0.00030.0010.0030.040.0050.020.0014[32]
Inhalation reference concentration (RFC) (mg m−3)0.0000150.000010.00010.040.0020.000090.035[32]
Oral slope factor (CSFo) (mg kg−1 day−1)−11.5 0.5 0.0085[32]
Inhalation unit risk (IUR) (μg m−3)−10.00430.00180.084 0.0003 [32]
Table 4. Variables with their descriptions and reference values used for health risk assessment of PTEs in atmospheric deposition.
ParametersDescriptionUnitsValuesReference
Adult
(>18 Years Old)
Child
(1~6 Years Old)
CiConcentration of PTEmg/kg Site-specific
IRIntake ratiomg/day100200USDOE (2011)
EFExposure frequencyday/year180180[33]
EDExposure durationyear246[31]
BWBody weightkg7015[31]
ATAverage timeday365 × ED (non-carcinogen)//365 × 70 (carcinogen)[31]
InhRInhalation ratem3/day207.5[29]
PM10Inhalable particulate matterkg/m33.525 × 10−83.525 × 10⁻⁸[34]
Table 5. Statistical analysis of trace element concentration of atmospheric deposition.
Element *MeanMinMaxMedianStd 1SkewCV 2Reference 3
As23.64 3.18 251.87 8.15 52.39 3.94 2.22 70.00
Cd2.85 0.45 13.30 2.35 2.46 3.36 0.86 0.13
Cr58.24 10.31303.11 45.03 55.84 3.82 0.96 78.00
Cu76.68 26.08319.85 60.54 71.44 2.75 0.93 26.00
Mo5.67 1.09 18.96 4.53 4.47 1.99 0.79 0.73
Ni26.43 5.37 143.39 20.69 26.58 3.90 1.01 33.00
Pb121.04 32.40 654.10 73.88 136.23 3.27 1.13 26.00
* Units are mg kg−1. 1 Standard deviation, 2 coefficient of variation, 3 the data in references [39].
Table 6. Comparison of atmospheric deposition (mg kg−1) of metals for concentration between the REE and other regions.
LocationPeriodLanduseAsCdCrCuMoNiPbReference
Ganzhou, China2019~2020Rare earth mine23.642.8558.2476.685.6726.43121.04This study
Wuhai, China2018~2019Coal mine408.781.9745.9727.40 25.4138.93[40]
Shanghai, China2011~2012Rural region47.601.53 150.60[43]
Taihu lake, China2016~2018Woodland 9.4271.60139.60 45.98223.60[14]
Yinchuang, China2019~2020Urban28.000.7482.6046.502.7235.1048.80[41]
Kandy, Sri Lanka2017~2018Urban10.1268.60103.00123.60 87.60234.40[42]
Table 7. Minerals in the regolith.
Mineral NameChemical Formulawt%
Kaolinite/Illite Al4[Si4O10](OH)8/KAl2[(SiAl)4O10]·(OH)2·nH2O 46.0072
Quartz SiO245.8911
K-feldspar K[AlSi3O8] 5.0466
Muscovite Al2K2O6Si 2.4201
Limonite Fe2O3·nH2O 0.4462
Albite NaAlSi3O80.0559
Montmorillonite Al2Si2O5·(OH)40.0221
Zircon ZrSiO40.0196
Chernovite-(Y) Y[AsO4] 0.0159
Ilmenite FeTiO30.0092
Xenotime-(Y)YPO40.0030
Chlorite (Mg,Fe,Al)6(Si,Al)4O10(OH)80.0026
Euxenite-group mineral(Y,Ca)(Nb,Ta,Ti,Fe)2O60.0023
Calcite CaCO30.0022
Fergusonite-group mineralYNbO40.0013
Coronadite Pb(Mn4+,Mn2+)8O160.0013
Dolomite CaMg(CO3)20.0013
Thorite Th[SiO4] 0.0006
Monazite CePO40.0003
Total 99.9486
Disclaimer/Publisher’s Note: The statements, opinions and data contained in all publications are solely those of the individual author(s) and contributor(s) and not of MDPI and/or the editor(s). MDPI and/or the editor(s) disclaim responsibility for any injury to people or property resulting from any ideas, methods, instructions or products referred to in the content.

